
 Abstract
- Several parameters combine to govern the nature of agent
interactions in evolutionary social simulations. Previous work has
suggested that these parameters may have complex interplay that is
obscured when they are not analyzed separately. Here we focus
specifically on how three population-level parameters, which govern
agent interactions, affect levels of altruism in a population.
Specifically we vary how frequently agents interact in a generation,
how far along a network they may interact, and the size of the
population. We show that the frequency with which an agent interacts
with its neighbors during a generation has a strong effect on levels of
evolved altruism – provided that those pairings are stochastic. When
agents interact equally with all of their neighbors, regardless of how
often, minimal levels of altruism evolve. We further report a curious
harmonic signature in the level of altruism resulting from the
interplay of the benefit-cost ratio of an altruistic act and the number
of agent interactions per generation. While the level of altruism is
generally an increasing function of the number of pairings per
generation, at each instance where pairings equals a multiple of the
benefit-cost ratio a sharp discontinuity occurs, precipitating a drop
onto a lower-value function. We explore the nature of these
discontinuities by examining the temporal dynamics and spatial
configuration of agents. Finally, we show that rules for the evolution
of cooperation that are based on network density may be inadvertently
missing effects that are due to the frequency of interactions and
whether those interactions are symmetrical among neighbors.
- Keywords:
- Tags, Thresholds, Altruism, Evolution, Cooperation, Social Harmonics
Introduction
& Background
- 1.1
- Computer simulated societies have long been used to
understand the emergence of group-level phenomena such as cooperation,
altruism, segregation, and coordination. It has been well established
that embedding simulated agents in a structured society, either
spatially or more generally in a network, can lead to very different
outcomes than when the population is well mixed (Boyd
& Richerson 2002; Hauert
2001; Jun & Sethi
2007; Németh &
Takács 2007; Nowak
& May 1992; Ohtsuki
et al. 2006; Perc et al.
2013). This added structure has proven to be an important
addition to earlier social simulations and has led many authors to
conclude that the localization of interactions resulting from
structured societies is a key to the emergence of cooperation (Flache 2002; Ohtsuki et al. 2006; Shutters 2012; Takács et al. 2008; Wilson & Wilson 2007).
- 1.2
- A small number of population-level parameters often govern
how agents interact in simulations with structured societies. Some of
these parameters include population size, neighborhood size for both
interactions and mating, and number of agent interactions per
generation. Yet the complex interplay between these structure-related
parameters is poorly understood. Indeed there continues to be
disagreement regarding the effect that network density has on
cooperative outcomes. One body of research finds that when a population
is more densely connected the likelihood of cooperation increases (Marwell & Oliver 1993;
Opp & Gern 1993).
As Jun and Sethi (2007, p.
625) assert, "dense networks are more conducive to the evolution of
cooperation." On the other hand, recent research suggests the opposite,
demonstrating that denser networks inhibit cooperation in structured
populations (Flache 2002; Hauert & Doebeli 2004; Shutters 2012; Takács et al. 2008). This
ability of network density to both facilitate and inhibit cooperative
outcomes has been noted in informal networks, dynamic networks, and
especially in networks in which "deviant" cliques can emerge, which are
otherwise largely isolated from the larger population (Flache 1996; Flache & Macy 1996; Heckathorn 1996).
- 1.3
- In a recent study Shutters and Hales (2013) showed that parameters
governing how agents interact with one another had significant effects
on rates of altruism. These parameters included population size N,
neighborhood radius R, and pairings (or
interactions) per agent per generation P. Results
of their study showed that decreasing neighbor radius or increasing
population size led to higher donation rates. These parameters are
related in that they reduce the proportion of agents within the total
population with which a single agent is likely to interact. Thus,
restricting the number of an agent's potential partners had a positive
effect on levels of altruism, concurring with the predicted effects of
localization of interactions discussed in the previous paragraph. This
result also reinforces previous findings that increasing neighborhood
radius or group size can inhibit cooperative outcomes (Ifti et al. 2004; Olson 1965).
- 1.4
- Decreasing the third parameter in Shutters and Hales study,
pairings, also decreases the number of potential interaction partners.
However, the authors found that decreasing the number of pairings per
generation had a negative effect on altruism and thus appeared to
contradict the predictions of localized interactions. While the authors
speculated on possible reasons for this seeming contradiction, they did
not elaborate as the focus of their study was on cheater types.
- 1.5
- Here we implement the model of Shutters and Hales (2013) to perform a detailed parameter sweep of the three interaction-governing parameters N, R, and P. This simulation protocol, developed to study the evolution of altruistic behavior in structured societies, was based on an earlier simulation of Riolo et al (2001) that was subsequently modified by Roberts and Sherratt (2002) and Spector and Klein (2006). In each of these studies, a ring was used to structure societies and a parameter determined how far along that ring agents were able to interact. In the case of Riolo et al, agents could interact along the entirety of the ring making their system equivalent to a well-mixed society.
The
simulation model
- 2.1
- The present model consists of a population of N
agents arrayed in a ring. Every agent i is
surrounded by a neighborhood consisting of all other agents within R
links of i. Thus, every agent has 2R
neighbors.
- 2.2
- Each agent is represented by three strategy components. Two
of these components are real valued numbers: a tag t
? [0, 1] and a behavioral trait called a "tolerance threshold" T
? [-10-6, 8 ). Both tag and tolerance are
initially drawn randomly, with uniform distribution, from [0, 1]. Note
that the tolerance T may subsequently evolve beyond
its initialization range. The third component is a binary trait which
determines whether the agent is a cheater or not, the ramifications of
which are explained below.
- 2.3
- Prior to a new generation, the simulation's pseudo-random
number generator is initialized with the system time as a seed. In each
generation each agent i is paired with P
other agents chosen randomly with replacement from i's
neighborhood. Thus, every generation has a total of P
× N pairings. During each pairing the initiating
agent i determines whether to make a donation to a
recipient agent j. i donates to
j if their tags are sufficiently similar. Agent i
assesses similarity by comparing its own tag (ti)
with the tag of agent j (tj).
If the difference between the tags is less than or equal to i's
tolerance threshold of Ti
then a donation takes place from i to j.
Hence a donation occurs when |ti
- tj| = Ti.
If a donation does occur j's accumulated payoff
increases by the benefit of b and i's
payoff decreases by the cost of c. In results
presented here b > c. It
is important to note that since partners are chosen randomly with
replacement, when neighborhoods are small relative to P,
it becomes increasingly likely that a given neighbor will be chosen by
an agent multiple times during a generation.
- 2.4
- Donation therefore represents altruistic behavior because i
incurs a cost to benefit j. An agent with a high T
will donate to others holding a wide range of tag values but an agent
with a low T will only donate to those with very
similar tag values. In the extreme cases, an agent with T
= 1 will donate to all other agents whereas an agent with T
= 0 will donate only to those with tag values identical to its own. In
cases where an agent's T ? [-10-6,
0), the agent will not donate to any other agent.
- 2.5
- After each generation the accumulated costs and benefits
(net payoffs) of each agent is calculated and serves as the agent's
fitness f. Evolution is then implemented in the
form of a tournament selection process in which each agent i
compares its value of f to a randomly chosen
neighbor j. If fj
> fi, then i
copies j's traits – tag, tolerance, and cheater
status. But if fj < fi,
then i's strategy remains unchanged. i
and j are effectively competing to occupy i's
space in the next generation. If fj
= fi a coin toss is used to
determine which agent will have its traits copied into i's
position in the next generation. Thus, fitness is compared locally and
not globally, in accordance with the Darwinian notion that evolution is
driven by relative (local) fitness and not absolute (global) fitness.
- 2.6
- Mutation is applied to newly copied values with probability
m. Mutation of the tag involves its replacement
with a new random tag uniformly chosen from [0, 1]. Mutation of the
tolerance T is achieved by adding Gaussian noise to
the old value with mean 0, standard deviation 0.01. If mutation results
in T < -10-6, T
is reset to -10-6.
- 2.7
- The binary third trait noted above determines whether the
agent is a normal donating member of the society (trait = true) or a
cheater (trait = false). When an agent's trait is false (cheater) its
ability to donate is deactivated and its tolerance trait is ignored.
The motivation for this additional trait is described in (Shutters
& Hales 2013) and permits the presence of an
important
real-world participant in social systems – the social parasite, which
simply displays a suitable tag to altruistic donors and only collects
benefits. This binary trait can be reversed through mutation, at the
mutation rate m, allowing a resumption of
altruistic behavior (assuming the agent's tolerance is sufficiently
high). Every simulation is initialized so that all agents have this
binary trait turned on at the start. Hence, there are no cheaters at
the beginning of a simulation and cheaters can only arise through
mutation. Once present, cheaters may proliferate through mutation and
may be selected for during the reproduction routine.
- 2.8
- Unless otherwise stated, parameters are fixed in all
simulations such that the benefit conferred during an altruistic act b
= 1.0, cost to the altruistic donor c = 0.1,
mutation rate m = 0.01, number of generations per
simulation run g = 30,000, and number of
replications (independent simulation runs with a different initial
pseudo-random number seed) performed with each combination of
parameters = 100. During the final 1,000 generations of each
simulation, data were collected tabulating the percentage of
interactions that resulted in an altruistic act (donation rate). These
values were then averaged across all 100 replications of a parameter
set. Standard deviations were relatively small and are not presented
here.
- 2.9
- Three independent replications were implemented by different researchers using only pseudo code as a guide. The initial model was implemented in Java and subsequently replicated in NetLogo, the latter of which is freely available online at the OpenABM repository (see: https://www.openabm.org/model/4510/version/2/).
Results
and discussion 1: the complex interplay between N, R,
and P
- 3.1
- A sweep of parameters was conducted of the three variables N,
R, and P to test for their
effects on mean donation levels. Results are discussed for each of the
variables individually, keeping one of the other variables fixed and
varying the third variable.
Effects of population size (N)
- 3.2
- As population size increased, simulations produced higher
mean contribution rates. However, the effect diminished with increasing
population and, beyond a critical population size, there was little
change in donation rates ceteris paribus (Figure 1).
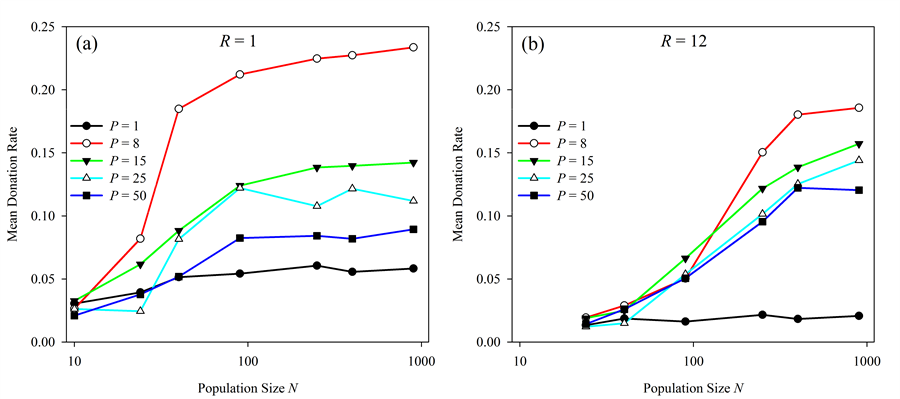
Figure 1. Effect of population size N on altruistic donation rates. Donation rates vs. population size are presented using a number of different pairing values P with (a) radius R = 1 and (b) radius R = 12. In general, donation rates increase with increasing population size but this effect diminishes as population continues to increase. Effects of neighborhood radius (R)
- 3.3
- At low values of P, increasing the
neighborhood radius R above 1 resulted in lower
donation rates. This is consistent with the findings of Ifti et al
(2004) who showed that
cooperation in a spatial prisoners dilemma
diminished with increasing neighborhood radius. However, with
increasing P, maximum donation rates begin to occur
at values of R between 1 and 5 (Figure 2). The value of P
at which this movement to an internal maximum occurs depends on the
population size, with larger populations shifting to an internal
maximum at lower values of P.
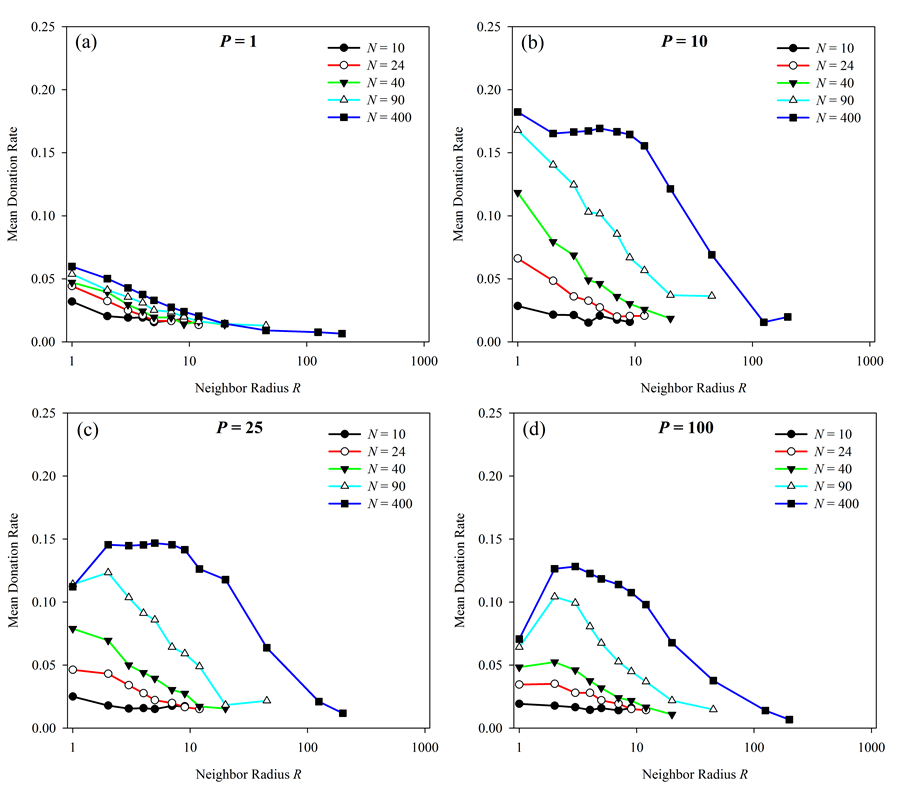
Figure 2. Effect of neighbor radius (R) on altruistic donation rates. Donation rates vs. neighborhood radius R are presented using a number of different population sizes (N) with pairings P fixed at four different values. At low values of P, donations are maximized when R = 1. At higher values of P, the optimal radius is greater than 1. Effect of pairings per generation (P)
- 3.4
- In contrast to the response of increasing population, the
response of donation rates to changes in pairings is richer and quite
perplexing. Though donation rates initially increase with increasing
pairings, rates make a sharp drop between P = 9 and
P = 10 (Figure 3).
Donation rates then increase slightly before another drop in the
neighborhood of P = 20.
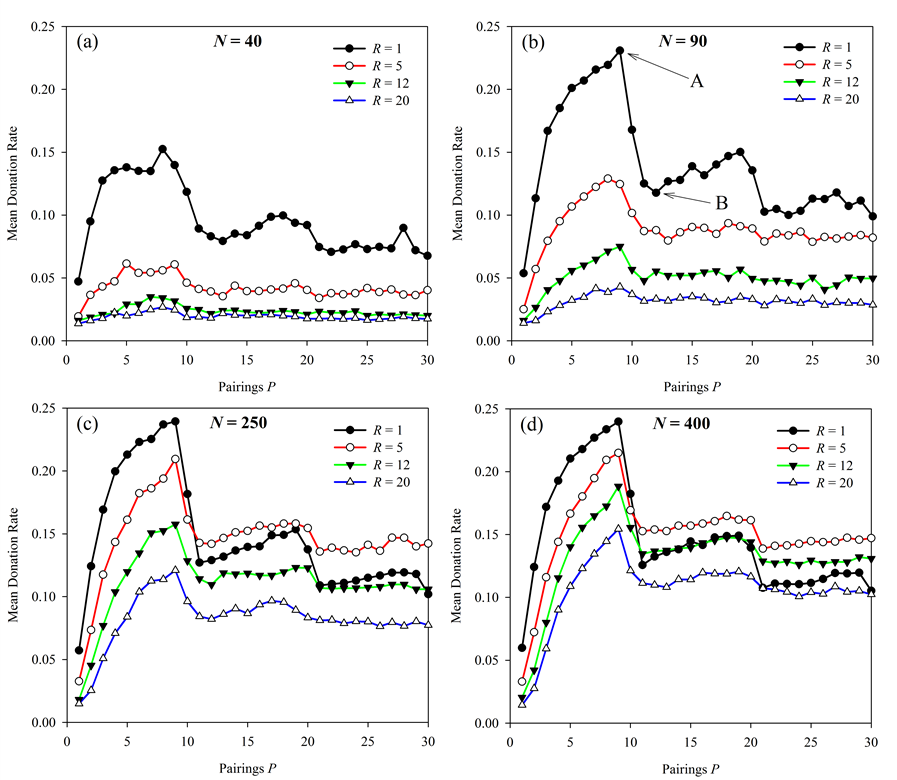
Figure 3. Effect of pairings per generation on altruistic donation rates. Results are presented for 4 different population sizes and at 4 different neighbor radii for each of those population sizes. The sharp drop in donations above P = 9 is more pronounced (though diminishing) with increasing population size. Points A and B in figure (b) are explored further below in Figure 4. - 3.5
- To better understand the temporal dynamics underlying the
results in Figure 3, donation
rate vs. generation is presented for two cases. Fixing parameters N
= 90 and R = 1, simulations were run at two
pairings values, P = 9 and P =
12, corresponding to points A and B in Figure 3b.
Results of these two simulations are presented in Figure 4 and give rise to several
interesting points. First, donation rates do not converge over time in
either simulation but appear to drift stochastically about a mean that
is dictated by the simulation's pairing parameter P.
Second, when P = 9, no generation had a donation
rate of 0, meaning that some altruism existed in every generation. When
P = 12, however, 118 of 1,000 generations had a
donation rate of 0. This finding contributes to an explanation of why
simulations with P = 9 evolved donation rates about
twice as high as those when P = 12. Yet it remains
to explain why lower donation rates are so much more prevalent at P
= 12, especially as donation rates increase as P
increases from 1 to 9.
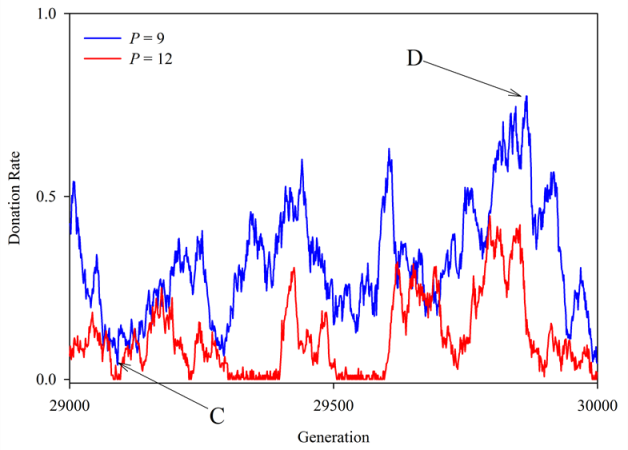
Figure 4. Donation rates observed across final 1,000 generations for two values of P. In both cases N = 90 and R = 1. The mean of each curve corresponds to a single simulation run of the 100 represented in points A and B in Figure 3b. Points C and D, both on the curve for P = 9, are explored further below in Figure 5. - 3.6
- To help explain the temporal differences in donation rates
shown in Figure 4, the tag
value of each agent in the two simulations presented in Figure 4 were tracked across all 1,000
observed generations. This allows us to plot an agent's tag versus the
agent's position in the network so that we may visually inspect the
clustering of trait values in a networked population. Results are
presented in Figure 5 for two
specific generations, selected because they were representative of
generations with high and low donation rates. These graphs correspond
to points C (generation 29,091) and D (generation 29,866) in Figure 4, which had donation rates of 0.04
and 0.77 respectively. Both points lie on the curve for P
= 9. Results reveal much higher clustering and uniformity of tag values
in the generation that experienced a high donation rate (Figure 5b). These results suggest that the
clustering of trait values is an important driver of altruism in these
simulations.
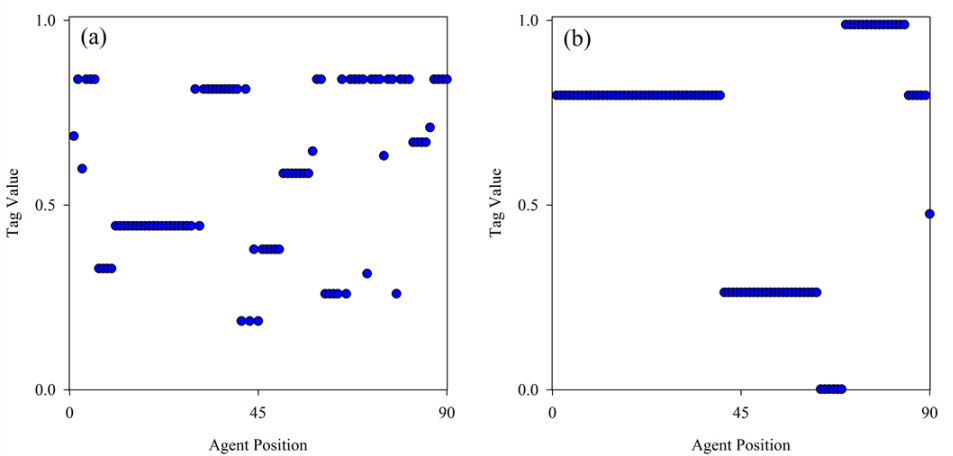
Figure 5. Spatial clustering of trait values in two different generations. Agent tag value versus the agent's position in the ring is shown for each of the two representative generations noted in Figure 4 on the curve for P = 9. Figure (a) corresponds to point C (donation rate = 0.04). Figure (b) corresponds to point D (donation rate = 0.77). The generation with the higher donation rate exhibits a much higher degree of local clustering of trait values. In both cases N = 90 and R = 1. - 3.7
- Two potential indicators of the degree of trait clustering
within the population are the number of unique trait values and the
largest group size of agents holding the same trait value. Accordingly,
the mean number of unique tag values and the size of the largest group
of any tag value were calculated across the 1,000 generations presented
in Figure 4. For each of the curves (P = 9 and P
= 12) the two measures of trait clustering were regressed against
donation rates to understand their effects on altruistic outcomes
(Table 1). While the size of
the largest tag group appeared to have no relation to donation rates,
the number of unique tags showed a discernible relationship to the
donation rate within a generation. In addition, this relationship
differed significantly between treatment with P = 9
and that with P = 12.
- 3.8
- In general, both simulations had higher donation rates
during generations containing a low number of unique tags. However, the
strength of this effect was nearly twice as strong when P
= 9 compared to P = 12 (see regression
coefficients, Table 1). This is intriguing since the only difference
between the two simulations was the number of pairings an agent
initiated during each generation. And while this helps to further
explain why mean donation rates overall were so much higher when P
= 9 versus P = 12, it still does not explain why
clustering was so much more prevalent under P = 9
or why the effect of this clustering was stronger.
Table 1: Comparison of two individual simulation runs, each using a different value for pairings (P), all other parameters equal. Mean results over the final 1,000 generations are shown (shown graphically in Figure 4). P = 9 P = 12 Percentage of generations having 0 donations 0.0% 11.8% Mean values over final 1,000 generations Donation rate 0.32 0.11 Number of unique tags 9.7 13.1 Size of largest tag group 34.7 26.4 Simple linear regression – donation rate vs. number of unique tags Coefficient -0.0253 -0.0149 R2 0.224 0.234 Note: In both cases R = 1, N = 90, and b/c = 10.
Results
and Discussion 2: The benefit to cost ratio and harmonic signature
- 4.1
- In all results thus far discussed the benefit and cost of
an altruistic act were kept fixed at b = 1 and c
= 0.1. Thus, a fixed benefit-cost ratio b/c
= 10 has been used throughout. However, we note that in Figure 3, when R
= 1 the sharp drops, or discontinuities, in donation rates with
increasing pairings occur consistently at P = 10
and again at P = 20. This was true regardless of
the population size or neighborhood radius. Realizing these values are
multiples of b/c we wished to
further explore the effects of b/c
and to see if varying the ratio would change the points of
discontinuity in donation rates. Therefore, keeping population size
fixed at N = 400 and neighborhood radius fixed at R
= 1, we ran a number of further simulations varying P
against different values for b/c. In
all cases, c = 0.1 and b was
varied to generate different values of b/c.
- 4.2
- Results shown in Figure 6a
are striking. Not only do discontinuities appear precisely when the
value of P is a multiple of b/c,
regardless of the value of b/c,
the curves for differing values of b/c
appear to overlay one another so that a fundamental set of curves,
consisting of discrete steps, would seem to predict all simulation
outcomes. This second effect is more pronounced when lines
corresponding to discontinuities have been removed (Figure 6b).
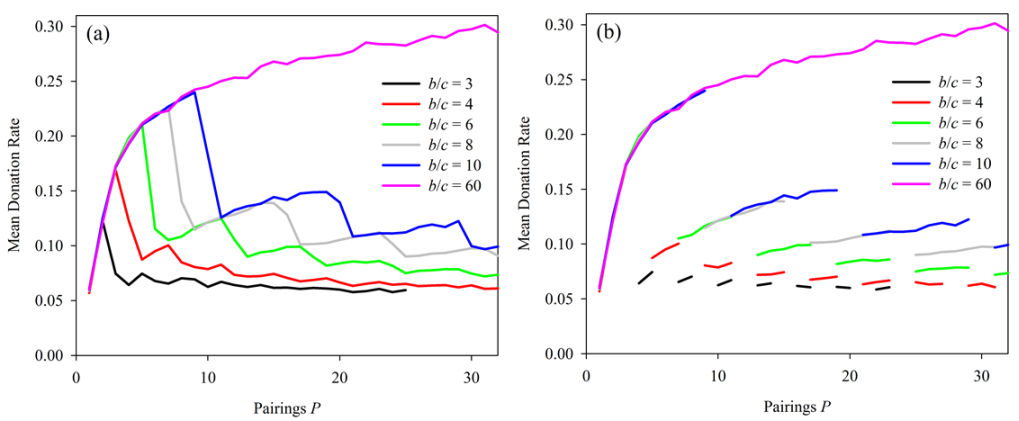
Figure 6. Effect of increased pairings at several values of benefit-cost ratio. With R = 1 and N = 400 a sharp drop, or discontinuity, in donations with increasing pairingsgenerally occurs when P = b/c. Discontinuities occurred at the same values of b/c when R = 5 (not shown). In (b), the segments corresponding to discontinutities in the donation repsonse have been removed to highlight the overlapping responses to different values of b/c. - 4.3
- To further highlight that the different response curves
under different values of b/c
are actually a single set of curves, we used the plots in Figure 6 to fit a set of curves, each
corresponding to a different multiple of b/c.
The resulting set is shown in Figure 7.
Curves B, C, D, and E are based on a simple logarithm of the form
f(x) = log(P + 1) / z (1) where z is an arbitrary tuning parameter[1]. Curve A is described by
f(x) = (log(P) / z)-1/2 (2) - 4.4
- In effect, these different curves are "activated" depending
on the value of simulation parameters P, b,
and c. Specifically, b and c
determine the active range of each curve, while P
determines which active range, and thus curve, to which simulation
outcomes will evolve. If a given curve is activated, the simulation's
mean donation rate is expected to fall on that curve. The range for P
over which each curve is active is determined as follows:
Curve A: P ? (0, b/c),
Curve B: P ? (b/c, 2b/c),
Curve C: P ? (2b/c, 3b/c),
Curve D: P ? (3b/c, 4b/c),
Curve E: P ? (4b/c, 5b/c)…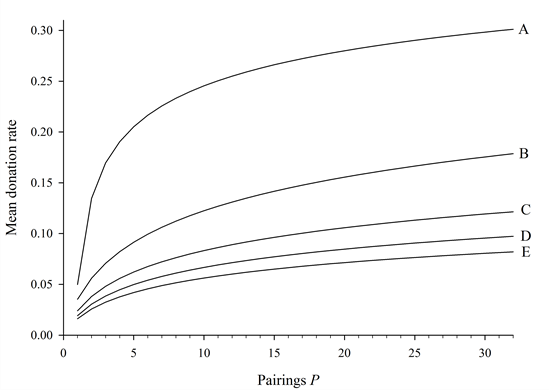
Figure 7. The set of stylized curves predicting any outcome given parameters P and b/c. This set correpsonds to other parameter fixed at R = 1, m = 0.01, and N = 400. - 4.5
- Actual simulation results using two different values of b/c
are superimposed on this set of curves to present examples of their
predictive power (Figure 8).
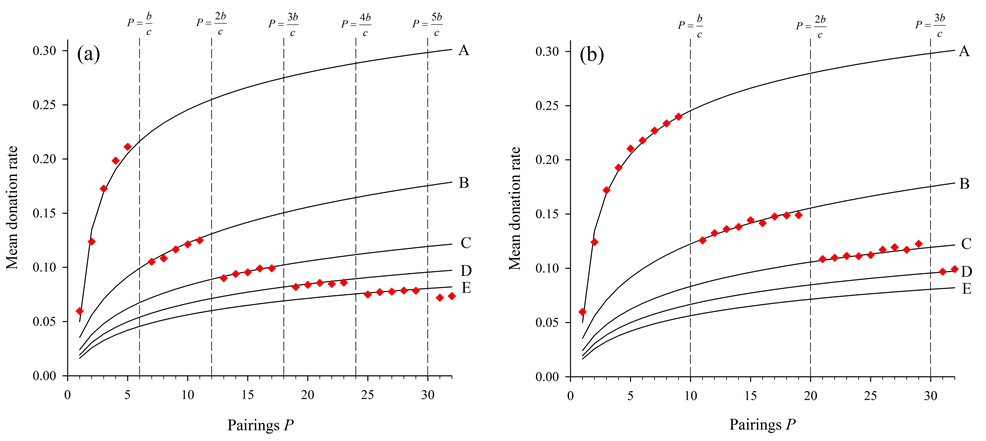
Figure 8. Two realizations of results overlaying the set of predictive curves. The two figures both use the set of predicted altruism response curves in Figure 7. The predicted discontinuities at points where P equals multiples of b/c are shown by vertical dashed lines for the cases where (a) b/c = 6 and (b) b/c = 10. - 4.6
- To assess the sensitivity of the transition point P
= b/c we analyzed points just
before and after the first transition point for P =
10. Using parameters P = 10, R
= 1, and N = 400, an additional 100 simulations
were run at b/c = 10 ± e
where e = 10-6. Even with
these minute deviations from the transition point, results corresponded
to the different curves as predicted in Figure 8b,
indicating that the transitions described above occur precisely at
multiples of b/c. Specifically,
with P = 10, mean donation rates were 0.240 when b/c
= 10.000006, 0.126 when b/c =
9.999999, and 0.182 when b/c =
10 exactly.
- 4.7
- However, the fact that a donation rate does occur precisely
when b/c = 10, and the fact that
its value is between the donation rates resulting from small deviations
above and below b/c = 10 (Figure
3b), indicates that it is
possible, and even probable, that what we have termed a discontinuity
is in fact a very sharp, yet continuous, transition between curves
shown in Figure 7, with an
inflection point at P = b/c.
The resolution of this question requires simulations with ever smaller
deviations from the transition point that were beyond the scope of our
simulation, and thus this question remains an important point to
address in future work.
Other social structures
- 4.8
- To remain consistent with the models on which this study is
based (see Introduction), we have used a ring to structure the
societies in our simulations. However, it is important to consider how
our results with a ring structure may be manifest for other network
types, particularly the more complex networks found in real societies.
Thus, in addition to the ring configuration used thus far in this
study, we also implemented our simulation protocol on other commonly
studied configurations. With R = 1 and k
representing the network's average nodal degree, these other structures
include a regular lattice (k = 4), regular lattice (k
= 8), random regular network (k = 4), and scale-free
network (k = 4). Scale-free networks were generated
through growth by preferential attachment (Barabási
& Albert 1999), starting with a 3-node complete
network and adding new nodes via two new links. Though we did not
analyze results from these additional configurations to the extent that
we did with rings (k = 2), our limited results show
that the discontinuities in donation rate when P
equals a multiple of b/c are
robust to configuration type. Results for various social structures,
with parameters N = 400, R = 1,
b/c = 8, are shown in Figure 9. On all population structures,
donation rates rise with increasing P until just
before P = b/c,
drop, rise again until just before P = 2b/c,
and then drop once more. These results suggest that there exists a
fundamental set of predictive curves, similar to those in Figure 7, for many social structures,
including those with variance in individual nodal degrees (i.e.
scale-free networks). The study of this phenomenon on more complex
networks thus presents a promising future direction for this work.
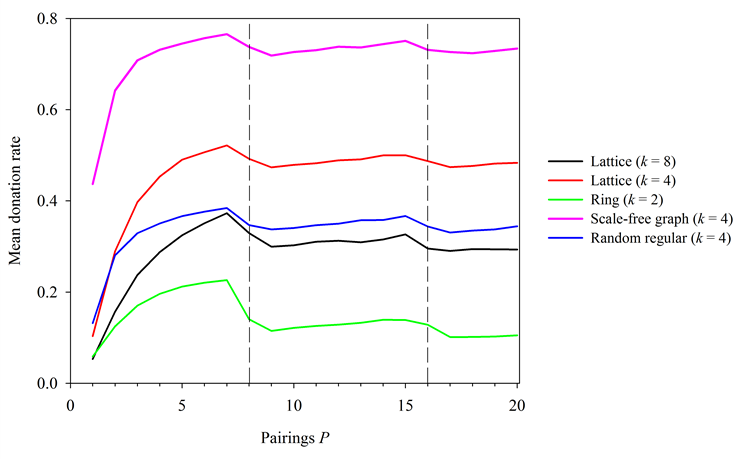
Figure 9. Simulation results on a variety of social structures. In all cases, N = 400, R = 1, b/c = 8. Dashed lines correspond to points where P equals a multiple of b/c.
Relation
to similar findings
- 5.1
- The sharp drop in donations with increasing pairings that
occurs when P = b/c
is related to a previously suggested rule for the evolution of
cooperation. Ohtsuki et al. (2006)
proposed that in structured societies, cooperation will evolve when k
< b/c, where k
= the average nodal degree of agents embedded in a network. Here, we
show that maximum levels of altruism occur when P
< b/c as P
? b/c -.
However, if a simulation is constructed in such a way that each agent
interacts with every one of its neighbors exactly once, then our
parameter pairings and the average nodal degree are equivalent so that P
= k. In such cases, it is impossible to determine
whether the condition k < b/c
or the condition P < b/c
is the primary rule for the evolution of cooperative
behavior. Thus simulations or experiments (e.g. Rand
et al. 2014) that are structured so that every agent
interacts exactly n times per generation with every
one of its neighbors – what we will refer to here as symmetrical
pairing – may inadvertantly obscure the effects of pairings. It is
therefore important to disentangle the relative imporance of these
conditions by parsing the individual effects of k
and P on altruisitic outcomes.
- 5.2
- In attempting to separate these effects, note that the
degree of an agent in our ring structure is determined solely by the
neighborhood radius such that k = 2R.
Thus, results presented in Figure 2
on the effects of varying R with other parameters
held constant, also show the effects of varying k.
In Figure 2, b/c
= 10 and therefore if Ohtsuki's rule is manifest, there should be an
impact when k = 10 (R = 5). As
Figure 2 reveals, the role of k
is quite complicated. When pairings P are low or
population size N is low, altruism is maximized
when k = 2 (and R = 1), its
mimimum possible value. In these cases altruism decreases monotonically
with increasing k and there is no noticible effect
at the point where k = b/c.
However, at higher values of P or N
(or both), results are more complicated and not easily interpreted.
Altruism does appear to reach maximal levels in the vicinity of k
= b/c when N
= 400 and P = 10.
- 5.3
- For a possible explanation of this finding, recall that our
pairings are stochastic and thus interactions are heterogeneous. Yet
this heterogenenity diminishes as the number of pairings increases or
when the population becomes larger – the same conditions under which k
begins to affect rates of altruism. Thus parameters that shift the
nature of interactions from highly heterogenous to highly symmetrical
appear to moderate the efficacy of the k < b/c
rule. As Figure 6 shows, high
values of P tend to reduce donation rates in the
non-monotonic form related to b/c.
Since agents accumulate net fitness and
interactions are stochastic within the agent radius we hypothesize that
very high P will result in altruism levels that
equate to deterministic and symmetric interactions. This is true
because as P ? 8 , stochastic pairing approaches
symmetrical pairing.
- 5.4
- Thus, to more effectively parse the differential effects of
k and P, we also examine the
differential effects of stochastic vs. symmetrical pairing. We do so by
implementing supplemental simulations on a ring network in which each
agent interacts with each of its two neighbors exactly n
times, where n = {1, 2, 3, 4, …}. Thus P
= 2n in these simulations with symmetrical pairing.
Other parameters were fixed such that R = 1, N
= 90, and b/c = 10. Because the
neighbor radius is fixed, the average nodal degree is also fixed at k
= 2. These runs produced mean donation rates of approximately 0.05 for all
P (Figure 10).
Thus, when pairings are symmetrical, the value of P
has no discernable effect on levels of altruism, which remained at
minimal levels.
- 5.5
- Yet when k and b/c
remain fixed but interactions are stochastic, donation rates vary with P
and are maximized when P < b/c
as P ? b/c
-. Because the condition k
< b/c is fixed here, the
variation in donations, and particularly its peak when P
approaches b/c, is an effect of P
alone. This suggests that the stochastic nature of
pairings in our simulation and its effect on cumulative fitness is
highly significant in producing the donation rates presented
previously.
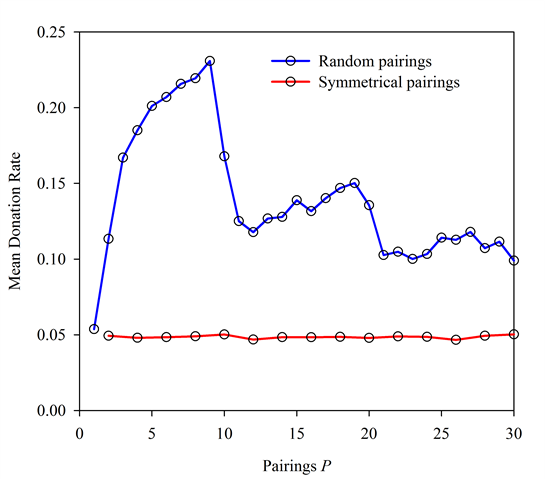
Figure 10. Random vs. Symmetrical Pairings. In both cases N = 90, R = 1, and b/c = 10. Under symmetrical pairings, varying the value of P appears to have little effect. - 5.6
- This finding raises interesting issues concerning
interaction contingency and fitness calculation in evolutionary
systems. By accumulating fitness, rather than averaging over
interactions, the contingent aspects of those interactions with respect
to reproduction are magnified. One might expect this to produce noise.
Yet in the model presented here we see a robust and interesting
donation function emerge.
- 5.7
- Note also that the heterogeneity in interactions may be more generally represented in a network by weighting the network's links. Thus, the use of symmetrical pairings in simulations and experiments is analogous to using unweighted networks in those cases, while this study's stochastic interaction is analogous to using a weighted network, where the weights are stochastic. It is obvious that in human social networks interactions are not symmetrical. Yet neither are they strictly random in their frequency. It is likely that a more realistic implementation than either of these cases is the use of a heterogeneously weighted network where the distribution of weights is empirically informed. This presents a fruitful future direction for work on the evolution of cooperative behavior in networked populations.
A note
on mutation
- 6.1
- Because the effect of mutation rates in similar simulations
has been previously examined (Hales
2005; Shutters
& Hales 2013; Spector
& Klein 2006), and because our goal was to isolate
the effects of parameters that govern interactions, this study used a
fixed value for the probability of mutation of m =
0.01. However, to determine whether our findings regarding a harmonic
signature are robust to changes in mutation rate we ran a further set
of simulations using our study's mutation rate along with two
additional values of mutation rate m ={0.1, 0.01,
0.001}. In all cases N = 90 and b/c
= 10. Results presented in Figure 11
show that when mutation rate was relatively low (m =
0.001) varying P had no effect on donation rates
and only minimal donation rates evolved. Relatively high mutation rates
(m = 0.1) did lead to a noticeable drop in donation
rate when P ? b/c -,
especially when neighborhood radius was larger. However, this drop in
donations when m = 0.1 was relatively small
compared to treatments with m = 0.01.
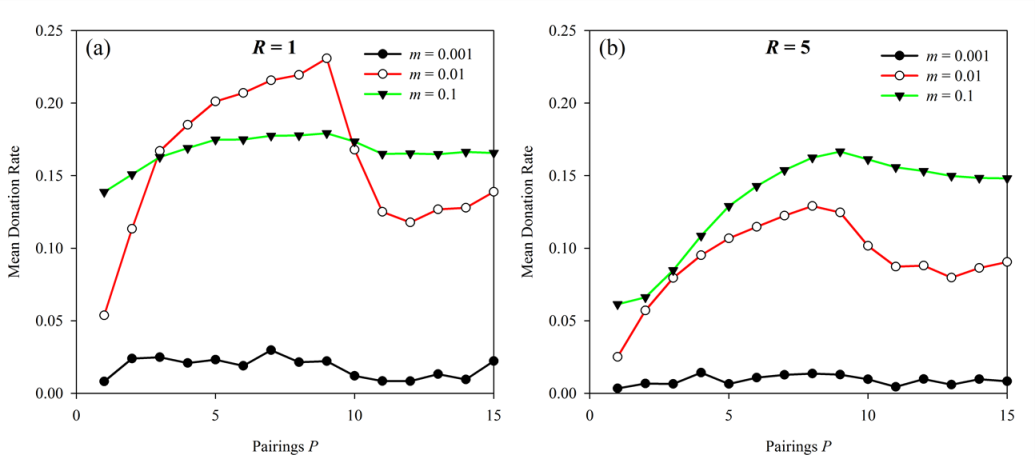
Figure 11. Mutation rate vs. Pairings. Results are presented with neighborhood radius (a) R = 1 and (b) R = 5. In both cases N = 90 and b/c = 10. The lower mutation rate led to no changes in aggregate behavior while the higher mutation rate led to a very slight drop in donations when b/c = P.
Conclusion
- 7.1
- Here we have used a simple simulation to test several
parameters that govern interactions between agents in a structured
society. We have shown that the important parameters, population size,
number of neighbors, and number of interactions per generation exhibit
a complex interplay and disentangling the effects of these different
attributes thus presents a very promising direction for future
research. Importantly, we show that when the structure of potential
interactions (the static network) and the structure of actual
interactions are equivalent, as is often the case in these types of
simulations, important effects are hidden. When interactions are
heterogeneous, as they are through the stochastic application of
pairings used in our simulation, significantly higher levels of
altruism emerge compared to when pairings are symmetrical.
- 7.2
- To state this in a more general way: where static networks
structure a population of agents by constraining interactions between
agents it is important to contrast this with the actual
realized interactions. The actual interactions in any given time period
consitutue a different network from the static one that is dynamically
realised through agent behaviour combined with the static network. It
is conequently important for the interpretation of such models to be
clear about the difference between the static "structural network" and
the dynamic "interaction network". The latter will often be implicit
and emergent from agent behavour. In much work these two networks are
conflated and this can make results hard to interpret and understand.
- 7.3
- Finally, we reported a curious harmonic signature in simulation outcomes resulting from the interaction of pairings and benefit-cost ratios. This last phenomenon, in particular, is in need of further investigation to understand its underlying cause and we welcome the chance to explore this further with our colleagues in the social simulation community.
Acknowledgements
- We thank Bruce Edmonds for replicating the model and for helpful comments on an earlier version of this paper.
Notes
-
1Tuning
parameters z used for curves {A, B, C, D, E} were
{16.6, 8.5, 12.5, 15.6, 18.5} respectively. These were determined by
simple visual estimation since our intent was only to demonstrate
robustness of a set of curves across different parameter sets.
Appendix
-
Algorithm pseudo code and parameter details
- 7.4
- The simulation model used in this article is described
below. The simulation replicates several existing models under certain
parameter settings and provides novel results in other cases. Under the
parameters we list the range of values used for each parameter. To find
the specific values for a given result see the text of the relevant
section of the article.
Parameters:
G = Number of generations = 30,000
The number of generations to run the simulation for.
N = Population size = [10..1000]
The number of agents in the population.
b = Benefit of donation = 1
The amount of fitness benefit an agent receiving a donation obtains.
c = Cost of donation ? [0..1]
The amount of fitness cost applied to an agent making a donation.
P = Pairings ? [1..100]
The number of random pairings made for each agent in each generation.
m = Mutation rate ? {0.001, 0.01, 0.1}
The probability that agent traits will be mutated during reproduction to the next generation.
R = Radius of interaction ? [1..1000]
The radius around the agent from which random pairings with other agents are drawn. Constraint: 0 < R =< N / 2. When R = N / 2 = 50, radius is entire population (as in the RCA model). When R = 1, radius is only immediate two neighbors (as in SK model).Agent state variables:
ti = tag value of agent i. t ? [0..1].
The tag value is a real number that is attached to each agent and is observable by other agents.
Ti = tolerance value of agent i. T ? [-10-6, 8 ].
The tolerance value is a real number stored by each agent used, in combination with tag values, to determine if to make a donation to another agent.
BTi = binary trait of agent i. BT ? {0,1}.
The binary trait, stored by each agent, determines if to make donations or not: 0 = turn off all donation, 1 = donate using tag / tolerance mechanism.
fi = fitness of agent i. f ? R.
Agents accumulate a fitness value in each generation through interactions involving costs and benefits.Main Outline Algorithm:
Initialize population of agents () // see function below
Loop for G generations
Loop for each agent A in population N
Loop for P pairings
Select a random agent B within agent A's radius R
Agents Interact (A, B) // see function below
End loop
End loop
Reproduce Population () // see function below
End loopFunctions used in main outline algorithm:
// Initialize population of agents
Function Initialize population of agents ()
Create a ring of size N
Loop for each agent A in population N
Place agent A at next free position on ring
Set tag (tA) and tolerance (TA) to uniform random values [0..1]
Set binary trait to 1 (BTA = 1)
Set fitness of agent to zero
End loop
End Function
// Agents A and B interact, A decides if to make a donation to B
Function Agents Interact (agent A, agent B)
If binary trait of A is turned on (BTA = 1) then
If tags of A and B are within tolerance of A ( |tA - tB| = TA ) then
Fitness of B is increased by benefit (fB = fB + b)
Fitness of A is decreased by cost (fA = fA - c)
End if
End if
End function
// Reproduce a new population based on fitness of agent in current population
Function Reproduce Population ()
Create a new ring of size N for the new population
Loop for each agent A in population N
Select a random agent B within agent A's radius R
Reproduce agent (A or B) with higher fitness# (f) as agent C
Agent C is placed in the same location on the ring as agent A
With probability m mutate* tag (tC) and tolerance (TC) of agent C
With probability m mutate* binary trait (BTC)
End loop
New population becomes the current population
All agents in new population have fitness initialize to zero
End functionNotes:
#Note: if the fitness of A and B are the same a random selection is made.
*Note: mutation takes the following form:
A tag (t) is replaced with a uniformly random value [0..1].
Tolerance (T) is changed by adding Gaussian noise with mean 0 and standard deviation 0.01. If T < -10-6 then T is reset to -10-6.
A binary trait (BT) is flipped (such that 1 becomes 0 and vice versa).
References
- BARABÁSI, A. L., &
Albert, R. (1999). Emergence of scaling in random networks. Science,
286(5439), 509–512.
BOYD, R., & Richerson, P. J. (2002). Group beneficial norms can spread rapidly in a structured population. Journal of Theoretical Biology, 215(3), 287–296. [doi:10.1006/jtbi.2001.2515]
FLACHE, A. (1996). The double edge of networks: an analysis of the effect of informal networks on cooperation in social dilemmas. Amsterdam: Thela Thesis Publishers.
FLACHE, A. (2002). The rational weakness of strong ties: Failure of group solidarity in a highly cohesive group of rational agents. Journal of Mathematical Sociology, 26(3), 189–216. [doi:10.1080/00222500212988]
FLACHE, A., & Macy, M. W. (1996). The weakness of strong ties: Collective action failure in a highly cohesive group. Journal of Mathematical Sociology, 21(1–2), 3–28. [doi:10.1080/0022250X.1996.9990172]
HALES, D. (2005). Change your tags fast! A necessary condition for cooperation? In P. Davidsson, B. Logan & K. Takadama (Eds.), Multi-Agent and Multi-Agent-Based Simulation (Vol. 3415, pp. 89–98). Berlin: Springer.
HAUERT, C. (2001). Fundamental clusters in spatial 2x2 games. Proceedings of the Royal Society of London. Series B: Biological Sciences, 268(1468), 761–769. [doi:10.1098/rspb.2000.1424]
HAUERT, C., & Doebeli, M. (2004). Spatial structure often inhibits the evolution of cooperation in the snowdrift game. Nature, 428(6983), 643–646.
HECKATHORN, D. D. (1996). The dynamics and dilemmas of collective action. American Sociological Review, 61(2), 250–277. [doi:10.2307/2096334]
IFTI, M., Killingback, T., & Doebeli, M. (2004). Effects of neighbourhood size and connectivity on the spatial Continuous Prisoner's Dilemma. Journal of Theoretical Biology, 231(1), 97–106. [doi:10.1016/j.jtbi.2004.06.003]
JUN, T., & Sethi, R. (2007). Neighborhood structure and the evolution of cooperation. Journal of Evolutionary Economics, 17(5), 623–646. [doi:10.1007/s00191-007-0064-6]
MARWELL, G., & Oliver, P. E. (1993). Critical Mass in Collective Action. Cambridge: Cambridge Publishing. [doi:10.1017/CBO9780511663765]
NÉMETH, A., & Takács, K. (2007). The Evolution of Altruism in Spatially Structured Populations. Journal of Artificial Societies and Social Simulation, 10(3), 4: https://www.jasss.org/10/3/4.html.
NOWAK, M. A., & May, R. M. (1992). Evolutionary games and spatial chaos. Nature, 359(6398), 826–829.
OHTSUKI, H., Hauert, C., Lieberman, E., & Nowak, M. A. (2006). A simple rule for the evolution of cooperation on graphs and social networks. Nature, 441(7092), 502–505.
OLSON, M. (1965). The Logic of Collective Action: Public Goods and the Theory of Groups. New York: Schocken Books.
OPP, K. D., & Gern, C. (1993). Dissident Groups, Personal Networks, and Spontaneous Cooperation - the East-German Revolution of 1989. American Sociological Review, 58(5), 659–680. [doi:10.2307/2096280]
PERC, M., Gómez-Gardeñes, J., Szolnoki, A., Floría, L. M., & Moreno, Y. (2013). Evolutionary dynamics of group interactions on structured populations: a review. Journal of the Royal Society Interface, 10(80), 20120997. [doi:10.1098/rsif.2012.0997]
RAND, D. G., Nowak, M. A., Fowler, J. H., & Christakis, N. A. (2014). Static network structure can stabilize human cooperation. Proceedings of the National Academy of Sciences, Early edition online . [doi:10.1073/pnas.1400406111]
RIOLO, R. L., Cohen, M. D., & Axelrod, R. (2001). Evolution of cooperation without reciprocity. Nature, 414(6862), 441–443.
ROBERTS, G., & Sherratt, T. N. (2002). Does similarity breed cooperation? Nature, 418(6897), 499–500.
SHUTTERS, S. T. (2012). Punishment leads to cooperative behavior in structured societies. Evolutionary Computation, 20(2), 301–319. [doi:10.1162/EVCO_a_00062]
SHUTTERS, S. T., & Hales, D. (2013). Tag-Mediated Altruism is Contingent on How Cheaters Are Defined. Journal of Artificial Societies and Social Simulation, 16(1), 4: https://www.jasss.org/16/1/4.html.
SPECTOR, L., & Klein, J. (2006). Genetic stability and territorial structure facilitate the evolution of tag-mediated altruism. Artificial Life, 12(4), 553–560. [doi:10.1162/artl.2006.12.4.553]
TAKÁCS, K., Janky, B., & Flache, A. (2008). Collective action and network change. Social Networks, 30(3), 177–189. [doi:10.1016/j.socnet.2008.02.003]
WILSON, D. S., & Wilson, E. O. (2007). Rethinking the theoretical foundation of sociobiology. Quarterly Review of Biology, 82(4), 327–348. [doi:10.1086/522809]