
 Abstract
- Agent states and transitions between states are important abstractions in agent-based social simulation (ABSS). Although it is common to develop ad hoc implementations of state-based and transition-based agent behaviors, "best practice" software engineering processes provide transparent and formally grounded design notations that translate directly into working implementations. Statecharts are a software engineering design methodology and an explicit visual and logical representation of the states of system components and the transitions between those states. Used in ABSS, they can clarify a model's logic and allow for efficient software engineering of complex state-based models. In addition to agent state and behavioral logic representation, visual statecharts can also be useful for monitoring agent status during a simulation, quickly conveying the underlying dynamics of complex models as a simulation evolves over time. Visual approaches include drag-and-drop editing capabilities for constructing state-based models of agent behaviors and conditions for agent state transitions. Repast Simphony is a widely used, open source, and freely accessible agent-based modeling toolkit. While it is possible for Repast Simphony users to create their own implementations of state-based agent behaviors and even create dynamic agent state visualizations, the effort involved in doing so is usually prohibitive. The new statecharts framework in Repast Simphony, a subset of Harel's statecharts, introduces software engineering practices through the use of statecharts that directly translate visual representations of agent states and behaviors into software implementations. By integrating an agent statecharts framework into Repast Simphony, we have made it easier for users at all levels to take advantage of this important modeling paradigm. Through the visual programming that statecharts afford, users can effectively create the software underlying agents and agent-based models. This paper describes the development and use of the free and open source Repast Simphony statecharts capability for developing ABSS models.
- Keywords:
- Agent-Based Modeling, Statecharts, Agent-Based Social Simulation, Repast Simphony, Software Engineering Processes
Introduction
- 1.1
- Agent states and transitions between states are important abstractions in agent-based social simulation (ABSS) (Macal & North 2010). Although it is common to develop ad hoc implementations of state-based and transition-based agent behaviors, "best practice" software engineering processes provide transparent and formally grounded design notations that translate directly into working implementations. A number of agent-oriented software engineering processes have been developed (Fortino & North 2013).
- 1.2
- Statecharts (Harel 1987) are a software engineering design methodology and an explicit visual and logical representation of the states of system components and the transitions between those states. Used in ABSS, they can clarify a model's logic and allow for efficient software engineering of complex state-based models. In addition to agent state and behavioral logic representation, visual statecharts can also be useful for monitoring agent status during a simulation, quickly conveying the underlying dynamics of complex models as a simulation evolves over time. Visual approaches include drag-and-drop editing capabilities for constructing state-based models of agent behaviors and conditions for agent state transitions.
- 1.3
- Repast Simphony is a widely used, open source, and freely
accessible agent-based modeling toolkit (Repast
Simphony 2014a). While it is possible for Repast Simphony
users to create their own implementations of state-based agent
behaviors by adapting the State pattern in Gamma et al. (1994) and even create dynamic
agent state visualizations, the effort involved in doing so is usually
prohibitive. The new statecharts framework in Repast Simphony, a subset
of Harel's statecharts, introduces software engineering practices
through the use of statecharts that directly translate visual
representations of agent states and behaviors into software
implementations. By integrating an agent statecharts framework into
Repast Simphony, we have made it easier for users at all levels to take
advantage of this important modeling paradigm. Through the visual
programming that statecharts afford, users can effectively create the
software underlying agents and agent-based models. This paper describes
the development and use of the free and open source Repast Simphony
statecharts capability for developing ABSS models.
Background
- 1.4
- Statecharts are a type of state diagram. State diagrams (Shannon 1948) are visual depictions of sequential control procedures or algorithms. Early examples of state diagrams include Moore machines (Moore 1956) and Mealy machines (Mealy 1955). Later examples include Harel statecharts (Harel 1987), the Discrete Event System Specification (DEVS) (Zeigler et al. 2000), and the Object Management Group Unified Modeling Language (OMG UML) state machines (OMG 2009). The latter two describe algorithms for complex software and models. State diagrams have been used in the design or implementation of agent-based models, for example, the Polhill, Izquierdo, and Gotts (2005) land use change model, the Siebers and Aickelin (2011) retail model, and the Aguirre and Nyerges (2014) sustainability management model.
- 1.5
- Statecharts simulation tools include the National Instruments Statechart Module (http://www.ni.com/labview/statechart/) and VisSim (http://www.vissim.com/products/vissim/state_charts.html), both of which are proprietary. Yakindu Statechart Tools is a free and open source toolkit for "the specification and development of reactive event-driven systems based on the concept of statecharts" (Yakindu Committers 2014). Yakindu was designed for use by the embedded systems industry for such things as automotive system controls and vending machines. It can also be used to design and simulate other kinds of event-driven behavior. The toolkit consists of a graphical editor to create and edit statecharts, a simulator to simulate the behavior of statecharts, and code generation components to transform the statecharts into Java or C++ code. Yakindu's emphasis on embedded system simulation and its use of its own language to describe behaviors of the state machine are its primary differences from Repast Simphony's statecharts implementation. Finally, in addition to ABSS applications and embedded systems, gaming systems have adopted a state-driven agent design approach as well.
- 1.6
- Agent-based modeling frameworks include the notion of state to represent agents and agent state transitions, but statecharts are not necessarily used. Of the most widely used ABM tools, only the proprietary AnyLogic toolkit includes capabilities for users to specify agent states and transitions through statecharts (AnyLogic Company 2014). As it does in AnyLogic, the statecharts capability in Repast Simphony supports a subset of Harel's statecharts.
- 1.7
- The rest of the paper is organized as follows. Section 2 introduces statecharts in Repast Simphony. Section 3 describes their implementation, including the graphical statecharts editor, automated code generation, and runtime visualization and interaction features. Section 4 presents two case studies using Repast Simphony to illustrate the benefits of statecharts-based software engineering methods for developing ABSS models. Section 5 concludes with lessons learned and future work.
Repast
Statecharts
-
Convergent Modeling
- 2.1
- The computational study of complex systems increasingly requires the integration of multiple computational models (Vangheluwe et al. 2002), where larger models are constructed by combining smaller models to address questions that cannot be answered by the smaller models in isolation (Villa 2001). The result is a hybrid or multi-paradigm integrated model. Model integration has increasing appeal. The drivers include a growing interest in leveraging divergent sets of accepted legacy models, an intensifying pressure to reduce development costs by reusing existing models, and expanding user requirements that are best met by combining different modeling methods.
- 2.2
- There have been many published model integration advances including supporting theory (Vangheluwe et al. 2002; North 2014), conceptual frameworks (Vangheluwe & de Lara 2003; Liang & Paredis 2003; Brown et al. 2005), software tools (IEEE 2010, 2012; Villa & Costanza 2000; Villa 2001; Vangheluwe & de Lara 2003; North et al. 2006, 2007b), and applied case studies (Dubiel & Tsimhoni 2005; Bithell & Brasington 2009; Teose et al. 2011). As productive as these activities has been, a broader strategy is required. The concept of model integration needs to be expanded to include not only models but also the modeling process itself. The result is convergent modeling.
- 2.3
- Convergent modeling seeks to achieve convergence on every
level of the modeling process from stakeholder interests and modeling
questions through integrated executable code all the way to combined
outputs and final recommendations. We believe that Repast Simphony
statecharts provide a tool to help support convergent modeling by
offering better ways to communicate model designs and implementations
than those offered by typical text-based programming languages.
Why Repast Simphony Statecharts?
- 2.4
- Statecharts allow for implementation independent ways to specify the design of complex behaviors. Used in ABSS, they can clarify a model's logic and allow for efficient software engineering of complex state-based models. Agent behaviors amenable to a state-based representation can be encapsulated with states and transitions between agent states. If this logic is automatically transformed into model and agent components, as is the case for Repast Simphony statecharts, the agent modeler is able to focus on model design and the testing of behavioral designs in dynamic functioning agent models. This has benefits in developing complex models of real world systems but it also helps in the presentation of the underlying logic of the resulting models. In addition, the clarity with which agent behaviors can be depicted through statecharts without needing to necessarily consider underlying implementation details is beneficial in pedagogical contexts when students may have limited computational expertise.
- 2.5
- The Repast Simphony statecharts framework offers a number of beneficial characteristics over existing ABSS and statecharts modeling toolkits. These are modeling flexibility, leveraging of Repast Simphony ReLogo, modern syntax highlighting and code completion, and the use of nonproprietary and open source software.
- 2.6
- Modeling Flexibility. The statecharts implementation allows for agents to have as many or as few statecharts defined as necessary, while not requiring that all agent behaviors be described through statecharts. Repast Simphony offers many modes for specifying agent behaviors, including Java, Groovy, and ReLogo. By allowing the modeler to choose the appropriate combination of modeling paradigms, the statecharts framework supports flexible and expressive agent-based model specification.
- 2.7
- Leveraging of Repast Simphony ReLogo. Since there is no restriction regarding what types of agents can include statecharts, the Repast Simphony ReLogo (Ozik et al. 2013) Patch, Link, Observer, and Turtle (PLOT) entities can have statecharts-mediated behaviors. By combining the ease of modeling provided by the ReLogo modeling paradigms with the statecharts framework's ability to quickly build complex state-based agent logic, Repast Simphony is able to offer powerful agent modeling capabilities to a broader range of potential agent-modelers. As shown in text that follows, this combination of simplicity and expressiveness has already proven useful for teaching computational epidemiology to middle school and high school students.
- 2.8
- Modern Syntax Highlighting and Code Completion. Over the last decade, modern integrated development environments have become indispensable in providing support to software developers. The support comes in many forms, including intelligent auto-completion, quick and inline access to application programming interfaces, and templates to generate boilerplate code. The statecharts editor, in addition to enabling graphical editing of statechart components, also includes a fully featured editor for specifying agent behaviors to be triggered and conditions to be satisfied. This assistance helps the agent modeler to explore the available capabilities offered by the code base without leaving the editing environment, and it flags compilation errors and provides warnings to greatly speed up verification of the model code.
- 2.9
- Use of Nonproprietary and Open Source Software.
As part of Repast Simphony, the statecharts framework is free and open
source software. Its "New BSD" style license (Repast
Simphony 2014b) reduces the financial barriers to entry for
researchers and prospective agent modelers, regardless of commercial or
noncommercial intentions. Having all of the source code that underlies
the statecharts implementation freely available within the Repast
Simphony distribution (Repast
Simphony 2014a) means that the behavior of a model is
transparent.
Statecharts Basics
- 2.10
- Statecharts consist of states and transitions between states. Table 1 and Table 2 (which follow after brief discussions) give an overview of the types of states and transition triggers, respectively, that exist in the Repast Simphony statecharts framework. These represent a subset of Harel's statecharts that were deemed most relevant to modeling state-based agent behaviors. For further details on any of the components refer to the Statecharts guide (Ozik & Collier 2014). Note that Repast Simphony offers two visual programming interfaces: statecharts and flowcharts. For more information on Repast Simphony flowcharts, see North et al. (2007a) and North et al. (2013).
- 2.11
- States are one of the fundamental building blocks of
statecharts. Table 1 lists
three types of states (simple, composite,
final) and five types of pseudo-states (entry state marker, initial
state marker, deep history state, shallow history state, and branching
state). Pseudo states are not agent states per se but are pointers to
other states and are exited immediately. For many of the states,
actions that will be executed upon entry or exit (so-called On
Enter or On Exit blocks) can be defined.
This is one of the basic mechanisms by which state-based agent
behaviors can be defined.
Table 1: State element types available in Repast Simphony. (The On Enter/On Exit columns indicate whether an action that is triggered upon entry or exit can be specified from the state element.) State Type Details On Enter On Exit Entry state marker
(Figure 1a)This element marks the point of entry into a statechart when the statechart is activated. No No Simple state
(Figure 1b)One and only one of the simple states will be active within an active statechart. Yes Yes Composite state
(Figure 1c)Composite states nest other state elements (simple states, other composite states, an initial state marker, history states, final states, and branching states) and are active when a sub-element is active. If a transition is made from outside a composite state directly to a sub-element, the composite state will be entered prior to its sub-elements. In a similar manner, if a transition is followed from a sub-element out of the composite state, the composite state will be exited after the sub-elements are exited. Yes Yes Initial state marker
(Figure 1d)Marks the element within a composite state that should be entered upon entrance to the composite state. No No Deep history state
(Figure 1e)
History states keep a record of the last active state within a composite state. For a deep history state, the last active simple state within the enclosing composite state (it does not matter what level the nesting hierarchy is at) is entered. If there was no previously active state, the state pointed to by the initial state marker is entered. Yes No Shallow history state
(Figure 1f)When a shallow history state is entered, the last active element within the enclosing composite state at the same hierarchical level of the history state is re-entered. If there was no previously active state, the state pointed to by the initial state marker is entered. Yes No Final state
(Figure 1g)This element marks the end of all activities for a statechart. When a final state is entered, no further states will be visited, and no transitions will be triggered. Yes No Branching state
(Figure 1h)Branching states represent logical branching within statecharts. No No 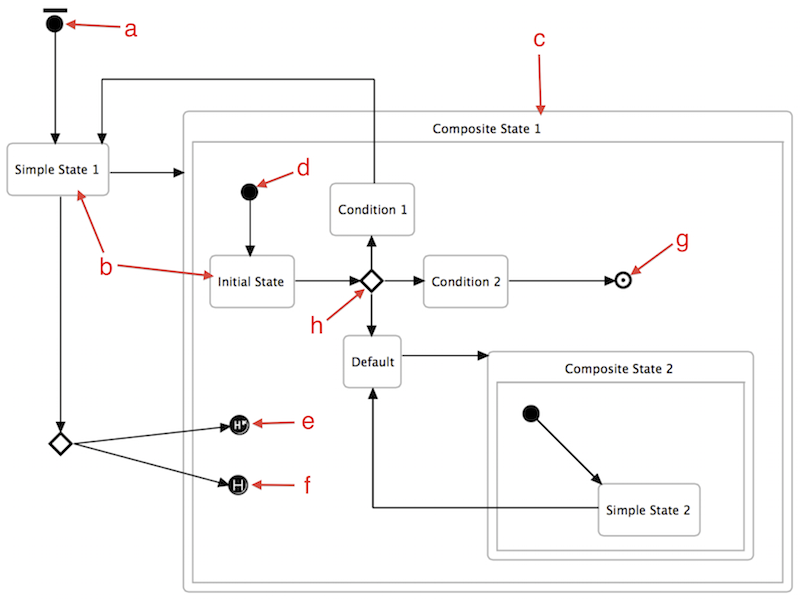
Figure 1. Sample statechart with annotated state elements. (a = entry state marker, b = simple state, c = composite state, d = initial state marker, e = deep history state, f = shallow history state, g = final state, and h = branching state. Transitions are shown as arrows.) - 2.12
- Transitions between states make up the other fundamental
building block of statecharts. There are two types of transitions:
regular transitions that connect different states, and self-transitions
that are internal to a state. For any transition, an On
Transition action, which will be executed whenever the
transition is traversed, can be defined. This is how
state-transition-based agent behaviors are defined. A transition is
selected for traversal from the set of valid transitions leading out of
currently active states. Every transition has a polling time associated
with it. This indicates the frequency (in units of simulation ticks) at
which the transition is polled for validity. The validity of a
transition depends on the type of trigger that is defined on it. Table 2 presents the available transition
trigger types.
Table 2: Transition trigger types available in Repast Simphony. Transition Trigger Type Details Always Always triggers are always valid and are commonly used in self-transitions to execute some action at a specified polling time. Timed Timed triggers become valid after a specified time, measured in simulation ticks. Probability Probability triggers include a specified probability. The logic specifying the probability is evaluated against a random draw each time the transition is polled for validity. Condition Condition triggers are evaluated as being valid based on a specified condition, evaluated at the transition polling times. Exponential decay rate Exponential decay rate triggers become valid after a random time following the exponential distribution. A new random interval is chosen each time the transition is initialized. Message Message triggers become valid when a message that meets specific criteria is received by the statechart. There are four types of message triggers: when a message meets a specified condition, when a message equals a specified element, when a message is of a certain type, and when any message of any type is received.
Repast
Statecharts Implementation
- 3.1
- The Repast Simphony Statecharts framework consists of the
following components:
- Graphical editor and statechart metamodel,
- Java/Groovy code generation,
- Statechart code editor, and
- Runtime visualization and interaction panel.
Graphical Editor and Statechart Metamodel
- 3.2
- The statecharts graphical editor implementation is written in Java as an Eclipse (Eclipse Foundation 2014a) plugin, adding the ability to create and edit statechart diagrams inside the Eclipse integrated development environment (IDE). As shown in Figure 2, the editor is divided into three major areas: the workspace area, where the graphical elements of a statechart are manipulated (Figure 2a); the palette of available elements (Figure 2b); and the properties panel, which displays the properties of the currently selected element (Figure 2c).
- 3.3
- The statechart plugin was developed by using the Graphical
Modeling Framework (GMF) (Eclipse
Foundation 2014b). GMF is a set of Eclipse plugins for
developing graphical editors from metamodels. The metamodel specifies
the components of the model that are to be edited in the graphical
editor. Some of the metamodel components correlate directly with
statechart entities, while others are necessary artifacts of the
implementation. For example, in our case, the statechart metamodel
describes elements such as states, their properties, and their
relationships with other parts of the metamodel, together with
properties used only by the implementation, such as a universally
unique identification (UUID) (see Figure 3).
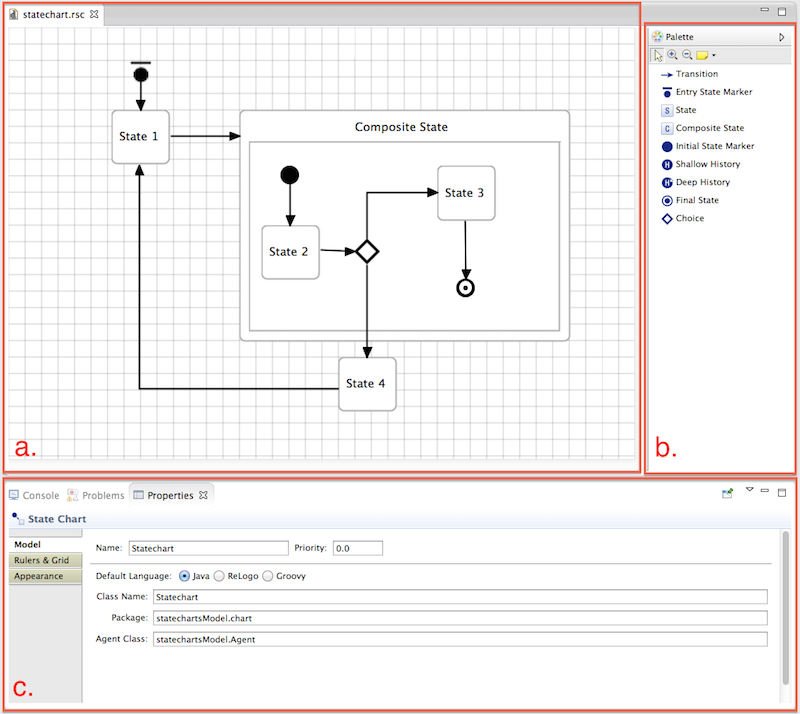
Figure 2. The components of the statecharts visual editor. ( a = the workspace area where the statechart elements are created and arranged; b = the palette panel of available elements, including selection, zoom, and note tools; and c = the properties panel of the selected statechart element in the workspace area a. If no element is selected, the properties of the statechart itself are displayed.) 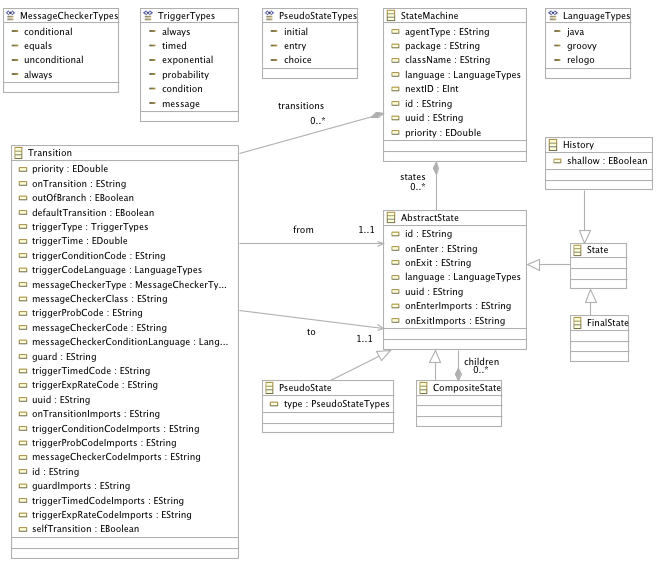
Figure 3. UML diagram of the Repast Simphony statechart metamodel. - 3.4
- Figure 3 shows the statechart metamodel as a Unified Modeling Language (UML) diagram. The root component is the StateMachine. It contains all the transitions (Transition) and states (AbstractState) in the model (as indicated by the "states 0..*" and "transitions 0..*" notation). A Transition contains references to its "from" and "to" states as well as the various properties that describe that transition. For example, the triggerType describes the type of trigger associated with the transition, and the onTransition String is the code that will be executed when the transition is traversed. States, inheriting from AbstractState, have properties such as onExit and onEnter that define the code that will be executed when that state is exited or entered. GMF leverages the Eclipse Modeling Framework (Eclipse Foundation 2014c) (EMF) for this metamodeling and generates Java code for each of these components. For example, a Java Transition class with accessors for each property and the "from" and "to" states can be generated.
- 3.5
- Additional GMF tools allow the developer to specify a
graphical model consisting of a set of figures, each with its own
color, shape, and other graphical attributes. These figures are then
mapped to the elements of the metamodel. The mapping describes how
specific elements in the metamodel should appear in the editor. For
example, in our implementation, a state should appear as a rounded
rectangle. Once the metamodels and the mappings have been completed by
using EMF/GMF utility wizards, GMF can then generate the code for a
functional editor. In our case, the generated editor code was
extensively and manually customized, resulting in the current
statechart editor implementation. See Figure 4
for an illustration summarizing the overall pathway from metamodel to
statechart editor code creation.
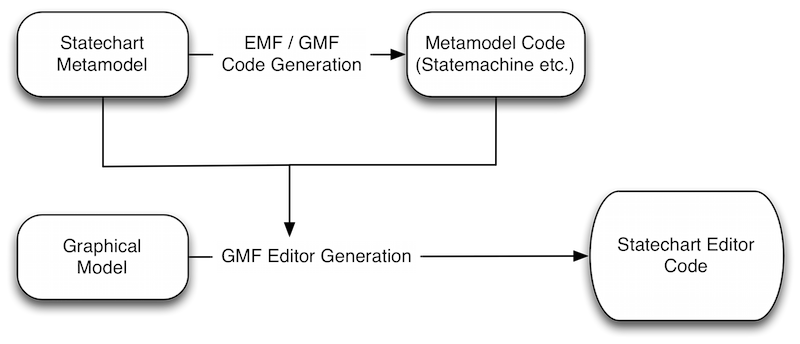
Figure 4. Creating the statechart editor implementation: The classes corresponding to the elements of the metamodel are generated from the metamodel using EMF / GMF code generation. The state chart editor code is generated from the Graphical Model, the metamodel, and the generated metamodel code using GMF's code generation. - 3.6
- We also used GMF and EMF to generate the validation code for the statechart diagram. The validation code checks the diagram for coherence, flagging as errors conditions that result in a nonfunctional statechart (e.g., missing statechart entry points, invalid branching transitions). It also flags as warnings conditions that do not create a nonfunctional statechart but that are unexpected (e.g., states that are included in a statechart but are unreachable). As it was for the editor code, GMF was used to generate the base validation code, which was then customized.
- 3.7
- When creating and editing a statechart model, the user is
manipulating instances of the metamodel components via the graphical
model. When a new statechart model is created in the editor, a StateMachine
object is instantiated. Any states or transitions that are created in
the model are instantiations of State and Transition
components that are themselves added to the StateMachine
as defined in the metamodel (see Figure 5).
Similarly, editing an element's properties edits the corresponding
metamodel property (e.g., a state's On Enter code
block). Saving a statechart in the editor serializes the StateMachine
and all its component elements and properties to disk. Loading a
statechart into the editor instantiates the StateMachine
and displays it according to the graphical model mapping.
Code Generation
- 3.8
- The code generation mechanism also utilizes the
instantiated metamodel components. A specific StateMachine object
is passed to the code generator, which then creates the Java code for
creating the actual runtime statechart used during a Repast Simphony
model run. The generated code is written to an Eclipse source
directory and then compiled by the Eclipse compiler, resulting in a
seamless process. Whenever the statechart diagram is saved, the source
is generated, and Eclipse compiles it automatically. Figure 5 depicts the process of creating
statechart builder source code from metamodel components defined within
a statechart diagram.
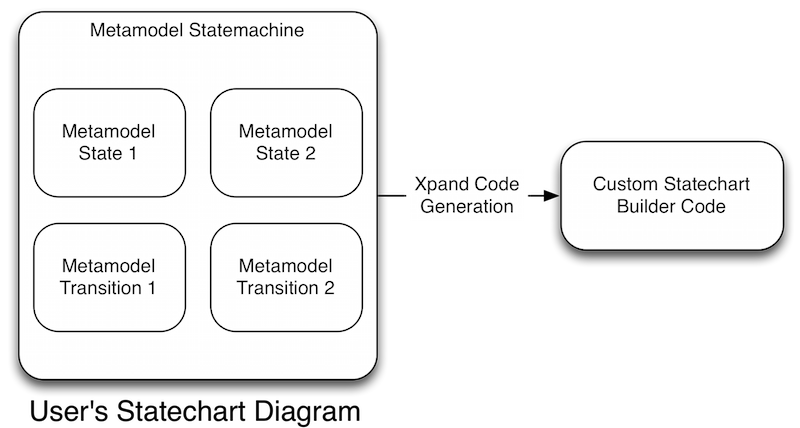
Figure 5. Creating the model's statechart code from the user's statechart diagram. On the left, the user's statechart diagram is composed of instances of the metamodel classes (e.g., States and Transitions). Those instances are passed to the Xpand code generator that creates the model's statechart builder code. - 3.9
- Here we note that the generated statechart builder code relies on the underlying statechart engine within Repast Simphony. This means that a user could conceivably choose to forego the graphical statechart creation and editing process and implement a statechart of their own relying solely on Java, Groovy or ReLogo code. The benefit of this approach could be custom extensions of the statecharts engine. However, this would require substantial work that the statechart editor takes care of by default, including creating, correctly connecting, defining the behaviors of, and specifying the triggers that activate the statechart components. In addition, only the logic of the underlying statechart can be defined this way, so there will be no corresponding graphical representation that could be displayed.
- 3.10
- The code generation is implemented by using the Eclipse Xpand framework (Eclipse Foundation 2014d). Xpand is a statically-typed template language that facilitates the generation of textual artifacts, such as source code, from models. A template language allows a developer to define a template. A template consists of text that appears verbatim in the output and text that derives from some other input to the template. Xpand templates take a model as input and use the components and properties of the elements of that model to create the generated text output.
- 3.11
- Figure 6 is the
Xpand template for the source code that creates outbound branch
transitions. All the blue text gets written verbatim to a Java source
file. Anything within the angled brackets is either a control statement
or a template construct that is evaluated and then written to the Java
source file. The example works with Transition
objects from the statechart metamodel such that "this" refers to the Transition
object currently being processed.
<<this.id>> then refers to the id property
of the transition, <<this.from.uuid>>
refers to the UUID of the state that is the "from" property of the
transition, and so on. The Java source that is created from this
template will look like Figure 7.
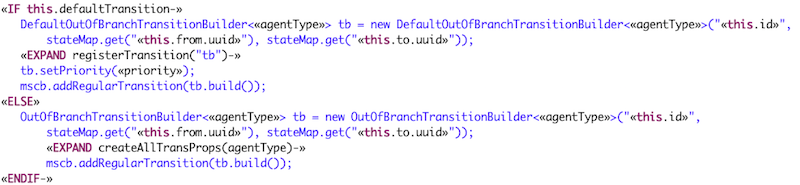
Figure 6. An example Xpand template for generating Java source code that represents an outbound branch transition. 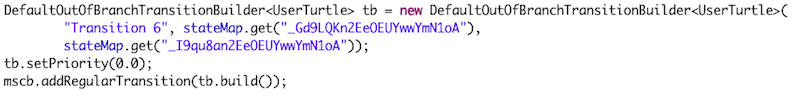
Figure 7. Example Java output generated from the Xpand template in Figure 4. - 3.12
- The generated code is not the runtime statechart itself but rather the builder or creation type code, which is typically run once for each agent to create the statechart for that agent. When run, state components are created first and inserted into the stateMap referenced in Figures 6 and 7 by using the UUID of the metamodel state from which they derive as a key. When transitions that require "from" and "to" states are created, the created states are retrieved by using the UUIDs, as seen in Figure 7. In this way, relationships defined in the diagram are created in the runtime statechart.
- 3.13
- The code generation process also performs some cleanup,
eliminating any existing source code that is no longer applicable. A
scalable vector graphic (SVG) format snapshot image of the statechart
diagram is also created. This image is the foundation of the
visualization and interaction runtime statechart panel, which displays
statechart activity and allows the user to graphically interact with a
running statechart during a simulation run.
Code Editor Implementation
- 3.14
- The statechart code editor is the graphical component used
to display a statechart's user-specified logic, such as a state's On
Enter logic or a transition's trigger condition. The editor
provides syntax coloring and code completion (see Figure 8).
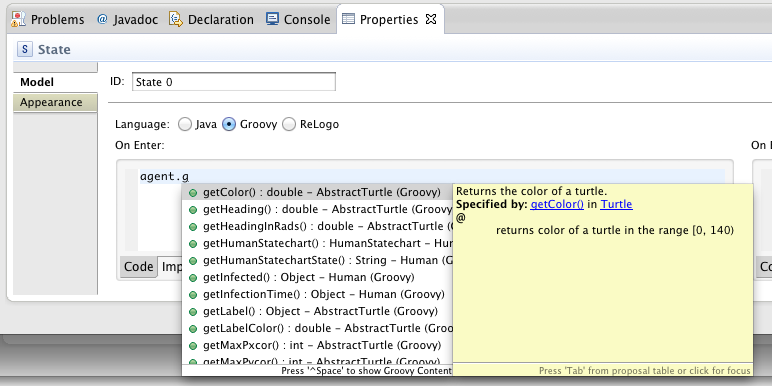
Figure 8. Code completion options suggested by the statechart properties code editor. - 3.15
- The code editor adapts Eclipse's Java editor and the Groovy
Eclipse (Groovy Eclipse Developers
2014) plugin's Groovy language editor for property editing.
Both of these editors are designed to work with text files rather than
non-file-based text properties; thus, much of the adaptation focuses on
making the model code text properties appear as ordinary source code
files to the Java and Groovy editors. This is accomplished by creating
a proxy file whenever a code property is displayed in the editor. The
proxy file is created by using the same Xpand template mechanism just
described, the result of which is a file that very closely matches what
is ultimately produced by the code generator. The proxy code is a
single Java or Groovy class that contains a single method. It is the
body of this method that appears in the property editor. However, the
Java or Groovy editor component is using the entire proxy file as its
source; thus, it can properly perform syntax and error highlighting as
well as code completion by using the needed information provided by the
entire file.
Runtime Visualization and Interaction Panel
- 3.16
- As indicated above, the statecharts capabilities include
the ability to probe and display an agent's active statecharts as a
simulation is executing (see Figure 9).
The visualization panel is implemented by adapting the capabilities of
the Apache Batik SVG Toolkit (Apache
Batik 2014). The currently active states are highlighted in
green; simple states are completely filled in, and composite states
have their frames filled in (see the Condition 1
simple state and the Composite State 1 composite
state in Figure 9). The
statechart is dynamically updated as the simulation proceeds, providing
direct insight into any probed agent's internal state. In addition, the
statecharts can be directly manipulated via mouse clicks, thereby
permitting manual activation of inactive states and the forcing of
transitions to be followed. This feature allows for experimentation
with alternative or rare event paths through agent statecharts.
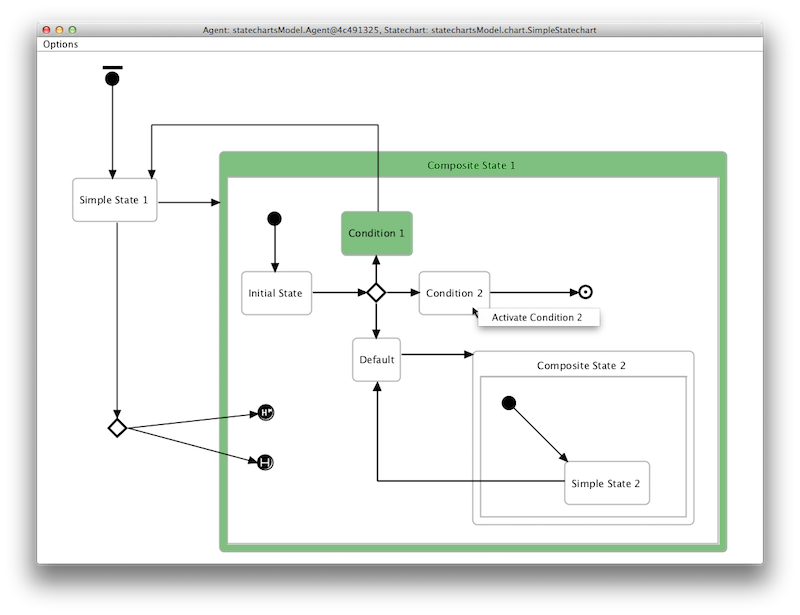
Figure 9. The runtime and interaction panel of an active statechart. (Active states are indicated by green highlighting. The panel allows manual activation of states and transitions via contextual menus revealed through mouse clicks; see the "Activate Condition 2" contextual menu option.)
Repast
Statecharts Use Cases
- 4.1
- This section describes two different use cases where Repast
Simphony statecharts are used. The intent is to illustrate the benefits
of statecharts-based software engineering methods for developing ABSS
models. Case study 1 is the creation of a model of
Methicillin-resistant Staphylococcus aureus (MRSA)
transmission. MRSA is transmitted via contact so modeling MRSA requires
explicitly inclusion of the spatial movement of agents, along with the
types of interactions that they engage in throughout their daily
activities. As such, the MRSA model includes disease state progression
that is directly influenced by the location and interactions of each
agent. We demonstrate how this type of interaction-rich disease
transmission model can be easily constructed by leveraging the
statecharts and ReLogo capabilities in Repast Simphony. Case study 2 is
the creation of a manpower life cycle costing application. Manpower
life cycle costing often involves a variety of different hierarchically
related classifications and complex rules for compensating individuals
as they pass through the classification hierarchy over the course of
their careers. We demonstrate how by utilizing explicit state-based
dynamics via Repast Simphony statecharts, the complicated and deep
classification hierarchy of the U.S. Air Force can be efficiently
encapsulated as a statechart and the resulting model can be used as a
tool for policy scenario experimentation. Both case study models have
been published to allow for replication (Ozik
et al. 2015; Combs
& Ozik 2015).
Case Study 1: Simple Model of Community-associated (CA) MRSA
- 4.2
- The first case study shows how the new Repast Simphony statecharts capability can be used to create a model of infectious disease transmission suitable for use in teaching computational epidemiology (Ozik et al. 2015). Although the model is a simplification of a larger model (Macal et al. 2012), it is complex enough to demonstrate key insights into the problems/difficulties faced by public health officials when confronted with outbreaks of infectious diseases.
- 4.3
- The University of Chicago and Argonne National Laboratory, in collaboration with Santa Fe Institute's Project GUTS ("Growing Up Thinking Scientifically"), designed, developed, and field-tested a curriculum and interactive learning experience to teach students the essential elements of infectious disease transmission (available at http://nih-midasedu.santafe.edu). This case study presents the Repast Simphony statecharts-based model of CA-MRSA that was developed as part of the curriculum. Here we describe the specifics of the model and demonstrate the benefits of coupling the state-based logic with the simplicity of Repast Simphony ReLogo.
- 4.4
- The CA-MRSA model extends agent-based compartmental models
for infectious diseases, including susceptible, infected, and recovered
(SIR) disease state models and susceptible, infected, susceptible (SIS)
disease state models. These models are often used to demonstrate
concepts of infectious disease spread for middle-school- and
high-school-aged students in the United States. In order to model
CA-MRSA, the following additions were made to the compartmental models
by using ReLogo and statecharts:
- Inclusion of an asymptomatic colonized state. With respect to MRSA, agents can be in one of three states: susceptible (or uncolonized), colonized, and infected. Colonized agents carry MRSA on their skin, are asymptomatic, and can colonize others without knowing they are colonized. Infected agents have visible infections and may be more contagious than colonized agents. It is assumed that susceptible agents can get to the infected state only by first passing through the colonized state, and both colonized and infected agents can cause colonization in susceptibles.
- State and behavior-dependent disease state duration. Colonizations can last anywhere from a few days to a few months. Infections tend to last between one to three weeks and can depend on whether the infected agent seeks medical attention.
- Activity-dependent transmission risks. Agents engage in different types of activities in different locations, with differing transmission risks associated with those activities. For example, physical contact may be more prevalent in a home environment than in a school environment, a detail that is very important in modeling CA-MRSA, which is transmitted via direct skin-to-skin contact.
- Daily agent schedules. Agents have daily schedules, which dictate, for example, when they are at home or in a particular classroom at school. Including the agents' schedules of hourly activities within the day allows the model to better utilize existing information on disease transmission.
- Individual decision-making. Since medical attention greatly reduces the length of the infection, an agent's decision whether to self-care or to seek medical attention can affect the progression of MRSA in the agent population. A model that incorporates these behavioral differences among agents can allow for the exploration of different interventions designed to reduce the incidence of MRSA.
- Disease-state-based transmission probabilities. The likelihood of a susceptible agent being colonized depends on the disease states of the agents with whom the agent has contact. The probability that an infected agent colonizes a susceptible agent is greater than the probability that a colonized agent colonizes a susceptible agent.
- 4.5
- The CA-MRSA model uses a global activities statechart to
coordinate the activities of the agents in the model (see Figure 10). The statechart is part of an
environmental ReLogo observer agent that is used to
control the overall flow of the model.
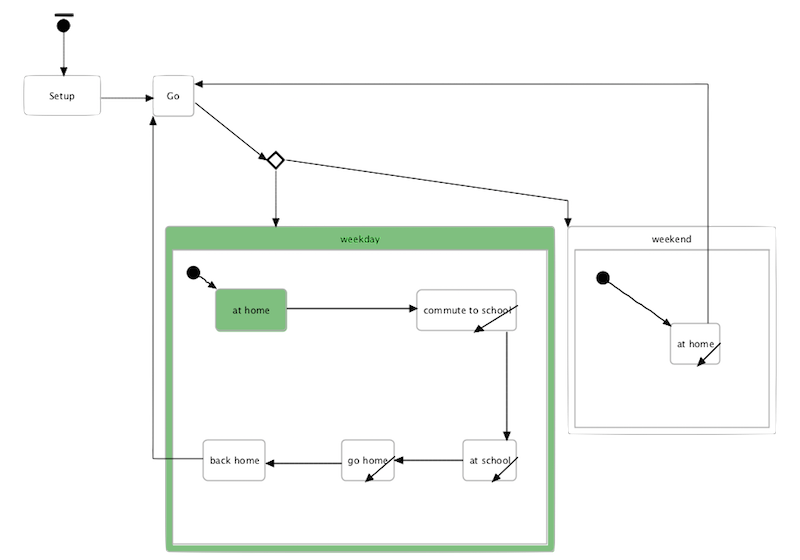
Figure 10. Model activities statechart in the CA-MRSA model. - 4.6
- Starting from the top left, the Setup state is entered, and the overall simulation is set up. After a timed transition, the Go state is entered; it initiates the main loop of the simulation. Each day, the branching state is entered, and depending on whether the day is a weekday or occurs on a weekend, the appropriate composite state is entered. (Figure 10 indicates that the simulation is currently in a weekday.) One simplification that the model makes is that every agent is a child of middle school to high school age. This simplification enables the weekday composite state to consist of the following states: begin at home, commute to school (all agents are instructed to go to their individual schools), be at school (all agents are at school engaging in school activities), go home (all agents leave school to go home), and then arrive back home (all agents are at home doing home activities). Each state with an internal transition (states with internal arrows) represents different repeated activities while in that state. For example, while the agents are at school, they move between classrooms at the beginning of every hour. This behavior is defined in the On Transition code block of the transition. In the weekend composite state, all the agents simply stay at home all day.
- 4.7
- Unlike the global activities statechart, each individual
agent in the model has its own disease statechart that tracks the state
and progression of CA-MRSA for that agent (see Figure 11).
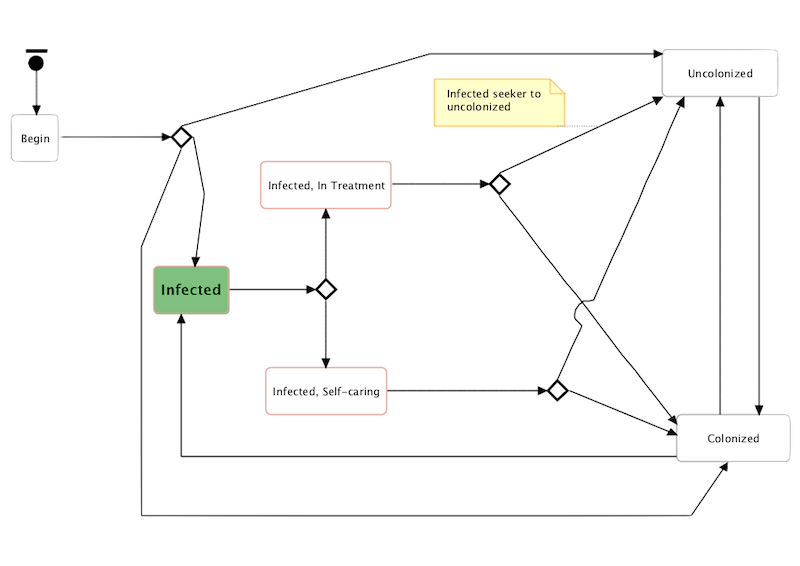
Figure 11. CA-MRSA model agent disease state progression statechart. - 4.8
- In the beginning of the simulation, each agent's disease statechart is activated and goes into the Begin state. From there, depending on the initial state of the agent (uncolonized, colonized, or infected), the appropriate transition is followed from the branching state to the correct disease state. Infected individuals will, after a set time, either seek medical attention (Infected, In Treatment state) or not seek medical attention (Infected, Self-caring state). This affects the length of time until the branching states that lead to either Uncolonized or Colonized states are reached. With specified probabilities, the agent will become either uncolonized (it completes clearing the infection) or colonized (it clears the infection but MRSA remains on its skin). Uncolonized agents will make a transition to being colonized depending on their proximity to colonized or infected agents and depending on the types of activities in which they are engaged. In this model, infected agents are twice as likely as colonized agents to make an uncolonized agent colonized. It is more likely for an uncolonized agent to become colonized being at home than being at school, since physical contact is more prevalent at home than at school. Once an agent is colonized, it remains so, until — with certain probabilities — that agent becomes either uncolonized or infected.
- 4.9
- This complicated disease progression logic is captured within a single statechart. As the model progresses, the current state of any agent can be probed and followed. Both the explanatory power and the direct translation of visual components to model logic make the statecharts approach clear. This clarity is especially relevant in this case, in which the intended audience is being introduced to both infectious disease concepts and computational concepts at the same time. The clarity of the presentation is at a premium.
- 4.10
- As indicated, the model exploits the simplicity of the
ReLogo framework as well. Using ReLogo makes it easy to specify the
model world (see Figure 12)
and elements such as agent mobility. The MRSA model's world is
separated into two areas. The bottom half of the world shows the agents
in their households. The households are represented as squares, with
colors ranging from light to dark depending on the number of agents
within each household (the more agents, the lighter the color). Each
agent is represented in the stylized shape of a person, with the color
of the person indicating the disease state (red = infected, yellow =
colonized, green = uncolonized). This model was initialized with 720
total agents: 10 were infected agents, about 100 were colonized agents,
and the rest (about 610) were uncolonized.
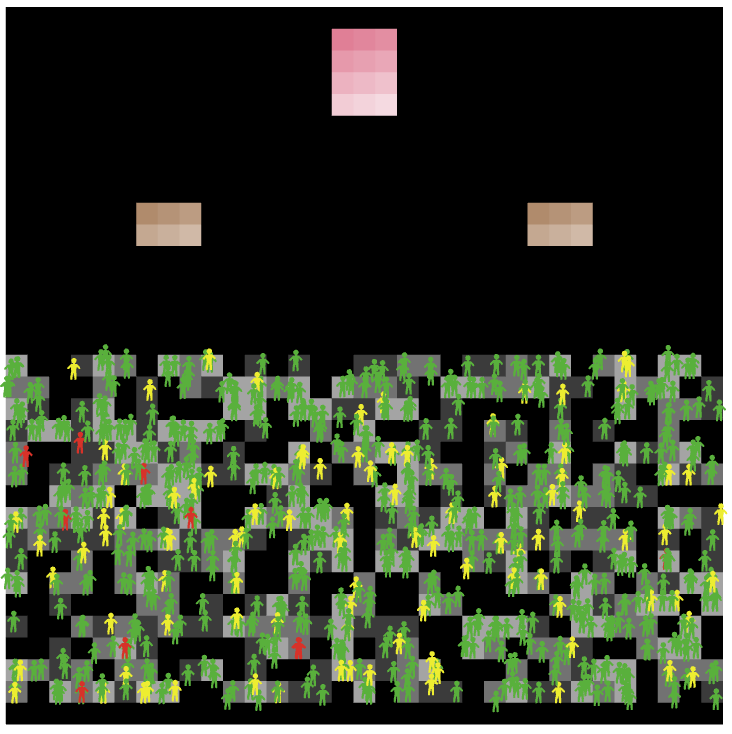
Figure 12. The CA-MRSA model's ReLogo-based model environment. - 4.11
- When the activities statechart indicates that it is time to go to school, the agents head to their schools in the top half of the world. There are two middle schools (light brown = 7th grade, darker brown = 8th grade) and a high school (pink gradations from bottom [9th grade] to top [12th grade]). Within each school, each horizontal grade is made up of three classrooms, and the agents are distributed among these classrooms. Each agent has a specific grade and a specific sequence of classrooms that it attends throughout a school day.
- 4.12
- There are some obvious simplifications found in the model. For example, there are only children agents, there are no after-school activities, and the agents stay at home throughout the weekend. However, the ability to specify some of the activity-dependent and behavior-dependent aspects of MRSA colonization and infection leads to important insights.
- 4.13
- The chart in Figure 13
shows the results of 40 different runs of the model for a period
equivalent to a year: 8,760 ticks, with each tick corresponding to an
hour. The total numbers of colonizations that occur from contacts with
infected agents (red line) and that occur from contacts with colonized
agents (yellow line) are shown. Despite the fact that infected agents
are twice as likely as colonized agents to colonize uncolonized agents,
we see that overall, more colonizations are occurring from contacts
with colonized agents. This robust result helps focus classroom
discussions on some of the challenges faced by public health officials.
Despite the higher infectivity of infected agents, the much larger
number of colonized agents appears to drive the total colonizations.
Thus, attempting to control MRSA transmission primarily through the
quarantining of infected people (a strategy that is effective for
controlling many infectious disease outbreaks) would result in only
limited success. Although the isolated infected people would be out of
circulation, the colonized people would still be colonizing the rest of
the population at high rates. The flexibility of statecharts would also
allow for many interesting additional experiments, such as modifying
the daily agent schedules, perhaps by including adaptive schedules in
which agents dynamically respond as they recognize disease states.
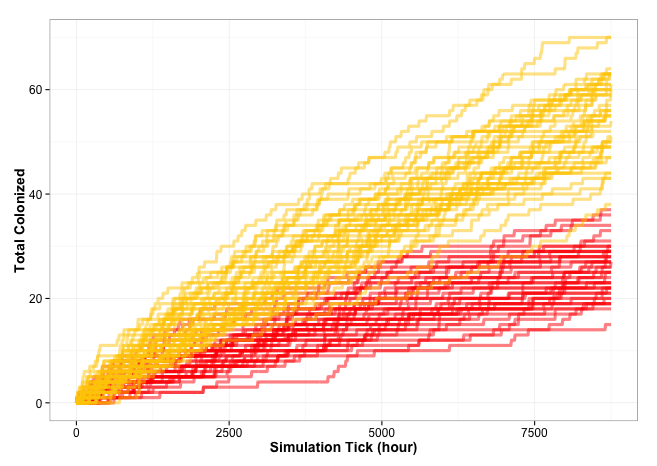
Figure 13. CA-MRSA model output showing the total number of colonizations resulting from colonized agents (yellow) versus infected agents (red) for 40 model runs, each spanning a year (8,760 hours). Case Study 2: Estimating the Life Cycle Manpower Costs of Individual Military Service Members
- 4.14
- The second case study shows how the new Repast Simphony statecharts capability can be used to create a model to analyze the life cycle cost of military manpower, focusing on U.S. Air Force officers (Combs & Ozik 2015). As an initial prototype, it is primarily intended to show Repast Simphony's capability to handle complicated statecharts, i.e., nested composite states and a variety of transition types, and illustrates the application of statecharts to large-scale and more complex systems.
- 4.15
- In an overview of its Fiscal Year 2014 budget request, the U. S. Department of Defense (DoD) reports that "The cost of military pay and allowances, combined with military health care, comprises about one-third of the Department's budget. These costs have been growing rapidly in recent years — up almost 90 percent since FY 2001 (about 30 percent more than growth in inflation), while active duty end strength has grown by less than 3 percent" (Office of the Under Secretary of Defense 2013, 1–2). Interestingly, DoD currently has no analytical framework that supports the estimation of the life cycle costs of each individual service member (Reserve Forces Policy Board 2013), yet this type of analysis is critical to senior decision making on issues such as the future composition of the military force (e.g., the number of active-duty personnel versus reservists and guardsmen). This case study shows how the new Repast Simphony statecharts capability can be used to create a military manpower life cycle cost analysis model, focusing particularly on United States Air Force (USAF) service members.
- 4.16
- The first step in capturing an Airman's manpower life cycle costs is to model a number of status-related transitions that he or she may make throughout a career. By status, we mean whether the Airman is currently working on active duty, is in the Air Reserve Component (ARC) composed of the Guard and Reserves, or is retired. If the Airman is in the ARC, we mean the type of Reservist or Guardsman. There are four types of ARC members: traditional reservist (TR), individual mobilization augmentee (IMA), air reserve technician (ART), and active guard reserve (AGR). IMAs are further divided into two categories, where category A works the equivalent of one day a month more than category B. The importance of tracking the different types of ARC Airmen is that they get paid differently in each status. For example, an ART collects both civil service and military compensation, while an AGR collects active-duty pay and allowances.
- 4.17
- Figure 14 shows
the
foundational Repast Simphony statechart representing an Airman's life
cycle. When an Airman comes into the force, he enters the composite On
Duty state. The On Duty state contains a
self-transition (lower right corner) that drives the payment of salary
and other benefits (see Figures 15
and 16). The trigger
demonstrates using a message to force some action in a statechart. In
this case, it is a "Pay Day" message sent by an environment-related
object within the model, triggering execution of the code in the On
Transition block and forcing payment of pay and benefits to
any Airman on duty.
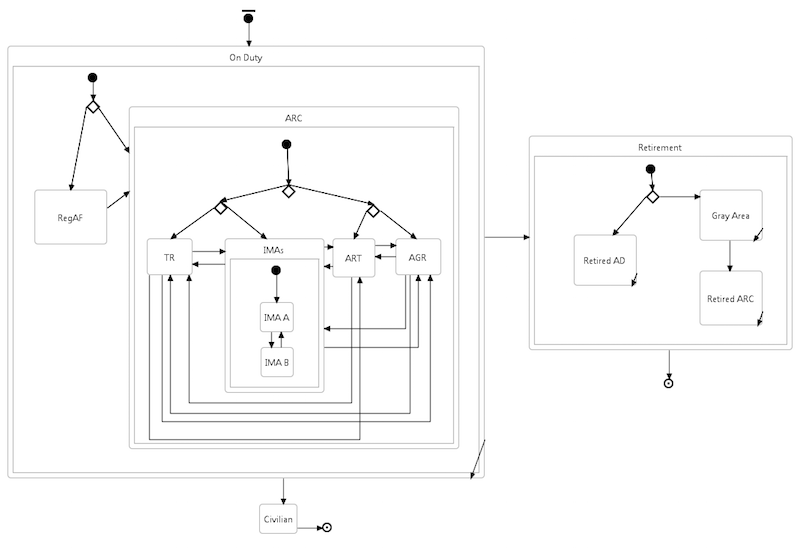
Figure 14. Statechart of Airman's life cycle. 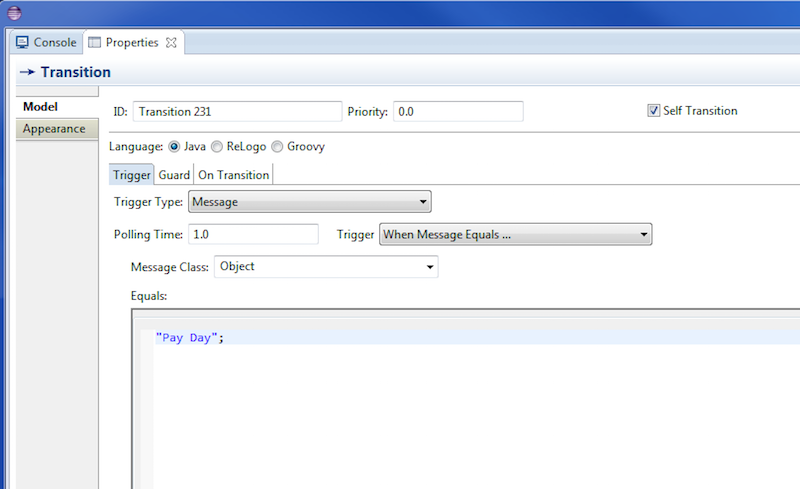
Figure 15. Message trigger activated by monthly "Pay Day" message. 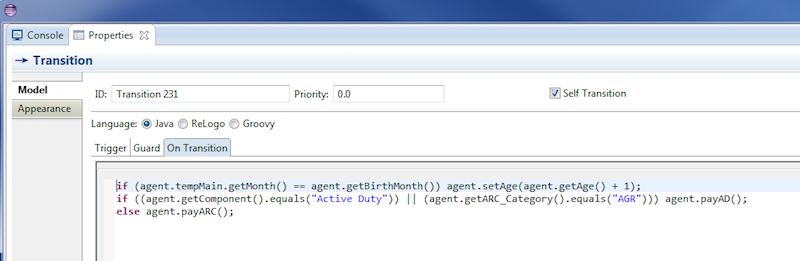
Figure 16. On Transition code that executes Airman payments. - 4.18
- The On Duty state demonstrates how Repast Simphony can handle complicated statecharts. For example, within On Duty, there is a simple state representing active duty (RegAF), and there is a composite state representing the Reserve Component, called ARC. ARC is a composite state itself, containing simple states representing TR, ART, and AGR, and another composite state representing the two types of IMAs.
- 4.19
- When an Airman enters duty, they enter the RegAF
state if they are initially active duty, or the ARC
state if in the Guard or Reserves. Upon entering the ARC state,
they immediately enter the appropriate category within ARC.
Arrows between the RegAF and ARC
states, as well as between all of the ARC categories, represent an
Airman's ability to transition between employment categories throughout
his career. These state transitions are made through the Condition
trigger type (see Figure 17),
where an Airman's component (RegAF or ARC)
and ARC category (TR, ART, AGR,
IMA-A, or IMA-B) is set in
other code within the model. Here it is assumed that once an Airman
leaves active duty, they will not return to that state.
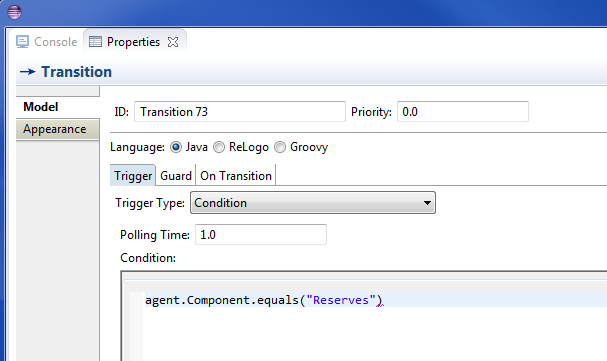
Figure 17. Condition trigger from RegAF to ARC. - 4.20
- An Airman may transition in two ways from the On Duty state. First, they can completely separate from the Air Force, in which case they enter the Civilian state and no longer accrue manpower costs. Second, they can enter the Retirement composite state once they meet eligibility requirements for an active duty or ARC retirement. Active duty and ARCs who have completed enough years of active service to start immediately earning an active-duty retirement enter the Retired AD state. The self-transition in that state triggers when the "Pay Day" message is sent, paying the members their retirement check and updating their age.
- 4.21
- Retirement-qualified ARC members initially enter a Gray
Area retirement state, in which they receive benefits such as
access to military commissaries (grocery stores) and base exchanges
(department stores). They leave this state when they reach the age of
60, moving to the Retired ARC state and collecting
full retirement benefits. The full life cycle of the retired Airman
ends when they die and move from the composite Retirement
state to a Final state, ending the accumulation of
manpower life cycle costs. Figures 18
through 25 trace one Airman's
life cycle, from entering active duty to death.
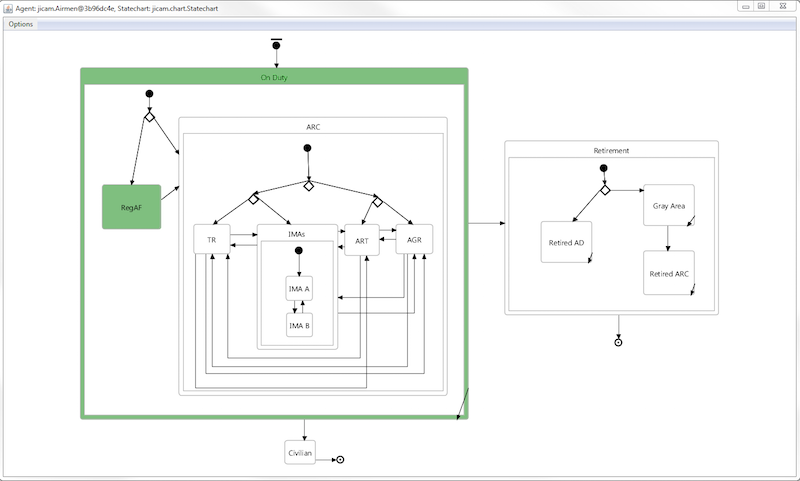
Figure 18. Airman enters Active Duty. 
Figure 19. Airman enters the Reserves as a Traditional Reservist (TR). 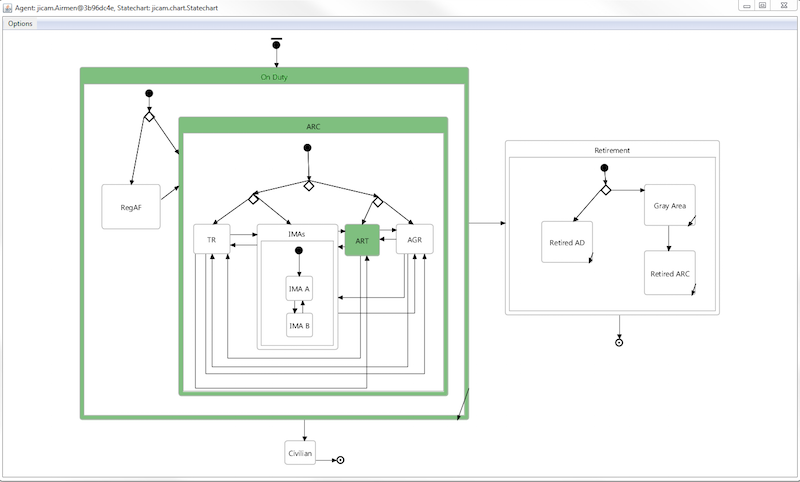
Figure 20. Airman becomes an Air Reserve Technician (ART). 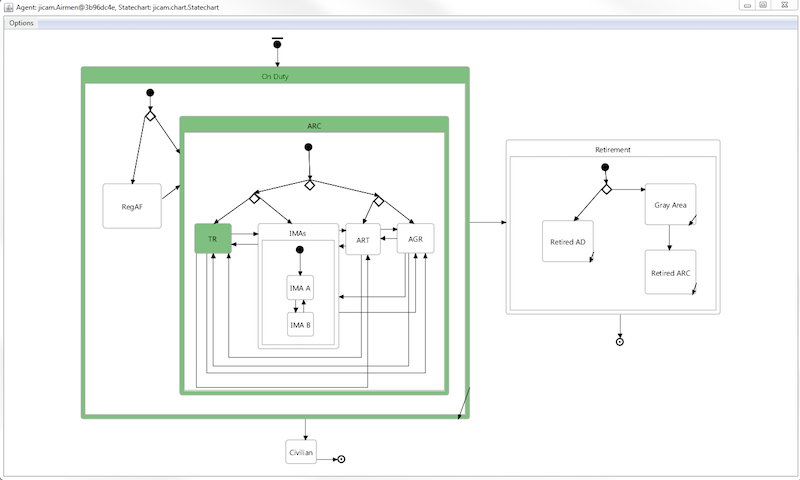
Figure 21. Airman moves back to Traditional Reservist (TR) state. 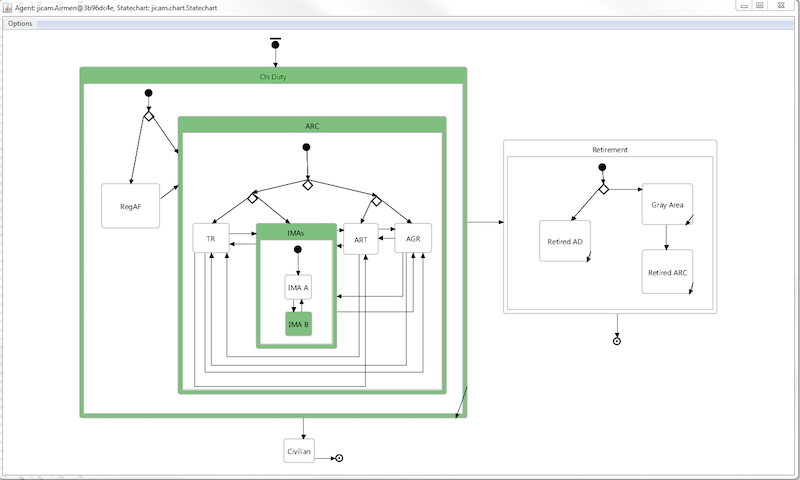
Figure 22. Airman becomes an Individual Mobilization Augmentee, Category B (IMA-B). 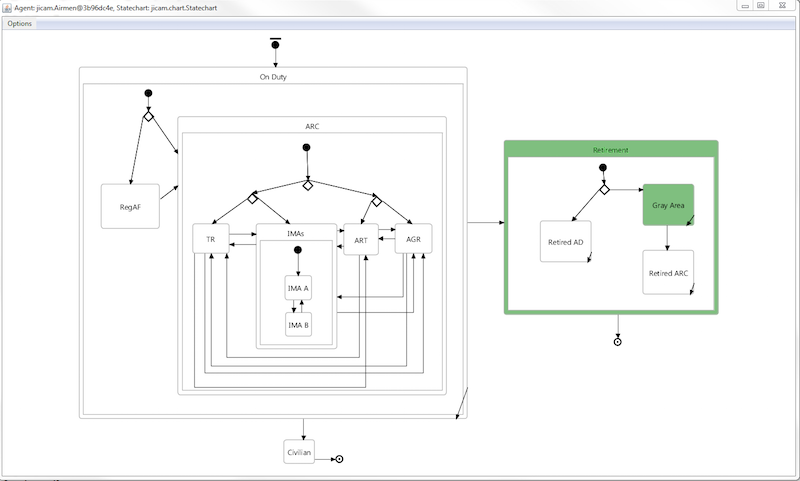
Figure 23. Airman moves into Gray Area. 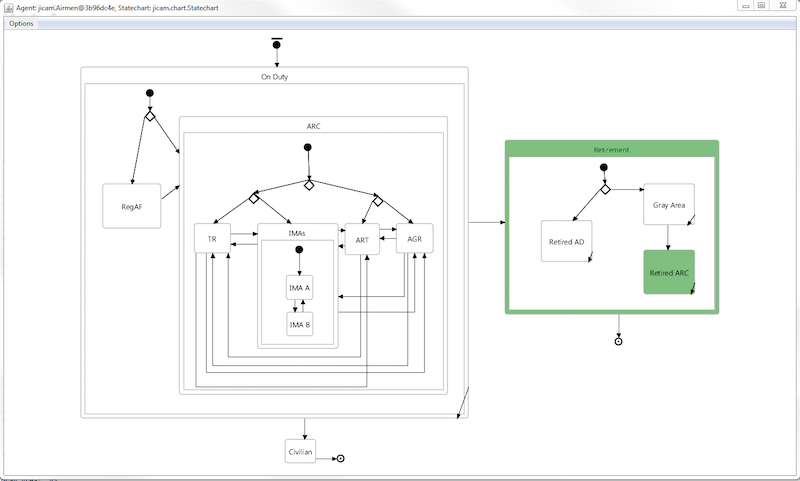
Figure 24. Airman begins collecting Reserve retirement. 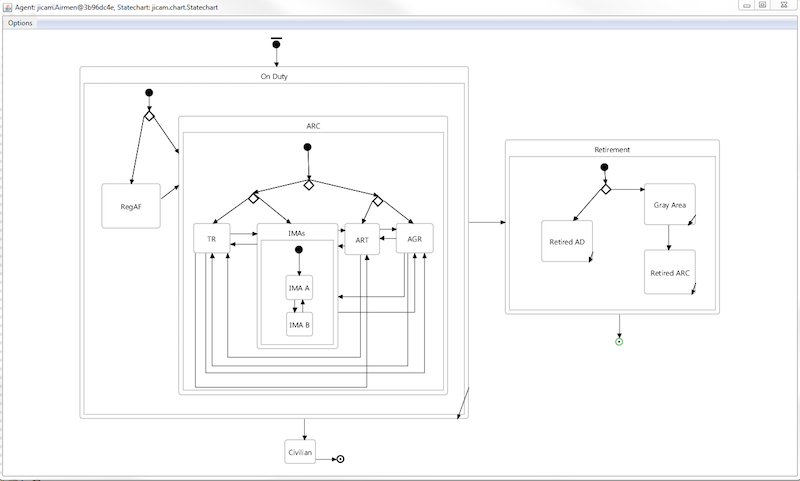
Figure 25. Airman reaches Final state. - 4.22
- We conclude this section with results from executing the developed model. We ran the model for 100 years, bringing 500 active duty and 100 new ARC members into the force each year. For the purposes of sensitivity analysis, we ran a variety of scenarios varying three parameters: 1) the seed used for the Repast Simphony random number generator, with values of 1 through 3; 2) the age at which Reservists move into full retirement and collect their retirement check, from 50 to 60 in one year increments; and 3) the retirement Cost of Living Allowance (COLA), an annual increase in the retirement pay to keep up with inflation, from 0.010 to 0.030 in 0.002 increments. Figures 26 and 27 below show the average life cycle costs for military officers completing the entire life cycle, from initial duty to death. Modeling the individual officers and his or her characteristics (e.g., RegAF or ARC, military rank, etc.) allows the estimation of manpower costs by both highly aggregate (average RegAF cost versus average ARC cost, Figure 26) and more disaggregated measures (costs by officer rank, Figure 27). Figure 26 shows that at the highest aggregate level there is little change in the average costs based on seed. This is primarily due to sample size, which is large. The output for each of the three random seed values contained 121 runs (11 retirement ages x 11 COLA) and more than 1.7 million records. Figure 27 shows more variation, e.g., the average life cycle costs of a retired major in the seed 2 run was about $200K (6%) more than in the seed 1 run.
- 4.23
- Here we note that the simulation runs were executed in parallel on the Blues high-performance cluster at Argonne National Laboratory (http://www.lcrc.anl.gov/info/Blues) using Repast Simphony's built in batch capabilities, enabling an effectively up to 363 time (i.e., 121 parameter combinations x 3 random variations) speed up when compared to running the individual simulations serially. For the presented version of the model each individual simulation took about 20 minutes to run, making the total time required for all simulations to run serially 121 hours. This dramatic speed up was possible because a Repast Simphony model that utilizes statecharts is just like any other Repast Simphony model and can therefore take advantage of the built in capabilities of the toolkit.
- 4.24
- Figure 28 shows a contour plot of ARC life cycle costs when the ARC retirement age is varied from age 50 to 60 and the retirement COLA is varied from 0.01 to 0.03. The retirement age change is made by simply changing the age in the Gray Area to Retired ARC conditional transition with the parameter value used for each run. The retirement COLA is another model input parameter that is set prior to starting each model run.
- 4.25
- Historical rates for the retirement COLA range from 0% in
recent years to up to 14.3% back in 1980 (Military
Benefits 2014). The average annual COLA over the last 25
years has been about 2.8%. Figure 28
shows that with this rate of increase, even a modest reduction of 5
years in retirement age moves costs into the upper bracket ($4.5M -
$5M). The data underlying the chart shows the costs increase about 10%,
from $4.12M to $4.54M. Government leaders would need to balance this
cost increase with the benefit of rewarding the Reserves
for the larger operational role they have played in recent history. The
Repast Simphony statecharts framework provides a free tool to support
such decision making.
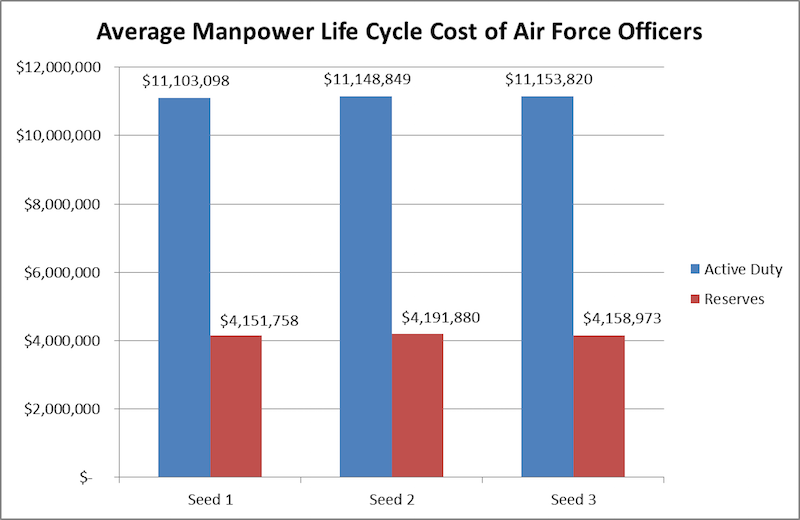
Figure 26. Average manpower life cycle costs for U.S. Air Force officer, by component and random seed. 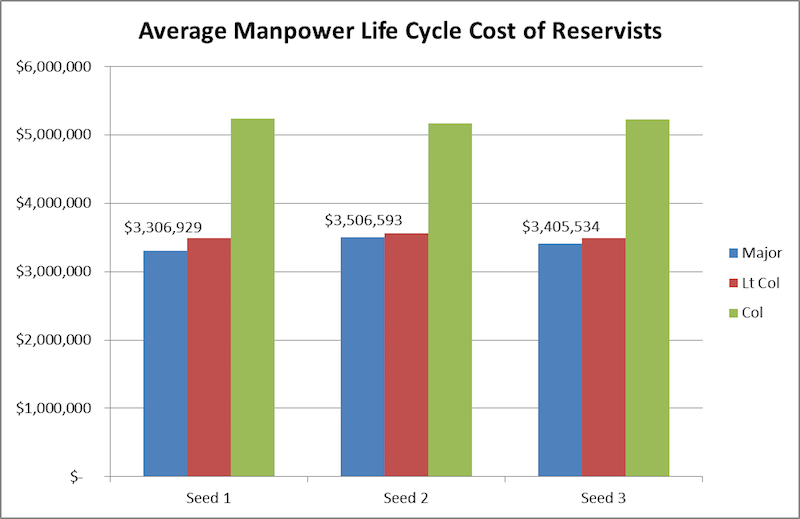
Figure 27. Average U.S. Air Force Reserves officer manpower life cycle costs by rank and seed. 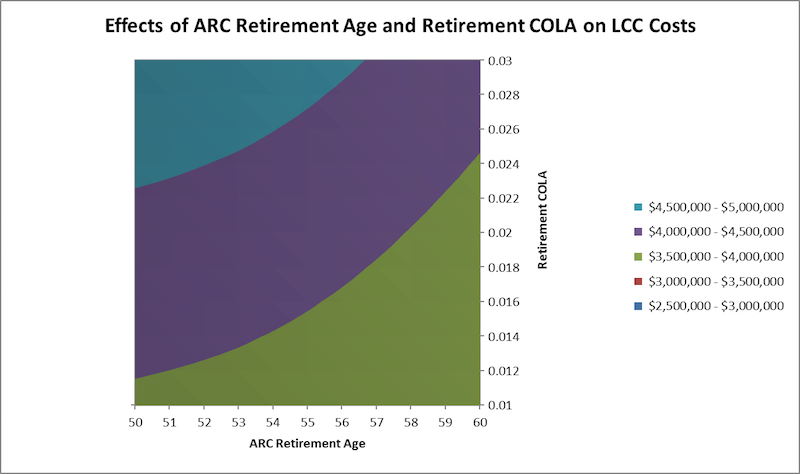
Figure 28. Effects of changing the ARC retirement age and the annual retirement cost of living allowance (COLA) on life cycle costs (LCC).
Conclusions
- 5.1
- This paper presents the recently introduced statecharts capability in Repast Simphony. Repast Simphony statecharts enable "best practice" software engineering processes, which provide transparent and formally grounded design notations that translate directly into working implementations of state-based ABSS models. Statecharts in Repast Simphony offer modeling flexibility by allowing the agent modeler to combine the most appropriate modeling paradigms, state-based and other, in order to capture the essential elements of a complex system. Statecharts are also combined with Repast Simphony ReLogo to create accessible and expressive agent-models. The statecharts editor consists of a graphical editor and a fully featured code editor. Statechart elements are created, arranged, and connected in the graphical editor. Agent actions and transition conditions are specified in the code editor, which includes intelligent auto-completion, quick and inline access to application programming interfaces, and templates to generate boilerplate code. These capabilities are freely available as part of the open source Repast Simphony distribution, lowering barriers to entry for researchers and prospective agent-modelers.
- 5.2
- We intend to explore a number of future directions. First is porting the statecharts capabilities in Repast Simphony to the Repast HPC toolkit (Repast HPC 2014). Repast HPC is a C++ high-performance-computing agent-based modeling toolkit for executing very large agent-models on Top 500 class computing resources (http://www.top500.org). Currently the statecharts framework is exclusive to the Java-based (including Groovy and ReLogo) Repast Simphony toolkit. The generality of the graphical editor and of the code generation capabilities, combined with the potential ease of mapping the statecharts engine between the object-oriented languages Java and C++, will facilitate the migration of the statecharts capabilities to run at unprecedented scales with Repast HPC. The second direction relates to the use of statecharts in agent modeling, which is still in its nascent stages. To promote the utility of this software engineering methodology in ABSS, we intend to develop useful design and process patterns (North & Macal 2014) for capturing idiomatic state-based agent behaviors.
Acknowledgements
- This work is supported by the U.S. Department of Energy under contract number DE-AC02-06CH11357, and the National Institute of General Medical Sciences, Models of Infectious Disease Agent Study (MIDAS), grant number U01GM087729.
References
- AGUIRRE, R., and Nyerges, T.
(2014). An Agent-Based Model of Public Participation in Sustainability
Management. Journal of Artificial Societies and Social
Simulation, 17(1) 7: https://www.jasss.org/17/1/7.html [doi:10.18564/jasss.2297]
ANYLOGIC COMPANY. (2014). AnyLogic Home Page. http://www.anylogic.com.
APACHE BATIK. (2014). Apache Batik SVG Toolkit Home Page. http://xmlgraphics.apache.org/batik/. Archived at: http://www.webcitation.org/6OdWX7nYc.
BITHELL, M. and Brasington, J. (2009). Coupling Agent-based Models of Subsistence Farming with Individual-based Forest Models and Dynamic Models of Water Distribution. Environmental Modelling & Software. 24: 173–190.
BROWN, D. G., Riolo, R., Robinson, D. T., North, M., and Rand, W. (2005). Spatial process and data Models: Toward Integration of Agent-based Models and GIS. Journal of Geographical Systems. 7: 25–47.
COMBS, T. and Ozik, J. (2015). Life Cycle Cost of MIlitary Manpower Model (Version 1). CoMSES Computational Model Library. Retrived from: https://www.openabm.org/model/4464/version/1.
DUBIEL, B. and Tsimhoni, O. (2005). Integrating Agent Based Modeling into a Discrete Event Simulation. In Proceedings of the 2005 Winter Simulation Conference edited by M. E. Kuhl, N. M. Steiger, F. B. Armstrong, and J. A. Joines. Piscataway, New Jersey: Institute of Electrical and Electronics Engineers (IEEE), Inc. 1029–1037.
ECLIPSE FOUNDATION. (2014a). Eclipse Home Page. http://eclipse.org. Archived at: http://www.webcitation.org/6OF0jdCSG.
ECLIPSE FOUNDATION. (2014b). Graphical Modeling Framework Home Page. http://www.eclipse.org/modeling/gmp/. Archived at: http://www.webcitation.org/6OF1DlRoB.
ECLIPSE FOUNDATION. (2014c). Eclipse Modeling Framework Home Page. http://www.eclipse.org/modeling/emf/. Archived at: http://www.webcitation.org/6OF1TzAgw.
ECLIPSE FOUNDATION. (2014d). Model To Text Home Page. http://www.eclipse.org/modeling/m2t/?project=xpand. Archived at: http://www.webcitation.org/6OF1lCev9.
FORTINO, G., and North, M. J. (2013). Simulation-based Development and Validation of Multi-agent Systems: AOSE and ABMS Approaches. Journal of Simulation, 7, 137–143. [doi:10.1057/jos.2013.12]
GAMMA, E., Helm, R., Johnson, R., and Vlissides, J. (1994). Design Patterns: Elements of Reusable Object-Oriented Software, first edition. Addison-Wesley Professional.
GROOVY ECLIPSE DEVELOPERS. (2014). Groovy Eclipse Plugin Home Page. http://groovy.codehaus.org/Eclipse+Plugin. Archived at: http://www.webcitation.org/6OF26Kd0A.
HAREL, D. (1987). Statecharts: A Visual Formalism for Complex Systems. Science of Computer Programming, 8(3), 231–274. [doi:10.1016/0167-6423(87)90035-9]
IEEE. (2012). 1278.1-2012 IEEE Standard for Distributed Interactive Simulation – Application Protocols.
IEEE. (2010). 1516TM-2010 IEEE Standard for Modeling and Simulation (M&S) High Level Architecture (HLA) – Framework and Rules.
LIANG, V. and Paredis, C. J. J. (2003). A Port Ontology for Automated Model Composition. Proceedings of the 2003 Winter Simulation Conference, edited by S. Chick, P. J. Sánchez, D. Ferrin, and D. J. Morrice. Piscataway, New Jersey: IEEE, Inc. 613–622.
MACAL, C. M., North, M. J., Collier, N., Dukic, V. M., Lauderdale, D. S., David, M. Z., Daum, R. S., Shumm, P., Evans, J. A., Wilder, J. R., and Wegener, D. T. (2012). Modeling the spread of community-associated MRSA. In Proceedings of the Winter Simulation Conference (pp. 73:1–73:12). Berlin, Germany.
MACAL, C. M., and North, M. J. (2010). Tutorial on Agent-Based Modelling and Simulation. Journal of Simulation, 4(3), 151–162, Sept. [doi:10.1057/jos.2010.3]
MEALY, G. H. (1955). A Method for Synthesizing Sequential Circuits. Bell System Technical Journal, 34(5), 1045–1079. [doi:10.1002/j.1538-7305.1955.tb03788.x]
MILITARY BENEFITS. (2014). 2014 COLA for Retired Military Veterans, Disabled & Surving Families. http://militarybenefits.info/2014-cola-for-retired-military-veterans-disabled-surviving-families/. Archived at: http://www.webcitation.org/6TZ0966kB.
MOORE, E. F. (1956). Gedanken-experiments on Sequential Machines. Automata Studies: Annals of Mathematical Studies. Princeton University Press, Princeton, New Jersey, USA (34), 129–153.
NORTH, M. J., and Macal, C. M. (2014). Product and Process Patterns for Agent-based Modelling and Simulation. Journal of Simulation, 8(1), 25–36. [doi:10.1057/jos.2013.4]
NORTH, M.J., (2014) A Time and Space Complexity Analysis of Model Integration. Proceedings of the 2014 Winter Simulation Conference, IEEE/ACM, Savannah, GA (In Press for December 2014).
NORTH, M. J., Collier, N. T., Ozik, J., Tatara, E. R., Macal, C. M., Bragen, M., and Sydelko, P. (2013). Complex adaptive systems modeling with Repast Simphony. Complex Adaptive Systems Modeling, 1(1), 3. [doi:10.1186/2194-3206-1-3]
NORTH, M. J., Tatara, E., Collier, N. T., and Ozik, J. (2007a). Visual Agent-based Model Development with Repast Simphony. In Proceedings of the Agent 2007 Conference on Complex Interaction and Social Emergence. Argonne, Illinois: Argonne National Laboratory. http://www.dis.anl.gov/agent20XY/proceedings/Agent2007.pdf. Archived at: http://www.webcitation.org/6OdYPzRgx.
NORTH, M. J., Howe, T. R., Collier, N. T. and Vos, J. R. (2007b). A Declarative Model Assembly Infrastructure for Verification and Validation. In Advancing Social Simulation: The First World Congress edited by S. Takahashi, D.L. Sallach and J. Rouchier. Springer, Heidelberg, FRG. 129–140.
NORTH, M. J., Sydelko, P., Vos, J. R., Howe, T. R. and Collier, N. T. (2006). Legacy Model Integration with Repast Simphony. Proceedings of the Agent 2006 Conference on Social Agents: Results and Prospects edited by D. L. Sallach, C. M. Macal, and M. J. North. Argonne National Laboratory, Argonne, IL USA. 95–106.
OFFICE OF THE UNDER SECRETARY OF DEFENSE (COMPTROLLER). (2013). Overview, United States Department of Defense Fiscal Year 2014 Budget Request. In Department of Defense Fiscal Year 2014 Budget Request. http://comptroller.defense.gov/Portals/45/Documents/defbudget/fy2014/FY2014_Budget_Request_Overview_Book.pdf. Archived at: http://www.webcitation.org/6OdX1HrAM.
OMG. (2009). OMG Unified Modeling Language (OMG UML), Superstructure Version 2.2. Needham, Massachusetts: Object Management Group.
OZIK, J., and Collier, N. (2014). Repast Simphony Statecharts Guide. http://repast.sourceforge.net/docs/Statecharts.pdf. Archived at: http://www.webcitation.org/6OdVbdp3h.
OZIK, J., Collier, N., Murphy, J. T., and North, M. J. (2013). The ReLogo Agent-based Modeling Language. In WSC 2013 Proceedings. Washington, D.C. http://informs-sim.org/wsc13papers/includes/files/136.pdf.
OZIK, T., Macal, C. M., Letendre, K. and Lee, I. (2015). CA-MRSA Demonstration Model (Version 1). CoMSES Computational Model Library. Retrived from: https://www.openabm.org/model/4466/version/1.
POLHILL, J. G., Izquierdo, L. R., and Gotts, N. M. (2005). The Ghost in the Model (and Other Effects of Floating Point Arithmetic). Journal of Artificial Societies and Social Simulation, 8(1) 5: https://www.jasss.org/8/1/5.html.
REPAST HPC. (2014). Repast for High Performance Computing Home Page. http://repast.sourceforge.net/repast_hpc.php. Archived at:http://www.webcitation.org/6OdXjTT6S.
REPAST SIMPHONY. (2014a). Repast Simphony Home Page. http://repast.sourceforge.net/repast_simphony.php. Archived at: http://www.webcitation.org/6OdRqSeUN.
REPAST SIMPHONY. (2014b). Repast Simphony License. http://repast.sourceforge.net/license.php. Archived at: http://www.webcitation.org/6OdWI4CH2.
RESERVE FORCES POLICY BOARD. (2013). Eliminating Major Gaps in DoD Data on the Fully-Burdened and Life-Cycle Cost of Military Personnel: Cost Elements Should Be Mandated by Policy. http://ra.defense.gov/rfpb/_documents/RFPB_Cost_Methodology_Final_Report_7Jan13.pdf. Archived at: http://www.webcitation.org/6OdXUmGcq.
SHANNON, C. E. (1948). A Mathematical Theory of Communication. Bell System Technical Journal, 27(3), 379–423 and 27(4), 623–656. [doi:10.1002/j.1538-7305.1948.tb00917.x]
SIEBERS, P., and Aickelin, U. (2011). A First Approach on Modelling Staff Proactiveness in Retail Simulation Models. Journal of Artificial Societies and Social Simulation, 14(2) 2: https://www.jasss.org/14/2/2.html.
TEOSE, M., Lu, Z., Ahmadizadeh, K., Ellner, S. P., O'Mahony, E., Gomes, C., Smith, R. L., and Grohn, Y. (2011). Embedding System Dynamics in Agent Based Models for Complex Adaptive Systems. In Proceedings of the Twenty-Second International Joint Conference on Artificial Intelligence. 2531–2538.
VANGHELUWE, H., de Lara, J., and Mosterman, P. J. (2002). An Introduction to Multi-paradigm Modelling and Simulation. In Proceedings of the AIS 2002 Conference, edited by F. Barros and N. Giambiasi. Lisboa, Portugal. 9–20.
VANGHELUWE, H. and de Lara, J. (2003). Computer Automated Multi-Paradigm Modelling: Meta-Modelling and Graph Transformation. In Proceedings of the 2003 Winter Simulation Conference, edited by S. Chick, P. J. Sánchez, D. Ferrin, and D. J. Morrice. Piscataway, New Jersey: Institute of Electrical and Electronics Engineers, Inc. 595–603.
VILLA, F. (2001). Integrating Modelling Architecture: A Declarative Framework for Multi-Paradigm, Multi-Scale Ecological Modeling. Ecological Modelling. 137: 23–42.
VILLA, F. and Costanza, R. (2000). Design of Multi-Paradigm Integrating Modelling Tools for Ecological Research. Environmental Modelling & Software. 15: 169–177.
YAKINDU COMMITTERS. (2014). Yakindu Home Page. http://statecharts.org/index.html. Archived at: http://www.webcitation.org/6OF0WR7sV.
ZEIGLER, B. P., Praehofer, H., and Kim, T. G. (2000). Theory of Modeling and Simulation: Integrating Discrete Event and Continuous Complex Dynamic Systems, second edition. San Diego, California: Academic Press.