
 Abstract
- Scholars and urban planners have suggested that the key characteristic of leading world cities is that they attract the highest quality human talent through educational and professional opportunities. They offer enabling environments for productive human interactions and the growth of knowledge-based industries which drives economic growth through innovation. Both through hard and soft infrastructure, they offer physical connectivity which fosters human creativity and results in higher income levels. When combined with population density, socio-economic diversity and societal tolerance; the elevated interaction intensity diffuses creativity and improves productivity. In many developing country cities however, rapid urbanization is increasing sprawl and causing deteriorating in public services. We operationalize these insights by creating a stylized agent-based model where heterogeneous and independent decision-making agents interact under the following three scenarios: (1) improved urban transportation investments; (2) mixed land-use regulations; and (3) reduced residential segregation. We find that any combination of these scenarios results in greater population density and enables the diffusion of creativity, thus resulting in economic growth. However, the results demonstrate a clear trade-off between rapid economic progress and socioeconomic equity mainly due to the crowding out of low- and middle-income households from clusters of creativity.
- Keywords:
- Developing Countries, Urban, Segregation, Land Use, Transport, Agent-Based Modeling
Introduction
- 1.1
- Throughout the world, many urban centers are the drivers of economic growth and hubs of innovation. In major cities, the enhanced "human capital accumulation" resulting from the socioeconomic diversity of residents underlies this reality (Lucas 1988). Not only is more than half of the worlds population now urbanized, but by 2030 all regions including Africa and Asia will see the majority of their populations living in cities (United Nations 2007). While the economic opportunities from this transformation are unprecedented, governments must provide enabling policy environments for "enhanced productivity" that would turn cities into "poverty fighters" in the developing world (UN-Habitat 2010).
- 1.2
- Some of the most prosperous cities around the world, the likes of London and New York, are also the foremost hubs of human creativity and innovation. They attract top talent by offering not only the best professional and educational opportunities, but also high quality entertainment amenities (e.g. theaters, parks and art galleries) and public services (e.g. education, health and transit). Cities where appropriate policies avoid exclusionary development and rent-seeking, societies tend to become more inclusive. They provide residents the opportunities for economic and social assimilation along with universal access to basic urban services (UN-Habitat 2010). Florida (2002) terms such cities as 'creative' and the primary drivers of sustained economic progress. But in many rapidly urbanizing developing countries, melting pots for thinkers and creative innovators to thrive are lacking (Florida et al. 2011). Contrary to leading world cities that are increasingly embracing smart growth through mixed land-use, walkability and greater density; many of these cities are moving toward low-density sprawl, gated communities and generally poor public transportation coverage (Henderson 2002). This type of urban development contradicts Jacobs' (1961) widely respected view that cities are essentially "people systems" and hence should not be planned as mere networks of brick and mortar.
- 1.3
- In this paper, we adapt Kaldor's (1957) widely adapted assertion that the starting point for theory building is establishing relevant stylized facts, i.e. empirically grounded realities which are broadly generalizable but are accompanied with some exceptions. By assembling such facts from urban economics, regional science and economic geography literatures (as further discussed below), we explore the impact of population density, urban mobility and societal tolerance on levels of human interaction and socioeconomic outcomes. As with others such as Heine et al. (2005) and Meyer (2011), we design an artificial environment from stylized facts to simulate key findings from empirically grounded theoretical contributions focusing on the dynamic processes underlying the emergence of economically productive clusters within cities. Moreover, given their ability to abstract real-world social systems through simple individual level behavioral rules, agent-based models (ABMs) offer an alternative to conventional urban and regional modeling tools. They allow us to turn our attention away from macro models which are comparatively static in nature to models which are highly dynamic and operate at the micro scale (Batty 2005). We therefore create a stylized virtual abstraction of a theoretical city containing autonomously interacting agents under various scenarios to draw insights into the workings of dynamic urban systems.
- 1.4
- More specifically, we explore the following questions: what are the key factors inhibiting the emergence of creative clusters in many cities in the developing world? What kinds of spatial urban forms and socioeconomic conditions could facilitate their emergence? Several empirically grounded theories suggest that the following three features are necessary for creative urban environments: mixed land-use and population density (Glaeser 2011; Knudsen et al. 2008), affordable urban and regional mobility (Lucas & Rossi-Hansberg 2002; Drennan & Kelly 2011) and high levels of societal tolerance (Florida & Mellander 2010; Page 2008). Therefore, we hypothesize that ceteris paribus, favorable combinations of these conditions will likely foster creative urban environments resulting in enhanced economic productivity. The purpose of this model therefore is not to test the validity of these theories, but to introduce a tool for exploring the dynamic socioeconomic processes within urban environments.
- 1.5
- Therefore, the remainder of this paper is organized as follows. The background section provides the intellectual platform underlying the modeling approach and highlights the key advantages offered by ABMs toward enhancing our understanding of the dynamic socioeconomic processes within cities. Thereafter, the fundamental building blocks of the Creative City Model are introduced followed by a sensitivity analysis for verifying model consistency with qualitative insights from real-world cities. A series of theoretically motivated experiments are then discussed to better understand the interrelationship between model parameters. We then conclude by summarizing key model outputs, linking them with theoretical perspectives discussed throughout the paper and outlining an agenda for the future development of this model.
Background
- 2.1
- Economic growth theory was significantly influenced by Romer's (1990) work on endogenous growth, which argued for moving beyond land, capital and labor as the chief determinants of economic progress. The relationship between long-term productivity and human capital indicators, in particular educational attainment, is widely documented in macroeconomic theory (Barro 2001). Likewise, Krugman's (1991) work on the spatial structures of economics brought agglomeration effects into the limelight, and became the starting point for the literature on new economic geography. These ideas influenced leading multilateral agencies, notably the World Bank (2009) and the Organization for Economic Cooperation and Development (2006), to begin emphasizing the need to understand territoriality in the economic growth debate. In terms of policy advice, this implied advocacy for the need to maximize the benefits of agglomeration by reducing the inefficiencies caused by congestion. In other words, as cities and regions experience agglomeration effects and firms begin to cluster, urban areas come under increasing pressure to maintain adequate public service standards (Henderson 2002).
- 2.2
- Within this realm, Florida's (2002) "theory of the creative class" has attracted significant attention and criticism, both on methodological and policy grounds (Glaeser 2005; Peck 2005; Marcuse 2003). It has also triggered a lively debate on the merits of the intellectual foundations of his ideas thorough empirical studies, broadly in the areas of regional science and economic geography (e.g. Qian 2013; Niebuhr 2010; Knudsen et al. 2008). While the term 'creativity' has many connotations across disciplines, in this paper we use it notionally to conceptualize the relationship between urban morphology and economic productivity through human interactions with each other and their environment. Moreover, Storper and Scott (2009) classify Florida's (2002) ideas as merely one of three competing perspectives on the drivers of urban economic performance alongside Glaeser's (2011) focus on human capital and Clark et al.'s (2002) thrust on urban amenities. However, the purpose of this paper is not to make a contribution in this literature, but rather to expand upon its theoretical foundations by way of ABM.
- 2.3
- For the purposes of model building, therefore, we focus on theoretical studies informed by empirical data and reorganize the discussion into three interrelated factors dictating urban form and function: mixed land-use, urban mobility, and societal tolerance. In the rest of this section, therefore, we present background arguments explaining their inclusion as stylized facts which then become underlying rules of interaction for the simulation. These arguments are bound together by the common thread of human capital and knowledge spillovers, both of which have been established as drivers of economic productivity in a wide body of literature (e.g. Boschma & Fritsch 2009; Qian & Stough 2011; Simon 1998; Rauch 1993). In other words, we hypothesize that any combination of these factors facilitating frequent interactions between talented urbanites will result in economic growth, mainly through innovation.
- 2.4
- The diversity of land-uses within cities results in greater population density, which has both positive (e.g. innovation, entrepreneurship) and negative (e.g. crime, disease) repercussions for urban environments. Economists have long argued that under conditions of high human capital endowments, the density of human interaction propels economic activity (e.g. Marshall 1890; Lucas 1988). In recent years, a plethora of studies testing the micro-foundations of this theory have found that a doubling of employment density (available jobs per unit area) is associated with 2 to 6 percent rise in productivity (Combes et al. 2010; Ciccone 2002; Baldwin et al. 2010). Similarly, Knudsen et al. (2008) test knowledge spillovers in cities using the concept of "creative density" that combines population density with the "creativity" of the workforce. By undertaking panel regressions on data from 240 U.S. metropolitan regions, they find that the density of interactions is associated with high levels of economic productivity. Furthermore, Storper and Venables (2004) argue that under conditions of imperfect information, in-person interactions become the direct determinants of economic performance, despite the tremendous progress in communication technologies.
- 2.5
- In most megacities around the world, however, the potential productivity gains from easy in-person interactions are limited by congestion. This is often caused by a multitude of interrelated reasons including rapid increases in car ownership with modernization and supporting (intended or otherwise) public policies. Today, suburban households enjoy larger landholdings with subsidized mortgage rates, vast networks of highways, affordable fuel prices and higher quality public schools (Glaeser 2011). The cost of this urban form, however, is the need to commute longer distance between suburban homes and downtown workplaces. Cities around the world, therefore, face the challenge of overcoming this "tyranny of distance" through accessible and affordable transportation systems (Atkinson 1998). By using 90 socioeconomic and transport related variables for over 300 U.S. metropolitans for instance, Chatman and Noland (2014) find that a 10 percent improvement in public transport supply is associated with an average net productivity benefit of $45 million. Moreover, infrastructure investments including those in public transportation represent a major priority for donors and governments in rapidly urbanizing developing countries, particularly in Asia and Africa (World Bank 2009).
- 2.6
- The assertion that innovation is driven by in-person interactions (Hall 1998) explains why most real-world cities follow Alonso's (1964) bid-rent framework. In an empirical study of 120 major office markets in the U.S. over a period of 18 years, Drennan and Kelly (2011) find that per unit rents are considerably higher in central business districts as compared to suburbs due to the productive value of human interactions. Notwithstanding the fact that certain sectors like financial services experience greater productivity gains under such conditions, the generally positive correlation between agglomeration and land rents remains firmly established in the academic literature (see among others Koster and Rouwendal (2012); Berry and Glaeser (2005); Shapiro (2006) for reference). The constant tension between centrifugal (causing sprawl) and centripetal (encouraging density) forces in metropolitan regions (Colby 1933) has spurred the "new urbanism" movement which favors car-free living through walkable neighborhoods (Duany et al. 2001). Building on Mumford's (1961) arguments that urban sprawl had broken the relationship between people and their living spaces, the anti-sprawl movement has promoted "smart growth" as the alternative (Porter 2002). Through transit-oriented development and walkability, it is believed this paradigm of urban growth fosters greater human interaction which is the key function of cities (Jacobs 1961).
- 2.7
- Unsurprisingly therefore, in the history of urban civilizations, socio-ethnic and religious tolerance fostered scientific and economic advancements through free interactions between diverse groups of individuals (Mumford 1961). In emphasizing the need for creating unique brand identities of cities therefore, Landry (2000) suggests that socioeconomic diversity is essential for cities to remain "widely creative" with residents finding the "mix of imaginations required for the emerging complexities or urban life." Being inherently social creatures, humans thrive in conditions facilitating their desire for social interaction under tolerant conditions. A range of empirical studies demonstrate the positive association of societal tolerance with innovation and entrepreneurship (Knudsen et al. 2008; Page 2008; Audretsch et al. 2010). For instance, in an empirical study of 331 U.S. metropolitan regions, Florida and Mellander (2010) find a positive correlation between the proportion of gay and lesbian individuals and vital socioeconomic statistics including rental values of land and per capita income. In their widely respected empirical examination of changing cultural values over three decades across dozens of countries, Inglehart and Welzel (2005) found a robust connection between levels of societal tolerance (including toward gays) and the development of their democratic and economic systems. The primary theaters where these interactions play out are undoubtedly urban areas which are now steadily increasing their economic footprint in the developing world.
- 2.8
- By viewing cities as complex adaptive systems, much like natural systems, we gain unique perspectives into their inner-workings through ABMs. The key definitional idea in complex systems is to observe global phenomena through local-level interactions (Batty 2005) as their richness depends on agent adaptions following interactions. The idea of viewing cities as complex systems originates from Jacobs (1961) whose views at the time triggered an intellectual movement against traditional, top-down urban planning approaches. Gradually, the idea that cities are organically growing systems gained ground, propelled by Alexander's (1964) argument that top-down planning processes were merely an artifact of post industrial revolution economic development. In essence, cities are non-hierarchical and non-linear systems where millions of residents depend on hundreds of simultaneously operating subsystems to sustain their daily routines. Like complex systems in nature, elements within urban systems cannot be explained by linear mathematical models as they exhibit emergence (Batty 2005). In other words, cities as a whole are greater than the sums of their constituent parts, which can only be explained by the underlying dynamism of their socioeconomic environments. One way to explore such complex systems is through ABMs, which simulate social systems from the bottom-up, thus allowing the emergence of previously unexpected macroscopic phenomenon from individual level interactions.
- 2.9
- ABMs have been applied to study a variety of urban issues, including housing and land markets (Filatova et al. 2009), informal settlement growth (Patel et al. 2012), crime reduction (Rauhut & Junker 2009), humanitarian assistance (Crooks & Wise 2013), vehicle movement (Bjornskau 2005), location theory (Sasaki & Box 2003) and the evolving landscapes of cities (Batty 2001). They have the distinct advantage of contributing towards "theory building" and "hypothesis generation" (Crooks & Heppenstall 2012). Their explanatory power goes beyond correlations and causations, enabling the identification of specific factors dictating seemingly inexplicable agent behaviors (Epstein 2007). They typically feature several individual-level parameters affecting the decision-making of each heterogeneous agent, as they have the unique ability to handle numerous parameters simultaneously.
- 2.10
- Within the growing ABM literature however, little attention has focused on the relationship between urban morphology and economic growth from the lens of creativity, barring two recent contributions. Through an agent-based simulation of the creativity diffusion process using social network analysis, Spencer (2012) asserts that diversity in large physical areas fosters the diffusion of creative ideas. He utilizes stylized facts from social psychology, network analysis and economic geography literatures to understand the dynamic interaction between physical locations, social networks and their economic implications. In addition, Liu and Silva (2013) attempt to understand creativity diffusion by modeling the market dynamics between firms attempting to locate closer to potential workers and households searching for affordable dwellings to occupy. While applying the model to the city of Nanjing, they do not enhance our understanding of the dynamic processes underlying the emergence of creative clusters. Building on Porter's (1998) concept of specialized clusters of firms, De Propris and Hypponen (2008) define 'creative clusters' as urban spaces where highly talented people gravitate in large numbers with the common interest of creating novelty. They catalyze idea generation through diversity and freedom of expression resulting in higher economic productivity. Therefore, the Creative City Model presented below is designed with agents having multiple attributes enhancing the model's ability to capture the nuances of dynamic urban environments and to explore in greater detail the formation of creative clusters. In addition, it allows users to have complete control over input parameters for each simulation run, thereby engaging users in the model's logic flow.
The
Creative City Model
- 3.1
- In the interest of theory building, the Creative City Model is largely theoretical albeit spatially explicit, i.e. it operates over a cellular landscape and distance impacts on the results. The key features of the model's environment are stylized on conditions in cities of the developing world, i.e. inadequate public transportation services, infrastructure shortfalls, informality in the housing market and increasingly, sprawling high-end residential areas. The model allows us to run "thought experiments" (Axtell & Epstein 1994) for developing a more profound understanding of the processes leading to the formation of urban creative clusters.
- 3.2
- Depending on their level of abstraction, Axtell and Epstein
(1994) classify ABMs from "level 0" types that broadly caricature
real-world agent behavior to "level 3" where they are in quantitative
agreement with both the macro- and "micro-structures" of the target
system. At the current stage of development, the Creative City Model
falls in the "level 1" category for being only in qualitative agreement
with the emergent "macro-structures" of urban development. As discussed
in the experiments section, this implies that model results will be
verified by examining only qualitative insights from developing cities,
the reason for this is that most developing countries lack reliable
quantitative data (Henderson et
al. 2012). Therefore, the model is mainly designed to offer
theoretical explanations related to key ideas discussed earlier, rather
than specific predictions about the form and function of cities (Epstein 2008).
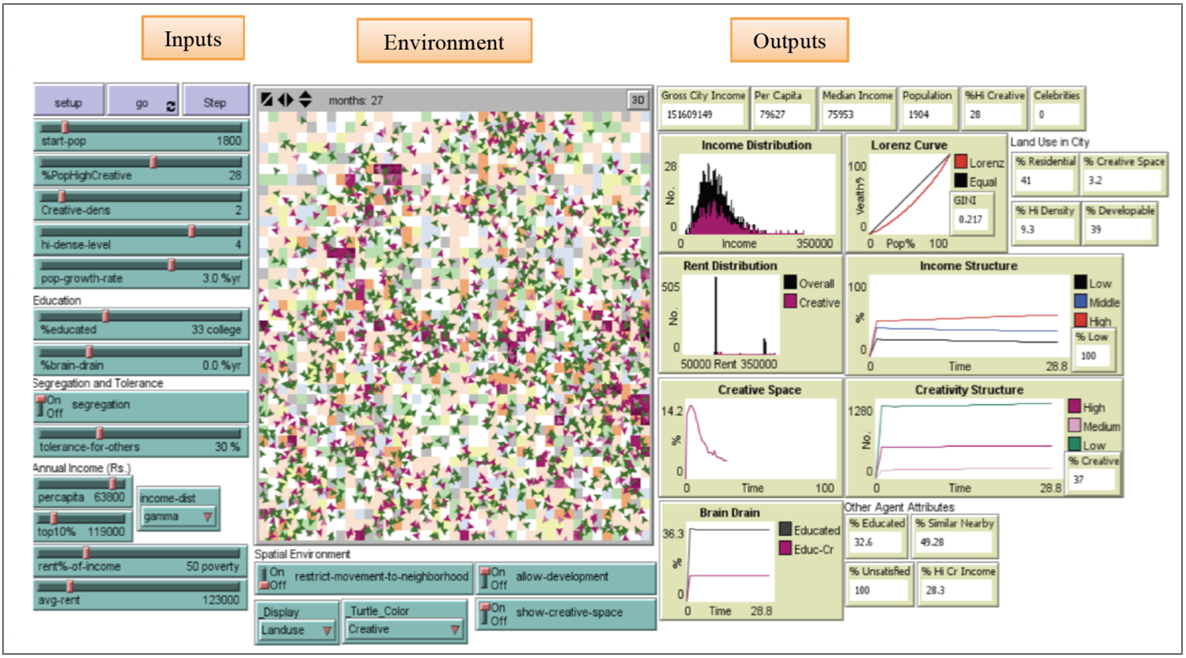
Figure 1. Creative City Model Graphical User Interface: Left Model Inputs, Center: Model Environment and Right: Model Outputs - 3.3
- As shown in Figure 1,
the model was developed using NetLogo with a simple user interface that
allows users to interact with the model by testing different scenarios
through input sliders and outcome visualizations (which will be
discussed further below). A full description of the model, its source
code and an executable file is available at
https://www.openabm.org/model/4396/version/1/view. We do this to allow
for replication and further development of the model, as advocated by
Grimm (2002). For
interested readers, we also provide a detailed description of the model
using the "ODD" (Overview, Design concepts, Details) protocol developed
by Grimm et al. (2006).
The Agents
- 3.4
- Individual heterogeneous agents are the most significant component of this model as their location decisions and rule-based interactions determine the shape and size of creative clusters. Despite the innate creativity inherent in each individual, the extent to which it is nurtured and applied in real-world settings varies considerably (Amabile 1996). In the absence of any objective metrics for quantifying human creativity (Simonton 2011), we utilize Lubart and Sternberg's (2002) operational definition that creative ideas are both novel (i.e. original, unexpected) and appropriate (i.e. useful, adaptive concerning task constraints). We then classify agents as having low, medium or high levels of creativity, which as explained later dictates their ability to form economically productive associations (Baron & Tang 2011; Matthews 2007). To further minimize subjectivity in creativity allocations at model initialization, we allow users to pre-define the proportion of highly creative individuals. The remaining agents are then equally divided between the medium- and low-creative categories, thereby creating a population characterized by varying levels of nominal creativity which is consistent with real-world urban populations (Villalba 2010).
- 3.5
- Unlike other ABMs of creativity (e.g. Spencer 2012; Liu & Silva 2013) each
agent also possesses several socioeconomic attributes which impacts
their behavior during simulation runs. For instance, the education
parameter as identified on the inputs panel in Figure 1 randomly assigns each agent as
either educated or otherwise depending on user-defined input of
education level. Upon model setup, an income distribution (a choice
between bimodal or gamma) is created around a specified average and top
ten percent income levels, thus allowing users to control both absolute
and relative prosperity. Besides individual attributes, agent behavior
is impacted by several city-level parameters including population
growth rate, societal tolerance level, rate of brain drain,
restrictions on agent mobility and mixed land-use, all of which are
discussed later. The available ranges for each parameter are determined
from the government of Pakistan's population census and a youth survey
conducted in the city of Karachi (discussed later).
The Environment
- 3.6
- We design an urban landscape that broadly replicates real-world urban land-use patterns. Since urban land-use is regulated by local government primary through zoning laws, we classify urban land as being residential, commercial, green areas, water or infrastructure. Notwithstanding the unique land-use mix of each city, combined with our desire to focus on developing country cities, we estimate the land-use structure from Karachi, Pakistan. In the absence of government issued land-use maps, we undertook close visual inspection using Google Earth imagery to estimate the land-use structure through a 40 x 40 grid representing 1,600 square kilometers of the Karachi metropolitan region. At the time of model initialization, these land-use categories are randomly applied onto the 1,600 cells constituting the model environment[1].
- 3.7
- In line with standard ABM practice, land units essentially act as interactive agents albeit without spatial mobility. Their basic attributes however, including rental price and aggregate creativity level, dictate the behavior of agents operating within them (Alonso 1964). Average annual rents are an input parameter, but vary across cells on the environment and depend on their population density and creative value (calculated by the number of high or medium creative agents) population density. As the model progresses, the spillovers from highly dense land units diffuse into the surrounding von Neumann neighborhood of 4 adjoining cells, boosting their creativity and population density (Krugman 1991). As these surrounding cells are frequented by agents with medium and high creativity, they gain creative value, thus resulting in the emergence of creative clusters.
- 3.8
- As shown in Figure 2,
the color intensity of land units indicates the density of creative
population, with darker shades representing greater creativity and
consequently, higher rents. Similarly, the triangular-looking agents
are color coded accordingly to creativity endowments with green, pink
and magenta representing low, medium and high levels respectively. In
order to capture spatial segregation of real-world cities, the
environment was divided into seven contiguous neighborhoods
constituting randomly assigned cells (inspired by the number of
Karachi's administrative zones) with some geographical overlaps.
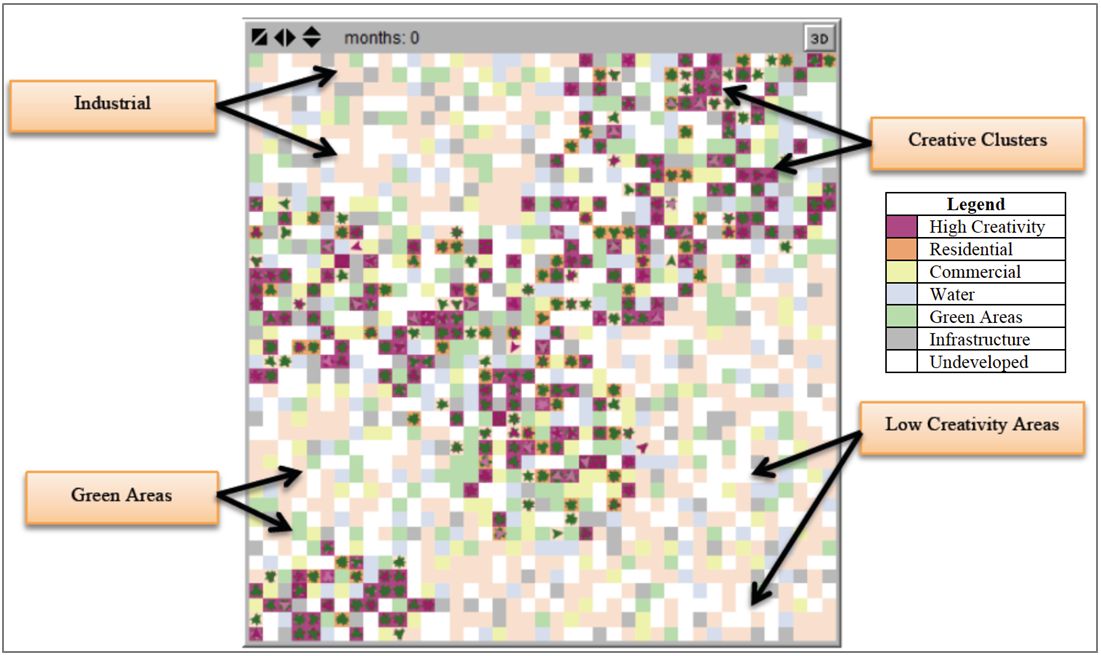
Figure 2. Creative City Model Environment Behavioral Rules
The interactions among agents and the environment are dependent on simple behavioral rules derived as stylized facts from empirical studies discussed in the background section. Depending on agent attributes and changing microscopic environmental conditions, these rules then create outcomes at the macroscopic level. While behavioral rules remain fixed throughout the simulations, users can change input values to obtain varying results at any time during a model run. The key behavioral rules are described below.Agent Mobility
- 3.9
- The movement of agents in the model is dictated by their
desire to acquire satisfaction, without which they continue moving
within the environment. The first component of satisfaction is rent
affordability (e.g. Alonso 1964),
measured by their ability to afford housing within the user-defined
rent percentage of income threshold, as defined by the following
condition:
Rim ≤ α ρim (1) Where Rm represents the monthly market rent in any given neighborhood, α represents the user-specified rent percentage of income threshold and ρm is the level of monthly income any given agent. The second determinant of satisfaction becomes relevant only when the segregation control is applied (e.g. a simple Schelling (1971) model), and requires each agent to reside exclusively in neighborhoods with similar-agent majorities. To determine similarity, each agent accesses whether the majority of agents on the eight surrounding cells are within 25 percentage points of their own tolerance level, which is assigned through user-specification. The satisfaction condition is defined as follows:
−0.875 (Tj) ≤ τi ≤ +1.125 (Tj) (2) where Tj represents the tolerance level for any given eight-cell local neighborhood and τi represents the individual tolerance levels of specific agents. Together, the satisfaction of these two conditions allows agents to reside on a given cell otherwise they continue to search for suitable residential location. In the interest of parsimony and to keep the focus of this model on creative human interactions, we do not model daily commuting patterns and their effect on residential location. Accordingly, we design each time step in the simulation to represent a month which allows greater time for creative interactions to become economically productive (Hagel et al. 2010).
Diffusion of Creativity
- 3.10
- Although every interaction among agents will not produce
economic value, its likelihood is positively associated with the level
of creativity of each interacting agent and the creative value of the
host neighborhood. This captures Florida's (2002)
most fundamental insight, i.e. urban neighborhoods endowed with mixed
land-use, walkability, transit accessibility and great public spaces
are likely to cultivate greater innovation by attracting highly
talented individuals. Because such spaces are endowed with creative
potential at the outset, agent interactions result in further elevation
of creative values (Hagel et al. 2010).
By designing an empirical model of 240 US metropolitans, Knudsen et al.
(2008) found that a
combination of population density and human creativity (they use the
term 'creative density') drives innovation-led economic growth. In
order to capture this virtuous cycle, we have created a simplified
proxy for measuring urban amenity endowments of neighborhoods, i.e. the
creative value. In essence, it is a summation of the creative values of
agents which can be expressed as follows:

(3) where CV stands for the total creative value of each cell while chn, cmn and cln represent the number of highly creative, medium creative and lowly creative agents respectively. Moreover, the total number of agents is merely a summation of the three categories of agents as follows: n = n1 + n2 + n3. Given that creativity is an inherent human characteristic (Simonton 2011), we nominally allocate one creative value point to low creativity agents, five points to medium creative, and 10 points to highly creative agents. However, cells can lose creative value if they do not continually attract creative agents (defined as having high or medium creativity levels) and as such may decay back to zero. The resulting pattern is that some creative clusters may emerge and exist for a short time span, but not all of them will persist through model runs stretching over several years which align with the ebbs and flows of real-world urban neighborhoods (Jacobs 1961).
Income and the Rental Market
- 3.11
- Real-world urban income data based on multiple countries reveals that per-capita income mostly follows a two-peak distribution, one each for lower- and upper-income stratums of society (Quah 1997). Therefore, the income of agents in the model is distributed either by gamma or bi-modal distribution, depending on user preference. At the initial setup of the model, each agent is allocated an annual income level which updates through time. First, agents who change their creativity state (this occurs after interacting with a higher creativity agent) receive a five or two percent income increase depending on their initial creativity level (medium or low respectively). This is a reflection of the real-world reality that individuals employed in innovative and high-tech professions (e.g. financial services or creative design) are generally rewarded with higher incomes (Florida 2002; Moller and Tubadji 2009; Lee 2014). Agents in the model can lose creativity if they do not experience interactions with higher creative counterparts.
- 3.12
- In representing the rental market, the model assumes that
neighborhoods with high creative values have stronger rental demand
which makes them more expensive. We obtain this insight from several
empirical studies which conclude that the accumulation of human capital
(Berry & Glaeser 2005;
Shapiro 2006; Gyourko et al. 2006) and
improvements in urban amenities (Carruthers
& Mulligan 2012; Drennan
& Kelly 2011; Hoehn
et al. 1987) increase both commercial and residential rental
values. As a consequence, poorer households are often pushed away from
the most productive urban spaces resulting in greater income
inequality, which is also one of the chief criticisms of Florida's
theory (Peck 2005).
Population Growth and Brain Drain
- 3.13
- The user-defined population growth rate, representing both
natural growth and inward migration, impacts all agents irrespective of
their creativity level. On the other hand however, brain drain is by
definition the loss of creative and educated professionals from the
workforce hence it does not impact lowly creative agents in the
population (Stark 2004).
The following equation explains brain drain in the model:
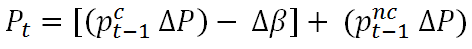
(4) where Pt represents the total agent population in the current time period, and pc and pnc represent current populations of creative and non-creative agents respectively. In addition, ΔP is the user-defined annualized population growth rate and Δβ is the rate of brain drain, the later applying only to highly creative and medium creative agents. In contrast to most industrialized countries which attract talented immigrants from abroad, the continual loss of highly qualified individuals to foreign country poses significant challenges for economic development in poorer countries (Haque 2007; Beine et al. 2007; Gibson & McKenzie 2012).
Model Logic Flow
- 3.14
- At every time increment, which for this model is notionally
defined as a single month, a series of pre-defined steps are executed.
Figure 3 presents the model's
logic structure, i.e. key reasons behind how the model progresses and
the overall decision sequence. When initialized, the model takes the
user-specified values from the interface and set up the environment and
creates the agent population. After applying population growth rate and
brain drain values to agent population in real-time, it begins
computing changes in creative spaces based on the creative agent
population (as explained later in the previous section) of each cell at
given points in time. Thereafter, agent movement causes encounters some
of which may result in economically productive partnerships such as
business ventures or consulting assignments etc. In line with the
literature discussion in above, creativity diffusion in the model
occurs when partnered agents gain inspiration from their highly
creative counterparts, thus improving their own creativity level.
Subsequently, the model assesses satisfaction for each agent,
determining whether they should continue moving or settle down.
Finally, all displays and interface values are updated and reported.
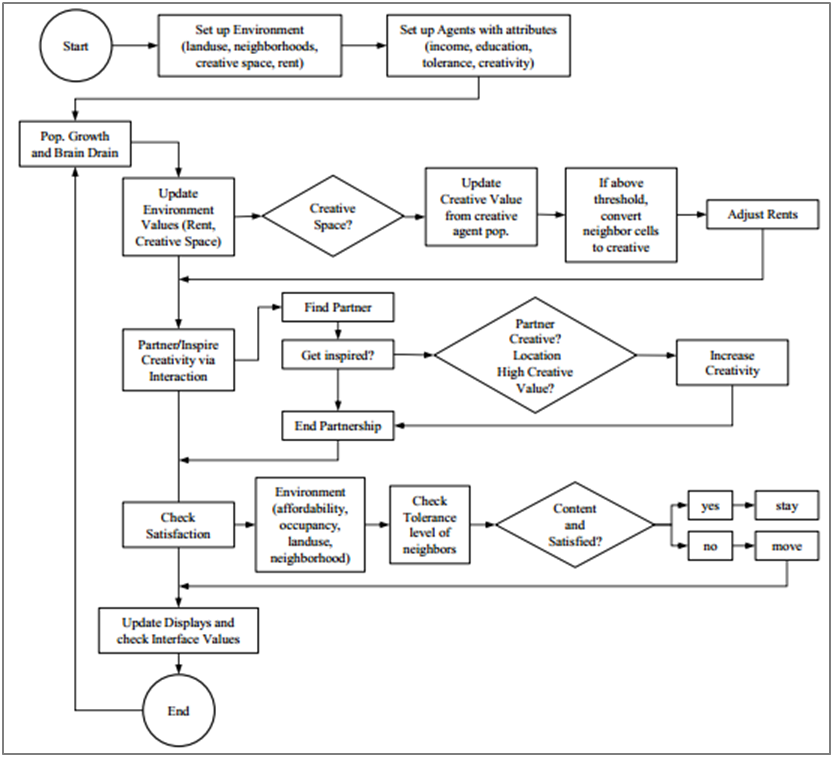
Figure 3. Creative City Model Logic Flow
Model
Verification and Sensitivity Analysis
- 4.1
- The key output from the model is the emergence of creative clusters depending on various input configurations from the interactions of individual agents. However, before interpreting any results from experimentation, we undertook extensive verification and sensitivity analysis to gain confidence in the inner-workings of the model. The purpose of this exercise is to ensure that the model results broadly followed theoretical expectations discussed earlier. For instance, does greater population density and lower social segregation levels in the model result in greater prosperity through diffusion of creativity? While this might appear to be an obvious outcome of the model design, the verification and consistency of theoretical ABMs can only be established by systematically testing each of its parameters, albeit with simple illustrations of correlations (Railsback et al. 2006). Given the centrality of having creative urban spaces endowed with amenities and populated with highly creative individuals, we tested the sensitivity of input parameters to the single most crucial output, i.e. percentage of creative urban spaces (when creative value exceeds the user-defined creativity threshold). While extensive parameter sweeps were carried out, here we only show some of the more interesting results. Each result represents an average of 100 model runs over a 10 year time period, thus ensuring that model stochasticity did not bias the findings.
- 4.2
- In order to provide realistic results from experiments, we
take baseline inputs from survey data from the city of Karachi,
Pakistan using a 1,000 sample size survey of youth (Malik & Karim 2012). It
provides estimates for levels of educational attainment, brain drain,
high levels of creativity, income distribution and tolerance levels of
the 18-29 year age cohort. The model's starting agent population of
2,100 was based on recent estimates that the city's population has
crossed 21 million (Kotkin &
Cox 2013) hence the model captures 0.01 percent of the
population. As shown in Table 1, these values together provide an
estimate of input parameter combinations based on Karachi, which is
used as the base case for representing developing country megacities.
As discussed later in this paper, we employ various combinations of
development, segregation and agent movement to conduct experimentation
on this value combination.
Table 1: Default Input Parameters for Verification
Input ParametersDefault Values Starting Population 2,100 Annual Population Growth Rate 8 percent Literacy Rate 50 percent Annual Rate of Brain Drain 3 percent Proportion of Highly Creative Agents 15 percent Average Societal Tolerance Level – Segregation 30 percent Monthly Income: per capita / top 10 percent 30,000 / 100,000 Units Average Monthly Rent 12,000 Units Rent Percentage of Income Affordability Threshold 30 percent 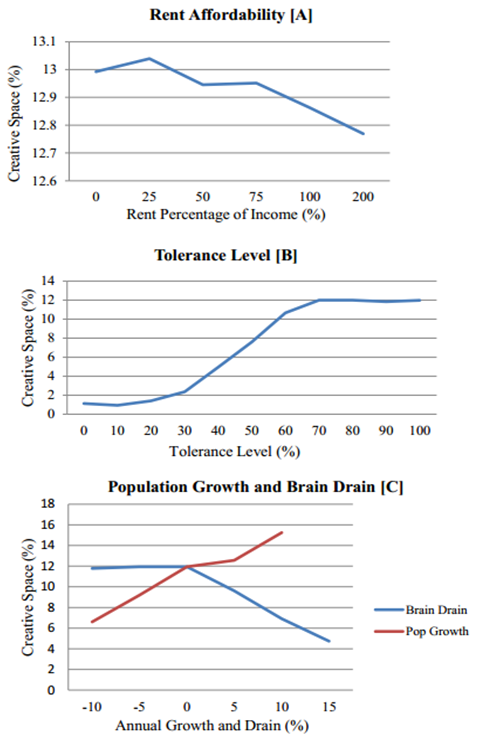
Figure 4. Simulation Results for Rent Affordability (A), Tolerance (B), Brain Drain and Population Growth (C) - 4.3
- In Figure 4A, the rent percentage of income refers to the threshold beyond which individuals cannot afford rent. As the threshold increases along the horizontal axis, people are forced to spend a larger part of their total income on housing. Therefore, the negative slope indicates that as the percentage of income spent on rent increases, the number of people who can afford higher rents prevailing in creative hotspots will decrease. Leading critics of Florida's theory of the creative class have argued that mixed land-use in downtown neighborhoods are prohibitively expensive for even middle-class professionals, let alone low-income families (Peck 2005). While these arguments gain credence from the aforementioned results, Glaeser (2011) argues that greater rent affordability (either through larger incomes or cheaper rents) in fact mixes-up these classes, thus improving socioeconomic diversity and propelling economic activity. In the model results however, we observe that after rising with percentage of income spent on rent till the 25 percent mark, creative space tips over and continues falling till the 50 percent mark. The U.S. government benchmarks housing affordability at 30 percent, with households being forced to spend any more on rent considered poor (Cohen et al. 2010; Schwartz & Wilson 2006). The model's tipping point remains in the same range, lending weight to its theoretical cogency.
- 4.4
- The idea of incorporating societal tolerance is inspired from Schelling's (1971) segregation model which demonstrated that seemingly innocuous preferences of residing alongside neighbors of the same ethnicity results in complete segregation. In addition, as discussed in the background section, the urban society's tolerance towards religious minorities, immigrant groups and new ideas has been the hallmark of great cities (Mumford 1961). In the model therefore, we expect societal tolerance to be positively correlated with creative spaces. Each agent is embedded with a tolerance value, assigned through normal distribution around the user-specified mean value, ranging from 0-100 percent. In searching for suitable housing units, agents are programmed to reside only in neighborhoods where the majority of the population falls into a 25 percent tolerance range of themselves. Therefore, agents with lower tolerance values have much smaller tolerance acceptability ranges as compared to their more tolerant counterparts. The results shown in Figure 4B indicate that as the individual tolerance levels of agents increase, the proportion of creative urban spaces improves. At low tolerance levels of under 10 percent, creative urban spaces shrink but show modest improvement from here on till the 30 percent mark after which it takes-off. This finding improves model validity and further reaffirms our hypothesis that societal tolerance is a crucial determinant of creativity led urban development.
- 4.5
- In Figure 4C, the urban population growth rate is associated with higher density levels, which in turn increases interactions amongst agents. This leads to a greater number of creative interactions and productive partnerships among agents, creating economic value (e.g as discussed in Hagel et al. 2010; Knudsen et al. 2008). Despite the positive overall relationship, creative spaces remain largely unchanged in the 0 to 5 percent population growth rate range. Since most real-world cities grow within this range, this flattening of the graph suggests that citrus paribus, population growth alone does not result in the emergence of creative clusters. Not all the world's fastest growing cities therefore, in particular the likes of Lagos and Karachi, boast any significant creative space endowments. The presence of highly educated professionals is necessary for creative industries to prosper and societies to remain tolerant; hence the rate of brain drain is negatively correlated with creative spaces. On the opposite side however, the results shown in Figure 4C indicate that negative brain drain, essentially the growth of highly educated professionals, leads to higher percentage of creative space that does not continue growing indefinitely. In the Creative City Model, both population growth and brain drain rates have a highly sensitive relationship with creative spaces, thus indicating that the intensity of interactions is a crucial determinant of creative cluster formation.
Experiments
- 5.1
- Having discussed model verification in the previous
section, we will now undertake three "what-if" simulation experiments
to test ideas currently being debated in urban planning circles:
altering urban land-use regulations, investing in urban transportation
and improving societal tolerance levels. Since these are highly
intertwined, for example, urban land-use impacts mobility which then
affects segregation (Bjornskau
2005), we ran experiments using combinations of various model
inputs (e.g. population density with or without mobility etc.). For the
analysis of all experiments however, the focus is maintained on key
outputs including percent creative spaces, number of highly creative
individuals, and rent affordability as they together capture the
diffusion of human creativity within the urban context. Given Axtell
and Epstein's (1994)
assertion that "level 1" models ought to be only in qualitative
weagreement with reality and the lack of reliable data on developing
cities (see Henderson et al. 2012),
we mostly compare results with qualitatively informed insights on these
cities. Throughout the remainder of this paper, we will use the term
"Segregation" for referring to segregation, while the term "Movement"
for movement outside agents' residential neighborhood, and
"Development" for allowance for real estate development. The "On" and
"Off" label refer to whether or not these options are applied in
respective model runs and are consecutively shaded Green and Red
respectively.
Urban Zoning and Land-Use Regulation
- 5.2
- The supply of residential and commercial real estate
largely depends on urban zoning and land-use regulations imposed by
municipal governments, which in many developing countries are
restrictive (Rose 1989).
Therefore, the easing of strict urban land development and building
construction regulations will likely reduce land rents (Quigley & Rosenthal 2005).
Our model allows users to control whether additional real-estate
development is allowed or not, thus exploring its impacts on
macroscopic urban form. In this model, turning on the allow development
parameter enables the construction of residential units in previously
industrial or commercial zones. In simple terms however, allowing
additional urban development within the model amounts to an increase in
building supply which is likely to reduce rents, and vice versa. Hence
we expect the allow development parameter to show significant
sensitivity to the proportion of creative spaces, thus demonstrating
the impact of relaxing urban land-use regulations on economic
conditions.
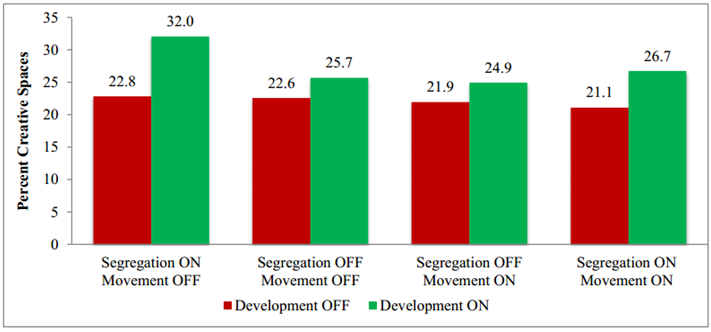
Figure 5. Percent Creative Spaces with Development On or Off - 5.3
- Both the development control and the percent creative space parameter relate to land-use attributes, thus are inherently spatial. Hence Figure 5 focuses on the relationship between the development control and its impact on creative spaces. From among the eight unique combinations involving three controls with two options each, ceteris paribus, we expect development to have the greatest impact creative spaces through agent-agent and agent-environment interactions. First, the experiment reveals significant sensitivity in the relationship between development and creative spaces, averaging 5.2 percentage points. This is consistent with ex-ante expectations as additional development increases urban floor space and thus population density, both of which augment clustering of likeminded and highly creative agents. In real-world cities, reforms in land-use regulation towards mixed land-use (and improved public transit) in places like Arlington, Virginia have created clustering of creative sector professionals (Evans 2009). Similarly, the art district of Le Marais in central Paris and the technology-driven entrepreneurship activity of East London are good examples of the emergence of creative clusters within major cities.
- 5.4
- Within the model, we observe that such creative spaces
emerge in greater proportion whenever development is allowed,
irrespective of whether segregation and movement are allowed or
otherwise. This result is consistent with perspectives in the
literature discussed earlier, which associate greater density with the
clustering of creative activities resulting in greater productivity (Ciccone 2002; Combes et al. 2010). In
addition, the highest percentage of creative spaces emerges when
development and segregation are allowed and movement is restricted.
This shows that the intensity of interactions due to physical
containment, especially when around similar agents, fosters somewhat
greater creativity. In other words, when highly creative agents are
contained in neighborhoods with poor mobility services, they are likely
to generate novel ideas leading to greater productivity. In Figure 5, scenarios where segregation is
allowed results in more creative spaces due to the same reason. To some
extent this result negates the view that greater mobility and diversity
are pre-conditions for creative cluster formation due to enhanced
opportunities for encounters.
Transportation and Mobility
- 5.5
- In leading metropolitan centers, seamless connectivity is
available to residents through extensive public transportation systems
that are largely affordable. Access to transportation and thus urban
mobility are vital pre-conditions for interactions among urbanites,
which in turn increases economic outputs (Lucas
& Rossi-Hansberg 2002; Atkinson
1998). In the model therefore, agent movements can be
restricted to within one of the seven neighborhoods where they reside
by applying the Restrict Movement parameter. When the restriction is
not applied however, agents are free to move throughout the city with
the assumption that better public transportation access allows them to
do so. The underlying desire of agents to continue movements in search
for affordable housing units remains consistent under both
circumstances. However, given that the literature discussed earlier
posits that greater human interactions accelerate the diffusion of
creativity (Glaeser 2011;
Drennan & Kelly 2011)
we focus on the relationship between the movement control and
percentage of creative agents.
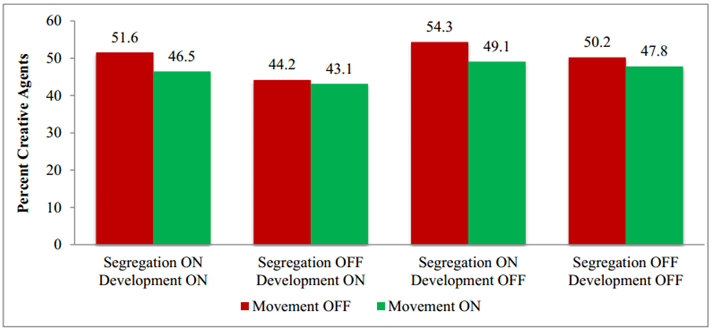
Figure 6. Percent Creative Agents with Movement On or Off - 5.6
- In Figure 6 we
observe that each scenario where movement is restricted results in
greater percentage of creative agents in the model (belonging to medium
and high creative categories). The highest report values are observed
when segregation is enforced, with disallowing development producing
higher values. This augments the intensity of interaction argument made
earlier as the combination of movement restriction, enforced
segregation and disallowance of development creates the most
interaction intensity. Conversely, the lowest percentages of creative
agents are observed when development is allowed in the absence of
segregation, which negates arguments in literature equating greater
tolerance and mixed land-use with the diffusion of creativity. If the
model results were consistent with those observations, the combination
of no segregation along with allowance for movement and development
would have produced the greatest population of creative agents. In
terms of sensitivity, changes to the movement control produces an
average impact of 3.5 percentage points, relatively lower than the
relationship development and creative spaces discussed earlier. In
fact, creative agent percentage shows the greatest sensitivity to
segregation as it directly impacts free human interaction, with the
existence of segregation being associated with greater diffusion of
creativity within the model's environment.
Tolerance and Segregation
- 5.7
- Taking inspiration from Schelling's (1971) work on socio-ethnic segregation in urban neighborhoods, we hypothesize that cities with greater societal tolerance are more likely to be prosperous. Some of the world's largest and most prosperous cities, the likes of New York and London, are magnets of immigrants and offer incredibly assimilating societies due to extremely high tolerance for divergent socioeconomic, religious and racial groups. Moreover, recent contributions in urban simulation literature has demonstrated how seemingly innocuous preferences for residing in neighborhoods where the majority belongs to one's own ethnic group leads to suboptimal outcomes for society (Eckerd et al. 2012; Kim et al. 2013). Therefore, when segregation is turned on in the Creative City Model, individual preference for similar neighbors (determined by tolerance level) becomes part of the residential location decision. Each agent is programmed to consider the tolerance range of agents in its neighborhood, strictly preferring staying with the 10 percentage point range of their own creativity level. When the segregation is turned off however, these considerations do not apply towards the location decisions of agents.
- 5.8
- A chief criticism of new urban literature has been that it
results in social and economic inequalities (Peck
2005), thus crowding out low- or middle-income classes from
the so-called clusters of creativity. Despite mixed land-use resulting
in greater housing supply, public investments in transit and high
demand in emerging neighborhoods drive rentals up beyond the reach of
highly talented professionals (Quigley
& Rosenthal 2005). Hence the purpose of Figure 7 is to understand the relationship
between segregation and rent affordability, measured as the percentage
of the population spending less than 30 percent of income on rents (Schwartz & Wilson 2006).
Since rising rental prices crowd out agents from the housing market,
this relationship offers insights into social inequality resulting from
combinations of the three controls.
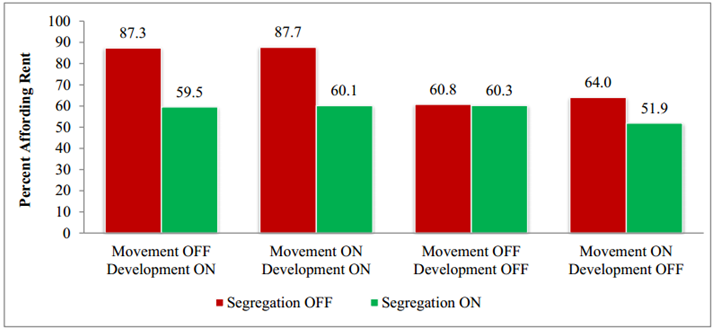
Figure 7. Percent Affording Rent with Segregation On or Off - 5.9
- As seen in Figure 7, turning segregation off always improves rent affordability albeit with varying magnitudes, with allowance for development (with segregation not enforced i.e. off) resulting in major improvements in social welfare. In scenarios with development being off, particularly with movement restriction, rent affordability decreases as expected as both variables negatively impact the supply of rental floor space in the housing market. When comparing the differences between scenarios with segregation enforced (i.e. segregation on) or otherwise, development appears to be driving affordability due to the supply-demand dynamics of the housing market. However, results indicate relatively lower sensitivity to both the movement and development controls, particularly when segregation is enforced.
- 5.10
- Notwithstanding the apprehensions from critics regarding
social welfare, the key argument arising from new urban literature is
that such environments produce economic prosperity for urbanites (Florida 2002). As discussed
earlier, the clustering of highly talented individuals under conditions
of population density increases collaboration amongst them, eventually
resulting in economic value through new business activity (Storper & Venables 2004;
Knudsen et al. 2008).
In line with model findings discussed earlier, this implies that
segregating likeminded individuals within urban neighborhoods will in
fact increase their creative outputs, thereby boosting economic output (Florida 2002). Therefore, we
utilize the most widely accepted indicator of prosperity, i.e. annual
income per capita, which provides a snapshot of the absolute scale of
prosperity in any given region. Without including inequality concerns
in the discussion, we interpret results to understand how different
scenarios result in varying levels of average prosperity.
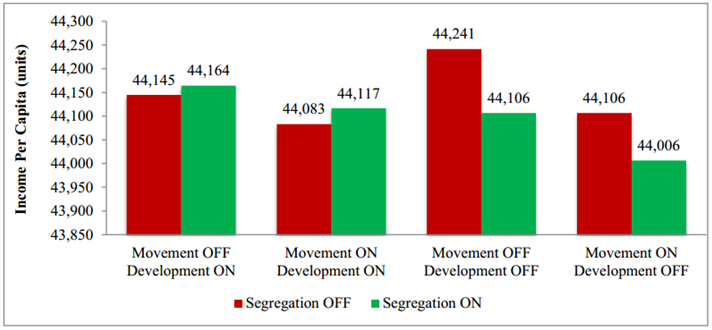
Figure 8. Annual per Capita Income (Units) with Segregation On or Off - 5.11
- Unlike trends seen in other experiments, results in Figure 8 do not present a clear and consistent relationship between the control selections and main output parameter. In cases where development is disallowed we observe the absence of segregation resulting in greater per capita income levels, especially when movement is restricted. In other words, while the absence of segregation results in greater income per capita, the outcome changes to the opposite after developments are allowed. Given that in Figure 5 we found that allowing development is associated with greater creative spaces, this appears to imply that the agglomeration of creative agents by itself does not produce prosperity. This is qualitatively consistent with real-world examples of artsy districts in generally prosperous cities like Berlin and Paris, where relatively low income but highly creative artists reside (Vivant 2010; Gill & Prat 2008). These conditions are sustained in situations marred by the absence of supporting institutions that could help translate raw talent into economic productivity (Nystrom 2008). For instance, the lack of efficient and institutionalized patent or business registration systems in many developing countries creates disincentives for entrepreneurs.
Summary
- 6.1
- This paper presents the Creative City Model, an exploratory ABM to simulate the relationship between land-use regulation, urban mobility and societal tolerance on the economic performance of cities. The model was based on simplified assumptions from our empirically informed understanding of urban morphology, economic geography and the diffusion of creativity from human interactions. In presenting the experiments, model results were compared with qualitative insights from real-world cities using references from literature and as such the paper contributes to the growing literature exploring the dynamic socioeconomic processes underlying urban economic growth through computer simulation. Specifically the model offers a new lens to view the diffusion of creativity through knowledge spillovers under various scenarios from the bottom up. Through experimentation the model suggests the existence of tradeoffs between the desire for social equity, estimated via rent affordability, and the rapid diffusion of creativity. In particular, we witness income inequality rising whenever overall income levels rose through the spread of creativity. Throughout the experiments, we observe that rent affordability remains inversely related to the proportion of high value urban spaces inhabited by highly creative agents. Whether facilitating creativity will eventually drive the majority of the urban population towards higher paying professional jobs, or ends up trickling down the economic benefits, is an open question worthy of further investigation.
- 6.2
- Moreover, we find through the experiments that the intensity of interactions amongst agents dictates the spread of creativity (measured by creative spaces and creative agents) irrespective of the underlying factors responsible for it. This result remains consistent irrespective of whether this occurs due to high population density, lack of transportation services, or income-based segregation. In fact we witness that improvements in transportation access can, at least in the short term, counteract creativity diffusion by spreading out agents across the city. Likewise, the physical containment of agents in neighborhoods where the majority's tolerance levels are within a small range further fosters creativity. This suggests that humans tend to prosper in familiar environments, either by way of socializing with likeminded individuals or by confidently expressing their inner creativity through a greater risk taking appetite (Florida 2002).
- 6.3
- The application of ABMs in social science faces concerns regarding the external validity of model results (Crooks et al. 2008). When dealing with cities in developing countries, the lack of reliable quantitative data exacerbates this challenge. At the current stage of development, the Creative City Model is exploratory in nature and explores theories of urban morphology. That being said, we believe it has laid the foundation for further work by designing a model qualitatively consistent with the "emergent macro-structures" of urban growth (Axtell & Epstein 1994). For instance, we observe that citrus paribus, allowing additional real estate development significantly improves average rent affordability (Quigley & Rosenthal 2005). At later stages of development, the model would benefit from a more sophisticated residential location component to incorporate daily agent movements from homes to offices. Similarly, the key role played by firms as centers of employment for highly creative professionals could be captured by introducing them as agent attracting entities within the model.
- 6.4
- The current momentum of urbanization and the emergence of megacities in poorer countries present unprecedented challenges for urban modeling. Given the need for reaching a more profound understanding of cities, ABMs have emerged as a powerful tool for exploring the underlying socioeconomic dynamics of cities (Batty 2005). This paper has shown how ABMs can explain the emerging macrostructures of creative clusters and knowledge spillovers from individual level behavior based on empirically grounded insights from the academic literature. It lays the foundation for further work, especially that of further model development which would entail the validation of results with quantitative data from real-world cities.
Acknowledgements
-
This research received financial support from the Competitive Grants Program, a joint initiative of the Planning Commission of Pakistan and the Pakistan Strategy Support Program, International Food Policy Research Institute (IFPRI), funded by USAID. We are also grateful to editor and the four anonymous reviewers for their valuable comments, which helped improve this paper.
Notes
- 1Using standard terminology from the ABM literature, particularly those using NetLogo, the term "cells" refers to a single square on the grid constituting the model's environment.
References
- AMABILE, T.M. (1996). Creativity
In Context: Update To The Social Psychology Of Creativity.
Westview Press.
ALEXANDER, C. (1964). Notes on the Synthesis of Form, Harvard University Press, Harvard, MA.
ALONSO, W. (1964). A Theory of the Urban Land Market. Papers in Regional Science, 6(1): 149–157 [doi:10.1111/j.1435-5597.1960.tb01710.x]
ATKINSON, R.D. (1998). Technological Change and Cities. Cityscape: A Journal of Policy Development and Research, 3 (3): 129–170.
AUDRETSCH, D., Dohse, D. & Niebuhr, A. (2010). Cultural Diversity and Entrepreneurship: A Regional Analysis for Germany. The Annals of Regional Science, 45 (1): 55–85. [doi:10.1007/s00168-009-0291-x]
AXTELL, R. & Epstein, J., (1994). Agent-based Modelling: Understanding Our Creations. The Bulletin of the Santa Fe Institute, (Winter): 28–32.
BALDWIN, J.R., Brown, W.M. & Rigby, D. (2010). Agglomeration Economies: Microdata Panel Estimates from Canadian Manufacturing. Journal of Regional Science, 50 (5): 915–934. [doi:10.1111/j.1467-9787.2010.00675.x]
BARON, R.A., & Tang, J. (2011). The Role of Entrepreneurs in Firm-Level Innovation: Joint Effects of Positive Affect, Creativity, and Environmental Dynamism. Journal of Business Venturing, 26 (1): 49–60. [doi:10.1016/j.jbusvent.2009.06.002]
BARRO, R.J. (2001). Human Capital and Growth. American Economic Review, 91 (2): 12–17. [doi:10.1257/aer.91.2.12]
BATTY, M. (2001). Polynucleated Urban Landscapes. Urban Studies, 38 (4): 635–655. [doi:10.1080/00420980120035268]
BATTY, M. (2005). Cities and Complexity: Understanding Cities with Cellular Automata, Agent-Based Models, and Fractals. The MIT Press, Cambridge, MA.
BEINE, M., Docquier, F. & Rapoport, H. (2001). Brain Drain and Economic Growth: Theory and Evidence. Journal of Development Economics, 64 (1): 275–289. [doi:10.1016/S0304-3878(00)00133-4]
BERRY, C.R., & Glaeser, E.L. (2005). The Divergence of Human Capital Levels Across Cities. Working Paper 11617. National Bureau of Economic Research. Cambridge, MA: http://www.nber.org/papers/w11617. [doi:10.3386/w11617]
BJORNSKAU, T. (2005). Road Traffic Change: A Catalyst for Segregation? Urban Studies, 42 (1): 69–89. [doi:10.1080/0042098042000309702]
BOSCHMA, R.A. & Fritsch, M. (2009). Creative Class and Regional Growth: Empirical Evidence from Seven European Countries. Economic Geography, 85 (4): 391–423. [doi:10.1111/j.1944-8287.2009.01048.x]
CARRUTHERS, J. & Mulligan, G.F. (2012). The Plane of Living and the Pre-crisis Evolution of Housing Values in the USA. Journal of Economic Geography, 12 (4): 739–773. [doi:10.1093/jeg/lbr045]
CHATMAN, D.G. & Noland, R.B. (2014). Transit Service, Physical Agglomeration and Productivity in US Metropolitan Areas. Urban Studies, 51 (5): 917–937. [doi:10.1177/0042098013494426]
CICCONE, A. (2002). Agglomeration Effects in Europe. European Economic Review, 46 (2): 213–227. [doi:10.1016/S0014-2921(00)00099-4]
COHEN, R., Wardip, K. & Williams, L. (2010). Rental Housing Affordability: A Review of Current Research, The Center for Housing Policy, Insights Housing Policy Research, Washington, DC.
COLBY, C.C. (1933). Centrifugal and Centripetal Forces in Urban Geography. Annals of the Association of American Geographers, 23 (1): 1–20. [doi:10.1080/00045603309357110]
COMBES, P-P, Duranton, G., Gobillon, L. & Roux, S. (2010). Estimating Agglomeration Economies with History, Geology, and Worker Effects. In Glaeser, E.L. (ed), Agglomeration Economics. University of Chicago Press, Chicago, IL, pp.15–66. [doi:10.7208/chicago/9780226297927.003.0002]
CLARK, T.N., Lloyd, R., Wong, K. K., & Jain, P. (2002). Amenities Drive Urban Growth. Journal of Urban Affairs, 24 (5): 493–515. [doi:10.1111/1467-9906.00134]
CROOKS, A.T., Castle, C.J.E. & Batty, M. (2008). Key Challenges in Agent-Based Modelling for Geo-spatial Simulation. Computers, Environment and Urban Systems, 32 (6): 417–430. [doi:10.1016/j.compenvurbsys.2008.09.004]
CROOKS, A.T. & Heppenstall, A. (2012). Introduction to Agent-Based Modelling. In Heppenstall, A., Crooks, A.T., See, L.M. and Batty, M. (eds.), Agent-based Models of Geographical Systems. Springer, New York, NY, pp. 85–108. [doi:10.1007/978-90-481-8927-4_5]
CROOKS, A.T. & Wise, S. (2013). GIS and Agent-Based models for Humanitarian Assistance. Computers, Environment and Urban Systems, 41: 100–111. [doi:10.1016/j.compenvurbsys.2013.05.003]
DE PROPRIS, L. & Hypponen, L. (2008). Creative Clusters and Governance: The Dominance of the Hollywood Film Cluster. In Cooke, P. and Lazzeretti, L. (eds.), Creative Cities, Cultural Clusters and Local Economic Development. Edward Elgar, Cheltenham, England, pp. 340–371.
DUANY, A., Plater-Zyberk, E. & Speck, J. (2001). Suburban Nation: The Rise of Sprawl and the Decline of the American Dream. Macmillan, New York, NY.
DRENNAN, M. P., & Hugh F. K. (2011). Measuring Urban Agglomeration Economies with Office Rents. Journal of Economic Geography, 11 (3): 481–507. [doi:10.1093/jeg/lbp066]
ECKERD, A., Campbell, H. & Kim, Y. (2012). Helping Those Like Us or Harming Those Unlike Us: Illuminating Social Processes Leading to Environmental Injustice. Environment and Planning B: Planning and Design, 39 (5): 945–964. [doi:10.1068/b38001]
EPSTEIN, J.M. (2007). Generative Social Science. Princeton University Press, Princeton, NJ.
EPSTEIN, J.M. (2008). Why Model? Journal of Artificial Societies and Social Simulation, 11 (4): 12: https://www.jasss.org/11/4/12.html.
EVANS, G. (2009). Creative Cities, Creative Spaces and Urban Policy. Urban Studies, 46 (5-6): 1003–1040. [doi:10.1177/0042098009103853]
FILATOVA, T., Parker, D. & van der Veen, A. (2009). Agent-Based Urban Land Markets: Agent's Pricing Behavior, Land Prices and Urban Land Use Change. Journal of Artificial Societies and Social Simulation, 12 (1): 3: https://www.jasss.org/12/1/3.html.
FLORIDA, R. (2002). Cities and the Creative Class. Routledge, New York, NY.
FLORIDA, R. & Mellander, C. (2010). There Goes the Metro: How and Why Bohemians, Artists and Gays Affect Regional Housing Values. Journal of Economic Geography, 10 (2): 167–188. [doi:10.1093/jeg/lbp022]
FLORIDA, R, Mellander, C. & Stolarick, K. (2011). Creativity and Prosperity: The Global Creativity Index. Martin Prosperity Institute, Toronto, Canada .
GIBSON, J. & McKenzie, D. (2012). The Economic Consequences of 'Brain Drain' of the Best and Brightest: Microeconomic Evidence from Five Countries. Economic Journal, 122 (560): 339–375. [doi:10.1111/j.1468-0297.2012.02498.x]
GILL, R. & Pratt, P. (2008). In the Social Factory? Immaterial Labour, Precariousness and Cultural Work. Theory, Culture & Society, 25 (7–8): 1–30. [doi:10.1177/0263276408097794]
GLAESER, E. (2011). Triumph of the City: How Our Greatest Invention Makes us Richer, Smarter, Greener, Healthier and Happier. Pan Macmillan, New York, NY.
GLAESER, E. (2005). Review of Richard Florida's The Rise of the Creative Class. Regional Science and Urban Economics, 35 (5): 593–596. [doi:10.1016/j.regsciurbeco.2005.01.005]
GRIMM, V. (2002). Visual Debugging: A Way of Analyzing, Understanding, and Communicating Bottom-up Simulation Models in Ecology. Natural Resource Modeling, 15 (1): 23–38. [doi:10.1111/j.1939-7445.2002.tb00078.x]
GRIMM, V., Berger, U., Bastiansen, F., Eliassen, S., Ginot, V., Giske, J., Goss-Custard, J., Grand, T., Heinz, S., Huse, G., Huth, A., Jepsen, J., Jorgensen, C., Mooij, W., Muller, B., Pe'er, G., Piou, C., Railsback, S., Robbins, A., Robbins, M., Rossmanith, E., Ruger, N., Strand, E., Souissi, S., Stillman, R., Vabo, R., Visser, U. & Deangelis, D. (2006). A Standard Protocol for Describing Individual-Based and Agent-Based Models. Ecological Modelling, 198 (1–2): 115–126. [doi:10.1016/j.ecolmodel.2006.04.023]
GYOURKO, J., Mayer, C. & Sinai, T. (2006). Superstar Cities. Working Paper 12355. National Bureau of Economic Research, Cambridge, MA: http://www.nber.org/papers/w12355. [doi:10.3386/w12355]
HALL, P. (1998). Cities in Civilization. Pantheon, New York, NY.
HAGEL, J., Brown, J.S. & Davison, L. (2010). The Power of Pull: How Small Moves, Smartly Made, Can Set Big Things in Motion, Basic Books, New York, NY.
HAQUE, N. (2007). Brain Drain or Human Capital Flight, Pakistan Institute of Development Economics, Lectures in Development Economics, No. 11, Islamabad, Pakistan.
HEINE, B-O, Meyer, M. & Strangfeld, O. (2005). Stylised Facts and the Contribution of Simulation to the Economic Analysis of Budgeting. Journal of Artificial Societies and Social Simulation, 4 (4): 4: https://www.jasss.org/8/4/4.html.
HENDERSON, V. (2002). Urbanization in Developing Countries, The World Bank Research Observer, 17 (1): 89–112. [doi:10.1093/wbro/17.1.89]
HENDERSON, J.V., Storeygard, A. & Weil, D.N. (2012). Measuring Economic Growth from Outer Space. American Economic Review, 102 (2): 994–1028. [doi:10.1257/aer.102.2.994]
HOEHN, J.P., Berger, M.C. & Blomquist, C. (1987). A Hedonic Model of Interregional Wages, Rents, and Amenity Values. Journal of Regional Science, 27 (4): 605–620. [doi:10.1111/j.1467-9787.1987.tb01184.x]
INGLEHART, R. & Welzel, C. (2005). Modernization, Cultural Change, and Democracy: The Human Development Sequence. Cambridge University Press, Cambridge, England.
JACOBS, J. (1961). The Death and Life of Great American Cities. Vintage Books, New York, NY.
KALDOR, N. (1957). A Model of Economic Growth. The Economic Journal, 67 (268): 591–624. [doi:10.2307/2227704]
KIM, Y., Campbell, H. & Eckerd, A. (2013). Residential Choice Constraints and Environmental Justice. Social Science Quarterly, 95 (1): 40–56. [doi:10.1111/ssqu.12033]
KNUDSEN, B., Florida, R., Gates, G. & Stolarick, K. (2008). Creativity and Density in U.S. Regions. Annals of the Association of American Geographers, 98 (2): 461–478. [doi:10.1080/00045600701851150]
KOSTER, H.R.A., & Rouwendal, J. (2012). The Impact of Mixed Land Use on Residential Property Values. Journal of Regional Science, 52 (5): 733–761. [doi:10.1111/j.1467-9787.2012.00776.x]
KOTKIN, J. & Cox, W. (2013). The World's Fastest-Growing Megacities, Forbes, Available at http://www.forbes.com/sites/joelkotkin/2013/04/08/the-worlds-fastest-growing-megacities/ [Accessed on August, 8th, 2013].
KRUGMAN, P. (1991). Increasing Returns and Economic Geography. Journal of Political Economy, 99 (3): 483–499. [doi:10.1086/261763]
LANDRY, C. (2000). The Creative City: A Toolkit for Urban Innovators. Earthscan, London, England.
LEE, N. (2014). The Creative Industries and Urban Economic Growth in the UK. Environment and Planning A, 46 (2): 455–470. [doi:10.1068/a4472]
LIU, H. & Silva, E.A. (2013). Simulating the Dynamics Between the Development of Creative Industries and Urban Spatial Structure: An Agent-Based Model. In Geertman, S., Toppen, F. and Stillwell, J. (eds.), Planning Support Systems for Sustainable Urban Development. Springer, Berlin, Germany, pp. 51–72. [doi:10.1007/978-3-642-37533-0_4]
LUBART, T. I. & Sternberg, R.J. (2002). Defying the Crowd: Cultivating Creativity in a Culture of Conformity. Free Press, New York, NY.
LUCAS, R.E. (1988). On the Mechanics of Economic Development. Journal of Monetary Economics 22 (1): 3–42. [doi:10.1016/0304-3932(88)90168-7]
LUCAS, R.E. & Rossi-Hansberg, E. (2002). On the Internal Structure of Cities. Econometrica, 70 (4): 1445–1476. [doi:10.1111/1468-0262.00338]
MALIK, A. & Karim, M. (2012). Karachi Youth Survey: Attitudes, Ambitions and Entrepreneurial Potential of Karachi's Youth. USIP Conference, Washington, DC.
MARCUSE, P. (2003). Review of The Rise of the Creative Class by Richard Florida. Urban Land 62 (8): 40–41.
MARSHALL, A. (1890). Principles of Economics. Macmillan and Company, New York, NY.
MATTHEWSs, J.H. (2007). Creativity and Entrepreneurship: Potential Partners or Distant Cousins? In Chapman, R. (Ed.) Managing Our Intellectual and Social Capital: 21st ANZAM 2007 Conference, Sydney, Australia.
MEYER, M. (2011). Bibliometrics, Stylized Facts and the Way Ahead: How to Build Good Social Simulation Models of Science? Journal of Artificial Societies and Social Simulation, 14 (4): 4: https://www.jasss.org/14/4/4.html.
MOLLER, J. & Tubadji, A. (2009). The Creative Class, Bohemians and Local Labor Market Performance A Micro-Data Panel Study for Germany 1975–2004. Journal of Economics and Statistics, 229 (2–3): 270–291.
MUMFORD, L. (1961). The City in History: Its Origins, Its Transformations, and Its Prospects. Houghton Mifflin Harcourt, New York, NY.
NIEBUHR, A. (2010). Migration and Innovation: Does Cultural Diversity Matter for Regional R&D Activity? Papers in Regional Science, 89 (3): 563–585. [doi:10.1111/j.1435-5957.2009.00271.x]
NYSTROM, K. (2008). The Institutions of Economic Freedom and Entrepreneurship: Evidence from Panel Data. Public Choice, 136 (3–4): 269–282. [doi:10.1007/s11127-008-9295-9]
ORGANIZATION FOR ECONOMIC COOPERATION AND DEVELOPMENT (2006). OECD Territorial Reviews: Competitive Cities in the Global Economy, OECD Publishing, Paris, France.
PAGE, S.E. (2008). The Difference: How the Power of Diversity Creates Better Groups, Firms, Schools, and Societies. Princeton University Press, Princeton, N.J.
PATEL, A., Crooks, A.T. & Koizumi, N. (2012). Slumulation: an Agent-based Modeling Approach to Slum Formations. Journal of Artificial Societies and Social Simulation, 15(4): 2: https://www.jasss.org/15/4/2.html.
PECK, J. (2005). Struggling with the Creative Class. International Journal of Urban and Regional Research, 29 (4): 740–770. [doi:10.1111/j.1468-2427.2005.00620.x]
PORTER, D.R. (2002). Marking Smart Growth Work. Urban Land Institute, Washington, DC.
PORTER, M.E. (1998). Clusters and the New Economics of Competition. Harvard Business Review, 76 (6): 77–90.
QIAN, H. (2013). Diversity Versus Tolerance: The Social Drivers of Innovation and Entrepreneurship in US Cities. Urban Studies, 50 (13): 2718–2735. [doi:10.1177/0042098013477703]
QIAN, H. & Stough, R.R. (2011). The Effect of Social Diversity on Regional Innovation: Measures and Empirical Evidence. International Journal of Foresight and Innovation Policy, 7 (1): 142–157. [doi:10.1504/IJFIP.2011.040071]
QUAH, D.T. (1997). Empirics for Growth and Distribution: Stratification, Polarization, and Convergence Clubs. Journal of Economic Growth, 2(1): 27–59. [doi:10.1023/A:1009781613339]
QUIGLEY, J.M., & Rosenthal, L.A. (2005). The Effects of Land Use Regulation on the Price of Housing: What Do We Know? What Can We Learn? Cityscape, 8 (1): 69–137.
RAILSBACK, S.F., Lytinen, S.L. & Jackson, S.K. (2006). Agent-Based Simulation Platforms: Review and Development Recommendations. Simulation, 82 (9): 609–623. [doi:10.1177/0037549706073695]
RAUCH, J.E. (1993). Productivity Gains from Geographic Concentration of Human Capital: Evidence from the Cities. Journal of Urban Economics, 34 (3): 380–400. [doi:10.1006/juec.1993.1042]
RAUHUT, H. & Junker, M. (2009). Punishment Deters Crime Because Humans Are Bounded in Their Strategic Decision-Making.'Journal of Artificial Societies and Social Simulation, 12(3): 1: https://www.jasss.org/12/3/1.html.
ROMER, P. (1990). Endogenous Technological Change. The Journal of Political Economy, 98 (5): 71–102. [doi:10.1086/261725]
ROSE, L.A. (1989). Urban Land Supply: Natural and Contrived Restrictions. Journal of Urban Economics, 25 (3): 325–345. [doi:10.1016/0094-1190(89)90054-5]
SASAKI, Y. & Box, P. (2003). Agent-Based Verification of von Thünen's Location Theory. Journal of Artificial Societies and Social Simulation, 6 (2) 9: https://www.jasss.org/6/2/9.html.
SCHELLING, T.C. (1971). Dynamic Models of Segregation. Journal of Mathematical Sociology, 1 (1): 143–186. [doi:10.1080/0022250X.1971.9989794]
SCHWARTZ, M. & Wilson, E. (2006). Who Can Afford to Live in a Home? A Look at Data from the 2006 American Community Survey. US Census Bureau, Washington D.C.: http://www.census.gov/housing/census/publications/who-can-afford.pdf.
SHAPIRO, J.M. (2006). Smart Cities: Quality of Life, Productivity, and the Growth Effects of Human Capital. Review of Economics and Statistics, 88 (2): 324–335. [doi:10.1162/rest.88.2.324]
SIMON, C.J. (1998). Human Capital and Metropolitan Employment Growth. Journal of Urban Economics, 43 (2): 223–243. [doi:10.1006/juec.1997.2048]
SIMONTON, D.K. (2011). Big-C Creativity in Big City: In Andersson, D.E., Andersson, Å.E. and Mellander, C. (eds.), Handbook of Creative Cities. Edward Elgar Publishing, Cheltenham, England. [doi:10.4337/9780857936394.00009]
SPENCER, G.M. (2012). Creative Economies of Scale: An Agent-based Model of Creativity and Agglomeration. Journal of Economic Geography, 10(1): 247–271. [doi:10.1093/jeg/lbr002]
STARK, O. (2004). Rethinking the Brain Drain. World Development, 32(1): 15–22. [doi:10.1016/j.worlddev.2003.06.013]
STORPER, M. & Scott, A. J. (2008). Rethinking Human Capital, Creativity and Urban Growth. Journal of Economic Geography, 9 (2): 147–167. [doi:10.1093/jeg/lbn052]
STORPER, M. & Venables, A.J. (2004). Buzz: Face-to-Face Contact and the Urban Economy.'Journal of Economic Geography, 4 (4): 351–370. [doi:10.1093/jnlecg/lbh027]
UN-HABITAT (2010). State of the Cities 2010–11 – Cities for All: Bridging the Urban Divide. UN-Habitat, Nairobi, Kenya.
UNITED NATIONS (2007). State of World Population 2007: Unleashing the Potential of Urban Growth. United Nations Population Fund, New York, NY.
VILLALBA, E. (2010). Monitoring Creativity at an Aggregate Level: A Proposal for Europe. European Journal of Education, 45 (2): 314–330. [doi:10.1111/j.1465-3435.2010.01431.x]
VIVANT, E. (2010). The (re)Making of Paris as a Bohemian Place? Progress in Planning, 74 (3): 107–152. [doi:10.1016/j.progress.2010.05.002]
WORLD BANK (2009). Reshaping Economic Geography. World Development Report No. SKU 17607, Washington, DC.