
 Abstract
- Based on previous models (Hemelrijk 1998; Puga-González, Hildenbrant & Hemelrijk 2009), we have developed an agent-based model and software, called A-KinGDom, which allows us to simulate the emergence of the social structure in a group of non-human primates. The model includes dominance and affiliative interactions and incorporates two main innovations (preliminary dominance interactions and a kinship factor), which allow us to define four different attack and affiliative strategies. In accordance with these strategies, we compared the data obtained under four simulation conditions with the results obtained in a previous study (Dolado & Beltran 2012) involving empirical observations of a captive group of mangabeys (Cercocebus torquatus). The results show that the combination of the effect of kinship on affiliative interactions and the use of ambiguity-reducing attack provide results that are the most similar to the results of the biological model (i.e., a captive group of mangabeys) used in this study.
- Keywords:
- Social Structure, Agent-Based Models (ABM), Biological Models
Introduction
- 1.1
- Social structure is a phenomenon observed in all human groups and has been studied by anthropologists, social psychologists, sociologists, economists and politicians. Classical approaches to social structure analysis focus on different topics such as demographics, political systems, economic structures and social behavior. However, social structure can also be analyzed as a complex nonlinear system that can emerge from simple interaction between individuals. Gilbert and Troitzsch (1999) and Younger (2003, 2010) have applied this perspective to human societies. But social structure is a common phenomenon in nature. Specifically, many species of the order of primates show different patterns of complex social structure. Therefore, because of the proximity between species, adopting a phylogenetic perspective enables us to point out some important features of the social structure observed in human societies. In this study, our aim was to determine the main patterns involved in the emergence of the social structure observed in some species of non-human primates.
- 1.2
- Based on these two approaches (using the phylogenetic point of view to analyze social structure as an emergent, complex phenomenon), several studies have used agent-based models to determine the main patterns of the social structure in non-human primate societies. For example, te Boekhorst and Hogeweg (1994) studied sociality in orangutans (Pongo pygmaeus) through the formation and development of travel bands; Ramos-Fernández, Boyer and Gómez (2006) studied how fission-fusion events emerge from a foraging model in spider monkeys (Ateles sp.); and, more recently, Sellers, Hill and Logan (2007) showed how collective decisions can affect the individual fitness of group members in a troop of chacma baboons (Papio hamadryas ursinus).
- 1.3
- Macaques are part of the Cercopithecidae, one of the largest families of primates and one whose social structure has been studied extensively. The Cercopithecidae family also includes species such baboons (Papio sp.), mangabeys (Cercocebus sp.) and mandrillus (Mandrillus sp.). An integrative approach is offered by the co-variation hypothesis (Thierry 2004), where agonistic and affiliative behaviors are analyzed simultaneously in order to classify species of macaques in four grades of social styles as a result of the events occurring over their phylogenetic history. In grades 1 and 2, labeled despotic and tolerant, respectively, conflicts and physical displacement are usually avoided by means of submission signals, thus making highly intensive agonistic encounters rare. In grades 3 and 4, labeled relaxed and egalitarian, respectively, bilateral agonistic encounters are tolerated and occur more frequently than in despotic societies, although the intensity is much lower.
- 1.4
- Using the agent-based model DomWorld, Hemelrijk (1998), who was inspired by Hogeweg (1988), studied the dominance interactions (i.e., dyadic agonistic encounters between two individuals) observed in macaques that define their dominance rank and also determine the spatial distribution of group members. Hemelrijk (2002) extended the DomWorld agent-based model by adding rules of sexual attraction between agents. Hemelrijk's model was replicated by Lehmann, Wang and Bryson ( 2005). They found that some of Hemelrijk's results were not well supported by the primate literature. One of the major criticisms was that the DomWorld model used only aggression interactions to define dominance styles and that several aspects of the model were not well supported by the current primate literature (more specifically, the genus Macaca). Bryson, Ando and Lehmann (2007) found that the range of change of dominance rankings and the probability subordinate individuals had of winning an agonistic interaction in aggressive interactions were exaggerated. They proposed a way to explain social structure in primate societies based on social tolerance and a conciliatory tendency. De Vries (2009) showed that major unrealistic changes in the probability of winning after an agonistic encounter among subordinate animals were a consequence of the additive dominance value updating method in combination with the probability of winning proposed by Hemelrijk (2002) in the DomWorld model. De Vries proposed a solution using two equivalent alternatives: a) replacing the additive update rule with a multiplicative update rule or, b) replacing the decision rule involving a relative probability of winning an encounter with a combination of a sigmoidal function of win probability and the addictive update rule (i.e., the Elo-rating method).
- 1.5
- Another criticism of DomWorld was that Hemelrijk's model did not reflect the avoidance behavior observed in primates (Evers, de Vries, Spruijt & Sterck 2011). In many species of primates, individuals try to prevent agonistic encounters within the group, which results in less fleeing. Using three agent-based models adapted from the DomWorld model (i.e., fleeing, avoidance and velocity models), Evers et al. (2011) demonstrated that the patterns of spatial distribution adopted by the members of a group of primates (central or peripheral placement) can emerge from individual variations in movement properties. Moreover, avoidance behavior is also involved in the encounter structure and can lead to subgroup formation.
- 1.6
- Puga-González et al. (2009) developed GrooFiWorld, an extension of the DomWorld model that included some of the suggestions described above. Although the GrooFiWorld model maintained the main dominance interactions in DomWorld (Hemelrijk 2002), it focused on low-cognition explanations of reconciliation behavior, including affiliative interactions (i.e., grooming relations) to reproduce the emergence of patterns of the social structure, and these outcomes were consistent with some of the empirical findings obtained in macaque societies (Yamada 1966; de Waal & Luttrell 1989; Thierry 2004; Schino & Aureli 2008). The authors defined patterns of social structure based on several behavioral measures (Table 1). More recently, GrooFiWorld has been including new rules focused on support in fights (Hemelrijk & Puga-González, 2012).
Table 1: Main behavioral measures described by Puga-González et al. (2009) to quantify the patterns of the social structure in macaque societies. Aggression patterns Gradient of hierarchy Unidirectionality of aggression Percentage of aggressive interactions that involve fighting Correlation between rank and aggression given Correlation between rank and aggression received Correlation between rank and number of fights lost Mean distance between group members Scale distance Centrality of dominants Affiliative patterns Percentage of affiliative interactions that involve grooming Berger-Parker dominance index for grooming partners Correlation between rank and grooming given Correlation between grooming and proximity of partner Grooming reciprocation Grooming up the hierarchy Grooming partners of similar rank - 1.7
- Dolado and Beltran (2011) compared the results obtained from DomWorld simulations (Hemelrijk 1998) with empirical data from observations of a group of 5 captive mangabeys and found that dominance interactions were insufficient to define the social structure in that group of primates. Moreover, Dolado and Beltran (2012) compared the results obtained from GrooFiWorld simulations (Puga-González et al. 2009) with empirical data from a group of 7 captive mangabeys and the results showed that dominance and affiliative interactions provided a great deal of information for defining the social structure in that group of primates.
- 1.8
- However, many studies have also included kinship (i.e., the genetic relationship between all group members) as a factor that can account for certain individual differences in the aggressive and affiliative patterns observed among members of the same group (Chapais 2004; Call, Judge & de Waal 1996). In many primate species, a female's rank can be predicted from knowledge of her kinship bonds and the birth order of her offspring (Chapais 2004). But some previous studies reported that kinship does not reduce the level of aggression among females and their offspring (Silk, Samuels and Rodman 1981). Kurland (1977) suggested that aggression toward relatives and non-relatives may differ in intensity. Moreover, the kinship factor is a key factor among female macaques, baboons and mangabeys because females stay in natal groups and spend a great deal of time in contact with their relatives searching for food, grooming and taking care of offspring (Walters 1987). Thus, it seems reasonable to include kinship in agent-based models of the social structure of primate societies because it modifies the duration and frequency of affiliative interactions in the group (Gouzoules 1984; Silk, Samuels & Rodman 1981).
- 1.9
- We believe that GrooFiWorld (Puga-González et al. 2009), which in turn was an extension of DomWorld (Hemelrijk 1998), is a good starting point to work on modeling the social structure observed in some species of Cercopithecidae. Following this idea, we have developed an agent-based model called A-KinGDom, which is an extension of both models. However, the A-KinGDom model includes two main innovations: a) preliminary dominance interaction (PDI), which regulates the number of aggression interactions between individuals and is a modification of the "mental battle" proposed by Puga-González et al. (2009), where an individual estimates whether it will win an agonistic encounter before attacking and, b) a kinship factor that modulates the duration and frequency of affiliative interactions. Both innovations are defined through four different strategies included in the A-KinGDom software: two dominance strategies, the risk-sensitive attack (RS) and the ambiguity-reducing attack (AR); and two affiliative strategies, one without kinship (Fight&Groo) and one that includes kinship (Fight&Groo+Kin).
- 1.10
- Moreover, in accordance with Bryson et al. (2007), we compared the results obtained from the simulations using the A-KinGDom model with empirical data corresponding to a species of Cercopithecidae with more dynamic dominance patterns. More specifically, empirical data were obtained from a pilot study in a captive group of mangabeys (Cercocebus torquatus) (Dolado 2011; Dolado and Beltran 2012).
- 1.11
- We expected both of these innovations (PDI and kinship) in the A-KinGDom model to explain the social structure shown by the primate groups of Cercopithecidae in the pilot study. More specifically, we hypothesized that the simulation condition combining ambiguity-reducing attack and Fight&Groo+Kin strategy could provide an appropriate explanation of the social structure shown by a captive group of mangabeys. .
The Model
- 2.1
- The A-KinGDom agent-based model is adapted from GrooFiWorld (Puga-González et al. 2009), which in turn is an extension of DomWorld (Hemelrijk 1998) but differs in some points (see Figure 1).
- 2.2
- Our model, the GrooFiWorld model and some features of the DomWorld model share the following four points: 1) the grouping rules executed by the agents, 2) dominance interactions between two agents, 3) affiliative interactions defined by the parameter Anxiety and 4) the different parameters that regulate Anxiety. Regarding the first point, agents move around a two-dimensional world in search of other agents in order to perform different kinds of social interactions. This searching process is defined by grouping rules in which each agent has three searching distance levels that range in priority from high to low: a) Personal Distance: the distance at which two agents can perform a social interaction; b) Near Distance: if an agent detects other agents within its near distance, it continues moving in its original direction; and c) Maximum Distance: if an agent perceives other agents within its maximum distance, it moves towards them. Finally, if an agent does not perceive any other agents within its maximum distance, it randomly turns at a 90-degree angle to the right or left to search for another agent.
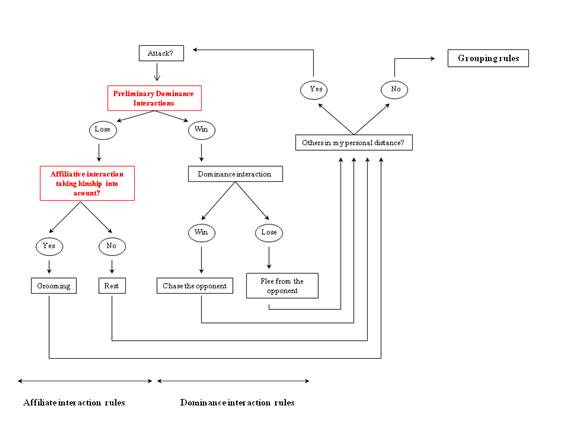
Figure 1. The social interactions included in the A-KinGDom model. Grouping rules and dominance interactions are based on the DomWorld model (Hemelrijk 1998). Affiliative interactions are based on the GrooFiWorld model (Puga-González et al. 2009). Preliminary dominance interactions and kinship relations (in red) are additions that modify the A-KinGDom model. - 2.3
- In terms of the second point, when an agent meets another agent within its Personal Distance, it can perform a dominance or affiliative interaction. Dominance interactions between two agents (i and j) are modulated through dominance rules described as follows:
- A random value between 0 and 1 [RND (0, 1)] is obtained
- If

(1) then agent i wins the dominance interaction and gets an outcome of wi = 1; DOMi and DOMj represent the current dominance levels (or the capacity to win a dominance interaction) of agents i and j, respectively. However, if agent i loses the dominance interaction and gets an outcome of wi = 0 (Hemelrijk 1998). At the beginning of the simulation, the experimenter specifies a DOM value which is updated at each time unit.
- The DOM values are updated by increasing the winner's DOM value,
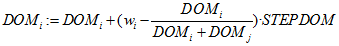
(2.1) and decreasing that of the loser,
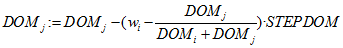
(2.2) where STEPDOM is a constant (between 0 and 1) specified by the experimenter and acts as a scaling factor to indicate the strength or intensity of interaction (Puga-González et al. 2009). In accordance with Puga-González et al. (2009), to keep DOM values positive, their minimum value is arbitrarily set at 0.01.
Some authors have proposed modifications to these equations (e.g., de Vries 2009), but we decided to include the original equations described in GrooFiWorld (2009), which in turn are still used in the latest extension of GrooFiWorld (Hemelrijk & Puga-González 2012). - The winning agent chases the opponent one distance unit and then turns randomly at a 45-degree angle to the right or left to avoid the possibility of interacting with the same opponent again. The losing agent flees by turning 180 degrees and moving forward two units.
- 2.4
- Regarding the third point, according to Puga-González et al. (2009), grooming behavior is induced by the level of anxiety, which ranges from calm to tense and can be measured on a scale of 0 to 1. If the agent decides that it is too dangerous to attack and then considers whether or not to execute a cooperative interaction with its partner, it does so based on the following rules:
- A random value between 0 and 1 [RND (0, 1)] is obtained.
- If Anxiety < RND (0, 1), an affiliative interaction does not occur and both agents flee from each other by randomly turning 45 degrees to the right or left and moving forward one distance unit.
- c. If Anxiety ≥ RND (0, 1), an affiliative interaction occurs.
- 2.5
- Because exponential distribution is often used to describe long-term behaviors (Lendrem 1986), in the A-KinGDom model, the duration or length of a grooming session is determined by a value that is randomly sampled from an exponential distribution whose mean is the Mean Grooming parameter. We set Mean Grooming at 1; as a result, more than 95% of grooming interactions lasted three time units or fewer.
- 2.6
- Regarding the fourth point that our model shares with GrooFiWorld, as described above, affiliative interactions (i.e., grooming) are induced by the Anxiety parameter and its value depends on the following parameters: a) during periods without grooming, Anxiety increases in accordance with the Anxiety Increase parameter; b) grooming reduces both the groomee's and the groomer's Anxiety, but more the former's than the latter's (Decrease of Anxiety in Groomee and Decrease of Anxiety in Groomer parameters); and c) Anxiety increases in both agents after each fight (Increased Anxiety after Fighting parameter) (Castles & Whiten 1998). Each of these four parameters adds to or subtracts from the current agent's Anxiety, whose initial value is defined by the experimenter. The current Anxiety determines whether or not an agent executes an affiliative interaction.
- 2.7
- Our model differs from GrooFiWorld in the following two points: 1) we changed and expanded "the mental battle" to preliminary dominance interactions (PDIs) by introducing two dominance strategies and 2) we introduced the kinship factor. First, in A-KinGDom, when an agent meets another within its Personal Distance, it executes a pre-defined number of PDIs (a parameter called RiskPerception). A PDI consists of: a) obtaining a random value between 0 and 1; b) comparing this value with the outcome of applying one of the two dominance strategies (risk-sensitive attack or ambiguity-reducing attack) described below; c) if the result of the equation is satisfied, then the agent concludes that, if the dominance interaction had occurred, it probably would have won. This process is repeated as many times as the pre-defined number of PDIs (RiskPerception) and, if the agent wins on all occasions, then it decides to execute a dominance interaction. PDIs are not real aggressions performed between two agents, but an internal simulation of the possible outcomes of an agonistic encounter with the current opponent.
- 2.8
- The A-KingDom model identifies two different dominance strategies, which in turn are inspired by Hemelrijk (1998): the risk-sensitive attack strategy (RS) and the ambiguity-reducing strategy (AR). In accordance with this idea, we established the following rule:
- Let |d| be the difference in hierarchical rank (integer values obtained by discretizing and ordering DOM values) between the two agents (agent i's current rank minus agent j's current rank), and N the number of agents.

(3) when Q takes values between 0 and 1.
- A random value between 0 and 1 [RND (0, 1)] is obtained.
In the RS strategy, the attack depends on the risks involved, i.e., agents attack other agents whose hierarchical rank is significantly different from their own (Hemelrijk 1998). Thus,if RND (0, 1) > Q, then no dominance interaction occurs and both agents flee from each other.
Otherwise, in the AR strategy, the attack depends on the containment of aggression; agents only attack others whose hierarchical rank is similar to their own (Hemelrijk 1998). Thus,
if RND (0, 1) ≤ Q, then a dominance interaction occurs following the dominance rules described above (Equation 1).if RND (0, 1) < Q, then no dominance interaction occurs and both agents flee from each other.
if RND (0, 1) ≥ Q, then a dominance interaction occurs following the dominance rules described above (Equation 1).
- Let |d| be the difference in hierarchical rank (integer values obtained by discretizing and ordering DOM values) between the two agents (agent i's current rank minus agent j's current rank), and N the number of agents.
- 2.9
- The second point on which our model differs from GrooFiWorld is kinship. As pointed out above, kinship is an intrinsic factor in groups of primates that modulates affiliative interactions such as grooming and determines the social structure of these groups (Silk et al. 1981; Silk 2009). We therefore included a new parameter defined as Kinfactor = 1 + r 2, where r is the coefficient of relatedness or the level of consanguinity between two given individuals (a value between 0 and 1) and represents the percentage of genes that those individuals share by common descent (Wilson 1975). For example, in diploid systems, descendents inherit half of their genome from one parent and have a coefficient of relatedness of 0.5. In the next generation, the new individual inherits half of its genome from one parent and half of genome from the parent's parent (the grandparent). Thus, the coefficient of relatedness between grandfather and grandchild is 0.25. In general, we can calculate the coefficient of relatedness as r = (½) n, where n is the number of generation ties (Wilson 1975). Thus, we propose that the chances of performing an affiliative interaction will depend on two parameters, Anxiety and Kinfactor, following the rule:
Anxiety * Kinfactor > RND (0, 1)
where high values in one or both parameters increase the chances of performing an affiliative interaction. - 2.10
- In accordance with the presence or lack of the Kinfactor, the model distinguishes two affiliative strategies: a) an affiliative strategy without kinship (Fight&Groo) and b) an affiliative strategy with kinship (Fight&Groo+Kin). In the Fight&Groo strategy, the affiliate interactions develop under GrooFiWorld rules (i.e., the Anxiety value determines if the agents perform a grooming interaction). However, in the Fight&Groo+Kin strategy, the Kinfactor parameter also regulates the chances of performing a grooming interaction.
The Software
- 3.1
- Some authors (Lehmann et al. 2005; Bryson et al. 2007; Evers et al. 2011) have replicated DomWorld (Hemelrijk 2002) by implementing versions in NetLogo (Wilensky 2005), but we preferred to program the model from scratch using a low-level programming language very similar to the one used by Hemelrijk (1998) and (Puga-González et al. 2009). Thus, the A-KinGDom agent-based model was implemented in a program written in C and Delphi, which runs in Windows (The model pseudocode can be found at http://www.openabm.org/model/3865/version/1/view).
- 3.2
- The A-KinGDom software reads initial parameters from a text file, performs the simulations and saves the agents' information to three text files. The first text file contains the basic information of the simulation. The A-KinGDom browser reads this text file and displays the interaction and movement of the agents in the microworld. The second text file contains all the information about the agents' movements and interactions so the outcomes can be analyzed (i.e., agents' coordinates, aggressive interactions and grooming interactions at each time unit). The third text file shows the main measures and matrices calculated in the current article (see Methods). An executable file, sample data files and a demo video can be found at http://www.openabm.org/model/3865/version/1/view.
Agents
- 3.3
- An agent i has coordinates (xi (t), yi (t)) and heading αi (t) at time t, which is defined as the vector connecting its location at t-1 with its location at t. The heading is expressed as the counterclockwise angle between that vector and the X axis, αi (t) = tan-1 [(yi (t) − yi (t−1)) / (xi(t) − xi (t−1))].
- 3.4
- Based on Hemelrijk's (1998) agent-based model, the agents have the following perceptual and motor features: a) Vision Angle, defined as a semicircular sector whose center is the agent's current location and which is bisected by its current heading vector; and b) Searching Distances, which allow agents to execute a set of grouping rules.
Strategies
- 3.5
- Strategies represent different kinds of social relations between members in a group of primates that can provoke the emergence of different social behaviors. The following four strategies are included in A-KinGDom (described above, in The Model):
- Dominance strategy: risk-sensitive attack (RS).
- Dominance strategy: ambiguity-reducing attack (AR).
- Affiliative strategy without kinship (Fight&Groo).
- Affiliative strategy with kinship (Fight&Groo+Kin).
Methods
- 4.1
- We ran a series of simulations with the A-KinGDom program to study the emergence and maintenance of social structure in a group of virtual non-human primates. The results obtained from four simulation conditions were compared with data obtained from empirical observations of a captive group of mangabeys (Cercocebus torquatus) (see Figure 2). The mangabey group had been living together at Barcelona Zoo without showing any stress problems for the previous three years. The group showed a well-defined matrilineal hierarchy in which each infant acquired its mother's rank. Forty hours (2400 min) of video-camera footage was filmed and used to analyze the subjects' aggressive behaviors and spatial distribution. Focal samplings of the subjects were also taken over the course of 40 observation sessions (2400 min) to obtain data on affiliative behavior (Dolado & Beltran 2012).
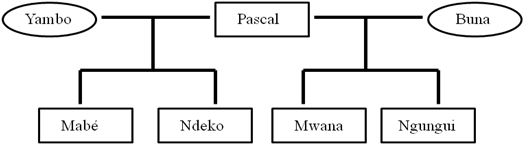
Figure 2. Family tree of the group of Cercocebus torquatus at Barcelona Zoo. Males are enclosed in rectangles and females in circles (Ngungui was a newborn) (Dolado & Beltran 2012). - 4.2
- Four simulation conditions were specified: a) Fight&Groo and RS strategy (RS-FG); b) Fight&Groo and AR strategy (AR-FG); c) Fight&Groo+Kin and RS strategy (RS-FGK); and d) Fight&Groo+Kin and AR strategy (AR-FGK). We ran 120 simulations in total, i.e., 30 per each simulation condition (see Table 2).
Table 2: Four simulation conditions and the number of simulations for each condition using A-KinGDom. Fight&Groo strategy Fight&Groo+Kin strategy RS strategy 30 simulations (RS-FG) 30 simulations (RS-FGK AR strategy 30 simulations (AR-FG) 30 simulations (AR-FGK) World, time regime and initialization
- 4.3
- Agents moved in a closed two-dimensional world of 100 × 100 distance units or cells, and each one could be occupied by only one agent at a time. In accordance with Puga-González et al. ( 2009), the simulations took 36,400 time units. Every run consisted of 260 periods and each period consisted of 140 activations (the number of agents, i.e., 7, times 20).
- 4.4
- The values for the general simulation and agent parameters were the same as those used in previous studies (Puga-González et al. 2009), namely, for Personal Distance, Near Distance, Maximum Distance, Vision Angle, RiskPerception, Anxiety, Increase of Anxiety, Decrease of Anxiety in Groomee, Decrease of Anxiety in Groomer and Increase of Anxiety after Fighting (Table 3).
Table 3: Initial values used in A-KinGDom simulations. Except for the Anxiety value (which is updated after each time unit), these parameter values were fixed for the entire simulation in accordance with Puga-González et al. (2009). Initial Coordinates random* Initial Heading random Sex Ratio (Female/Male) 2/5 Personal Distance 8 Near Distance 24 Maximum Distance 50 Vision Angle 120° RiskPerception 2 Anxiety 0.5 Increase of Anxiety 0.01 Decrease of Anxiety in Groomee 0.15 Decrease of Anxiety in Groomer 0.1 Increase of Anxiety after Fighting 0.1 (*) As observed in individuals in the mangabey group, the agents were located at random throughout the entire world, not in a constrained area like in GrooFiWorld. - 4.5
- The values for parameters such as DOM (dominance), Stepdom (intensity of aggression) and the Coefficient of relatedness (kinship) were adopted in accordance with empirical data from Dolado and Beltran (2012). The initial DOM value was defined by the experimenter and assigned based on the dominance relations empirically observed in the mangabey group. Specifically, the initial DOM values of each agent were defined based on the observed dominance hierarchy in the group. Singh, Singh, Sharma and Krishma (2003) proposed a method to measure the dominance hierarchy that provides an ordered list of the members of the group showing the distance between them in an interval scale. In order to construct a standardized interval scale, the lowest value was considered an arbitrary zero. In accordance with Dolado and Beltran (2012), the individuals were arranged in order from Pascal to Ngungui (Table 4) according to a standardized interval scale (which determined hierarchical distances among group members). Thus, we used these standardized interval scale to assign initial DOM values, which were updated by the program based on the model at each time unit.
Table 4: Standardized interval scales that determined the hierarchical distances between members of the mangabey group (Dolado & Beltran 2012). These distances were used to define initial DOM values. Agent/Individual Standardized interval scale
(Dolado & Beltran 2012)A /Pascal 2.71 B/Yambo 2.09 C/Mabé 1.95 D/Ndeko 1.23 E/Buna 1.17 F/Mwana 1.04 G/Ngungui 0 - 4.6
- We did a previous study using GrooFiWorld conditions in A-KinGDom software to determine the range of initial DOM values. These initial DOM values should allow us to obtain stability in hierarchy dominance similar to that shown by the group of mangabeys during all the time units of the simulation. We therefore used the standardized interval scales obtained by Dolado and Beltran (2012) and determined two simulation conditions using two different initial DOM values: the DOM values multiplied by 10 and by 1000, respectively. We ran 10 simulations per simulation condition using the GrooFiWorld model and initial parameters shown in Tables 3 and 4, and the STEPDOM parameter shown in Table 6. The results of this previous study showed that low initial DOM values provoked some changes in the DOM values which in turn provoked changes in the matrilineal hierarchy (see Figure 3 and Table 5). We therefore decided to use the high initial DOM values shown in Table 6 (DOM values × 1000), where the variation coefficient was low (Table 5) to ensure stable DOM values during all time units.
Table 5: Mean, standard deviation and variation coefficient (standard deviation divided by the mean) of DOM values through simulations under two different simulation conditions (initial DOM values using the standardized interval scale ×10 and ×1000, respectively). Agent G is not included because its initial DOM value (0) showed no change. Agent Mean±SD Dom Value (x10) Variation Coefficient Dom Value (x10) Mean±SD Dom Value (x1000) Variation Coefficient Dom Value (x1000) A 27.59±0.53 0.02 2711.26±0.28 1.03E-04 B 20.92±0.29 0.01 2089.86±0.85 4.06E-04 C 19.50±0.59 0.03 1950.56±0.60 3.07E-04 D 10.76±0.64 0.06 1228.81±0.33 2.68E-04 E 10.05±0.80 0.08 1168.64±0.39 3.33E-04 F 7.23±2.69 0.37 1038.01±0.41 3.95E-04 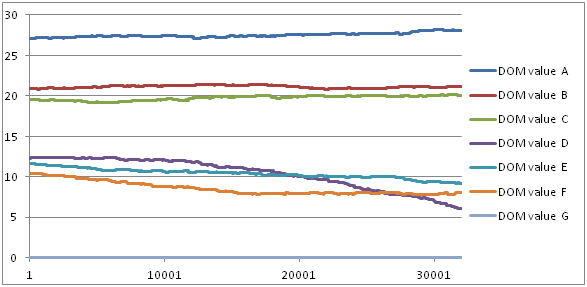
Figure 3. Example of DOM value evolution during all the time units of a simulation under the initial DOM value condition (Dom Values × 10). - 4.7
- Stepdom values were assigned to each agent by the experimenter. Stepdom values reflect the intensity of aggression, which depends on the body size and muscular strength of each individual and differs depending on sex and age in different species (Hemelrijk 1998). Moreover, in species with despotic dominance styles where the aggression is severe, high Stepdom values are expected, especially in dominant individuals. Otherwise, in species with egalitarian dominance styles, low Stepdom values are expected. The data obtained from observations of the mangabey group showed that, although the aggression rate was high, the intensity of aggression was low, which resulted in behavior similar to that observed in the relaxed-egalitarian dominance style (Dolado & Beltran 2012). We therefore assigned Stepdom values to each agent based on the features observed in the members of the mangabey group and the values described by Puga-González et al. (2009). We assigned low Stepdom values to differentiate between adult and young males (0.1), adult females (0.08) and an infant male with a nominal value set at 0.01 (Table 6). Finally, Coefficient of relatedness values were assigned according to the coefficients observed between the members of the mangabey group (see Figure 2 and Table 7).
Table 6: Agents' initial DOM and Stepdom values. Values were determined based on a previous study of a group of 7 mangabeys (Dolado & Beltran 2012). The group consisted of 1 adult male, 2 adult females, 2 young males and 1 infant male, as shown in the primate age-sex class column. Agent Primate Age-sex class Initial DOM Stepdom A Adult male 2710 0.10 B Adult female 2090 0.08 C Young male 1950 0.10 D Young male 1230 0.10 E Adult female 1170 0.08 F Young male 1040 0.10 G Infant male 0 0.01 Table 7: Matrix of coefficients of genetic relatedness (r) between agents (Wilson 1975). Values determined based on a previous study of a group of 7 mangabeys (Dolado & Beltran 2012). A B C D E F G
A
-B 0 - C 0.5 0.5 - D 0.5 0.5 0.5 - E 0 0.5 0.25 0.25 - F 0.5 0.25 0.375 0.375 0.5 - G 0.5 0.25 0.375 0.375 0.5 0.5 - Quantifying the Social Structure
- 4.8
- Data obtained from the simulations consisted of a record of every change in spatial position by each agent, the mean distance between group members, the individuals' centrality indices and the main measures that characterize social structure in Cercopithecidae (i.e., dominance and affiliative relations; see Table 1). We also recorded the identities of the attackers and their opponents, the winners and losers, their updated DOM values, the identities of the groomers and groomees, their updated Anxiety values and the time they spent grooming.
- 4.9
- According to Puga-González et al. (2009), the measures quantifying the social structure were calculated as follows. The hierarchy gradient among all the individuals was measured using the coefficient of variation of the DOM values (standard deviation divided by the mean) (Sokal & Rohlf 1981). The percentage of aggressive interactions that involved fighting was calculated by dividing the frequency of fighting by the overall frequency of interaction; likewise, the percentage of affiliative interactions was calculated by dividing the frequency of grooming by the total frequency of interaction. The diversity of partners with whom an individual performed grooming was measured using the Berger-Parker dominance index (Southwood 1978) by dividing the frequency with which an individual groomed its favorite partner by the individual's total grooming frequency.
- 4.10
- The proximity of partners i and j was a function of their mean Euclidean distance (dij) across all the time units of the simulation. The disparity of the distance units measured between the agents in the A-KinGDom microworld and the individuals in the zoo facility made it difficult to compare the proximity values obtained (i.e., pixels measured in simulation software versus meters measured in the zoo facility). We therefore decided to include the "scale distance" measure, whereby the proximity of partners (pixels or meters) was divided by the maximum theoretical distance between two agents or subjects in their microworld or zoo facility. The individuals' spatial centralities were calculated in accordance with Mardia (1972); for each individual i, a unit vector towards every other individual j was calculated at every time unit, wij = (tij, uij vij, ), with coordinates tij = (xj − xi) / dij, uij = (yj − yi) / dij and vij = (zj − zi) / dij), where (xi, yi, zi) and (xj, yj, zj) were the coordinates of individuals i and j. Individual i's centrality was then the module of the sum vector of its unit vectors towards all the other subjects. Individuals with sum vectors having lower modules were more central than other individuals. Centralities were tested using Hemelrijk's method (1998) and the degree of centrality was calculated by means of a Kendall rank correlation between the individual's dominance rank and its spatial centrality at each time unit.
- 4.11
- Correlations between rank, aggression and grooming were calculated using Kendall rank correlations. The reciprocity/interchange between aggression, grooming and proximity among individuals was measured by means of the Tau-Kr correlation between these matrices. The Tau-Kr correlation is a nonparametric variant of the Mantel test (Hemelrijk 1990) and is commonly used in animal behavior studies (Lu, Koenig & Borries 2008). When analyzing reciprocity, each matrix was correlated with its transposed matrix; when analyzing interchange, the grooming matrix was correlated with the proximity of the partner and dominance values (DOM values at the end of the simulation) (for an example, see Figure 4). The Mantel test is performed by randomly permuting rows and columns in one of the matrices many times and calculating the correlation coefficient with the other matrix for each permutation. The observed value of the correlation coefficient is compared with the distribution of those random correlation coefficients to determine its statistical significance. As proposed by Hemelrijk (1990), we computed the Tau-Kr correlation and obtained the level of significance based on 2,000 permutations.
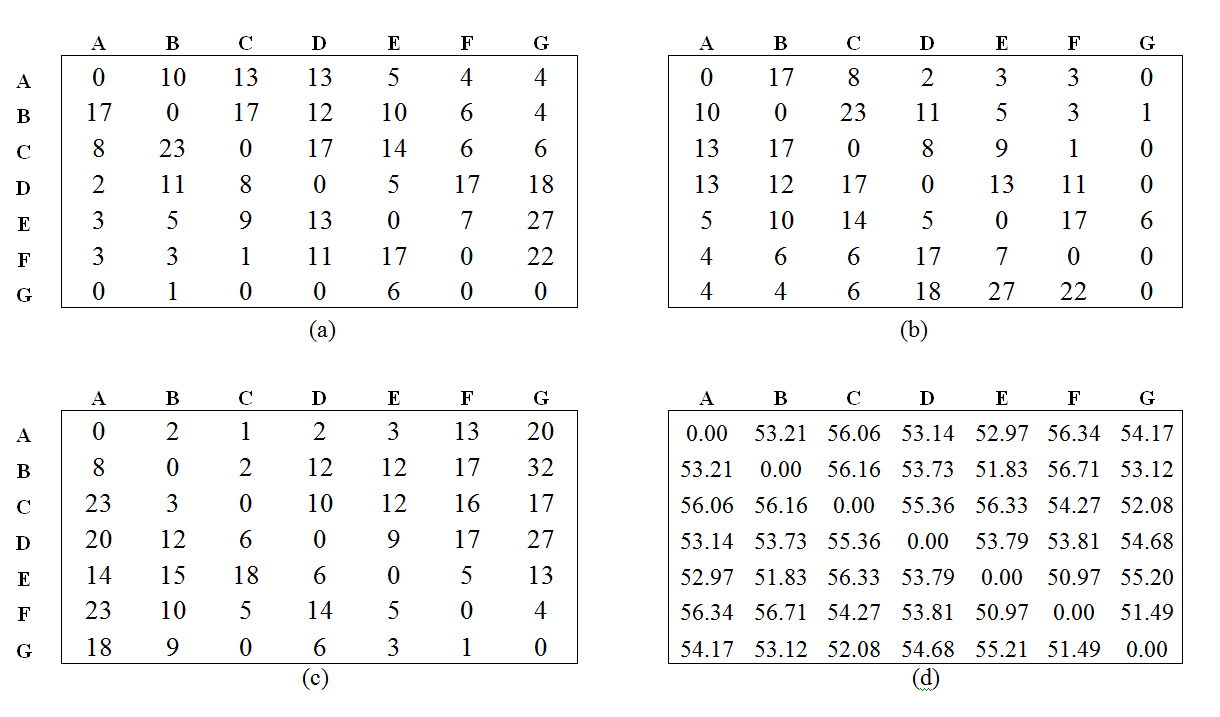
Figure 4. Example of matrices obtained from simulations used to calculate the Tau-Kr correlation in the reciprocity/interchange processes for agents: a) aggression matrix and b) its transposed, which are used in the analysis of aggression reciprocity to obtain "unidirectionality of aggression"; and c) grooming matrix and d) mean distance matrix, which are used in the analysis of the interchange process to obtain "correlation between grooming and proximity partner", as described by Puga-González et al. (2009).
Results
- 5.1
- The comparison of the data obtained from the simulation under the four conditions using the A-KinGDom program and the results obtained from the observation of captive mangabeys (Dolado & Beltran 2012) is shown in Table 8. The results obtained from each simulation condition are summarized either as the mean or the SD (Standard Deviation).
- 5.2
- Moreover, a one-way ANOVA was conducted for each behavioral measure and showed significant differences (p<0.001) between all behavioral measures in the four simulation conditions (RS-FG, RS-FGK, AR-FG and AR-FGK), except for "centrality of dominants," "correlation between rank and grooming given," "correlation between grooming and proximity of partner" and "grooming up the hierarchy." These measures are shown in Table 8, but were not taken into account in the comparison between data obtained from simulations and the results obtained from the captive group of mangabeys. Also not included in the comparison was the measure "mean distance between group members" because it was not possible to compare the unit of measure used in the zoo facility with the unit measures used in the simulations. Instead, we used the measure "scale distance" as described above (see Quantifying the Social Structure in the Methods section).
- 5.3
- The data obtained from the simulations under the AR-FGK strategy condition were the closest to the results observed in the group of mangabeys, which indicates that AR-FGK is a plausible candidate strategy to explain the emergence of the social structure in this group of mangabeys. In fact, seven measures obtained from the group of mangabeys matched or were the closest approximation to the range of results obtained under the AR-FGK condition (i.e., "gradient of hierarchy", "percentage of interaction that involves fighting", "correlation between rank and the number of fights lost", "scale distance", "percentage of interactions that involve grooming", "Berger-Parker dominance index for grooming patterns" and "grooming reciprocation"). It must be noted that the comparison between data obtained from our simulations and from the group of mangabeys was only done at a descriptive level because, although the simulations provided data distributions, the empirical results consisted of single summarizing values.
Table 8: Data obtained from simulations under the four conditions (see text for details) using the A-KinGDom program compared to data obtained from empirical observations of a group of captive mangabeys (Dolado & Beltran 2012). The means and SDs (Standard Deviation) of values that were statistically significant are shown for Tau-kr correlations. Data obtained from RS-FG RS-+FGK AR-+FG AR-+FGK mangabeys(3) Mean ±SD Mean ±SD Mean ±SD Mean ±SD Aggression patterns Gradient of hierarchy 0.60 0.61±3.05E-04 0.61±4.79E-04 0.60±2.07E-16 0.60±2.07E-16 Unidirectionality of aggression (2) - 0.41 0.35±0.09** 0.34±0.09** 0.55±0.05** 0.44±0.07** Percentage of aggression interactions that involve fighting 0.72 0.28-0.35 0.51-0.54 0.38-0.42 0.54-0.58 Correlation between rank and aggression given (1) 0.57 0.81±0.06 0.90±0.07 -0.10±0.15 -0.11±0.16 Correlation between rank and number of fights lost (1) -0.40 -0.56±0.10 -0.79±0.08 -0.48±0.13 -0.48±0.12 Mean distance between group members 0.86m 53.86±0.44 52.51±0.48 53.39±0.38 52.50±0.59 Scaled distance 0.10 0.38±3.46E-03 0.37±3.79E-03 0.38±E4.07E-03 0.37±0.01 Centrality of dominants 0.23 -0.20±0.26 -0.12±0.31 -0.10±0.25 -0.15±0.32 Affiliative patterns Percentage of affiliative interactions that involve grooming 0.28 0.65-0.72 0.46-0.49 0.58-0.62 0.42-0.46 Berger-Parker dominance index for grooming partners 0.32 0.24±0.01 0.28±0.01 0.25±0.01 0.30±0.01 Correlation between rank and grooming given (1) 0.48 -0.02±0.17 0.04±0.09 -0.01±0.17 0.01±0.16 Correlation between grooming and proximity of partner (2) -0.31 -0.24±0.04* -0.25±0.07* -0.04±0.25* 0.04±0.4* Grooming reciprocation (2) 0.40 0.58±0.11* 0.17±0.03* 0.68±0.06* 0.23±0.07* Grooming up the hierarchy (2) 0.43 -0.05±0.08* -0.06±0.09* -0.01±0.08* -0.03±0.05* Note:(1) Kendall Correlations, (2) Tau Kr Correlations, (3) Dolado and Beltran (2012),* p<0.1 and **p<0.05.
Discussion
- 6.1
- Previous studies (Dolado & Beltran 2012) demonstrated that the GrooFiWorld model could be used as a starting point to study the social structure patterns observed in several Cercopithecidae species that were similar to macaques. We therefore introduced two modifications in the model (PDIs and kinship) and compared the results from the simulations with data obtained from a group of captive mangabeys.
- 6.2
- The results showed that the dyadic interactions between agents using simple behavior rules in the A-KinGDom model produced a social structure that is roughly equivalent to the structure observed in groups of non-human primates (i.e., mangabeys). Specifically, the results of the AR-FGK condition were closer to those observed in the group of captive mangabeys. According to the initial hypothesis, both of the innovations (PDI and kinship) included in the A-KinGDom model could be used to explain the social structure of groups of primates. In fact, the empirical data and simulation results under the AR-FGK condition indicated that both the group of mangabeys and the virtual primates in A-KinGDom had social structures that were close to grade 3, which is labeled a relaxed social style in accordance with the co-variation hypothesis model (Thierry 2004).
- 6.3
- The differences found between the "scale distance" values can be explained by the differences between the two environments. While the microworld was a two-dimensional space in which all the cells could be occupied by agents, the zoo facility was a three-dimensional space where the subjects lived.
- 6.4
- However, the values of two measures from simulations under the AR-FGK condition clearly did not fit the empirical data. The measures "unidirectionality of aggression" and "correlation between rank and aggression given" obtained from the simulations agreed with a social structure close to grade 3, a relaxed social style, but the values of both measures obtained from the group of mangabeys did not reflect a relaxed social style, probably because these measures were highly influenced by the temporal biological dynamics of the group. Thus, according to Gust and Gordon (1991, 1994), sooty mangabeys (Cercocebus torquatus atys) with offspring up to the age of three exhibit a strict matrilineal kinship-linked dominance hierarchy where some of the aggression patterns are similar to those observed in a despotic social style. The data obtained from the group of mangabeys reflected that situation because the youngest male was a newborn when the empirical observations began (Dolado 2011) (see Figure 2). However, in future research we plan to explore how aggression rates affect the length of grooming interactions by assigning different Mean Grooming values (i.e., the anticipated duration of a grooming session).
- 6.5
- Although our results cannot be considered general for Cercocebus species because of the low-N and the captivity, we decided to compare the simulation results with the data obtained from the group of captive mangabeys in this pilot study for two reasons: a) although enclosure features strongly influence the behavior of Cercopithecidae (Mallapur et al. 2005), studying individuals in captivity makes it possible to collect thorough behavioral measures, specify exact distances between animals and avoid missing data (i.e., lack of interaction between animals or less observation time of missing individuals) and, b) data collection provided us with information on all group members, including the infant and juvenile subjects. Although traditional social structure studies focus on adult male and female subjects, infant and juvenile subjects also contribute to the social structure and they should be taken into account as well (Kappeler & van Schaick 2002).
- 6.6
- Thus, based on the covariation hypothesis model of the social structure composed of competition, cooperation and kin relationships (Thierry 2004), we developed an agent-based model that includes all three factors on which aggressive and affiliative behaviors are based on the DomWorld (Hemelrijk 1998) and GrooFiWorld (Puga-González et al. 2009) models. We then developed a program (A-KinGDom) that implements this agent-based model. Running the A-KinGDom simulations provides a set of quantitative measures of the social structure that can be compared with empirical data obtained from naturalistic observations of a group of primates, thus providing evidence of the plausibility of the model. In future studies, our model can be used to develop predictions about social structure in other groups of the family Cercopithecidae under different conditions. For example, we could use simulations to forecast how events such as the arrival or loss of certain members or adaptation to a new environment can affect the social structure.
- 6.7
- In general, this study demonstrated that agent-based models are a good tool for studying the emergence of a complex nonlinear system (i.e., social structure). Specifically, the social styles shown by species of the family Cercopithecidae include the main behaviors involved in the social structure of primate societies and provide a phylogenetic basis for their study.
Acknowledgements
-
This project was partially funded by a grant from the Directorate General for Research of the Government of Catalonia (2009SGR-1492) and from the Ministry of Science and Innovation of the Spanish Government (PSI2009-09075).
References
-
te BOEKHORST, I. and Hogeweg, P. (1994). Effects of tree size on travelband formation in Orang-utans: Data analysis suggested by a model study. In R. Brooks, & P. Maes (Eds.), Artificial Life IV (pp. 119–129). Cambridge, MA: The MIT Press.
BRYSON, J. J., Ando, Y. and Lehmann, H. (2007). Agent-based modeling as scientific method: a case study analyzing primate social behavior. Philosophical Transaction of the Royal Society B, 362, 1685–1698. [doi:10.1098/rstb.2007.2061]
CALL, J., Judge, P. G. and de Waal, F. B. M. (1996). Influence of kinship and spatial density on reconciliation and grooming in rhesus monkeys. American Journal of Primatology, 39 (1), 35–46. [doi:10.1002/(SICI)1098-2345(1996)39:1<35::AID-AJP3>3.0.CO;2-T]
CASTLES, D. L. and Whiten, A. (1998). Post-conflict behaviour of wild olive baboons. II. Stress and self-directed behaviour. Ethology, 104, 26–38. [doi:10.1111/j.1439-0310.1998.tb00058.x]
CHAPAIS, B. (2004). How kinship generates dominance structures: a comparative perspective. In B. Thierry, M. Singh, & W. Kaumanns (Eds.), Macaque Societies: a model for the study of social organizations (pp. 186–204). Cambridge, UK: Cambridge University Press.
DOLADO, R. (2011). Agressió, grooming i kinship: un model integral de jerarquia en Cercopithecinae basat en la conducta adaptativa. Unpublished Diploma thesis: Universitat de Barcelona.
DOLADO, R. and Beltran, F. S. (2011). Dominance hierarchy and spatial distribution in captive red-capped mangabeys (Cercocebus torquatus torquatus): testing Hemelrijk's agent-based model, Interaction Studies, 12(3), 461–473. [doi:10.1075/is.12.3.05dol]
DOLADO, R. and Beltran, F. S. (2012). Emergent patterns of social organization in captive Cercocebus torquatus: Testing the GrooFiWorld agent-based model. Journal of Biosciences, 37 (4), 777–784. [doi:10.1007/s12038-012-9231-5]
EVERS, E., de Vries, H, Spruijt, B.M. and Sterck, E.H.M. (2011). Better safe than sorry-Socio-spatial group structure emerges from individual variation in fleeing, avoidance or velocity in an agent-based model. PLos One, 6 (11): e26189. [doi:10.1371/journal.pone.0026189]
GILBERT, N. and Troitzsch, K. G. (1999), Simulation for the social scientist, Buckingham, UK: Open University Press.
GOUZOULES, S. (1984). Primate mating systems, kin associations, and cooperative behaviour: Evidence of kin recognition? Yearbook of Physical Anthropology, 27, 99–134. [doi:10.1002/ajpa.1330270506]
GUST, A.D. and Gordon, T.P. (1991). Female rank instability in new formed group of familiar sooty mangabeys (Cercocebus torquatus atys). Primates, 32,465–471. [doi:10.1007/BF02381937]
GUST, A.D. and Gordon, T.P. (1994). The absent of a matrilineally based dominance system in sooty mangabeys, Cercocebus torquatus atys. Animal Behaviuor, 47, 589–594. [doi:10.1006/anbe.1994.1082]
HEMELRIJK, C. K. (1990). Models of, test for, reciprocity, unidirectionality and other social interaction patterns at a group level. Animal Behaviour, 39, 1013–1029. [doi:10.1016/S0003-3472(05)80775-4]
HEMELRIJK, C. K. (1998). Risk sensitive and ambiguity reducing dominance interactions in a virtual laboratory. In R. Pfeifer, B. Blumberg, J. A. Meyer & S. W. Wilson (Eds.), From Animals to Animats V (pp. 255–262). Cambridge, MA: MIT Press.
HEMELRIJK, C. K. (2002). Despotic societies, sexual attraction and the emergence of male "tolerance": an agent-based model. Behaviour, 139, 729–747. [doi:10.1163/156853902320262790]
HEMELRIJK, C. K. and Puga-González, I. (2012). An individual-oriented model on the emergence of support in fights, its reciprocation and Exchange. PLosOne, 7 (5): e37271.
HOGEWEG, P. (1988). MIRROR beyond MIRROR, puddle of LIFE. In Langton, C. (Ed.), Artificial life, SFI studies in the sciences of complexity (pp. 297–316). Redwood City California: Addison-Wesley Publishing Company.
KAPPELER, P. M. and van Schaik, C.P. (2002). Evolution of primate social systems. International Journal of Primatology, 23, 707–740. [doi:10.1023/A:1015520830318]
KURLAND, J. A. (1977). Kin selection in the Japanese monkey. Contributions to Primatology, 12, 1–145.
LEHMANN, H, Wang, J. J. and Bryson, J. J. (2005). Tolerance and sexual attraction in despotic societies: a replication and analysis of Hemelrijk (2002). In the proceedings of Modeling Natural Action Selection. Edinburgh, Scotland.
LENDREM, D. (1986). Modelling in behavioural ecology: an introductory text. Timber Press: Portland, Oregon. [doi:10.1007/978-94-011-6568-6]
LU, A., Koenig, A. and Borries, C. (2008). Formal submission, tolerance and socioecological models: a test with female Hanuman langurs. Animal Behaviour, 76, 415–428. [doi:10.1016/j.anbehav.2008.04.006]
MALLAPUR, A., Waran, N. and Sinha, A. (2005). Use of enclosure space by captive long-tailed macaques (Macaca silenus) housed in Indian zoos. Journal of Applied Animal Welfare Science, 8, 175–185. [doi:10.1207/s15327604jaws0803_2]
MARDIA, M. K. (1972). Statistics of directional data. London: Academic Press.
PUGA-GONZÁLEZ, I., Hildenbrandt, H. and Hemelrijk, C. K. (2009). Emergent patterns of social affiliation in primates, a model. PLos Computational Biology, 5 (12).
RAMOS-FERNÁNDEZ, G., Boyer, D. and Gómez, V. P. (2006). A complex social structure with fission-fusion properties can emerge from a simple foraging model. Behavioral Ecology and Sociobiology, 60, 536–549. [doi:10.1007/s00265-006-0197-x]
SCHINO, G. and Aureli, F. (2008). Trade-offs in primate grooming reciprocation: testing behavioural flexibility and correlated evolution. Biological Journal of the Linnean Society, 95 (3), 439–446. [doi:10.1111/j.1095-8312.2008.01067.x]
SELLERS, W.I., Hill, R.A., and Logan, B.S. (2007). An agent-based model of group decision making in baboons. Philosophical Transactions of the Royal Society B, 362, 1699–1710. [doi:10.1098/rstb.2007.2064]
SILK, J. B., Samuels, A. and Rodman, P. S. (1981). The influence of kinship, rank and sex on affiliation and aggression between adult female and immature bonnet macaques (Macaca radiata). Behaviour, 78 (1–2), 11–137. [doi:10.1163/156853981x00284]
SILK, J.B. (2009). Nepotistic cooperation in non-human primate groups. Philosophical Transactions of the Royal Society B, 364, 3243–3254. [doi:10.1098/rstb.2009.0118]
SINGH, M., Singh, M., Sharma, A. K. and Krishna, B. A. (2003). Methodological considerations in measurement of dominance in primates. Current Science, 84, 5.
SOKAL, R. R. and Rohlf, F. J. (1981). Biometry: The principles and practice of statistics in biological research. San Francisco: W.H. Freeman.
SOUTHWOOD, T. R. E. (1978). Ecological methods with particular reference to the study of insect populations. London and New York: Chapman and Hall.
THIERRY, B. (2004). Social epigenesis. In B. Thierry, M. Singh, and W. Kaumanns (Eds.), Macaque Societies: A model for the study of social organizations (pp. 267–290). Cambridge, UK: Cambridge University Press.
THIERRY, B. (2006). The macaques: a double-layered social organization. In C. Campell, A. Fuentes, K. C. MacKinnon, M. Panger & S. Beader (Eds.), Primates in Perspective (pp. 224–239). New York and Oxford: Oxford University Press.
de VRIES, H. (2009). On using the DomWorld model to evaluate dominance ranking methods. Behaviour, 146 (6), 843–869. [doi:10.1163/156853909X412241]
de WAAL, F. B. M. and Luttrell, L. M. (1989). Towards a comparative socioecology of the genus Macaca: different dominance styles in rhesus and stumptail monkeys. American Journal of Primatology, 19, 83–109. [doi:10.1002/ajp.1350190203]
WALTERS, J. R. (1987). Kin recognition in non-human primates. In D. J. C. Fletcher, & C. D. Michener (Eds.), Kin Recognition in Animals (pp. 359–393). New York: Wiley.
WILENSKY, U. (2005). Net Logo ver. 2.1 Evanston, IL, USA.
WILSON, E. O. (1975). Sociobiology: The new synthesis. Cambridge, MA: Belknap/Harvard.
YAMADA, M. (1966). Five natural troops of Japanese monkeys of Shodoshima Island (I): distribution and social organization. Primates, 7, 315–362. [doi:10.1007/BF01730645]
YOUNGER, S. M. (2003). Discrete agent simulation of the effect of simple social structures on the benefits of resource sharing. Journal of Artificial Societies and Social Simulation 6(3),1 https://www.jasss.org/6/3/1.html.
YOUNGER, S. M. (2010). Leadership in small societies. Journal of Artificial Societies and Social Simulation 13(3), 5 https://www.jasss.org/13/3/5.html.