
 Abstract
- In the paradigm of the search theory, we established the search model applicable to the characteristics of China's resale housing market, by modeling the search behavior for buyer and seller, respectively. Setting the parameters based on the Beijing housing market survey in August 2012, we implemented agent-based simulation to study the dynamics of the search behavior measured by search intensity and search time. Sensitivity test was also used to analyze the determinants of the search behavior for trading agents. The simulation results validate the idiosyncratic feature of the agent's search behavior, which is consistent with theoretical analysis. The increase of matching efficiency promotes the agents' search intensities, but the higher unit search cost can reduce the agents' search intensities. The buyer's search behavior is more sensitive to the change in the market tightness ratio. Brokerage service lowers the transaction price and lessens the agents' search intensities. Sensitivity test further reveals that, the matching efficiency and the market tightness ratio play very important role in improving housing market liquidity. The changes in the search cost and the broker commission rate can reduce the agents' search intensities significantly and there are critical turning points at which the abrupt change occurs.
- Keywords:
- Resale Housing Market, Search Behavior, Search Model, Agent-Based Simulation, Sensitivity Analysis
Introduction
- 1.1
- Housing market is a typical market with trading frictions. Within a certain period, considerable vacant houses and home buyers co-exist as unmatched at the same time, so the housing market is inconsistent with the condition of market clearance. Specifically, the causes for trading frictions in the housing market include four aspects: heterogeneous and multi-attributed goods; private and dispersive transactions; highly asymmetric price information; substantial transaction costs. Due to the existence of trading frictions, it takes plenty of time for buyers and sellers to search and to match each other, and both parties bear the transaction costs induced. Considering the relationship of cost and benefit in the search-matching process, the microscopic behavior of buyers and sellers has significant impacts on the housing price and the market liquidity. Additionally, except the buyers and sellers that are directly involved in the transitions, trading participants in the resale housing market also include real estate broker as intermediary service provider. Intuitively thinking, at the constant unit search cost, when the search intensities of trading participants are promoted in the resale housing market, the number of successful matches and the total search costs will increase, then the economic phenomenon will emerge on the macro level, such as the overshooting of housing price and trading volume, or the fluctuations of the market liquidity measured by the average time to sell for vacant houses.
- 1.2
- Due to the heterogeneity of goods, imperfect information, transaction costs and other factors, the search activities carried out by market participants are widespread in the real life. Since the seminal work of Stigler (1961), many scholars have conducted in-depth research over the past decades in the paradigm of search theory, to explain the subjects such as the search behavior, the price dispersion, as well as the efficiency for resource allocation in these frictional markets (Diamond 1971; Burdett & Judd 1983; Hosios 1990). Currently, the search theory has become an important research area of information economics, with its broad coverage of labor market, credit market and housing market as mentioned here.
- 1.3
- As to the resale housing market, standard search models assume that homogeneous trading participants apply the sequential search strategy to draw offer information from the known price distribution. Based on these theoretical models, many scholars analyzed the search process under incomplete information and market uncertainty, attempted to interpret the formation of housing price and the dynamics of market liquidity with the underlying search behavior (Wheaton 1990; Horowitz 1992; Yavas 1992; Yavas & Yang 1995). Nevertheless, China's resale housing market has its own characteristics in the process of development and restructuring, therefore, the conclusions drawn from the existing models established for the developed countries could be questionable for the following reasons: 1) Different market environments. China's resale housing market is confronted with serious information asymmetry, and the trading participants need bear high transaction costs. By contrast, the resale housing market is relatively mature in most developed countries, with high information efficiency and low transaction costs. 2) Different trading systems. China's resale housing market started up its commoditization process in 1998, and the trading system is still in the fledging period. By contrast, comprehensive financial systems and brokerage services have been established for long in developed countries, such as the Multiple Listing Service (MLS) in North America; 3) Different behavioral patterns. Compared with the market survey on the search behavior in China and other developed countries, the behavioral patterns of trading participants have reflected prominent disparities, such as the search time. For instance, the micro data from National Association of Realtors (NAR) in the U.S. indicates that, median time on the market (TOM) is 7.3 weeks for sellers, 8.2 weeks for buyers (Genesove & Han 2012). By contrast, the survey in China's housing market shows that the TOM is 17.8 weeks for sellers and 29.2 weeks for buyer (Guo et al. 2012; Zhang et al. 2012).
- 1.4
- For the above reasons, we construct the search model applicable to the characteristics of China's resale housing market by modeling the search behavior for market participants consisting of buyers, sellers and brokers. With the application of the theoretical model, we use the survey data of China's housing market to set the model parameters, and then simulate the dynamic process of the agent's search behavior and its influencing factors. Specifically, the search behavior of the trading agent is measured by search intensity and search time. Furthermore, the seller's search time or so-called TOM is also a useful indicator for the housing market liquidity (Krainer 2001). Compared with the past research, this article makes substantial contributions as follows: 1) by addressing the characteristics of China's resale housing market, this article is the first to investigate the micro-level behavior of the housing market participants in the context of a transitional economy; 2) by introducing the intermediary brokerage service commonly seen in China's resale housing market, we attempt to build a theoretical search model with the joint participation of buyers, sellers and brokers; 3) by applying the multi-agent technique, we simulate the search behavior of trading agents, and conduct the sensitivity analysis for its determinants based on the micro data obtained from the housing market survey.
- 1.5
- The remainder of the article is organized as follows: Section 2 reviews existing search models and applications of the agent-based modeling in the housing market; Section 3 summarizes the characteristics of China's resale housing market, and establishes theoretical search model with the joint participation of buyers, sellers and brokers; Section 4 calibrates the parameters according to housing market survey in Beijing, and implements agent-based simulation for the search behavior of trading participants; Section 5 concludes the article, and makes suggestions for the future research.
Literature review
- 2.1
- With trading frictions in mind, many scholars studied the search behavior of the housing market in the paradigm of the search theory, from the perspectives of the broker (Yinger 1981; Anglin 1997), the buyer (Kim 1992; Turnbull & Sirmans 1993) and the seller (Salant 1991; Horowitz 1992). On the broker's side, Yinger (1981) built a broker search model of the housing market, analyzed the broker's search behavior and its effects on matching quantities and transaction price. Anglin (1997) studied the influences of the buyer broker on the matching quality and the bargaining power for both sides. As to home buyers, Kim (1992) constructed a buyer search model, addressed how the buyer search behavior affects the housing price, and implemented the empirical research on housing demand equation with Hedonic price model. Turnbull & Sirmans (1993) established a buyer search model to study the level of information on the transaction price. Based on the MLS data in the U.S., empirical findings showed that there was no significant difference in the transaction price for different types of buyers, which implied that the MLS system and other information disclosure mechanisms could improve the impacts of different information levels and search costs on the transaction price. From the seller's point of view, Salant (1991) constructed the first seller search model, and found that the seller's list price will decline over time but increase in the first phase of the house commissioned. Horowitz (1992) also built a theoretical model to describe the seller search behavior, and studied the relationships among list price, transaction price and TOM.
- 2.2
- Based on these search models for housing markets, another strand of literature paid attention to the brokerage service in the resale housing market (Wu & Colwell 1986; Yavas 1992; Yavas & Yang 1995). Wu & Colwell (1986) extended Yinger (1981) model by including the search-bargaining behavior of the buyer and the seller, studied the impacts of the search cost on the housing price and the brokerage commission, and discussed the role of the MLS system on the equilibrium housing price. Yavas (1992) constructed a search-matching model based on the Nash bargaining mechanism, and found that the seller broker can improve the equilibrium housing price, and reduce the search intensities for buyers and sellers. To expand the model, Yavas & Yang (1995) further introduced the signaling function of the list price, and the list price was formed based on the agents' valuation, bargaining power, search cost, commission rate as well as the signaling function.
- 2.3
- Early studies mainly focused on one-sided search behavior of the trading participants, and adopted the optimal stopping rule for the partial equilibrium analysis of the housing market. Because the behaviors of other trading participants are exogenously defined, there are obvious limitations in the one-sided search model, so as to promote the development of the two-sided search-matching model. Van de Vlist (2002) extended the Burdett-Mortensen model (1998) to build the housing market matching model, studied the sensitivity of the market equilibrium to the change in the structural parameters. Albrecht et al. (2007) established a housing market model for opportunistic matching, which further relaxed the assumption of constant reservation prices, so the reservation price of both sides can be adjusted over time. Novy-Marx (2009), Genesove & Han (2012) designed similar equilibrium matching models of the housing market, implemented numerical simulation and econometric methods to examine the impacts of exogenous demand shocks on the housing market liquidity respectively, and verified the price overshooting phenomenon resulted from the feedback mechanism.
- 2.4
- Recently, the applications of agent-based modeling / multi-agent system (ABM/MAS) in the housing market have evolved to simulate the urban sprawl phenomenon, as well as to validate the economic theory and hypothesis. Benenson (1998) designed a multi-agent simulation model for urban residential choices, where the housing price is defined as a function of the economic status of residents and the value of surrounding dwellings. Torrens (2007) introduced the housing vacancy chain into the model with geographic agents representing houses and families. A discount mechanism for the price adjustment was incorporated with varying TOM of vacant houses. Gilbert et al. (2008) developed an agent-based model by capturing main features of the UK housing market, the dynamics of the housing prices emerged from the interactions of buyers, sellers, and brokers. Devisch et al. (2009) analyzed the price bargaining process between buyers and sellers, and first described the learning process of individuals from the market transactions. Filatova et al. (2009) developed a multi-agent simulation model for land market transactions based on the monocentric urban theory, and analyzed the impacts of the market environment on the relative bargaining power of trading agents. Ettema (2011) adopted a different price formation mechanism, where buyers and sellers can update their perceptions on trading probability, and the reservation price is discounted with the time. Gangel et al. (2013a, 2013b) applied the ABM to study the foreclosure contagion effect in the real estate market, and identified the relevant determinants of the foreclosure contagion threshold based on the sensitivity analysis. Meanwhile, Chinese researchers also incorporated the ABM/MAS technique into housing market simulation, and focused on the spatial distribution of urban residents (Xue and Yang 2003; Zhang et al. 2004; Tao et al. 2009). In these models, the pattern of the residential choice is drawn following the urban economic theory, but the micro-level description of the housing transaction process is generally insufficient. As shown in Table 1, some popular platforms such as Swarm and NetLogo have been widely used for the development of agent-based housing market system. In contrast with Swarm, Repast and others, NetLogo requires less computational power and offers multiple visible extensions (Wilensky 1999), so we develop our housing market simulation model based on NetLogo.
Table 1: Agent-based simulations related to housing market Author (Year) Literature Platform Benenson (1998) "Multi-agent simulations of residential dynamics in the city" Cell Automata Xue and Yang (2003) "Research on urban evolution using agent-based simulation" (in Chinese) UrbanSwarm Zhang et al. (2004) "Research on dynamic simulation of Beijing land covering & changing by applying agent modeling" (in Chinese) UrbanSwarm Torrens (2007) "A geographic automata model of residential mobility" Hybrid Model Gilbert et al. (2008) "An agent-based model of the UK housing market" NetLogo Filatova et al. (2009) "Agent-based urban land markets: Agent's pricing behavior, land prices and urban land use change" NetLogo Tao et al. (2009) "Simulation for evolvement of residential spatial patterns in real scene based on multi-agent" (in Chinese) Swarm / ArcGIS Devisch et al. (2009) "An agent-based model of residential choice dynamics in nonstationary housing markets" SwarmCity Ettema (2011) "A multi-agent model of urban processes: Modelling relocation processes and price setting in housing markets" PUMA Gangel et al. (2013a, 2013b) "Exploring the foreclosure contagion effect using agent-based modeling"
"Latin Hypercube sampling and the identification of the foreclosure contagion threshold"Repast Simphony
Theoretical search model of the resale housing market
-
Theoretical analysis of the search behavior for trading participants
- 3.1
- The fundamental role of the housing market is to regulate housing supply and housing demand to match each other. Due to the existence of trading frictions, when the housing supply increases, vacant dwellings and home buyers cannot match instantly to make the market clearance. Given the large-scale sample in the housing market, the number that a buyer and a seller can search and select from is very limited. According to the search theory, the search behavior for trading participants has externality effect, which is reflected not only in the number of searchers, but also in their search intensities. The increase in the number and the search intensity of the buyer (seller) simultaneously reduces the opportunities for other buyers (sellers), and escalates their search costs. Due to the existence of the search externality, the matching result in housing market is directly affected by the number and the search intensities of trading participants. The search externality is one of the basic characteristics in the housing market, and it can be improved through a variety of mechanism design. For example, the brokerage service provides the filtering mechanism for the housing samples, facilitates both parties to rule out unsuitable matching opportunities, and thus offsets the search externality to improve the market efficiency; the MLS system in North America shares huge amount of listings, expands the sample selection space of buyers and sellers and hence improves the overall matching quality.
- 3.2
- On the micro level of the resale housing market, trading participants match each other through their search activities. During the search process, a buyer first decides the quantity of randomly selected samples within a certain period (i.e. search intensity or search frequency), conducts on-site inspection to acquire the list price, selects the sample that can provide the highest return, and finally negotiates with a seller to determine the transaction price. On the other side, a seller adopts the passive search pattern, publishes the list price to notify other trading participants, and waits for buyers' counteroffers. For reasons like market competition, liquidity preference and future expectations, the reservation prices of buyers and sellers on the same dwelling are mostly different, and the transaction price is finally decided upon the bargaining result of their reservation prices. Another important trading participant in the resale housing market is the real estate broker or realtor. The search behavior of a broker covers both sides of the market, in terms of collecting list prices and counteroffers respectively from sellers and buyers, bringing them together to complete the transaction. Different from the mature housing markets, the intermediary service with the neutral broker is commonly used in China's resale housing market, and the home buyer pays the broker commission at a certain percentage of the transaction price.
- 3.3
- Based on the theoretical analysis above, this article focuses on the search behavior of buyers and sellers, establishes the search model to describe microeconomic behavior in China's resale housing market, and explores their intrinsic connections with the housing market phenomenon.
Modeling the search behavior in the resale housing market
Basic assumptions
- 3.4
- We assume that all the housing units are homogeneous, and there are risk-neutral buyers, sellers and brokers in the market. Denote the number of buyers as Nb, and the number of sellers as Ns. Let the ratio between buyers and sellers θ = Nb/Ns, as the market tightness ratio.
- 3.5
- For a housing unit, denote the buyer's reservation price as Pb∈(0, 1], the seller's reservation price as Ps∈(0, 1]. Both are private information which is unknown to each other. Following the Nash bargaining process of buyers and sellers, the range of the transaction price can be defined as [Pb, Ps]. Whether a buyer purchases a dwelling in the final decision-making process depends on the expected return, that is, the joint expectations of buying the home in the current and the next period under the conditions of market uncertainty. Let ω (0≤ ω ≤1) reflect the returns of buyers and sellers according to their bargaining power. The seller receives ω portion of the surplus, and the buyer receives the other (1 − ω) portion. Assume that the bargaining result has no effect on the search behavior of both parties, so ω is not a specific value. Therefore, the transaction price denoted as Pt equals to ω (Pb − Ps) + Ps. With the participation of intermediary services in the deal, the buyer has to pay k portion of the transaction price as the intermediary service commission to the broker.
- 3.6
- As rational economic men, trading participants choose their search intensities for the maximization of returns. The choice of the search intensity will affect the matching probability and search costs for buyers and sellers. Denote Ib as buyer's search intensity, Is as seller's search intensity. Then C(Ib) is denoted as buyer's search costs, C(Is) as the seller's search costs. C(·) is a strictly increasing convex function to meet C'> 0, C''> 0. Here, we assume C(Ib)=δb(Ib)2, C(Is)=δs(Is)2, wherein, δb and δs represent the buyer's and seller's unit searching cost, respectively.
- 3.7
- Let M as the matched number of buyers and sellers after the search process. Adapted from existing search models, we assume the matching function in the form of Cobb-Douglas equation at a constant return to scale, i.e. M = λ(NbIb)η(NsIs)1-η. Wherein, λ is a constant that stands for the matching efficiency in the resale housing market. So, the matching probability of buyers and sellers can be expressed, as shown in Equation (1) and (2).
qb = M / Nb = λ (Nb / Ns)η-1 Ibη Is1-η = λ θη-1 Ibη Is1-η (1) qs = M / Ns = λ (Nb / Ns)η Ibη Is1-η = λ θη Ibη Is1-η (2) Where, η (1> η > 0) reflects the elasticity of the buyer's search intensity to the matched quantity; qb represents the buyer's matching probability; qs represents the seller's matching probability. Accordingly, the elasticity of the seller's search intensity to the matched quantity is 1-η, the buyer's search time is then calculated as 1/qb, and the seller's search time is 1/qs.
Search model without real estate broker
- 3.8
- First, let us consider a basic search model without real estate broker, which is adapted from Yavas (1992). The search behavior of the buyer and the seller is modeled and qualitatively analyzed based on the market equilibrium state.
- 3.9
- From the perspective of the seller, not knowing the specific value of Pb, the seller holds the expectation of Pb (meet Pb > Ps), and calculates the return obtained from the search process. When the transaction is achieved, the seller can receive the return ω(Pb − Ps). So the seller's return function can be expressed, as in Equation (3).
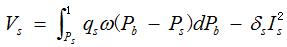
(3) where Vs is the return received by the seller from the search. The lower bound of the integral indicates that, the seller will be able to sell the dwelling if and only if the buyer's reservation price Pb is higher than the seller's reservation price Ps.
- 3.10
- On the other side of the market, the buyer adopts the similar search strategy, and the buyer's return function can be written, as in Equation (4):
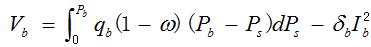
(4) where Vb is the return that the buyer receives from the search. Equation (4) reveals the equilibrium search strategy for the buyer, i.e. the buyer with the reservation price Pb chooses her search intensity Ib to receive expected return from search.
- 3.11
- In the search process, both the seller and the buyer choose their search intensities to maximize the expected returns, so the search intensities of seller and buyer satisfy the first-order conditions of Equation (3) and (4). After substitution, the solutions to Is and Ib are obtained, as shown in Equation (5) and (6):
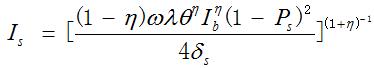
(5) 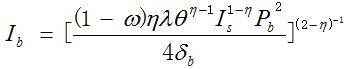
(6) Equations (5) and (6) reflect the characteristics and determinants of the search intensity for sellers and buyers. Based on the first-order derivatives, we can draw the conclusions as follows:
-
 ,
, 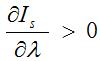 indicate that the search intensity of the buyer/seller increases as the matching process becomes more efficient;
-
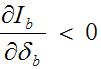 ,
, 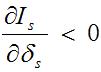 indicate that the search intensity of the buyer/seller decreases with the increase of the unit search cost;
-
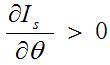 indicates that the search intensity of the seller increases as the market tightness ratio increases;
-
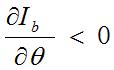 indicates that the search intensity of the buyer decreases as the market tightness ratio increases.
Search model with real estate broker
-
- 3.12
- Next, we further study the search behavior for trading participants when the intermediary service is involved. As mentioned in the theoretical analysis, the search activities of the broker can improve the matching probability of seller and buyer, then the matching function is adapted into M = μ(NbIb)η(NsIs)1-η. Here, μ (μ>λ) is a constant that stands for the matching efficiency with the assistance of real estate broker. Accordingly, the matching probability of buyer and seller denoted by hb and hs can be shown in Equation (7) and (8):
hb = μ θη-1 Ibη Is1-η (7) hs = μ θη Ibη Is1-η (8) Denote the final transaction price as Pt* with the brokerage service, and the total transaction surplus is Pb−Ps−kPt*. Considering the brokerage mechanism in China's housing market (buyer pays for the broker commission), the seller directly obtains the transaction surplus Pt*−Ps. And the seller obtains the share of the total surplus as ω(Pb−Ps−kPt*). With both are the same, we can calculate the transaction price as Pt* =[ω(Pb−Ps)+Ps]/(1+ωk)≤Pt. This suggests that, the equilibrium price in the housing market declines when the buyer pays for the brokerage commission.
- 3.13
- With the brokerage service involved as the proportional commission structure, the seller's and buyer's return function can be revised into Equation (9) and (10), respectively:
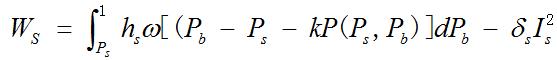
(9) 
(10) where Ws is the seller's return from the search with the broker assisted;
Wb is the buyer's search return with the broker. - 3.14
- Solving the first-order conditions of above equations, the seller's and buyer's equilibrium search intensity can be reached, as shown in Equation (11) and (12):
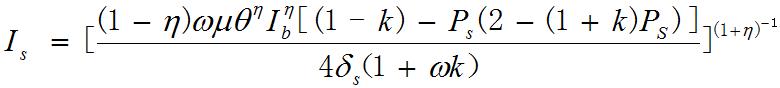
(11) 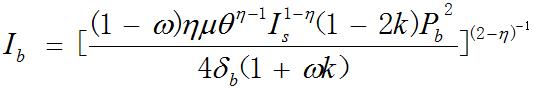
(12) Based on the first derivatives on the broker commission rate, we find that,
 and
and  indicate that the increase in broker commission rate reduces the search intensities of both buyers and sellers.
- 3.15
- The theoretical search model has provided the qualitative analysis on the search behavior of buyers and sellers, with its focus on the search intensity and the search time (that can be calculated by the inverse of the matching probability). In the next section, we will use the theoretical model as the basis to implement the agent-based simulation with the survey data of Beijing resale housing market. Then, the quantitative results can be reached to validate the theoretical conclusions.
Agent-based simulation of China's resale housing market
-
Initial setting of parameters
- 4.1
- Before implementing the simulation, the values of the parameters need to be set first. Here, we set the parameters of the model in two ways, and their distribution types are also defined as shown in Table 2.
- For {ω, θ, λ, μ, η}, these parameters are unobservable from the statistics or market survey, so we need first set the values according to their economic senses, and calibrate the model repeatedly to obtain the appropriate values. After calibration, we set the model parameters consistent with theoretical assumptions and intuitive thinking.
- For {Pb, Pb, Pt, δb, δs, Ib, Is, k}, these parameters are set based on the micro data from Beijing resale housing market survey in August 2012. From these 1019 samples, the average transaction price is 2.2 million yuan, and the buyer's valuation is 2.4 million yuan. Given the equal bargaining power, the seller's valuation can be calculated as 2.0 million yuan. The buyer's average search time is 4.5 months, the number of visited dwellings is 11, so the buyer's search intensity is 2.4 times/month, and the unit search cost is about 75 yuan/times; the seller's search time is 4.5 months, the number of visited buyers is 18, so the seller's search intensity is 4.0 times/month, and the unit search cost is around 100 yuan/times. The ratio of the broker commission ranges from 1.5% to 5.0%, averaged at 2.5%.
Table 2: Initial setting of parameters Parameter Description Value Distribution Type Pb Reservation price of buyers 2.40 Normal Ps Reservation price of sellers 2.00 Normal Ib Search intensity of buyers 2.40 Poisson Is Search intensity of sellers 4.00 Poisson δb Unit search cost of buyers 75 Normal δs Unit search cost of sellers 100 Normal k Percentage of brokerage commission 2.5% Constant ω Bargaining power of sellers 50% Constant θ Ratio between buyers and sellers 1.00 Constant λ / μ Matching efficiency in the matching function 0.05 Constant η Buyer's elasticity in the matching function 0.50 Constant Simulation result of the search behavior for trading agents
- 4.2
- Based on the theoretical analysis and parameter setting, the agent-based modeling technique is introduced to simulate the search behavior in China's resale housing market on the NetLogo platform. The number of the trading agents is 2000, consisting of 1000 buyers and 1000 sellers, and the number of agents can be adjusted on purpose. During the simulation, one time step represents one month, and each simulation runs for 150 months. The simulation model is developed, as shown in Figure 1 and Figure 2.
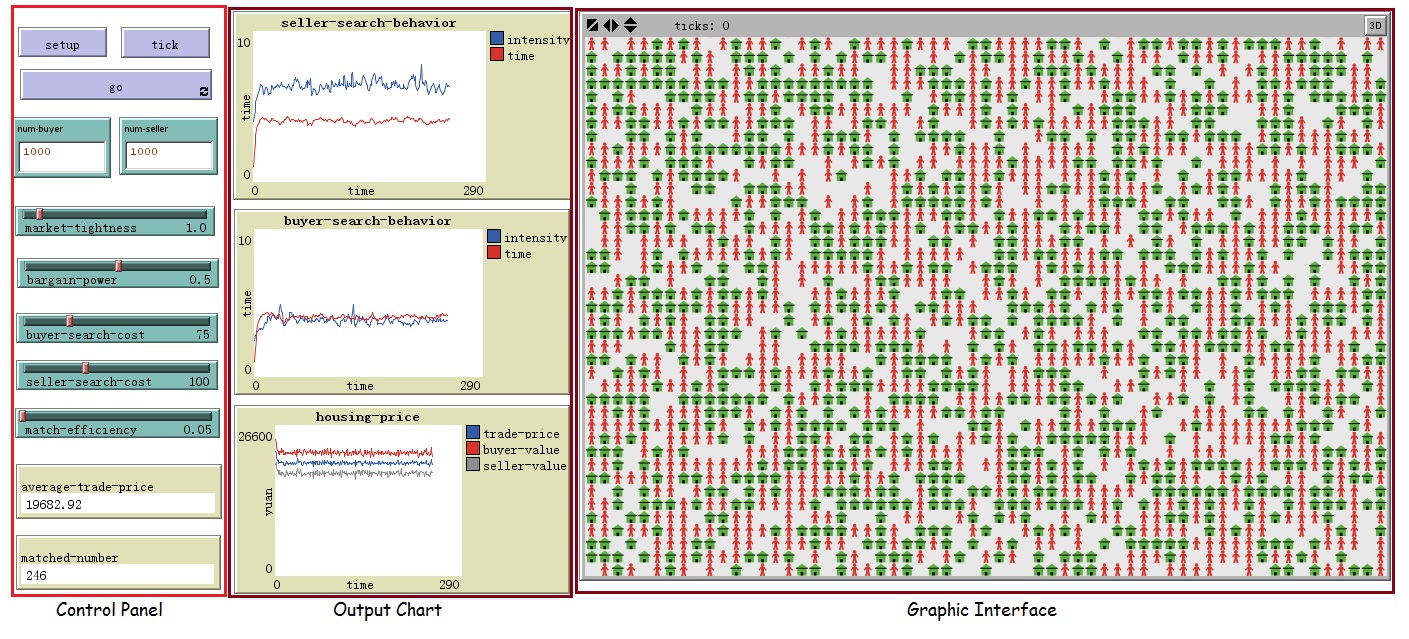
Figure 1. Simulation model for Beijing's resale housing market - 4.3
- As shown in Figure 1, the control panel is on the left, where we set the parameter value, operate the simulation and observe the values for selected agents; the output charts are in the middle of the simulation model, where the average search intensity and the average search time for the agents as well as the housing prices are displayed simultaneously; the graphic interface is on the right side, where the agents in different shapes represent buyers and sellers, and they interact with each other in a 60×40 gridded surface.
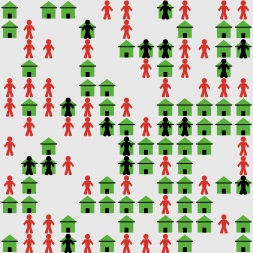
Figure 2. Snapshot of the graphic interface - 4.4
- Figure 2 is an enlarged snapshot for the graphic interface. Each seller uses the "house" icon in green; each buyer uses the "human" icon, and its initial color is red; the background color is gray, denoting the land parcels. When the simulation starts, the color of buyer can transform to reflect the update situation in the search process. When a buyer and a seller are matched, the buyer will change the color to black, and move into the "house", then both of them will exit the market. At the beginning of the next time step, new buyers and sellers will be created to maintain the market tightness ratio stable.
- 4.5
- In the agent-based simulation, the agents in the resale housing market follow the search strategy as demonstrated in the theoretical model, where the buyers/sellers with different reservation prices adjust their search intensities to match each other. During each time step, the matching probability is mainly determined by the search intensities of both buyers and sellers, in that the market tightness ratio is maintained as 1 as in Equation (1) and (2). Then the agents can match each other based on the maximization of their returns from the cost/benefit calculations. On the contrary, the un-matched agents have their search time increase by one for each period, and also improve their search intensities and reservation prices at the beginning of the next period. The adjustment of the search intensities finally enable the housing market to converge into a relatively stable state, compared to the initial market volatility.
Dynamics of search time and search intensity for buyers
- 4.6
- Figure 3 depicts the simulation result of the buyer's search behavior. During the first 50 time steps, the buyer's search time fluctuated sharply up to 7.2 months, and gradually became stable at 3 months. The buyer's search intensity improved steadily and got stable at 2.5 times per month. In general, the simulation result is very close to the statistical findings from the survey data, so the setting of the simulation model is reasonable. Since the buyer's unit search cost is less than the seller's, the search strategy is relatively conservative for the buyer, with stable search intensity and prolonged search time to complete housing transactions.
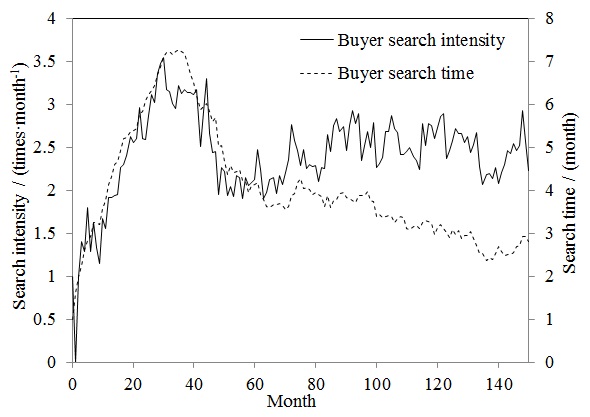
Figure 3. Simulation result of the buyer's search behavior Dynamics of search time and search intensity for sellers
- 4.7
- Figure 4 shows the simulation result of the seller's search behavior. During the first 50 time steps of the simulation, the search intensity and the search time of the seller rose drastically, up to 7.5 times per month and 8.1 months, respectively. Subsequently, the search time gradually stabilized at 3 months, and the search intensity at average 3.5 times per month. Seen from the simulation results, the seller unclear of the price distribution at the beginning of the searching process, would increase the search intensity and the search time to obtain the information of the buyers. When the seller receives the rational valuation of the dwellings, the seller with higher unit search cost reduces the search intensity and the search time accordingly. Throughout the simulation, the results of the seller's search time and search intensity are consistent with the survey data, so the model is reasonably established, and the basic characteristics of the seller's search behavior are accurately identified.
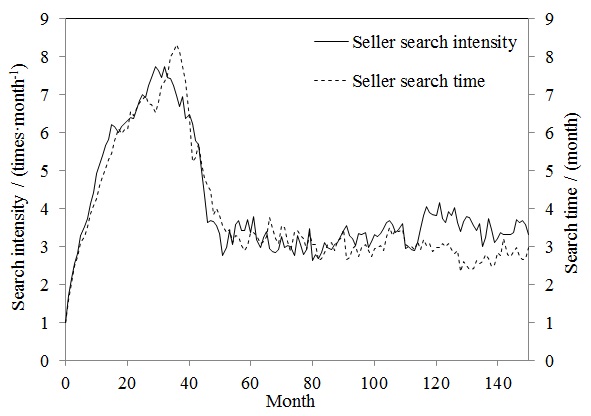
Figure 4. Simulation result of the seller's search behavior Sensitivity analysis of the determinants for the search behavior
- 4.8
- The theoretical search model has provided the qualitative conclusion about the determinants of search behavior for trading agents. In order to estimate the impacts of different parameters in a quantitative way, we have conducted the sensitivity analysis as follows.
- 4.9
- Here, we use the simple random sampling for the single-factor sensitivity analysis, instead of Latin Hypercube sampling (LHS). The LHS technique considers the system-wide combinations of multi-dimensional input variables with prescribed distribution and its advantage is the simplification of the variable combinations to obtain less computations and faster convergence speed (Gangel et al. 2013b). Nonetheless, the LHS methodology is relatively complicated in contrast to the simple random sampling which is more applicable to the single-factor sensitivity analysis, so the LHS technique is not adopted here.
Impacts of matching efficiency on the search behavior for trading agents
- 4.10
- The matching efficiency is represented by the fixed coefficient μ (or λ when the broker is not involved) in the matching function. The greater μ indicates the higher matching probability between the buyer and the seller, and thus can be used to reflect the level of information efficiency in the housing market. In order to analyze the impacts of matching efficiency on the agent's search behavior, let μ change within a certain range [0.1, 1.0], the relationship between the matching efficiency and the search behavior can be observed.
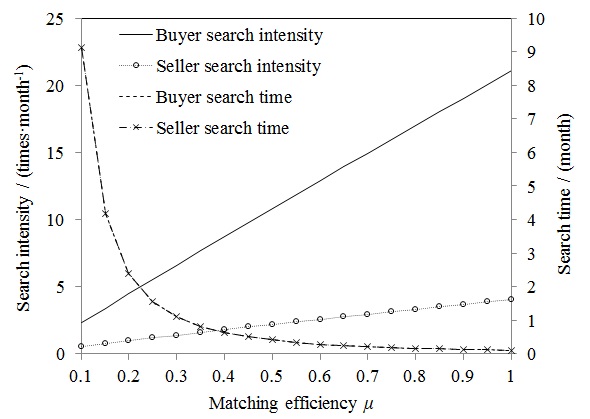
Figure 5. Sensitivity analysis of the search behavior to matching efficiency - 4.11
- Seen from Figure 5, with the rise in the level of matching efficiency, the search intensities of both buyers and sellers increased steadily at a linear trend, and the growth rates were 4 and 21 for buyer and seller, respectively. Moreover, the search intensity of the buyer was approximately 5 times that of the seller. The search time of the buyer was very sensitive to the level of matching efficiency, the increaing level of the matching efficiency led to a decline in the buyer's search time, and there was a sudden change at aroud 0.25, that is, "μ=0.25" as the critical turning point. On the left interval of the critical point, the buyer's search time was very sensitive to the matching efficiency, the improvements on the matching efficiency reduced the buyer's search time rapidly; on the right interval of the critical point, the effect of the matching efficiency on the buyer's search time was significantly weakended. Based on the model setting, given the equal quantity of buyers and sellers (that is θ=1), then the seller's search time is the same as the buyer's, so these two curves overlapped. As the indicator for market liquidity, the high sensitivity of the seller's search time also reflects that, the information efficiency in the resale housing market plays very important role in the market liquidity.
Impacts of unit search cost on the search behavior for trading agents
- 4.12
- In order to analyze the impacts of unit search cost on the search behavior for trading agents, let δb and δs vary within a range [10, 250], and the sensitivity of the search intensity and the search time for trading agents can be measured, as shown in Figure 6 and Figure 7.
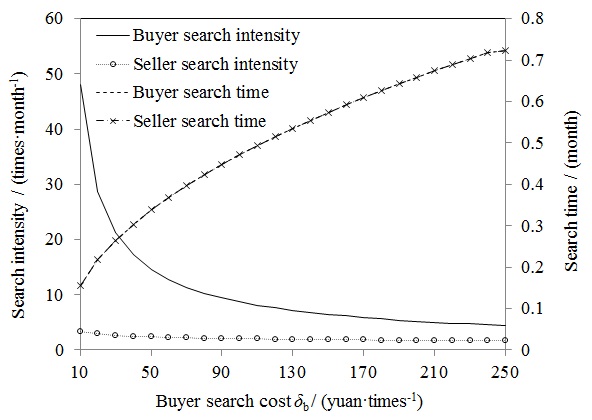
Figure 6. Sensitivity analysis of the search behavior to buyer search cost - 4.13
- Figure 6 shows that, the buyer's unit search cost is negatively correlated with the search intensity of the seller and the buyer, but the degrees of the impact are quite different. The search intensity of buyer was impacted drastically by the unit search cost of the buyer, and the slope of the curve had an abrupt change at around "δb=50". On the left of the critical turning point, the buyer's search intensity decreased rapidly with the unit search cost of the buyer; on the right interval, the rate of decline in the buyer's search intensity was reduced. By contrast, the rate of decline for the seller's search intensity was very slow, and the impact of buyer search cost was insignificant. The buyer's and seller's search time showed a positive correlation with the unit cost of searching, and the slope was relatively stable at the rate of 0.175%.
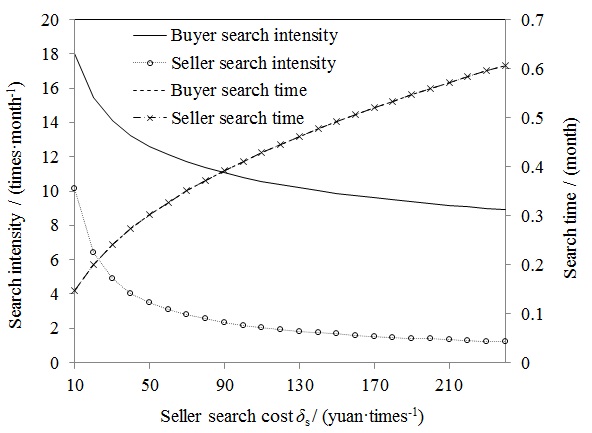
Figure 7. Sensitivity analysis of the search behavior to seller search cost - 4.14
- As shown in Figure 7, similar to the effect of the buyer's unit search cost, the unit search cost of the seller is negatively correlated with search intensities of buyer and seller, and positively correlated with the search time of buyer and seller. Specifically, the search intensities of buyer and seller were significantly impacted by the seller's unit search cost, and the slope of the curve also presented an abrupt change near the critical turning point of "δs=50". On the left interval, the search intensities of both parties declined rapidly with the unit search cost of the seller; on the right interval, the rates of decline in their search intensities were weakened. Meanwhile, the search time of the seller was positively correlated with the unit search cost, and the trend of variation was relatively stable at the rate of 0.15%, lower than the buyer's unit search cost.
Impacts of market tightness on the search behavior for trading agents
- 4.15
- In order to analyze the impacts of the market tightness ratio on the search behavior for trading agents, let θ change within a certain range [0.1, 2.5], and the sensitivity analysis of search intensity and search time for trading agents is conducted, as shown in Figure 8.
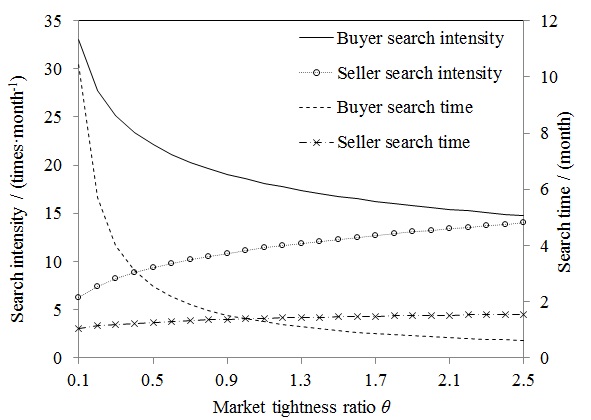
Figure 8. Sensitivity analysis of the search behavior to market tightness ratio - 4.16
- Figure 8 indicates that, when the market tightness ratio grew from 0.1 to 2.5, or the ratio of the buyers to the sellers in the housing market varied, the buyer's search intensity and search time witness a decline trend, whereas the seller increases the search intensity and the search time. In fact, the market tightness ratio reflects the fundamental conditions in the housing market, so-called hot (bull) or cold (bear) market (Novy-Marx 2009). As illustrated in Figure 8, the performance of the agent's search behavior is consistent with the change in housing market conditions. The curves of the buyer's search behavior had seen a sudden change near the critical point "θ=0.5". On its left, the search behavior of the buyer changed rapidly with the market tightness ratio; on the right interval, the decline rates were weakened. By contrast, the curves representing the seller's search behavior had shown slower reaction to the market tightness ratio. Therefore, the buyer's search behavior was more sensitive to the change in the market tightness ratio rather than the seller's.
Impacts of broker commission rate on the search behavior for trading agents
- 4.17
- In order to analyze the impacts of the broker commission rate on the search behavior for trading agents, let k change within a certain range [0.5%, 13%], and the sensitivity level of search intensity and search time can be addressed, as shown in Figure 9.
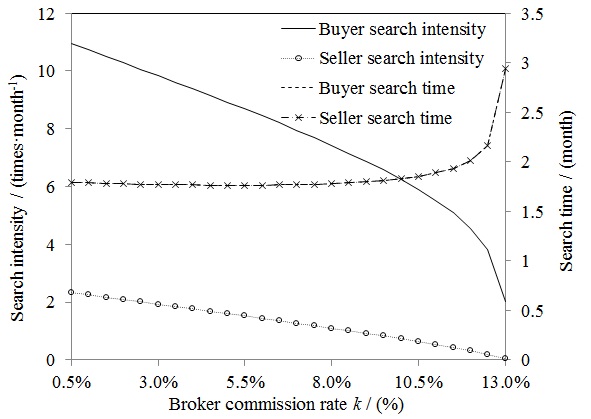
Figure 9. Sensitivity analysis of the search behavior to broker commission rate - 4.18
- Consistent with the theoretical analysis, the responses of the agents' search intensities to the change in broker commission rate presented a decline trend, but the search time of the buyer and the seller increased with the commission rate. There was a critical point when the commission rate was higher than 10%, that is, 10% of the final transaction price. On the right interval of the critical point, both the search time and the search intensity change suddenly, and the seller's search intensity decreased to 0 at "k=13%". As the setting of the parameters is based on the survey data from China's resale housing market, the sensitivity test reflects that the maximum acceptable commission rate for the real estate broker in China is 13%, as evidence that the fees levied by brokers could be enough to tip the balance in trading agents, which potentially could be detrimental to the benefits of market participants.
Conclusions
- 5.1
- In this article, we build a theoretical search model applicable to the characteristics of China's housing market by modeling the behavioral functions of sellers and buyers, and simulate the agents' search behaviors on NetLogo based on the survey data of resale housing market in Beijing. Theoretically, the search intensity is positively related to the matching efficiency, but negatively related to the unit search cost. The increase of the market tightness ratio has opposite effects on the search intensities of the seller and the buyer, respectively. The intermediary service with the neutral broker in China's resale housing market can reduce the transaction price, and the higher commission rate can lead to a decline in the search intensities for both buyers and sellers.
- 5.2
- The agent-based simulation results validate the theoretical analysis. Buyers and sellers apply different search strategy in terms of search intensity and search time, according to their own search return functions. Moreover, the search behaviors of trading agents are consistent with the survey data from Beijing resale housing market. Sensitivity analysis shows that the matching efficiency has significant impacts on the search time of buyers and sellers, indicating that the information efficiency is very critical for housing market liquidity. The search costs of both buyers and sellers impose substantial impacts on their search intensities and there are critical turning points with abrupt changes. Noticeably, the impacts of the unit search cost on the search time are not so evident. The market tightness ratio affects the buyer's search behavior more than the seller's, so the buyer seems to be more sensitive to the change in the market environment. The increase of the broker commission rate not only results in the decline of search intensities, but also prolongs search time, and the maximum acceptable commission rate is 13% for the resale housing market in Beijing.
- 5.3
- During the past fifteen years since the housing system reform, the housing markets in most Chinese cities have witnessed rapid growth in both prices and trading volume. From a bottom-up perspective, this article incorporates the ABM/MAS technique to identify the feature of China's resale housing market. On the one hand, it provides an in-depth understanding of the individual behaviors of market participants composed by buyers, sellers and brokers; On the other hand, it also enables that the policymakers adapt current macro-regulation tools to the micro-level mechanism design and thus the long-term governance structure, by improving the market efficiency, introducing new brokerage types, adjusting the commission rate and so forth. To extend future applications of the model, we propose following suggestions: 1) Real estate developers as new housing supply providers need to be introduced to realize the equilibrium analysis of the whole housing market, which would be closer to the realities in China's housing market; 2) The simulation model can be extended for policy evaluation and mechanism design, for instance, the impact assessment of the MLS system on the behavior of trading participants and the housing market efficiency.
Acknowledgements
- The authors are grateful to the National Natural Science Foundation of China for providing research support (No. 71073096, No. 71373143).
References
-
ALBRECHT, J., Anderson, A., Smith, E., et al., (2007). Opportunistic matching in the housing market. International Economic Review, 48(2), 641–664. [doi:10.1111/j.1468-2354.2007.00440.x]
ANGLIN, P. M. (1997). Determinants of buyer search in a housing market. Real Estate Economics, 25(4), 567–589. [doi:10.1111/1540-6229.00728]
BENENSON, I. (1998). Multi-agent simulations of residential dynamics in the city. Computers, Environment and Urban Systems, 22 (1), 25–42. [doi:10.1016/S0198-9715(98)00017-9]
BURDETT, K., Judd, K. L. (1983). Equilibrium price dispersion. Econometrica, 51(4), 955–969. [doi:10.2307/1912045]
BURDETT, K., Mortensen, D. T. (1998). Equilibrium price dispersion. International Economic Review, 39, 257–273. [doi:10.2307/2527292]
DEVISCH, O., Timmermans, H., Arentze. T. (2009). An agent-based model of residential choice dynamics in nonstationary housing markets, Environment and Planning A, 41, 1997–2014. [doi:10.1068/a41158]
DIAMOND, P. A. (1971). A model of price adjustment. Journal of Economic Theory, 3, 156–168. [doi:10.1016/0022-0531(71)90013-5]
ETTEMA, D. (2011). A multi-agent model of urban processes: Modelling relocation processes and price setting in housing markets. Computers, Environment and Urban Systems, 35 1–11. [doi:10.1016/j.compenvurbsys.2010.06.005]
FILATOVA, T., Parker, D., Van der Veen, A. (2009). Agent-based urban land markets: Agent's pricing behavior, land prices and urban land use change. Journal of Artificial Societies and Social Simulation, 13 (12), https://www.jasss.org/12/1/3.html.
GANGEL, M., Seiler, M. J., Collins, A. J. (2013a). Exploring the foreclosure contagion effect using agent-based modeling. Journal of Real Estate Finance and Economics, 46 (2), 339–354. [doi:10.1007/s11146-011-9324-1]
GANGEL, M., Seiler, M. J., Collins, A. J. (2013b). Latin Hypercube sampling and the identification of the foreclosure contagion threshold. Journal of Behavioral Finance, 14 (2), 149–159. [doi:10.1080/15427560.2013.791296]
GENESOVE, D., Han, L. (2012). Search and matching in the housing market. Journal of Urban Economics, 72, 31–45. [doi:10.1016/j.jue.2012.01.002]
GILBERT, N., Hawksworth, J. C., and Swinney, P. A. (2008). An agent-based model of the UK housing market. Technical report, Centre for Research in Social Simulation, University of Surrey, UK. http://cress.soc.surrey.ac.uk/housingmarket/ukhm.html.
GUO, X., Liu, H., Zheng, S. (2012). Impact of heterogeneity on transaction velocity in new commercial housing market: the micro evidence from Beijing. Urban Studies, 19(6), 117–124. (in Chinese)
HOROWITZ, J. L. (1992). The role of the list price in housing markets: theory and an econometric model. Journal of Applied Econometrics, 7(2), 115–129. [doi:10.1002/jae.3950070202]
HOSIOS, A. J. (1990). On the efficiency of matching and related models of search and unemployment. Review of Economic Studies, 57(2), 279–298. [doi:10.2307/2297382]
KIM, S. (1992). Search, Hedonic prices and housing demand. Review of Economics and Statistics, 74(3), 503–508. [doi:10.2307/2109495]
KRAINER, J. (2001). A theory of liquidity in residential real estate markets. Journal of Urban Economics, 32–53(49). [doi:10.1006/juec.2000.2180]
NOVY-MARX, R. (2009). Hot and cold markets. Real Estate Economics, 37(1), 1–22. [doi:10.1111/j.1540-6229.2009.00232.x]
SALANT, S. W. (1991). For sale by owner: When to use a broker and how to price the house. Journal of Real Estate Finance and Economics, 4, 157–173. [doi:10.1007/bf00173122]
STIGLER, G. J. (1961). The economics of information. Journal of Political Economy, 69(3), 213–225. [doi:10.1086/258464]
TAO, H., Li, X., Chen, X. (2009). Simulation for evolvement of residential spatial patterns in real scene based on multi-agent. Acta Geographica Sinica, 64 (6), 665–676. (in Chinese)
TORRENS, P. M. (2007). A geographic automata model of residential mobility. Environment and Planning B, 34. 200–222. [doi:10.1068/b31070]
TURNBULL, G. K., Sirmans, C. F. (1993). Information, search, and house prices. Regional Science and Urban Economics, 23, 545–557. [doi:10.1016/0166-0462(93)90046-H]
WHEATON, W. C. (1990). Vacancy, search and prices in a housing market matching model. Journal of Political Economy, 98(6): 1270–1292. [doi:10.1086/261734]
WILENSKY, U. (1999). NetLogo. Center for Connected Learning and Computer-Based Modeling, Northwestern University, Evanston, IL. http://ccl.northwestern.edu/netlogo/
VAN DER VLIST, A. J., Rietveld, P., & Nijkamp, P. (2002). Residential search and mobility in a housing market equilibrium model. Journal of Real Estate Finance and Economics, 24(3), 277-299.
XUE, L., Yang, K. (2003). Research on urban evolution using agent-based simulation. System Engineering - Theory & Practice, (12), 1–9. (in Chinese)
WU, C., & Colwell, P. F. (1986). Equilibrium of housing and real estate brokerage markets under uncertainty. Journal of the American Real Estate and Urban Economics Association, 14(1), 1-24. [doi:10.1111/1540-6229.00366]
YAVAS, A. (1992). A simple search and bargaining model of real estate markets. Journal of the American Real Estate and Urban Economics Association, 20(4), 533–548. [doi:10.1111/1540-6229.00595]
YAVAS, A., Yang, S. (1995). The strategic role of listing price in marketing real estate: Theory and evidence. Real Estate Economics, 23(3), 347–368. [doi:10.1111/1540-6229.00668]
YINGER, J. (1981). A search model of real estate broker behavior. American Economic Review, 71(4), 591–605.
ZHANG, H., Zhou, P., Lin, Y. (2012). Searching process model in China's new housing market based on simulation analysis. Journal of Tsinghua University (Science & Technology), 52(2): 194–198. (in Chinese)
ZHANG, J., Wu, B., Shen, T. (2004). Research on dynamic simulation of Beijing land covering & changing by applying agent modeling. Journal of East China Institute of Technology, 27 (1), 80–83. (in Chinese)