
 Abstract
- Currently tourism is the main driver of change in the Galapagos Islands, affecting the social, terrestrial, and marine sub-systems. Tourism also has direct and indirect consequences for the unique archipelago's natural habitats and for the human well-being. Describing the mechanisms that drive and affect most the tourism development in Galapagos is a preliminary condition to developing a better understanding of the interaction structure of factors that shape the Galapagos archipelago as a social-ecological complex system. In this paper, we present a first attempt to represent the touristic market in Galapagos trough an Agent Based Model (ABM) of touristic activity, focusing on touristic offers, reservations, and touristic activities. The model is based on an individual-based representation of tourists' consumption preferences and touristic accommodation offers in the Galapagos Islands. Tourist agents are created to mimic the real world by assigning average characteristics of individuals who visit the Galapagos Archipelago of Ecuador. The accommodation offers (i.e., hotels and cruises) are generated in accordance with actual conditions derived from data collected through field surveys. The model includes a market agent that can change the prices, create and delete accommodation offers following an evolutionary algorithm. We carried out preliminary simulations that show a close agreement between real world data and model outputs. Furthermore we used the model to generate three "what if" scenarios in order to study how emergent patterns in the touristic market in Galapagos are affected by changes in the archipelago environment. In this way we illustrate how the model can be used as a useful tool to help public policy makers to explore the consequences of their decisions.
- Keywords:
- Spatial Agent Based Model and Simulation, Galapagos Islands, Tourist Destination Dynamics
Introduction
- 1.1
- Over the last few decades, tourism in the Galapagos Islands, like in most intact and pristine biodiversity sites around the world, has experienced an explosive growth in the number of international visitors and in the development of infrastructure to support the consumptive needs of tourists (Epler 2007). This remarkable development is inducing changes in nearly every aspect of life in the Galapagos Islands (Watkins & Cruz 2007). For instance, local communities in the Galapagos have experienced a rapid increase in the residential population caused by the migration of Ecuadorians from the mainland in search of jobs in the lucrative tourism industry, with negative implications for the unique and fragile natural environment of this World Heritage Site (Bensted-Smith 1999; Trueman et al. 2010). Migrants are being "pushed" from the Ecuadorian mainland by a generally poor economy and relatively low wages, and "pulled" by the higher paying jobs in tourism that are mandated by Ecuadorian law and accentuated by the robust growth in the island's tourism industry. The development of the touristic market, in spite of the efforts carried out by public and private conservation institutions (Parque Nacional Galápagos 2007), seems to be occurring in a relatively uncontrolled and conflictive manner. The perception is that all the attempts to regulate the rapid tourism expansion have been conducted in an intermittent and unconnected way, proposing solutions to acute social and ecological crises without a long-term vision or strategic plan (González, Montes, Rodríguez, & Tapia 2008). Attempts to regulate tourism and to create a sustainable island economy that explicitly links to nature have been fleeting and episodic.
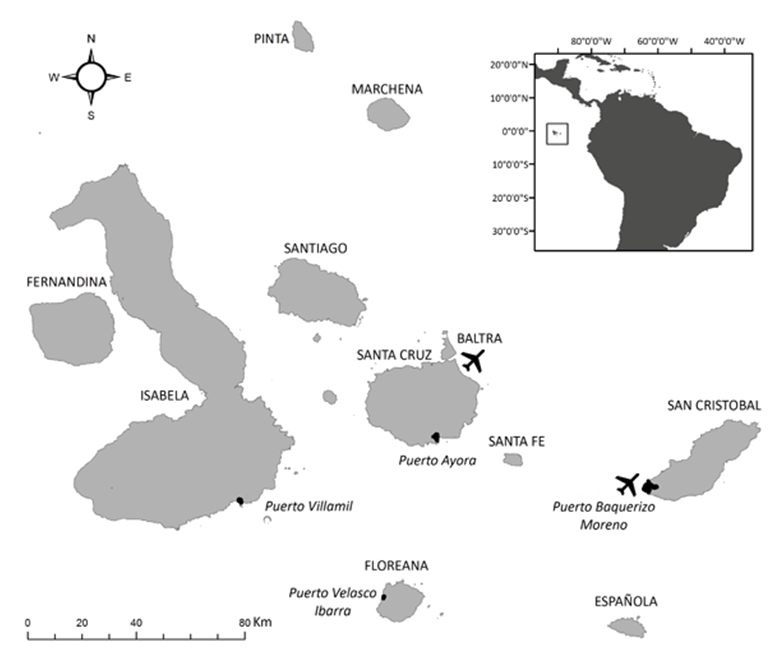
Figure 1. The study area - 1.2
- The Galapagos archipelago (see Figure 1 for a map of the archipelago), viewed as an ecotourism destination, is an emblematic case of the challenges of a coupled human-natural system (CHANS) (Liu et al. 2007) in which a natural resource (the Galapagos island ecosystem) is exploited by humans (tourists) producing feedback mechanisms that influence social-ecological interactions, dynamics, and trajectories. Endogenous factors and exogenous forces interact in complex ways to shape and reshape human-environment interactions. In coupled human-natural systems, at the beginning of the linking process, the exploitation increases exponentially. Then a period of degradation of the natural resource quality and availability is observed, with a subsequent decline in ecosystem goods and services, potentially leading to radical changes or a collapse of the exploitive activities. This situation can lead to an evolution of tourist destinations that has been extensively described by Plog (1974) and Butler (1980). Typically, CHANS are difficult to study because of their non-linearity characteristics, multiple space-time scales, complex feedback mechanisms, and unique local contexts that are linked to forces of globalization. This frequently makes it difficult to export process understanding from one place-based study to another (Ostrom 2007). Obviously, from a management and decision-making point of view, the main challenge of CHANS is sustainability, that is, the attainment of the equilibrium between prolonged and continuous human activities and the well-being of the natural environment. Understanding why some systems are sustainable and others collapse is the main purpose of the CHANS perspective (Ostrom 2009).
- 1.3
- Without tourism, the Galapagos would remain a relatively pristine, unique, and biodiversity-rich island archipelago in which agriculture in the highlands and fishing along the coast would continue to be the primary household livelihoods, now subsumed by tourism. Inhabited by far fewer people, the human dimension would likely be relatively well integrated into the oceanic environment setting of the Galapagos, first encountered by tourists arriving in the Galapagos in the 1950s (Epler 2007). But even before the arrival of international tourists, the Galapagos was exploited for its natural resources of both terrestrial and marine species. Determining the historical legacy of exploitation, the space-time lags of important endogenous and exogenous factors, and the adaptive capacity of the tourism industry, as well as local or international actors, who collectively shape social-ecological interactions (Baggio 2008) is a key step in understanding the dynamics and trajectories of the archipelago as it reacts and adjusts to the consumptive demands of a burgeoning tourism industry.
- 1.4
- In the last decades, Agent Based Models (ABMs) were increasingly used in a wide range of studies (Grimm et al. 2005). In ABMs, agents are integrated in a computer-based model. Every agent can represent individuals such as tourists or groups of individuals such as institutions. To every single agent, a set of behavioral rules are associated that permit agent-to-agent and agent-to-environment interactions to be simulated. In the ABM setting, it is possible to strategically and controllably change the agents' features to build a set of "what if" scenarios, study the resulting changes in the simulations output and examine system behavior and agent learning. This final aspect of ABMs can be used to analyze and manage touristic destinations, but rarely have ABMs been used with such an objective in mind. Indeed, despite few preliminary works (Johnson and Sieber 2011; Balbi and Giupponi 2010; Yin 2007; Cecchini and Trunfio 2007), no attempt has been made to build a computational model of a touristic destination that integrates the economic, social, environmental and psychological features of all the actors involved.
- 1.5
- This paper represents a first step towards the building of an ABM of the tourism market in the Galapagos Islands and in wider terms towards the building of an ABM of a tourist destination. The aim of this study is to identify, among the vast number of microscopic, individual based element that create, through a complex network of interactions the tourism market system in Galapagos, a limited set of features that can be used to effectively build a model able to reproduce some of the emergent patterns of the real world system. The resulting model, as we describe in the last section of this paper, could be used to build different kind of "what if" scenarios to test the impact of possible interventions and policies. From this point of view the model that we present can be used by public policy makers like the Galapagos National Park administrators as a tool to evaluate the consequences of their decision.
- 1.6
- The paper is divided as follows: in the first part, aspects of the tourism market in the Galapagos are described that are relevant to the derived model, in the second part, the ABM is described, and in the third part, results from simulation are presented and discussed.
The Galapagos Tourism Market: Uncontrolled, Explosive Expansion
- 2.1
- As mentioned above, tourism in Galapagos has experienced an explosive growth in the last few decades. A review of the available data from the Galapagos National Park (Parque Nacional Galápagos 2012) shows that tourist arrivals in Galapagos grew exponentially from 1995–2011, with an average annual growth rate of approximately 9% (see Figure 2).
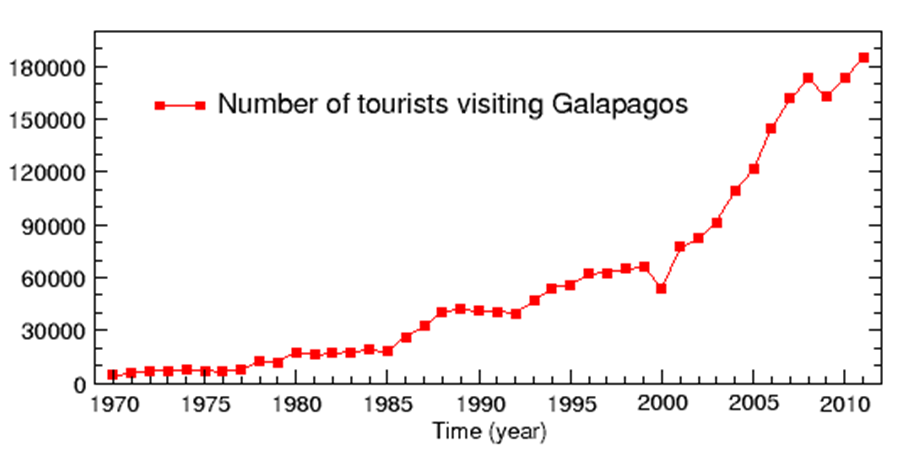
Figure 2. Number of tourists visiting Galapagos from 1975 to 2011 (Source: Galapagos National Park) - 2.2
- Following Butler (1980), the representation of the life-cycle of a touristic destination can be based on a S shaped curve describing six stages that the destination would go through as tourism develops: exploration, involvement, development showing an exponential growth, consolidation, stagnation and the ending with either rejuvenation or decline. As showed in Figure 2, the expansion of tourism in Galapagos is still in the "development" phase, not yet approaching the "stagnation" phase. The Galapagos touristic market evolution process in the last few years followed the same general pattern of growth seen on the Ecuadorian mainland and in the neighboring countries of Peru and Bolivia (World Tourism Organization 2006). Another characteristic of the Galapagos Islands is that the archipelago is relatively remote and isolated, factor generally responsible for its high natural endemism that in turn is the source of the attraction of international tourism. Also, the archipelago geography remoteness results in a general disconnection from the usual touristic routes, creating the need for a high transportation investment in the infrastructure in the islands by local and regional governments and higher costs of visiting tourists in comparison to other competing touristic destinations. Consequently, the normal tourist rarely visits Galapagos more than once, often seeing the archipelago as a "bucket list" destination. The survey conducted by the Galapagos Tourism Monitoring Center of the Ecuadorian Ministry of Tourism in 2011 (Observatorio de Turismo Galapagos 2011) points out that 92.66% of the interviewed tourist visited Galapagos for the first time. This implies that almost every touristic experience in Galapagos is a first time experience, probably never to be repeated. Another important aspect of the Galapagos touristic market is that visitors typically book an accommodation offer based on the choice of second-hand sources such as international travel agencies and/or companies that advertise on the internet. These organizations present to the international tourism market the Galapagos as a pristine, natural, and unique archipelago. The tourist accepts this representation and the corresponding offers without a direct knowledge of what he/she is actually buying. We infuse these conditions in our model by relying upon parameters that characterize touristic offers, such as, whether the hotel is near or far from a beach or the category of a cruise boat.
- 2.3
- The tourism experiences in Galapagos can be divided into two main segments: the land-based tourism and the boat-based tourism. Tourists reserving a cruise to explore the Galapagos Islands are defined as "boat-based," because, in general, they spend most of the time of their touristic experience onboard – sleeping, dinning, and disembarking for short island activities. This type of tourists is perceived by residents as not contributing to the local economy (Epler 2007), as funds tend to support national and international boat companies and large touring organizations. Land-based tourists are tourists that spend all or most of their touristic experience in local communities, sleeping in hotels, arranging tourist activities with local vendors, and eating at their hotels or in local restaurants and they are perceived by local people as more reliant on local products, workers, and services. The difference between land and boat-based tourists is highly relevant from the point of view of the impact on the social, terrestrial, and marine sub-systems, as land-based tourism implies greater urban development and supporting infrastructure, use of public transportation and private vehicles, increased rate of exotic species introduction as a consequence of the importation of most food and products from the mainland, depletion of drinking water reserves, consumption of energy, generation of waste, and the needs of an enhanced water and sanitation systems throughout the archipelago. Over the last 20–30 years, boat-based tourism dominated, but today, the numbers of land- and boat-based tourists are nearly equal.
- 2.4
- To a better understanding of the Galapagos tourist system environment, it should be noted that in the Galapagos, only four islands are populated and thus equipped with touristic land infrastructures: San Cristobal, Santa Cruz, Isabela, and Floreana (see Figure 1). San Cristobal is home to the provincial government, Santa Cruz is the hub of tourism while Isabela is the epicenter of the conflicts between resource conservation and economic development. Floreana has the fewest residents and tourists, constrained by the lack of availability freshwater and the limited support infrastructure for tourism. Only Santa Cruz and San Cristobal host airports that directly connect these islands with the Ecuadorian mainland.
- 2.5
- The model we present in this paper reproduces these Galapagos tourist market features to represent the reservation process as we will show in the next sections.
The Agent Based Model
- 3.1
- This ABM is described following the "'Overview – Design concepts - Details" (ODD) protocol proposed by Grimm et al. (2006; 2010).
- 3.2
- Shortly, the model is designed as follows: when a tourist agent is created, the agent establishes a sorted list of all the available accommodation offers based upon the agent individual characteristics and the features of the all available accommodation offers. Scrolling through the sorted list of accommodation offers, the tourist agent books the first offer that is accessible by price range and beds availability. According to the tourist agent's decisions, the accommodation offers can accumulate an economic profit for the touristic provider agent. The offers that accumulate a profit faster are duplicated with the subsequent creation of a new independent accommodation offer. The duplication process is implemented including small changes (mutations) in the packaging of the parent duplicated accommodation offer, thereby creating an evolutionary selection process similar to the evolutionary algorithms used in metaheuristic optimization problems (Gen 2010).
- 3.3
- Furthermore, a partial representation of the Galapagos geographical space is included in the model to represent the costs in time and money that are required for a tourist agent to move from one island to another. In this way, it is possible to include the movements of tourists between islands to take in count the fact that every tourist wants to maximize the number of touristic attractions visited, traveling from island to island minimizing the transportation cost in time and money.
- 3.4
- In what follows, we define an accommodation offer as a touristic offer that includes accommodation among their services. We define a hotel as any kind of land-based accommodation (e.g., hotels, hostals, resorts), and cruises as any kind of boat-based accommodation (cruise boats, yachts and others). Moreover, we use the expression "touristic attraction" to indicate all the possible touristic activities to which the tourist could access during his/her stay in the Galapagos Islands. Among touristic attractions, we include day tours, visits to interesting places, water sports, trekking trails, snorkeling sites, use of beaches, and others.
Overview
Purpose
- 3.5
- The purpose of the model is to examine the tourists' decision-making processes that rely upon the characteristics of the accommodation offers infrastructure, upon the tourist's individual preferences, as well as upon the spatial configuration characteristics of the Galapagos Islands. Therefore one of the goals of the model is to identify all the individual based characteristics of the process that are relevant in determining the overall emergent dynamics of a touristic destination like the Galapagos Islands. In this perspective, the comparison between the model output and the real world empirical data would permit us to evaluate if the individual based elements used to build the model are significant or not. Another objective of a tourist destination ABM like the one presented in this paper is to provide to public policy makers a tool to test the consequences of their management decisions.
Entities state variables and scales
- 3.6
- The model is composed of five main types of entities: tourist agents, accommodation offer agents, the market operator agent, the tourist agent generator, and the geographical environment circumstances that represent the Galapagos Islands.
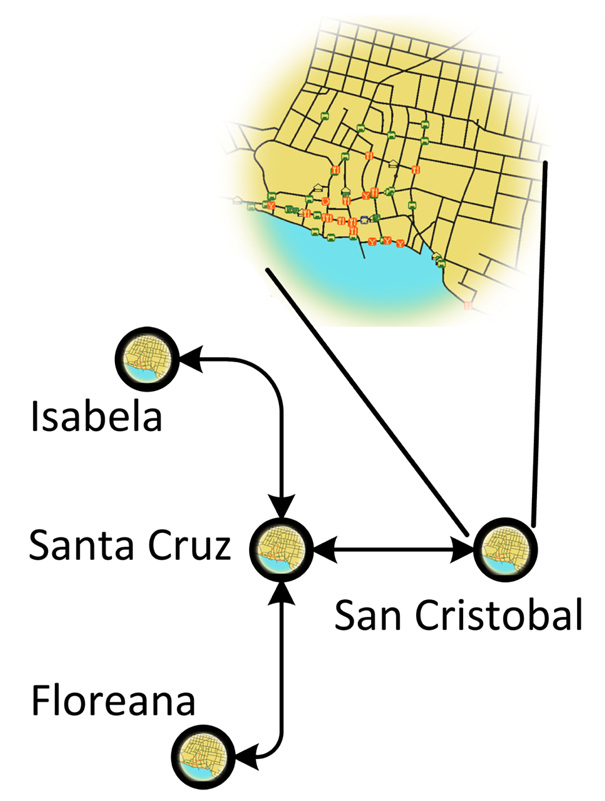
Figure 3. The mixed, spatial explicit and graph-like representation of the geographical environment of the Galapagos archipelago. Every Island is the vertex of a transportation graph. Only the area inside every island is treated explicitly - 3.7
- Figure 3 shows the geographical environment representation, characterized by mixing an explicit spatial representation with a topological, graph-based representation. The four inhabited islands of the Galapagos Archipelago, i.e., San Cristobal, Santa Cruz, Floreana, and Isabela, are represented as vertices on a graph. The edges are used to represent transportation connections between islands. Two islands are connected by an edge if an available transportation operation exists between them. Weights are given to edges to specify the cost and the amount of time of transportation. Some of the islands are defined as entrance hubs, because they host an airport from where tourists enter the archipelago from the Ecuadorian mainland (i.e., San Cristobal and Santa Cruz that are accessed through the nearby Baltra Island airport). Note that an inter-island airline service connects San Cristobal, Santa Cruz, and Isabela islands using low capacity, small aircraft but local commercial boats (i.e., "fibras") are the most common way of moving between islands. Therefore in the model only transportations by boat will be considered. The spatially explicit representation of the inner territory of every island is denoted, including the network of roads and the touristic offers, represented as points located along the road network. Moreover, we associate a certain number of touristic attractions to each one of the populated islands.
- 3.8
- The tourist agents are described by the following state variables: age, budget, stay, reservation flexibility, reservation anticipation, group, and character. The variable "budget" is the amount of money that the tourist agent spends during his touristic experience. The variable "stay" is the length of the touristic experience, whereas "reservation anticipation" is the time interval between the date of booking and the date the tourist agent begins the trip. The "reservation flexibility" represents the extent to which the tourist agent can change the anticipation, and the variable "character" is a derived variable that refers to the tourist agent preference for different aspects of a touristic experience in the Galapagos Islands. The variable "group" indicates how many people travel together with the tourist agent – when the variable value is greater than 1 the tourist is considered to be a group of agent making the same decisions. The "character" variable has five dimensions: world heritage, activities – sports, sun – beach, all-inclusive, and exclusivity. Each dimension has values between [0, 2] – 0 for low interest, 2 for high interest. The "world heritage" dimension indicates how much the tourist agent is interested in seeing Galapagos wildlife. "Activities – sport" is the tourist willingness to access land and water sports (e.g., horseback riding and kayaking) and other touristic attractions with the exclusion of watching wildlife, while "sun – beach" is the willingness to experience beach life (e.g., swimming and sunbathing). "All-inclusive" indicates whether a tourist agent is interested in buying an all-inclusive touristic experience (i.e., generally a tour led experience that includes all land and water activities, arranged meals and lodging, and transit), and lastly "exclusivity" indicates the extent to which the tourist agent is interested in staying in an exclusive touristic facility (i.e., a full service, resort-type accommodation).
- 3.9
- The accommodation offers are characterized by: type, time, capacity, category, price, location, and features. "Type" could take "hotel" or "cruise" values. "Time" is the minimum amount of time during which the offer applies for a tourist agent. The "Capacity" is defined as how many persons can be accommodated in an offer at the same time, while the "Category" is the rank associated to the offers according to their overall quality. "Price" is the cost of a hotel night or a boat cruise through the islands (refer to the Tourist reservation submodel to see how cruises and hotels prices are compared). "Location" is specified only for land-based accommodation types and indicates the geographic position of hotels on the corresponding island. "Feature" is an offer state variable that corresponds to the "character" tourist agent state variable, owning the same five dimensions and value ranges. The offer "features" indicates the extent to which the offer satisfies the expectation of a tourist agent in the five different dimensions of the variable. The actual number of the accommodation offers in the simulation and the values of their state variables are assigned to the touristic offers, in the model initialization, to reproduce the real world state in the Galapagos Archipelago of Ecuador.
- 3.10
- The market operator agent is defined by the following state variables: periodicity, price increase threshold, price increase rate, price decrease threshold, price decrease rate, number of random offer creations, operating expenses parameters, offer cost parameters, offer depreciation rate, number of years of the net present value, yearly discount rate, reinvestment rate, and bankruptcy threshold. The market operator state variables are described in Tables 6 and 7 in Appendix A.
- 3.11
- The tourist agent generator is not strictly an agent, as it could be considered a module in the model where all the parameters needed to generate tourist agents are stored. It is defined by the following state variables: periodicity, number of tourist agents per year, number of age classes, and seasonal tuning. The tourist agent generator state variables are described in Table 12 in Appendix A.
Process overview and scheduling
- 3.12
- The time step of the model is one day. Months are defined as composed by 30 days, and years are defined as composed by 12 months. Hotels and cruises operate with a daily time step, registering the number of tourist agents they host. The market operator agent follows a time step defined by its period variable that, in this study, is always set at a month.
- 3.13
- When tourist agents are generated by the tourist agent generator, they immediately attempt to reserve an accommodation offer. If they do not succeed in finding an accommodation, they exit from the simulation. If the tourist agent succeeds, the agent waits until the date scheduled by the reservation, then switches to the "trip" state and the agent is then registered in the offer that was booked. In the case where the tourist agent booked a hotel, each simulation day the agent searches for a new accommodation for the next day. We note that, in this way, the tourist agents cannot reserve a hotel for more than one day. Of course, this is not what actually happens in the real world as in certain cases a tourist wants to book in the same place for more than one day. However, the reservation process was designed in this way because we have no information about the percentage of tourists booking hotels in advance in Galapagos for more than one day. Also allowing tourist agents to book for more than one day in advance would imply that the tourist agent could cancel the reservation in case he wants to change place before of the reservation ends. In this circumstance the tourist agent is forced to pay a fine but then again we have no data about cancellation policies applied in the hotels.
- 3.14
- Every simulation day, the land-based tourist agents subtract 3 touristic attractions from the list of the unvisited touristic attraction of the island where the agents are actually located. This simulate the fact that the land-based agent go through, as daily average, 3 activities, for example visiting a natural environment site, take a walk along a highland track, and take a sun bath on a local beach. In this way, while the tourist agent remains in the same island IA, the number of unvisited touristic attraction associated to IA will decrease every day by three units. After a certain number of days, for the tourist agent, in another island IB of the archipelago, the number of unvisited touristic attractions will be higher than in the island IA. As we will see in the "Tourist reservation submodel" section, the tourist agents tend to reserve accommodation offers located in the island with the higher number of unvisited touristic attractions. Therefore when the number of unvisited touristic attractions in the island IA will be less than the number of unvisited touristic attraction in the island IB, the agent will be pushed to bear the costs – in time and money – of moving from an island to another island.
- 3.15
- If the tourist agent books a cruise, the agent follows the cruise journey that includes implicitly 3 daily activities. At the end of the cruise journey, and if the length of his/her scheduled stay is greater than the length of the cruise journey, the agent attempts to book a hotel. Note that the stopover destinations, the number of stops, and the number of days of every cruise journey are strictly regulated by the Galapagos National Park and cannot be changed by the boats' owners. Moreover, the cruises stopovers never include nights off board so the boat-based tourist agents, while they are in cruise never use land accommodation offers.
- 3.16
- The market operator calculates the profit or loss and the average number of hosted tourist agents for every accommodation offer in the model, and decides whether to create new offers, remove old offers, or increase/decrease prices.
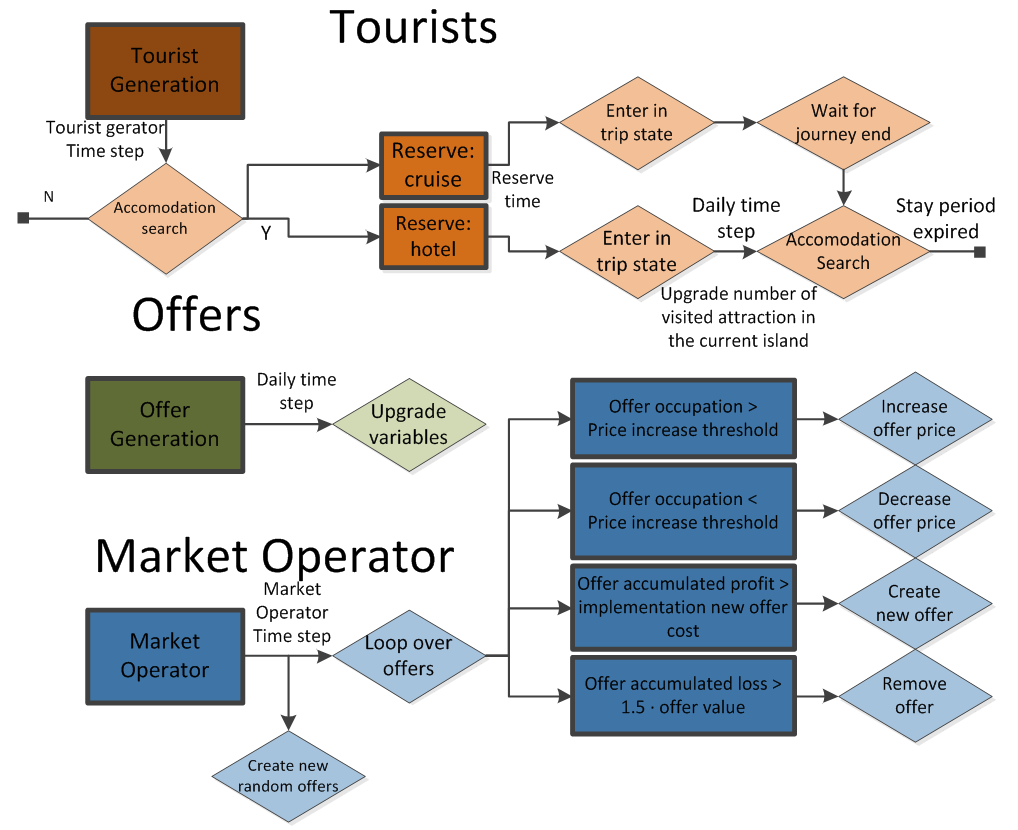
Figure 4. Flow diagram of the processes sequence of agents in the model in their life cycle. - 3.17
- A flow diagram of the life process of every agent in the model is shown in Figure 4. Note that the maximum number of cruise boats with regular operating permission is strictly regulated by the Galapagos National Park. For this reason, we imposed that the total number of cruises during the simulation is not greater than the initial number of cruises in the input data. The total number of hotels is not so strictly regulated by the Galapagos National Park so the number of hotels in the simulation can change.
Software and hardware environment
The model have been implemented in the MASON (Luke et al. 2005) environment. MASON is a free, Java-based, discrete-event, multi-agent simulation library core used to reduce the repetitive code writing effort necessary to develop an ABM. Every run of 15 years with 200,000 generated tourists per year requires approximately 4 CPU hours on an Intel Pentium Dual 2.40 GHz.Design Concepts
Emergence
- 3.18
- Many macroscopic patterns emerge from the tourist, offer, and market operator agents' individual behaviors – the model reproduce the relative proportion of land- and boat-based tourists and the spatial distribution of accommodation offers and tourist agents across the Galapagos Archipelago.
Adaptation
- 3.19
- The market operator adapts the accommodation offers to the available environment constituted by tourist agents. The process is permitted by the variation of offers prices, replication of most booked offers, and the elimination of un-booked offers. Only the offers that satisfy most the tourist agent preferences will survive and replicate.
Objectives
- 3.20
- The tourist agents' aim is to find the most satisfying accommodation offer and maximize the number of possible touristic attractions enjoyed during the trip. The purpose of the market operator is to produce an offers' population that satisfy tourist agents most.
Knowledge
- 3.21
- Tourist agents and market operator have an unrestricted access to information. This means that in every moment they known exactly the characteristics of every accommodation offer. Even if it is known that the access to information in the real world tourism market could be asymmetric and not complete we make this assumption for the sake of model's simplicity.
Interaction
- 3.22
- Tourist agents interact with offers to learn about the hotel's beds availability as well as boat berths, and to get information about the offers' features. Market operators interact with offers to determine whether it is necessary to introduce changes in the offers' environment.
Stochasticity
- 3.23
- All the parameters defining the tourist agent characteristic are constructed as stochastic variables, as they are extracted randomly from empirical probability distributions. These empirical distributions are the result of field surveys in which a sample of tourists visiting Galapagos Islands was interviewed through a pre-tested survey instrument. Moreover, a stochastic factor is extracted to get the extent to which touristic offers are different in respect to their duplicates.
Observation
- 3.24
- During simulation, we monitor the number of land- and boat-based tourist agents visiting the Galapagos Islands and the number of tourist agents in each of the populated islands.
Details
- 3.25
- In this section, we describe the initialization process and the input data used to initialize the state variables. Furthermore, the submodels that contain the equations and rules of the model are presented.
Initialization
- 3.26
- At the beginning of each simulation run the island parameters are read from the configuration files. First, the archipelago graph is charged. In Table 2 in Appendix A, the parameters defining the archipelago transportation graph are reported. Next, the shapefile containing the coastline of every island is read. The coastlines data were obtained from the INGALA, National Institute of Galapagos, now renamed the Government Council of Galapagos. Then, the geographical coverage of the roads network is read (data obtained from the Ecuadorian Institute of Statistics and Census, INEC), followed by the shapefile containing the hotel data. The information about hotels in Galapagos is obtained from the Galapagos Tourism Monitoring Center. Cruises are also initialized in the model, information obtained from the Galapagos National Park and the Galapagos cruises promotion organization (www.crucerogalapagos.com). Prices of hotels were obtained through a telephone survey. After the georeferenced information is read, the simulation begins. The number of touristic attractions of every island in the archipelago is reported in Table 3 in Appendix A. Note that touristic activities are strictly delimited by the Galapagos National Park so we know exactly how many activities are offered to tourists in every island. The actual value of every state variable of every individual tourist agent is extracted from empirical distributions from the 2011 field survey of the Galapagos Tourism Monitoring Center (Observatorio de Turismo Galapagos 2011). Note that the empirical data we have used indicate only the total tourist agent's expenditure for the Galapagos trip, including the air ticket from the Ecuadorian mainland and the park entrance fee. Because the air ticket prices and the Galapagos National Park entrance fees are different for national and foreign tourists, we calculated the actual budget available for tourism in the Galapagos to every tourist agent by subtracting $450.00 (USD) for the air ticket and $100.00 (USD) for the park entrance fee applied to the 78.16% of the generated tourist agent that are considered as foreign tourist agents, and $350.00 (USD) for the air ticket and $16.00 (USD) for the park entrance fee applied to the 21.84% of the generated tourist agents considered as national tourist agents. The values of the tourist agent's state variable are reported in Tables 3 and 4 in Appendix A. The offers' variable feature is determined by the characteristics of the offer. For hotels, World Heritage values are set to 0, 1 or 2 depending on the distance from the centroid of the island roads network – 2 for distances larger than 10,000 m, 1 for distances between 10,000 m and 8,000 m, and 0 for hotels with a distance below 8,000 m. The same World Heritage value is set to 2 for cruises. The activities - sport value is assigned to hotels and cruises to be proportional to the Category. Sun - beach, for hotels, are set to 1 or 2 depending on the distance from the island coastline – 2 for distances smaller than 100 m, and 1 for distances greater than 100 m. Sun and beach is set to 0 for cruise. We note that, in this way, the islands that show roads with more extension along the seafront tend to be more attractive for sun and beach tourist agents, while islands that show roads that bring tourist agents far from the urban centers tend to be more attractive for world heritage type tourist agents. All the offers feature variable assignments are reported in Table 6 in Appendix A.
- 3.27
- The time-series of the tourist agents generated for one simulation year is proportional to the historical series of visiting tourists in Galapagos, extracted from the Galapagos National Park statistics (Parque Nacional Galápagos 2012).
Submodels
Tourist reservation submodel
- 3.28
- This submodel defines the way tourist agents choose the accommodation that they book. When a tourist agent is created in the simulation, the first action the agent performs is to try to book an accommodation offer. If the agent books a hotel, the tourist agent is defined as a land-based tourist agent. This submodel is described as follows:
- The tourist agent uses the offer comparator module to build a sorted list of all the available offers. If this is the initial application of the comparator module, all possible land- and boat-based offers are included. If the agent wishes to renew a land-based reservation, the agent includes only hotel type offers.
- Starting from the top of the sorted list, the tourist agent examines the accommodation offers and books the first offer with a price within the agent's budget and with available rooms during the dates of the desired trip. If the end of the list is reached, the agent exits from the simulation.
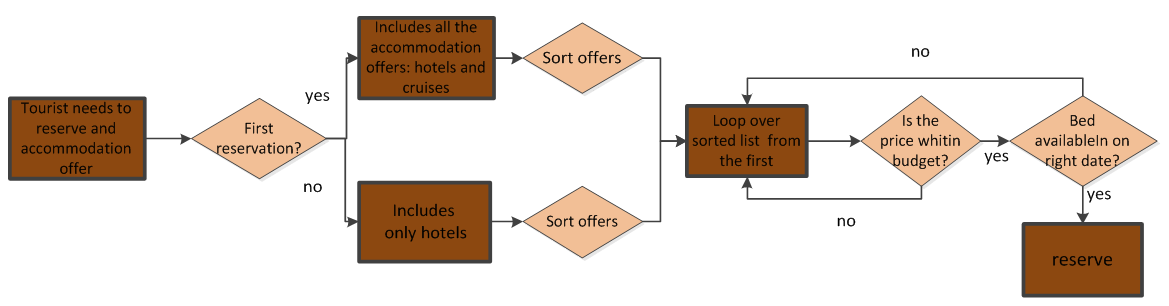
Figure 5. Flow diagram of the reservation submodel - 3.29
- The Offer Comparator module works in the following way: the tourist agent generator divides the interval from the minimum to the maximum tourist agents' budget into n subintervals. We define as "low budget" and "high budget" the generated tourist agents with a budget belonging to the lower and higher levels of the considered budget subintervals, respectively. The remaining tourist agents will be defined as "medium budget" tourist agents. Depending on the budget segment the tourist agent belongs, the agent will apply a different strategy to sort the accommodation offers: low budget tourist agents will prefer lowest price offers, the high budget tourist agent will prefer the highest quality offers and the medium budget tourist agents will follow a best quality for minimum price strategy (Piana 2004). In detail, the low budget tourist agents will sort offers according to the following condition: the offer O1 precedes the offer O2 if P1 < P2 where Pi is given by:
Pi = pbi + Tci
Here pbi is the price for a room per night for the offer Oi and Tci is the transportation cost to reach the island where the offer Oi is located from the closest entrance island (if the offer Oi is located in an entrance hub then Tci = 0). Cruises always embark tourist agent from Santa Cruz or San Cristobal so Tci = 0 for cruises. In the case where two or more offers present the same P, the Offer Comparator Module will order them at random. To allow comparisons between the accommodation price of an all-inclusive touristic offer, like a cruise and an offer such as a hotel for which the accommodation price only includes the expenses for the night stay, it is necessary to consider the price of the hotel as if the hotel where an all-inclusive touristic offer. To accommodate that in the model, a specific parameter is defined – the daily expense rate, a ratio between the total average daily expenses of a land-based tourist agent and the average price for one night in a hotel. By multiplying the price of a hotel by the daily expense rate, it is possible to obtain a corrected hotel price that is comparable to cruise prices. Below, all the hotels prices are intended as corrected prices and the daily expenses rate is set to 3 (Epler 2007). - 3.30
- The high budget tourist agent will consider offers through the following condition: the offer O1 precedes the offer O2 if the overall quality Q1 is greater than Q2. The overall quality is defined as:
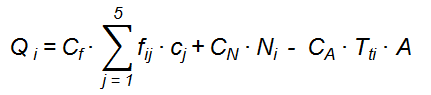
Here fij is the j-th element of the feature variable of the offer Oi, while cj is the j-th element of the tourist agent's character variable. Moreover, Ni is the number of touristic attractions associated to the island where the offer Oi is located. Tti is the transportation time to travel to the island where the offer Oi is located from an entrance island. Lastly, A is the age factor associated to the tourist agent – as in the case of tourist agents' budget, the tourist agent generator separates the generated tourist agents by age into a certain number of age intervals, defining as "young aged" and "old aged" the agents that correspond to the lowest age and higher age intervals, respectively. The remaining tourist agents will be defined as "middle aged" tourist agents. The age factor A is defined to be equal to 1, 2 or 3 for tourist agents belonging to the young, middle and old aged classes, respectively. The three factors Cf, CN, and CA are parameters that will used to calibrate the model.
- 3.31
- For the medium budget tourist agent, the offer O1 precedes the offer O2 if R1 > R2. Ri is the quality price ratio and it is defined as:
Ri = Qi /Pi.
When the tourist agent is already accommodated in a hotel and the agent is looking for a new accommodation for the following day, the expression used to indicate the overall quality of the travel experience is slightly different: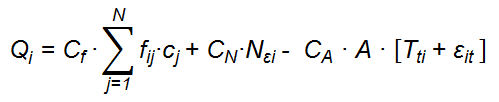
Here Nεi is equal to the number of the touristic attractions not visited by the tourist agent on the island where the offer Oi is located. The islands with more not visited touristic attraction will be more attractive for the tourist agent. The parameter εit is always equal to 0 and is equal to 1 only if the offer Oi is not the offer where the tourist agent is actually accommodated.
Market operator submodel
- 3.32
- This submodel defines the market operator decision-making rules. The market operator (MO) uses the profit generated by an offer to create new offers similar to a successful offer. The steps followed by the MO to decide if an offer should be "replicated" are as follows:
- Calculate the total profit accumulated by the offer and determine if it is high enough to cover the investment needed to build a copy of the starting offer.
- Calculate the Net Present Value (NPV) of the new offer. A new offer will be created only when NPV is positive.
- 3.33
- The total profit P of the offers is defined as the sum of all the daily profits pi over the period from the last replication or from the creation of the offer to the present time minus the accumulated renovation costs:
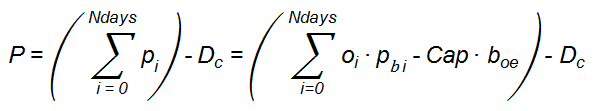
Here Ndays is the number of days between the creation or the last replication of the offer and the present time, while Dc is the cost due to the renovation accumulated by the offer in the same period. In addition, oi and pbi are the occupancy and price per bed or berth of the offer corresponding to the day i. The variables Ccap and boe represent the capacity and the operating expenses per "bed" respectively. In detail, the occupancy is the number of occupied beds and the operating expenses are the cost per day, per bed to maintain the offer. boe, is a function of the characteristics of the offer as follows:
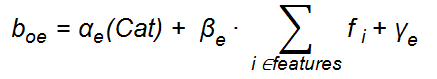
where Cat could take the values 0, 1, 2 and 3, fi is the i-th element of the offer feature state variable and αe, βe and γe are the parameters presented in Table 10 for Hotels and Table 11 for Cruises.
- 3.34
- Note that boe automatically defines minimum rentable price for the offer:
prent = boe
Where fmp is a factor that is set to be 1.2.
prent in turn defines the minimum acceptable price pmin:
pmin = prent · fmp - 3.35
- The investment needed to duplicate the offer, in the case of hotels, is proportional to the features and characteristics of the offer:
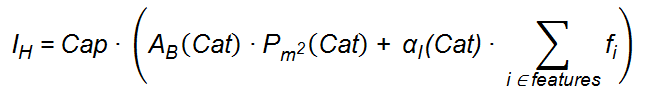
where AB is the average area per bed as function of the category Cat, Pm2 is the building price per square meter as function of the category. The values of the parameters presented in this last equation have been determined through a field survey of departing tourists on San Cristobal and Santa Cruz Islands and the resulting values are presented in Table 8 in Appendix A. For Cruises the investment expression is as follows:
Ic = Cap · αi(Cat)
where αi(Cat) is a parameter dependent on the Cruise category. The values for αI are presented in Table 9 in Appendix A. - 3.36
- We note that the renovation cost Dc in the above expression of the profit, is equals to:
Dc = a · dr · IH.C
Here a, is the age of the offer in years and dr is the depreciation annual rate. As result of our field survey, we set dr 2.5% for hotels and 3.5% for cruises. - 3.37
- Once the condition at point 1 is satisfied, the MO evaluates condition number 2, calculating the Net Present Value (NPV) of the new offer that represents the cost-effectiveness of the investment for a new offer. The NPV is expressed as:
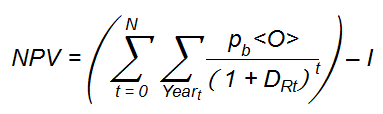
where N is the number of years in which the investment must be recovered, <O> is the daily average occupancy of the offer that is duplicated, calculated in the last year of activity, pb is the price per bed per night of the duplicated offer at the time of duplication. Furthermore DRT is the discount rate for the year t and I is the investment to create the new offer presented above. The discount rate is the rate of return that could be earned on an investment in the financial markets with similar risk. All the offers that fulfill the conditions P ·Rr > I and NPV > 0 are replicated. When the replication is done, the cumulated profit of the replicated offer is set to zero and the same offer will not be replicated until the conditions at points 1 and 2 are satisfied again. The new offer will be not an exact copy of the replicated one – all the features and characteristics of the replicated offer will be changed by a small stochastic factor Sc = 10% to give rise to a slightly different new offer. In that way, we create an offer ecosystem where not only the fittest offers are replicated i.e., the offers that can accumulate profit fastest, but where we also introduce errors in the process of replication to permit to the offers' ecosystem to adapt to the tourist agent features environment faster and more efficiently. When a hotel is duplicated, a new hotel is created. This new hotel is placed in a random position inside the roads network of the same island of the parent hotel, with a distance from the parent hotel between 100 and 1600 m. Also new hotels have not to be closer than 20 m to other established hotels. If an accommodation offer shows a passive profit (P < 0), and the passive absolute is equal to the bankruptcy threshold multiplied for the cost (I) of the offer, the market operator will destroy the offer.
- 3.38
- The second decision making process of the market operator is the offer price variation. If the offer's average occupation is above the price increase threshold presented in Table 7 in Appendix A, the MO will increase the price of the offer by a factor defined by the price increase rate. On the other hand, if the average occupation is below the price decrease threshold, the MO will decrease the price of the offer by a factor defined by the price decrease rate. The price of an offer will be never set below the minimum acceptable price pmin defined above.
Model verification, Calibration and Validation
-
Verification
- 4.1
- The verification process consists of obtaining a confirmation that the implemented program code behaves as planned in the design phase. To verify our model, we applied the following strategy: first, we examined every code line to confirm its function and correctness; second, we performed an extreme value test for every parameter in the model, including empirical data, proving that the system responds in the expected way, and third, we built an oversimplified test model with only a few tourists and accommodation offers agents and we closely examine the results, checking that every agent behaved in the appropriate manner.
Calibration and Validation
- 4.2
- The calibration is the process of adjusting the value of some of the independent parameters to change the response of a model in search of an empirical adequacy. The validation (after Crooks et al. 2008; Ligtenberg et al. 2010) consists of controlling that the output from a model produces results that are sufficiently close to the data of the corresponding real world system, within the limits and the objectives of the modeling. Calibration and validation are quite interconnected processes, because during the calibration process, the parameter space is restricted to obtain a model that can be considered as validated.
- 4.3
- Our model was designed to reproduce macroscopic features of tourism in the Galapagos Islands, such as the relative proportion between land- and boat-based tourism and the spatial distribution of tourists throughout the archipelago. Therefore, the validation process consists in verifying that the land- and boat-based distributions and the spatial distribution of tourist agents, predicted by the model, is in agreement with data sets from the Galapagos National Park and the Galapagos Tourism Monitoring Center.
- 4.4
- We performed the calibration process by varying the value of three parameters: Cf, CN, and CA. These three calibration parameters are presented in section "Submodels" in the expression of the accommodation offers quality Q and are used to balance the contribution to the offer quality, originating from the offer features term, the islands touristic attractions term, and the age term. Being involved in the representation of the tourist's decision-making process and, therefore, in the representation of mental processes, these three factors are used as calibration parameters, because it would be very difficult to obtain a measure of them. We performed a systematic search in this three-dimensional parameter space and we selected the vector value that gives us the best approximation of the observed proportion between land- and boat-based tourist and of the distribution of tourists in the four inhabited islands of the Galapagos Archipelago. As the model includes different stochastic factors, distinct runs produce generally distinct results in terms of the simulated system history. For this reason, we averaged the outputs from 10 independent runs of 15 year. Then we compared the real world data with the average values over the last 7 simulation years of the resulting averaged simulated history. In this regard, we considered the first 8 simulation years as a time interval during which the system can reach a local equilibrium, allowing the accommodation offers to adjust their prices and numbers to the characteristics of the tourist agents. The calibration is only a qualitative process because we know empirical data only approximately and we do not have access to empirical time-series data.
- 4.5
- From the 2011 Galapagos National Park statistics, we know that approximately 43% of tourists toured the archipelago as part of a cruise and that 23% of people entered the archipelago through San Cristobal Island. Moreover, from the Galapagos Tourism Monitoring Center report, we know that approximately 20% of tourists reserved a cruise and then arranged for a hotel at the end of the cruise. A survey from the Tourism Association of Isabela (Arucaria XXI 2007) shows that in 2007 nearly 12,000 tourists visited Isabela Island, which accounts for 8% of the total number of tourists visiting Galapagos in 2007. Using these above percentage reports of use and general access, we calibrated the model.
Calibration results
- 4.6
- In Figure 6, we show the final calibration outputs corresponding to the value of the calibration vector (Cf, CN, CA) = (1, 2, 0.2). After an initial equilibration period, the curves representing the monthly number of tourist agents reserving cruise trips or visiting the four inhabited islands reach a plateau. The plots in Figure 6 also show a typical seasonal behavior between the months of September and October, the period with lowest touristic presence. In Figure 7 we show some snapshots from the calibrations run. In this Figure is represented a small portion of the total simulation space: the area of Puerto Ayora that, as showed in Figure 1, is the main inhabited center of the Santa Cruz Island. As we can see in the time series of the three reported snapshot, during the simulation time, some hotels are removed from the simulation, while other a created.
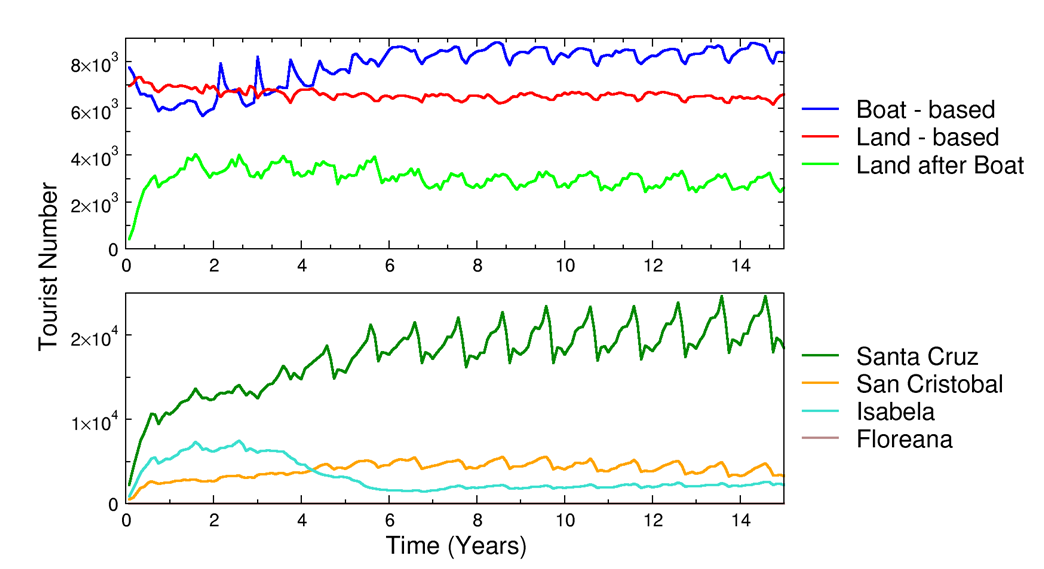
Figure 6. Calibration model output. In the upper graph are showed the monthly total number of tourist agent reserving a cruise (blue line) or a hotel (red line) as first option. The green line in the same graph is the monthly number of tourist agent reserving a hotel after reserving a cruise as first option. The bottom graph shows the monthly total touristic presence in the four inhabited islands of the Galapagos archipelago. 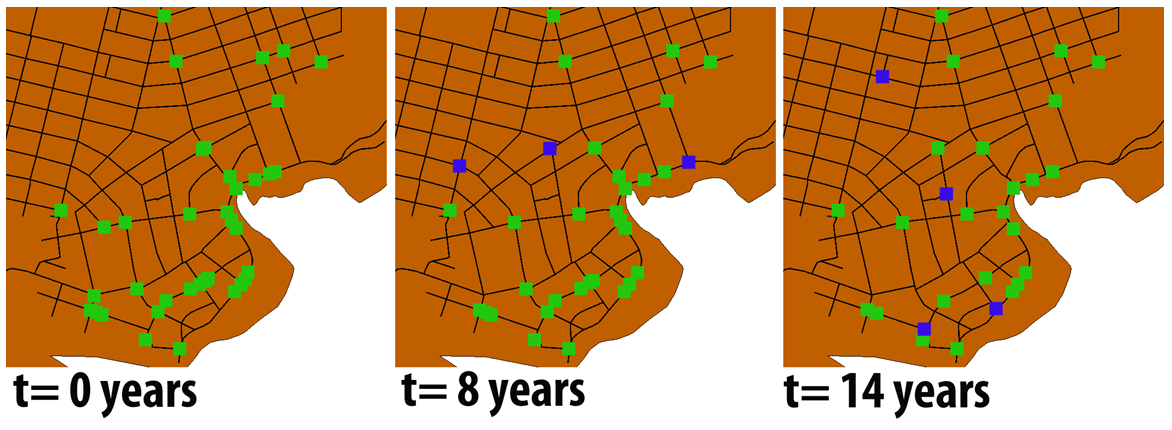
Figure 7. Snapshot pictures taken from the calibration run. In the three snapshots is represented the central part of Puerto Ayora that is the main urban area of the Santa Cruz Island where the majority of the island's hotels are located. Roads are represented trough black lines. Green squares are hotel. Blue squares are new hotel created during the simulation time between the time of the current snapshot and the time of the preceding snapshot. Table 1: Outputs from the ABM simulations – fractions of the total number of tourist agent generated in the last 10-year of the simulation runs. Boat-based Land-based Land after boat San Cristobal Isabela Empirical data 0.42 0.58 0.20 0.23 < 0.08 Reference Run 0.44 0.56 0.26 0.16 0.08 What if scenarios Airport in Isabela 0.43 0.57 0.25 0.17 0.08 Tourism collapse 0.44 0.58 0.26 0.16 0.06 Park ticket increase 0.76 0.24 0.59 0.08 0.07 - 4.7
- In Table 1, we show the results of the last 7- year run averages. In this table, we report the fraction of the total number of tourist agents entering the simulation and reserving a cruise as their first choice (i.e., boat-based tourist agent), the fraction of tourist agents reserving a hotel as their first choice (land-based tourist agent), the fraction of tourist agents that reserved a cruise and then reserved a hotel room immediately after the cruise (land- and boat-based), the fraction of tourist agents visiting San Cristobal Island, and the fraction of tourist agents visiting the Island of Isabela. We note that after the first equilibration period, the number and the spatial distribution of the accommodation offers is different with regards to the initial configuration. In detail, the number of cruise boats changed from an initial value of 66 vessels to an average value of 47.2 in the last 7-years of the simulation runs. Furthermore, the number of hotels in Santa Cruz, San Cristobal, Isabela, and Floreana changed from 43, 24, 35 and 2 to 34.5, 7.3, 4.3 and 0 respectively for the last 7-years of the simulation. In the context of our calibration process, these changes are not significant because we are interested in finding a state of our model that can reproduce the distribution of tourists among land- and boat-based offers and among the islands of the archipelago, and not the number and distribution of touristic offers.
ABM experiments
- 5.1
- The model resulting from the calibration process was used to build three "what if" scenarios to study the response of the model to state variable changes. The three scenarios we tested were as follows:
- Opening of a new airport on Isabela Island with direct flights to/from the Ecuadorian mainland
- Tourism collapse – a reduction of visiting tourists from 180,000 per year (as recorded in 2011) to 100,000 per year
- Increase in the park fees from $6.00 (USD) and $100.00 (USD) for national and foreign tourists, respectively, to $400.00 (USD) for all the visiting tourists
- 5.2
- In detail, the set-up of the 3 "what if" scenarios were – for scenario (a) at the end of the 7th simulation year, we permitted tourist agents to enter the simulation directly also from Isabela. To generate scenario (b) at the end of the 6-h simulation year, we decreased the number of generated tourist agents by 0.75 per year to get the total number of generated tourist agents to 112,500 after 2-years and then we maintained as stable the number of generated tourist agents. To create the scenario (c) at the end of the 7th simulation year, we sharply reduced the budget available to every tourist agent by $400.00 (USD).
ABM Experiments Results
- 5.3
- The results of the "what if" scenarios should be interpreted as an information about how our model reacts to certain changes in the state variables. New empirical data are needed and additional validation data are required to determine whether the model is sufficiently robust to suitably represent the decision-making of agent and some of the stochastic processes associated with exogenous forces and endogenous factors that combine in complex ways to affect touristic behaviors in response to market conditions and a dynamic environment.
- 5.4
- In Table 1, the average fractions of tourist agents obtained in the calibration process are reported. We note that for scenarios (a) and (b), the model does not show any significant change regarding the reference calibration run. Scenario (c) shows that changes in the model state variables generate a stronger influence on the simulation outputs.
- 5.5
- We can assume from these results that if we do not change the individual based characteristics of the visiting tourist agents (such as the tourist agents' budget), only change some aspects of the touristic infrastructure (e.g., a new airport), and change the total number of arriving tourist agents, this will not affect the observed emergent patterns. With a new airport in Isabela and without an upgraded touristic infrastructure on the same island that is able to attract and host an increased number of tourist agents, in the short term, no change in the tourist agent distribution will result among the islands of the archipelago. This may occur because Santa Cruz Island, due to his strategic and central geographical position in the archipelago and as the hub of the tourism industry, will remain the focal point of tourism in the Galapagos Islands. As such, Santa Cruz Island substantially influences tourism mobility around the archipelago and, therefore, will still attract the largest portion of the visiting tourists. We can expect a similar pattern for a sudden decrease in tourists' arrivals – without any other change, the visiting tourists will be distribute between land- and boat-based tours and among the archipelago islands in an unaltered manner.
- 5.6
- The circumstances change completely when we alter some of the characteristics of individual tourist agents. In scenario (c), the increase in the entrance fees to the Galapagos National Park completely alters the tourist agent's ability to gain access to the different segments of the Galapagos touristic market. In this last case, the proportion of land-based tourist agents collapses to 24% of the arriving tourist agents, while the boat-based tourist agents assume 76% of the visiting tourist agents. We note that in this scenario, the average number of tourist agents succeeding in reserving an accommodation offer on every simulation month falls from 14,880 of the calibration reference model, to 8,322 registering a decrease of about 56%. Clearly, the tourist agents that are removed by the reservation process are the low budget tourist agents.
Conclusion
- 6.1
- The dynamics and changes of a touristic destination like Galapagos Islands depend on a high number of combined factors that, in most cases, act also at the individual scale of tourists and touristic offers. In this paper, we have shown an approach to develop an Agent Based Model of touristic offers and reservation in the Galapagos Islands. The resulting model is, as usual in an ABM, a multidisciplinary assembly, where elements from tourism market, economy, psychology, and geography are combined to create a system that represents some of the characteristics of the tourism market of the Galapagos Islands. The model includes a psychometric representation of tourists visiting the Galapagos, together with a detailed representation of touristic accommodation offers and touristic attractions in the Galapagos. We parameterized the model, exploiting to the maximum extent, the available empirical data sets. Some of the model's parameters where used to calibrate it and to reproduce closely emergent patterns of tourism in Galapagos. The model outputs are quite consistent with the available empirical data sets showing that the individual-based mechanism and processes defined to build the model can closely reproduce some of the key aspects of the Galapagos tourism market. As indicated above, this model represents a first step in building an ABM that will include other social and environmental aspects of Galapagos Islands such as fisheries, agriculture, land cover change, and more. Moreover, additional collection and derivation of empirical data are necessary to strengthen the validation of the model and to reproduce more aspects of the touristic market in the Galapagos Islands.
Acknowledgements
-
The research conducted in the generation of this model was made possible through a grant from the McDonnell Foundation to the University of North Carolina at Chapel Hill, USA and a sub-contract to the Universidad San Francisco de Quito, EC. In addition, the authors wish to thank the Galapagos Science Center, a partnership between the Universidad San Francisco de Quito, EC and the University of North Carolina at Chapel Hill, USA for use of facilities and associated data sets. We particularly wish to thank the Galapagos National Park for their assistance and cooperation.
References
-
ARUCARIA XXI. (2007). SATISFACCIÓN DE TURISTAS QUE VISITAN PUERTO VILLAMIL , ISABELA . ISLA ISABELA – GALÁPAGOS JULIO 2007 (pp. 1–25).
BAGGIO, R. (2008). Symptoms of Complexity in a Tourism System. Tourism Amalisys, 13(1), 1–20. [doi:10.3727/108354208784548797]
BALBI, S., & Giupponi, C. (2010). Ca ' Foscari University of, (05).
BENSTED-SMITH, R. (Ed.). (1999). A BIODIVERSITY VISION FOR THE GALAPAGOS ISLANDS. Charles Darwin Foundation and World Wildlife Fund, Puerto Ayora, Ecuador.
BUTLER, R. W. (1980). the Concept of a Tourist Area Cycle of Evolution: Implications for Management of Resources. The Canadian Geographer/Le Géographe canadien, 24(1), 5–12. [doi:10.1111/j.1541-0064.1980.tb00970.x]
CECCHINI, A., & Trunfio, G. A. (2007). A Multiagent Model for Supporting Tourism Policy-Making by Market Simulations. Computational science: 7th International conference, ICCS 2007: proceedings, part I (pp. 567–574). New York: Springer. [doi:10.1007/978-3-540-72584-8_75]
CROOKS, A., Castle, C., & Batty, M. (2008). Key challenges in agent-based modelling for geo-spatial simulation. Computers, Environment and Urban Systems, 32(6), 417–430. [doi://dx.doi.org/10.1016/j.compenvurbsys.2008.09.004]
EPLER, B. (2007). Tourism , the Economy , Population Growth , and Conservation in Galapagos. Charles Darwin Foundation, Puerto Ayora, Province of Galapagos, Ecuador, (September).
GEN, M. and Yu, X. (2010). Introduction to Evolutionary Algorithms. (R. Roy, Ed.) (second.). New York: Springer.
GONZÁLEZ, J. A., Montes, C., Rodríguez, J. and, & Tapia, W. (2008). Rethinking the Galapagos Islands as a complex social-ecological system: implications for conservation and management. Ecology and Society, 13(2). Retrieved from http://dlc.dlib.indiana.edu/dlc/handle/10535/2456
GRIMM, V., Berger, U., Bastiansen, F., Eliassen, S., Ginot, V., Giske, J., Goss-Custard, J., et al. (2006). A standard protocol for describing individual-based and agent-based models. Ecological Modelling, 198(1–2), 115–126. [doi:10.1016/j.ecolmodel.2006.04.023]
GRIMM, V., Berger, U., DeAngelis, D. L., Polhill, J. G., Giske, J., & Railsback, S. F. (2010). The ODD protocol: A review and first update. Ecological Modelling, 221(23), 2760–2768. [doi:10.1016/j.ecolmodel.2010.08.019]
GRIMM, V., Revilla, E., Berger, U., Jeltsch, F., Mooij, W. M., Railsback, S. F., Thulke, H.-H., et al. (2005). Pattern-oriented modeling of agent-based complex systems: lessons from ecology. Science (New York, N.Y.), 310(5750), 987–91. [doi:10.1126/science.1116681]
JOHNSON, P. A., & Sieber, R. E. (2011). An agent-based approach to providing tourism planning support. Environment and Planning B: Planning and Design, 38(3), 486–504. Retrieved from http://www.envplan.com/abstract.cgi?id=b35148 [doi:10.1068/b35148]
LIGTENBERG, A., Van Lammeren, R. J. a., Bregt, A. K., & Beulens, A. J. M. (2010). Validation of an agent-based model for spatial planning: A role-playing approach. Computers, Environment and Urban Systems, 34(5), 424–434. [doi:10.1016/j.compenvurbsys.2010.04.005]
LIU, J., Dietz, T., Carpenter, S. R., Alberti, M., Folke, C., Moran, E., Pell, A. N., et al. (2007). Complexity of coupled human and natural systems. Science (New York, N.Y.), 317(5844), 1513–6. [doi:10.1126/science.1144004]
LUKE, S., Cioffi-Revilla, C., Panait, L., Sullivan, K., & Balan, G. (2005). MASON: A multiagent simulation environment. Simulation, 1–18. Retrieved from http://sim.sagepub.com/content/81/7/517.short [doi:10.1177/0037549705058073]
OBSERVATORIO DE TURISMO GALAPAGOS. (2011). Boletin n 1 sept 2011.
OSTROM, E. (2007). A diagnostic approach for going beyond panaceas. Proceedings of the National Academy of Sciences of the United States of America, 104(39), 15181–7. [doi:10.1073/pnas.0702288104]
OSTROM, E. (2009). A general framework for analyzing sustainability of social-ecological systems. Science (New York, N.Y.), 325(5939), 419–22. [doi:10.1126/science.1172133]
PARQUE NACIONAL GALÁPAGOS (2007). Plan Manejo Parque Nacional Galapagos.
PARQUE NACIONAL GALÁPAGOS. (2012). PNG tourists statistics. Retrieved from http://www.galapagospark.org/onecol.php?page=turismo_estadisticas
PIANA, V. (2004). CONSUMER DECISION RULES FOR AGENT-BASED MODELS. Economics Web Institute. Retrieved from http://www.economicswebinstitute.org/essays/consumers.pdf
PLOG, S. (1974). Why destination areas rise and fall in popularity. Cornell Hotel and Restaurant Administration Quarterly, 14(4), 55–58. Retrieved from http://www.mendeley.com/research/destination-areas-rise-fall-popularity/ [doi:10.1177/001088047401400409]
TRUEMAN, M., Atkinson, R., Guézou, A., & Wurm, P. (2010). Residence time and human-mediated propagule pressure at work in the alien flora of Galapagos. Biological Invasions, 12(12), 3949–3960. [doi:10.1007/s10530-010-9822-8]
WATKINS, G., & Cruz, F. (2007). GALAPAGOS AT RISK A Socioeconomic Analysis. Charles Darwin Foundation, Puerto Ayora, Province of Galapagos, Ecuador, (May).
WORLD TOURISM ORGANIZATION. (2006). Tourism Market Trends World Overview & Tourism Topics.
YIN, L. (2007). Assessing Indirect Spatial Effects of Mountain Tourism De-velopment: an Application of Agent-based Spatial Modeling. Tourism and Regional Science, 37(3), 257–265. Retrieved from http://jrap-journal.org/pastvolumes/2000/v37/F37-3-8.pdf
Appendix A: Data Tables
-
Table 2: Parameters defining the archipelago graph. Islands marked with an "h" are entrance hubs to the archipelago. * Data from field surveys Connection Price (USD)* Time (hours)* Santa Cruzh - San Cristobalh 30 2.5 Santa Cruzh - Isabela 30 2.5 Santa Cruzh - Floreana 30 2.5 Table 3: Number of touristic attractions associated with the Archipelago's Islands and their cruises. *Data from Galapagos National Park Island Number of touristic attractions* Santa Cruz 17 San Cristobal 12 Isabela 16 Floreana 7 Cruises 18 Table 4: First part of the tourist agent's state variables 1 the values reported in this table must be decreased by $560.00 (USD) for foreign tourist and by $366.00 (USD) for Ecuadorian tourists 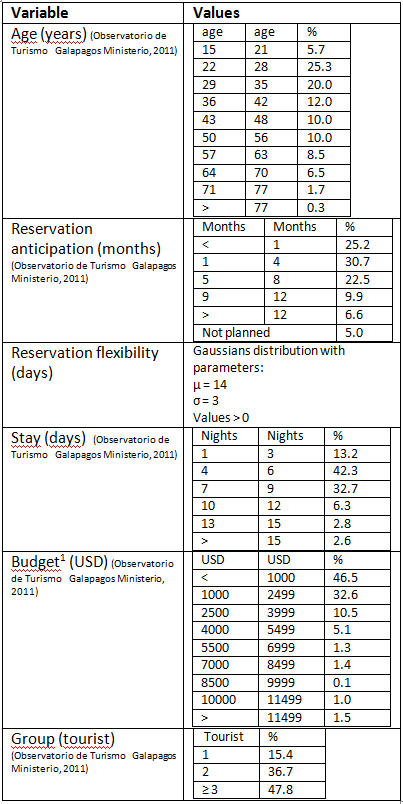
Table 5: Values of the five dimensions of the tourist agent's character state variable 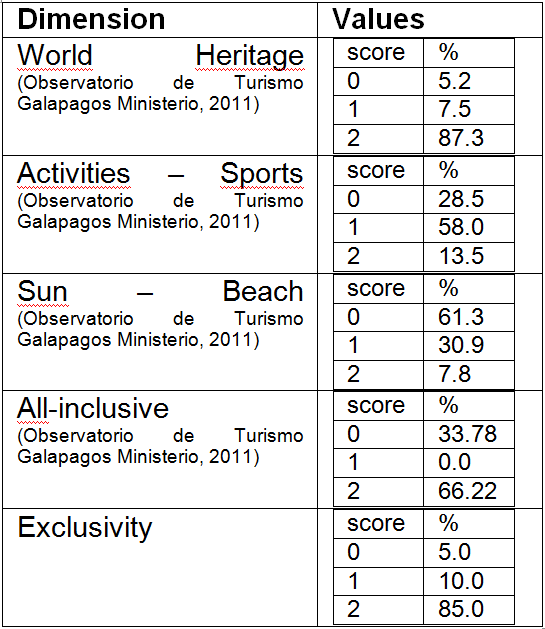
Table 6: The five dimensions of the accommodation offers feature state variable 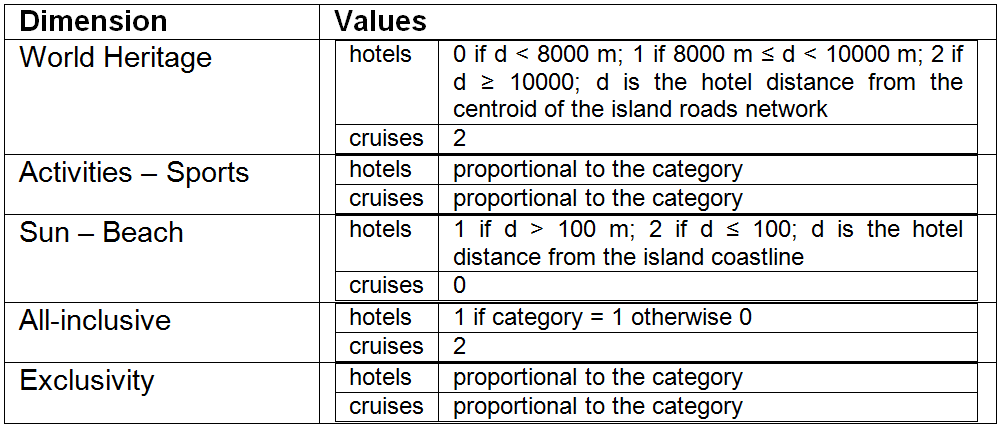
Table 7: State variables of the market operator agent 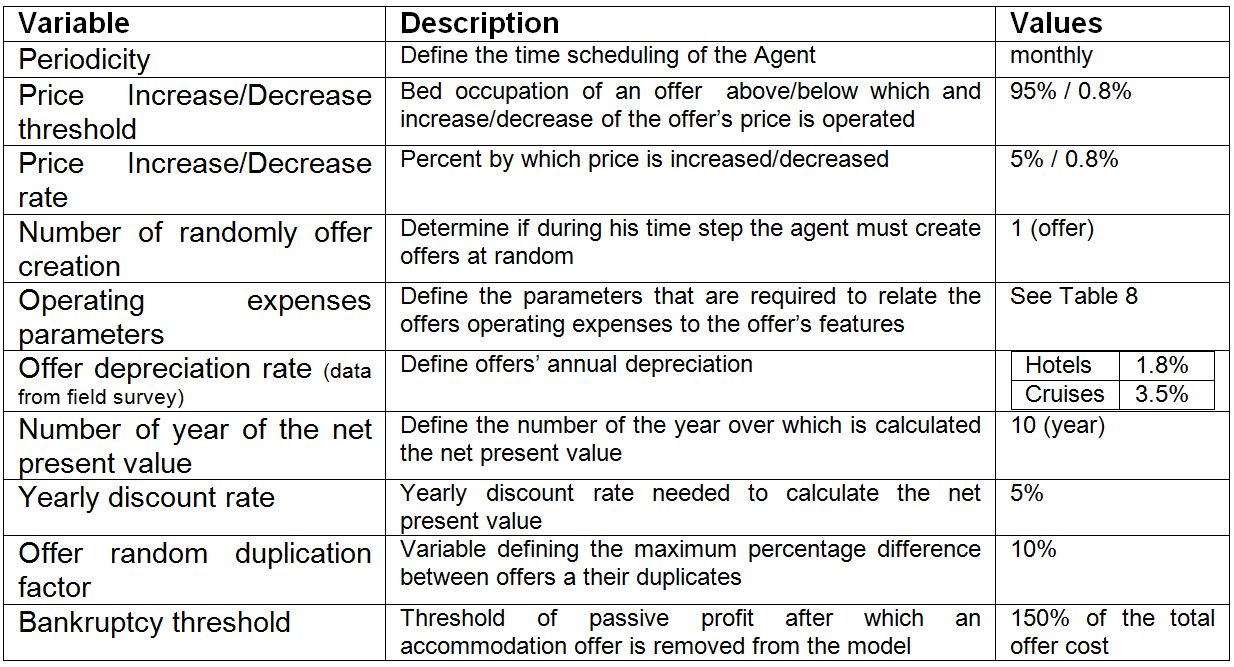
Table 8: Investment costs parameters for Hotels. Data from field survey Category AB (m2) Pm2 (USD) α First 30 800 100 Second 23 700 50 Third 15 600 10 Fourth 8 400 0 Table 9: Investment costs parameters for Cruises. Data from field survey Category αI (USD) Luxury 156250 First 143750 Medium 131250 Economy 118750 Table 10: Operation expenses parameters for Hotels. Data from field survey 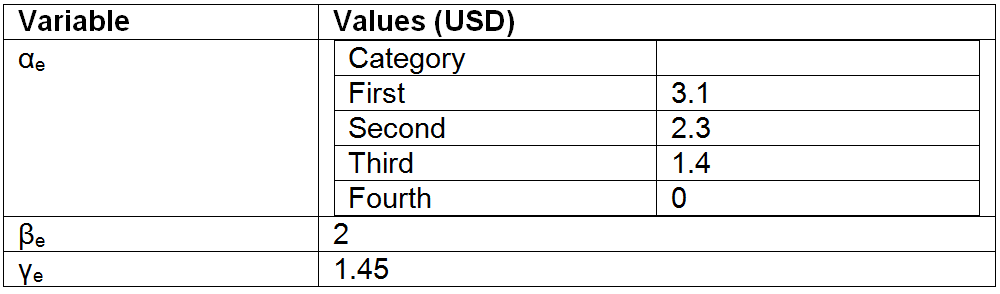
Table 11: Operation expenses parameters for Cruises. Data from field survey. 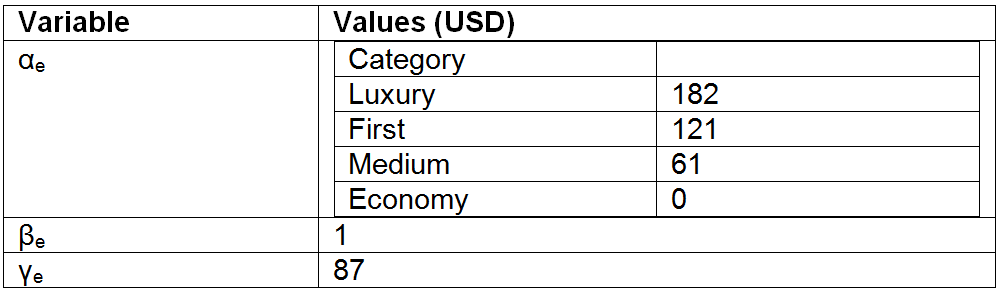 >
>Table 12: State variables of the tourist agent generator Variable Description Values Periodicity Define the time scheduling of the Agent daily Number tourist agents per year Define the number of tourist agent generated every simulation year 200000 (tourist) Number of budget class Define the number classes in which the generated tourist agents will be divided using tourist agent budget as criterion 7 Number of age classes Define the number classes in which the generated tourist agents will be divided using tourist agent age as criterion 3 Seasonal tuning Change the number of generated tourist agent depending on the month of the year From Galapagos National Park Statistics