
 Abstract
- To explore the space between the theories of the Diffusion of Innovations and Universal Darwinism, we first examine a case study of the history of the greenhouse horticulture sector of the Netherlands, comparing and contrasting the narrow focus of Diffusion of Innovations and the wider focus of Universal Darwinism. We then build an agent-based model using elements of both in order to test how well the Diffusion of Innovations theory holds up when some of its simplifications are removed. Results show that the single, simple pattern prominent in Diffusions of Innovations theory does emerge, but that it is only one of several patterns and that it does not behave precisely as expected. Results also show agent properties, such as stubbornness or innovativeness, can be surprisingly complex, as when stubbornness shows an advantage in the long term, while innovativeness was beneficial to the network but not to the innovator. While the Diffusion of Innovations theory is simple and can easily guide policy decisions, this paper shows that adding complexity to place diffusions inside a larger evolutionary context results in more realistic analysis and can help policy-makers to achieve challenging goals amidst modern economic and political challenges.
- Keywords:
- Universal Darwinism, Complex Adaptive Systems, Evolution, Greenhouse Horticulture, Innovation
Introduction
- 1.1
- The Westland area of the Netherlands is well known for its long-standing, innovative, technologically advanced and economically valuable greenhouse horticultural industry (Breukers et al. 2008). This unique region has a clear history of successfully diffusing cutting edge, but fuel-intensive, innovations such as heating, lighting, aeration, irrigation, transport, fertilizers and machinery (Verbong & Geels 2007; Tomczak 2005; Walsingham et al. 1976; Heichel 1976).
- 1.2
- Those early successful technology diffusions required no management, supervision or control. Nevertheless, authorities are eager to initiate and manage diffusions of environmentally friendly innovations in industries such as horticulture using the theory of the Diffusion of Innovations (DoI) (Verbong & Geels 2007). So far, there has been limited success. For example, innovations that maintain high-yield growing conditions with less energy use, such as heat/cold storage and deep-geothermal heat sources, are not widespread (Rybach & Sanner 2000), are not diffusing well despite high levels of interest (TNO 2010), and uptake in the Netherlands has not matched that of other countries (Lund & Freeston 2001).
- 1.3
- Meanwhile, other research suggests that industries and technologies are complex adaptive systems (CAS) (Newman 2003; Kauffman & Johnsen 1991; Holland 1996), defined by Holland (Waldorp 1992) as
"[...] a dynamic network of many agents (which may represent cells, species, individuals, firms, nations) acting in parallel, constantly acting and reacting to what the other agents are doing. The control of a complex adaptive systems tends to be highly dispersed and decentralised. If there is to be any coherent behaviour in the system, it has to arise from competition and cooperation among the agents themselves. The overall behaviour of the system is the result of a huge number of decisions made every moment by many individual agents."
The Dutch greenhouse horticulture industry matches this description quite well, suggesting that it must be evolving according to complex and diverse mechanisms for evolution (Chandler 2005; Kasmire et al. 2011; Kelly 2010; Fleming & Sorenson 2001) such as Universal Darwinism (UD). Thus, although the simplicity of a strategy based purely on DoI is appealing, it may be too reductionistic to be useful for managing a CAS (Kasmire et al. 2012). - 1.4
- Therefore this paper explores how DoI relates to UD in the context of a CAS, first through a historical case study of the Westland greenhouse horticulture industry and then in an agent-based model (ABM) of the same. We conclude that DoI and UD are closely inter-related, but focus on different patterns at different hierarchical levels of organization and that each has limitations. We also find that ABM is one useful tool to reduce these limitations, which policy makers can use to improve the management of industries and technologies.
The diffusion of innovations
- 1.5
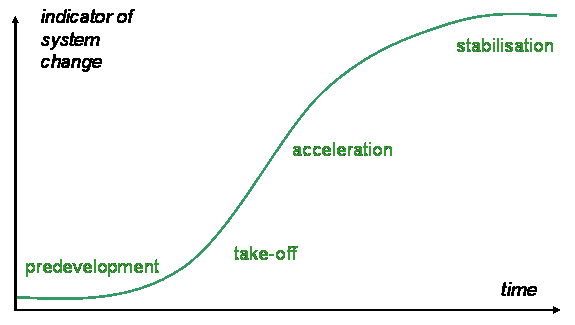
- Diffusion is a natural process of spreading that occurs in many circumstances, from the diffusion of heat to atoms to lexical items, and which displays an S-shaped curve or logistic function. This concept and the pattern of the logistic function were applied to observations of how individual innovations, such as new technologies, processes, or ideas, spread through populations of individual people, families, companies or governments, in what became the theory of the Diffusion of Innovations (Rogers 1995). Successful innovation diffusions are depicted as spreading like a virus, moving along the logistic function after starting with only a few individuals exposed to an innovation in the pre-development phase (see Figure 1). As these individuals become persuaded to adopt the innovation, the diffusion moves into the take-off phase. As the adopters share their experiences, they expose more potential adopters to the innovation, pushing the diffusion into the acceleration phase with an abrupt increase in adoptions, before plateauing in the stabilization phase as only a few potential adopters remain. Many factors have been observed to influence the success or speed of diffusions, such as social systems and norms, the amount of contact available during which information can be shared, the actions of opinion leaders and change agents, the nature of the innovation itself and the observable consequences of adoption (Rogers 1995).
- 1.6
- Models of DoI typically resemble the simple models used in epidemiology theory (Goldenberg et al. 2000) (Weisbuch & Stauffer 2000) (Abrahamson & Rosenkopf 1997) with information replacing germs and social contact in place of physical contact. These epidemiological models explicitly reduce complexity by focussing on a single pattern at a specific scale, population and level of organization. The objects of study in these models are usually high level, emergent behaviours related to the logistic function, such as the total level of adoption, the rate of adoptions, or the critical point after which further adoption becomes inevitable. Typically, these models have very simplified representations of the lower level interactions between individuals that determine the higher level pattern. For example, by examining one innovation at a time, the population is framed as 'has-adopted' or 'has-not-adopted', with no way to express how an innovation might affect adopters differently, how an adopter might use the innovation in unexpected ways, what different motivations might lead to adoption, or how adopters might later reject the innovation (Rogers 1995). Successful innovations are also defined as whatever collection of features has diffused successfully, even if the innovation and its features changed significantly during the diffusion. Thus, we can say that combined heat and power systems have diffused quite well (Verbong & Geels 2007) as long as we equate early examples with later ones, and one competitor's model with another, despite the many dissimilarities between them. The population is also simplified when it is represented as unchanging, which may work well enough for viruses spreading in a matter of weeks, but less so for technological diffusions which have time frames running to the decades. Further simplifications of epidemiological models of diffusion include treating sufficient exposure to an idea as leading to adoption (exactly as if it were contagious) even when that exposure can be in a negative context, ignoring the context of the predecessors, competitors or successors to an innovation, and ignoring the fact that diffusions are desirable while infections are best avoided.
- 1.7
- By restricting the focus to a single pattern, scale and level of hierarchical organization, DoI explains the observed logistic function quite clearly. The approach of focussing on single, simple patterns is also commonly found in the literature on related fields such as socio-technical transitions (Rotmans et al. 2001; Geels 2006) and Transition Management (Kasmire et al. 2012) and it makes these fields appealing as policy strategy tools (Stoneman & Diederen 1994; Shove & Walker 2007). Thus, if a policy goal is to increase the popularity of a particular innovation or strategy, project managers might stage an industry networking event because DoI shows that more highly connected networks are linked to faster adoption rates, or they might fund a demonstration project in public spaces because DoI suggests that observability reduces the barriers to adoption.
Universal Darwinism
- 1.8
- Evolution by natural selection (Darwin 1985) is the change in characteristics over generations as a result of the interaction of variation, selection and inheritance. Advantageous variations arise and then diffuse throughout a population, altering the evolving system in which they are embedded, and even altering the rules governing which variations can arise in the future or how well they might diffuse. An increasing number of scientists have applied an evolutionary framework to non-biological entities to describe and explain the observations of diversity and adaptive complexity in fields as far ranging as astrophysics, chemistry, complexity studies, anthropology, psychology and linguistics (Shennan 2002; Dennett 1996; Blackmore 2000; Kauffman & Johnsen 1991; Dawkins 2006), which we will call Universal Darwinism1 (UD). As a domain neutral, algorithmic process, UD is the idea that anything, anywhere, that displays variation, selection and inheritance could be evolving through natural selection, which necessarily involves diffusion processes.
Figure 2: A fitness landscape resulting from the co-variance of two parameters. Image courtesy of Pedersen, M.E.H, Wikimedia Commons, Public Domain (Pedersen 2010) 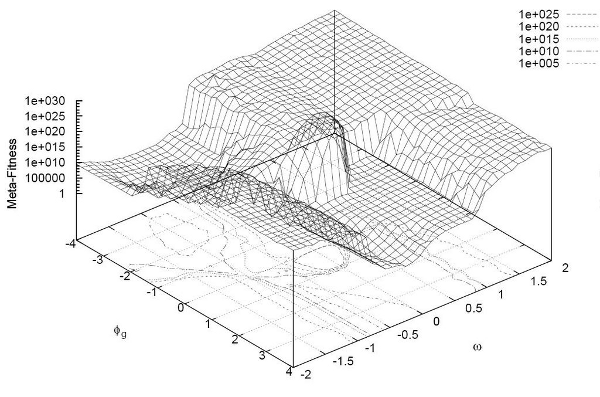
- 1.9
- UD usually examines the myriad complex interactions and contextual factors that lead to a difference in advantage for variations in particular circumstances and the effect of these differences on the rest of the system in the future. Thus, the object of study is not to find and study the patterns of individual successes or failures at a particular scale or level of focus, but to discern what happens in the entire system at multiple time scales. UD models are more complex those of DoI because they examine heterogeneous responses to multiple innovations (Tesfatsion 2006), feedback loops (Thierry 1990), structured and chaotic elements and processes (Brown & Eisenhardt 1997), competition and cooperation (Platt & Bever 2009), sensitivity to initial conditions and dynamic populations (Kirby 2001), among the many other ways that complexity can be introduced or represented. Perhaps the most commonly used image or graphic in UD is the fitness landscape (see Figure 2). Unlike the logistic curve, a fitness landscape must be a 3D graph to portray the relationship between two continuous variables. A higher point in the landscape represents a more advantageous meta-fitness, which means a better balance between the advantage of each individual variable φ and ω. Interestingly, an increase in the fitness of either individual variable does not necessarily correspond to a higher meta-fitness, and there can be sudden changes in meta-fitness from small changes in φ or ω just as there can be flat regions of meta-fitness covering wide ranges of φ and ω. Although UD studies many relationships and factors, representing an entire CAS would require many separate fitness landscapes, one for the relationship of every two factors of interest. This multitude of 3D representations means it is difficult, if not impossible, to see clear, overall patterns.
- 1.10
- Any model of a CAS must display sufficient complexity (Ashby 1968) and must have the capacity to adapt and allow for generative, bottom up behaviour (Nikolic 2009). Models based on UD would meet these criteria, but even when simpler than the real-world system they model, the complexity makes them unintuitive, unclear, and difficult to interpret. Predictions derived from UD models must be very short term or vague because long term or detailed predictions of the future are not possible (Nikolic & Kasmire 2012) and there is no way to predict what path the system will follow (Cohen & Stewart 2000). Consequently, policies based on complex or evolutionary theories recommend frequently readjusting goals (Rotmans et al. 2001) without aiming to control or predict the future with them (Kemp et al. 2007).
Problem definition
- 1.11
- The two theories are clearly related, and may even be two sides of the same coin, but both are problematic as the basis for policy making or strategy planning. According to Grimm et al. (2005)
Finding the optimal level of resolution in a bottom-up model's structure is a fundamental problem. If a model is too simple, it neglects essential mechanisms of the real system, limiting its potential to provide understanding and testable predictions regarding the problem it addresses. If a model is too complex, its analysis will be cumbersome and likely to get bogged down in detail. We need a way to find an optimal zone of model complexity, the 'Medawar zone'.
. - 1.12
- We see that DoI falls on the too-simple side of the Medewar zone because it cannot account for why sustainable technologies have diffused so poorly in Westland. Yet removing even a single simplification in a reductionist model leads to analytical difficulty and even intractability (Tesfatsion 2006), as is seen in the UD models that cannot offer clear explanations or useful predictions. This suggests that the Medawar zone is not easily found, but could be approached through the use of bottom up, agent-based models (ABM) and simulations in controlled in silico experiments to sift the noise from the signal and improve the analysis of complex systems. Although there are many possible approaches to modeling, an ABM appears to meet the needs of modeling CAS the best (Nikolic & Kasmire 2012) by maintaining sufficient complexity, with autonomous, boundedly rational agents that interact locally (Simon 1982) to generate emergent behaviour at multiple scales and levels of organizational hierarchy.
- 1.13
- The gap between theories corresponds to the tricky Medawar zone and is the problem we want to address. We first look at a case study of the evolution of the greenhouse horticulture sector of the Westland, in the Netherlands, highlighting those elements that distinguish the perspectives of DoI and UD. We then examine the results of a survey with Westland greenhouse growers that seeks to determine how well the assumptions and expectations of DoI match their experiences. The survey investigates their technological investment decisions, communicative behaviour, technology opinions, and the decision making process that underlies their innovation choices. We combine the insights of the case study with those of the survey to create an ABM of the greenhouse sector that straddles DoI and UD, which we use to compare and contrast the specific patterns of diffusion and the larger, slower patterns of evolution. We present the results of 2 sets of experiments, discussing how they compare to what might be expected from either a purely DoI and or a purely UD perspective. We also discuss how advantageous the different decision making behaviours of growers are for the individual growers and for the entire sector under various experimental parameters, with some counter-intuitive and challenging results. Finally, we conclude with a look at how the case study, the surveys, and the ABM provide insight into the relationship between DoI and UD, and what this might mean for the future of the industry and policy making in general.
Case study: Greenhouses in Westland
- 2.1
- Horticulture is an intensive form of agriculture that increases the carrying capacity of a region through technological enhancement (Dewar 1984) and is usually associated with a greater size and density of the nearby population, population growth (Vasey 2002; Boserup 2005; Malthus 1959), and a greater potential for environmental degradation (Vasey 2002; Dewar 1984; Nikolic & Kasmire 2012). Unsurprisingly, greenhouse horticulture is common in those regions of the Netherlands, including the Westland, that surround the large population centres (Breukers et al. 2008) while the regions with open field agriculture or grassland animal cultivation have have smaller population centres and lower density (Vos 1992; Pinckaers 2005). CAS theory would suggest that population growth and innovation are linked by reflexive downward causation so that large and dense populations drive innovation (Johnson 2010) while innovations release the
pressures that check population growth, both being the cause and effect of themselves and each other (Kim 1999). Thus, no agriculture or horticulture innovations are free from the influence of the regions in which they developed, the population that they support or enable to expand, or the human interactions that enable them to spread.
- 2.2
- Greenhouses horticulture began with various techniques documented as early as fifth-century BC Greece (Hix 1996) to protect delicate plant species or to extend the fruiting or flowering season of popular plants, such as adding or maintaining heat in the soil or air around the plants, to protecting plants with insulating materials, and moving containers of plants in and out of protected spaces to maximize light and minimize exposure. Later references describe year-round or non-native production of flowers and vegetables for the delight of Roman emperors, medieval royalty and wealthy aristocrats (Van Den Muijzenberg 1980). The techniques may have been widely known or discussed, but only the wealthy could afford the time, energy and resources needed for such intensive cultivation, meaning that greenhouses were built as status symbols. To better advertise wealth or education, greenhouse owners preferred diverse and extensive plant collections, and they competed among themselves to have the most and best exotic specimens (Van Den Muijzenberg 1980) by experimenting with greenhouse construction, orientation, heating, aeration, and even multiple greenhouses, each geared to the specific needs of exotic species (Hix 1996; Van Den Muijzenberg 1980). The many innovations resulting from this status competition diffused through academic horticultural societies, journals, books, the seeking out and hiring of experienced personnel, and personal communications between owners, architects and gardeners (Hix 1996). Although innovations spread, many required materials, space, fuel, or expertise that was prohibitively expensive or simply unobtainable.
- 2.3
- Some of the more basic and generalized techniques, documented as far back as pre-destruction Pompeii (Hix 1996), were effective and inexpensive. These started to be used in commercial horticulture where population density warranted the extra investments, and thus began to diffuse outside of the status competition of the wealthy. For centuries the Westland, at 52 degrees latitude, had produced grapes, grown in open fields against a south-facing wall, which regulated the temperature and allowed cultivation much further north than typical grape production (Kampp 1937). Following the Industrial Revolution, factors which are not related in a straightforward or obvious way, such as the repeal of the glass tax in the UK, tent designs developed in the Crimean War, and advances in material production (Hix 1996), as well as the concurrent rapid rise in population density (Davis 1966), contributed to making greenhouse horticulture widely available and commercially viable.
- 2.4
- Around 1850, sloping frames quickly diffused throughout the Westland where they initially protected the grapes already growing against walls. By 1880 the the sloping frames had already been supplanted by enclosed forcing frames without a south facing wall, eventually to be replaced yet again by full sized, free standing greenhouses with furnace-based heating systems (Kampp 1937) which not only protected plants, but created entire artificial growing climates.
- 2.5
- Growers and technicians now took control from academics and aristocrats, bringing a focus on quantity and production that was lacking in the non-commercial origins (Van Den Muijzenberg 1980). Consequently, specialization and mechanization have since increased productivity three-fold (Hoefsloot & van Reeven 2010). Now 42% of all vegetable greenhouses in the Netherlands grow only tomatoes, followed by 30% cucumbers, 22% peppers and only 6% producing some other vegetable, and considerable resources must be invested in crop-specific technologies (Breukers et al. 2008), making it difficult to compete in markets for other crops (Germing 1975). In the near future, greenhouses may have to innovate again (Poppe & Van Meijl 2004) in order to compete with the burgeoning horticulture sectors in developing countries.
- 2.6
- As part of this rapid rise in specialization and mechanization, the totally climate controlled Venlo Greenhouse diffused through the whole of the Westland in only a matter of decades (Geels 2002) , along with the individual component innovations in artificial heat and light, watering systems, new crop types, disease control techniques and CO2 enrichment. Consequently, the region became a hotbed of DoI studies that appear to suffer from a confirmation bias, so that typical DoI factors, such as the flows of information, expertise and knowledge along networks of growers, (Buurma & Ruijs 2011; Pannekoek et al. 2005) are found to be present and influential, but factors not typical of DoI, such as government policy (Verbong & Geels 2007; Hix 1996), development in non-agricultural fields such as international communications, materials sciences or folding tent design (Hix 1996), or population growth and the increased pressure on food production (Vasey 2002; Boserup 2005; Malthus 1959) were not often considered.
- 2.7
- The same history of greenhouses can also be understood from a UD perspective to include the changes in technology, user practices and culture, governance, networks, structures, and populations (Verbong & Geels 2007; Geels 2002; Nelson & Winter 1982) so that innovation diffusions are not isolated waves of adoption, but the visible emergence of subtle, complex and conflicting pressures in a CAS. A UD framework would look at competition between innovations, as well as at other interactions such as incorporating elements of unrelated industrial improvements, that helped make greenhouses affordable and accessible and then would look at how the affordability and accessibility resulted in further competition and innovation. UD approaches provide an exploration of the industry as a result of the innovation diffusions, rather than an explanation of any given diffusion, but in so doing lose sight of specific or subtle influences among the thousands, even millions, of seemingly insignificant interactions. This level of focus also limits the ability to make specific policy recommendations or to set specific goals.
- 2.8
- The case study shows that both DoI and UD can explain how a past diffusion happened as it did, either by zooming in so as to chop off as much complexity as possible but losing perspective, or by keeping a wider perspective that makes it hard to see some relevant aspects amidst the overwhelming presence of detail and complexity. Neither approach provides a good explanation of why things have evolved as they have (Cohen & Stewart 2000) or enables good industrial technology management or the prediction of future evolutionary paths. However, ABM may improve the balance between the two extremes by gaining clarity from complex systems, and we detail our efforts to do so in the next section.
Model motivation and design
- 3.1
- We wanted to use this model to push into the Medewar zone created by the gap between the DoI and UD theories. More specifically, we wanted to test how robust the simple patterns and perspectives of DoI are when applied to industries like the greenhouse horticultural sector. The simple patterns could be a consequence of the limited scope and scale of DoI, or they could be relevant and present in more complex and dynamic situations. For example, do S-shaped patterns of diffusion arise when competition is not artificially limited to two alternatives, or when positive as well as negative feedback is shared, and do populations converge on one technology when multiple innovations compete? As for the simple perspectives, we wanted to investigate whether DoI's wholly positive view of innovativeness, communication links, and other individual characteristics matched the experiences of real-world greenhouse growers, or whether these traits can interact such that they might also have negative consequences.
- 3.2
- We devised a survey of real-life greenhouse growers in the Westland. The survey including factors that DoI traditionally finds to be most important as well as factors not commonly found in DoI literature, with opportunities for the growers to write in additional issues that they considered most important. We then devised an ABM of a horticulture sector, beginning with a simple, epidemiology style of model used in DoI, to which we added several complex factors as motivated by the survey results. Crucially, the added complexity entailed boundedly rational agents who had to decide between competing innovations, in a context of dynamic populations, and with constantly changing information flows. We describe the results of the surveys here, as well as the details of the ABM design.
Survey results
- 3.3
- Our survey asked greenhouse growers how they make innovation adoption decisions. The survey asked about classic DoI concepts, such as attitude toward risk and comparisons between information sources, as well as concepts not typical of DoI, such as the personal objectives of growers and decision making rules. The survey results support some aspects of DoI, but disagree with others, which reflects the role of DoI as one part of a larger evolutionary framework. With only 7 respondents, we were unable to perform statistical tests. However discussions with greenhouse grower associations, a local organization for horticultural engineering and development (http://www.tto.nu), personal communications with growers who did not take the survey, and other ongoing research in the horticultural industry indicates that these responses are typical and the results are coherent with expectations of the sector. Therefore, we have used them to inform the ABM design, and summarize the most relevant results here. 2
Adopter characteristics
- 3.4
- DoI says that adopter characteristics, like risk attitude and innovativeness, influence how early an innovation is adopted. Table 2 shows that the growers almost unanimously agreed that these characteristics influence the timing of technology investment decisions for other growers, but very few reported them as influential on their own technology acquisitions. Instead, externally imposed factors, such as regulation, competition and technological depreciation or breakdown were more commonly reported than internal factors such as innovativeness or attitude to risk.
Table 2: Multiple answers were possible to these questions. Each number represents the total number of respondents who indicated that these adopter characteristics influenced technology adoption decisions. Why some growers adopt earlier Why I adopt new technologies Level of innovativeness 7 Regulations 3 Risk attitude 6 Financial need 3 Skills or knowledge 1 Technology depreciation 3 Importance of sustainability 1 Technology breakdown 2 No differences 0 New technology available 2 Advantageous technology available 1 Improved returns 1
Economic, technological and other characteristics
- 3.5
- Economic and technical characteristics of the innovation such as cost, expected return on investment, fit with existing technologies, observability, possibility of trying the technology on a small scale, etc. are commonly understood to influence the speed and total penetration of a diffusion in DoI. The surveyed growers report that they might take these into consideration when investing in new technologies (see Table 3. However, only the influence on quality, the influence on quantity, and the operational costs stood out as being influential factors for (nearly) all growers, with investment and maintenance costs reported as important for some growers. Interestingly, innovation characteristics like observability or small scale trial-ability were reported as considerations in technology decisions for only 1 or 2 growers, despite the DoI finding that these are highly influential.
- 3.6
- DoI typically regards potential adopters as having uniform or equivalent motivations for adoption. When we asked the growers about their main and secondary business motivations, as well as the company characteristics that influence their adoption decisions, we found that the motivations are not so simple. Although investment, operational, and maintenance costs were important to the growers (Table 3) their main motive is not maximising profit but maintaining continuity, followed by profit and product quality (Table 4) . They also report that the unique characteristics of the greenhouses themselves, primarily size followed by company assets but not crop type, are taken into consideration for technology investments. None of these company characteristics are typically included in DoI analyses.
Table 3: Multiple answers were possible to these questions. Each number represents the total number of respondents who indicated that these economic and technological characteristics influenced technology adoption decisions. Economic factors Technological factors Investment cost 4 Influence on quality 7 Operational cost 6 Influence on quantity 7 Maintenance cost 4 Fit with existing technologies 3 Depreciation period 3 Complexity 1 Return on investment 1 Observability 2 Small scale trial-ability 1 Increased job satisfaction 1
Table 4: A single answer was requested for main business motivation (one respondent gave four answers). The numbers for main business motive represent the most common motive driving business decisions. Multiple answers were possible for secondary business motives and greenhouse company characteristics. Each number for these columns represents the total number of respondents who indicate these factor to influence business decisions, including technology adoptions. Main business motivation Secondary business motivation Greenhouse characteristics Maximum Profit 1.25 Maximum Profit 5 Company assets 2 Continuity 4.25 Continuity 3 Size 4 Product quality 1.25 Product quality 4 Crop 0 Job satisfaction .25 Job satisfaction 0 Cost-effectiveness 1 Employment 0 Employment 0 Improvement 1
Sources of information
- 3.7
- Growers report using a wide variety of information sources, including the internet, specialist journals, farmer associations, and direct communication with other farmers. In accordance with DoI, they report that some sources of information are more influential than others because they are more complete or more correct (see Table 5). However, contrary to the DoI, the growers do not seem to see higher status information sources as more credible, with consultants ranking quite poorly for completeness of information and specialist journals and conferences not doing much better. Instead the growers report that their own experience is the most complete and correct, followed by the experiences of others that they know personally (especially the farmer associations).
Table 5: The respondents were asked to score each source for past use, correctness and completeness. These numbers represent the average score from all respondents. Information sources Used Correctness Completeness Specialist journals 6 6.8 5.8 Internet 7 7 6.7 Conference 1 7 6.4 Personal experience 4 9.3 9 Farmer associations 7 8.2 7.3 Family 2 7.3 8 Other farmers 5 7.2 6.5 Consultants 3 7 0
Rationality
- 3.8
- The growers are also aware of many details about their operations, such as current prices for crops and technologies, but also rely on estimations for many other details, such as expected production, predicted fuel prices, and weather forecasts that impact on energy consumption. Almost all growers said that it is not always possible to calculate the best choice for them (see Table 6) from a range of technologies, most frequently due to incomplete information, but sometimes due to incorrect or too complicated information. Only one grower replied that it is always possible to calculate optimal technologies.
Table 6: Multiple answers were possible when asked whether it was always possible to calculate the best technology to buy. To clarify which responses did or did not occur together, we show each grower's answers in separate rows. Is it always possible to calculate the optimal technology investment? No No No No Yes (Incomplete info) (Incorrect info) (Too complex) (Insufficient time) Grower 1 1 1 Grower 2 1 1 Grower 3 1 Grower 4 1 Grower 5 1 Grower 6 1 Grower 7 1 Total 4 2 2 0 1
- 3.9
- At the end of the survey, an open question asked the growers if they followed any clear decision-making rules or strategies for technology investment and adoption decisions. None were able to provide any such clear rules, and most of the responses referenced 'gut feelings'. Although they trust themselves to make such decisions, they do not have a clear idea of how they arrive at the decisions they have made, indicating that any rational decision making must be boundedly rational. DoI recognizes bounded rationality and stresses that the information flowing along the communicative networks will reach potential adopters at different times and in slightly different ways, but does not allow any interaction between the unique information received by adopters and any conflicting objectives when making adoption decisions.
Survey summary
- 3.10
- The results from the surveys broadly concur with DoI in that many factors influence whether an innovation is adopted, as well as which one and when. However, the survey also reveals that there is a disconnect between the factors that growers see as influential to the technology adoption decisions of other growers, like innovativeness, and the factors they see as most influential in their own decisions, like complying with regulation. The survey also reveals factors that are excluded, inaccurate or simplified in the DoI literature, such as the characteristics of the greenhouse company or the reasons to trust some information sources over others. Other factors common in DoI interpretations seem to be unnecessary for the greenhouse industry, such as the observability or small scale trial-ability of innovations. The net result is that, at least for these greenhouse growers, there is so much complexity that even the real-world actors most intimately involved in the sector have no clear idea of how they make adoption decisions, which determine diffusions, and which ultimately contribute to the evolution of the entire sector.
- 3.11
- While the simplifications of DoI can provide useful insight into some of the influences of specific diffusions, they fall short of describing the entire complex industrial sector. Therefore, we place DoI in the larger context of UD, where diffusions are emergent patterns that form in a complex interacting system. As ABM is a particularly useful tool to explore a CAS and the socio-technical evolution in these systems (Chappin 2011; Chappin & Dijkema In Press),we built an ABM that can be understood as several, simultaneous, competing diffusions in a moderately dynamic population. This gains realism from the added complexity and dynamics without losing the clarity and interpretability. For this simulation, the greenhouse horticulture industry was modelled in the free and open source NetLogo software(version 4.1.3) (Wilensky 1999).
Model design
- 3.12
- In this model3, agents represent greenhouse growers who run their greenhouses using three different categories of technologies that affect their crop production. At each turn they sell their crops, compare their profits, form opinions of technologies, share their opinions with their neighbours, and purchase new technologies as needed. If they continue to make poor technology purchases, they can go bankrupt and be reset. Although a single run cannot be interpreted as conclusive, repeated runs are able to tease apart the many influences to determine how competing diffusions behave and which factors alter the balance of this competition.
Agent description
- 3.13
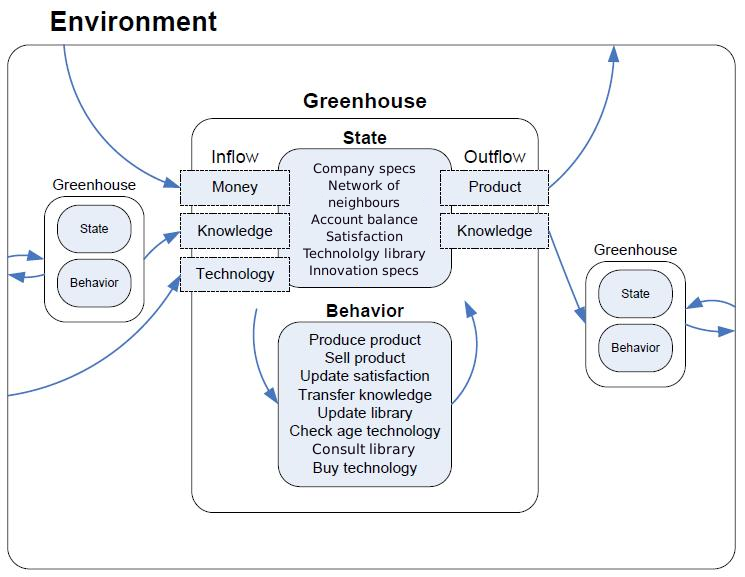
- The independently acting agents in this model each represent a greenhouse grower or a greenhouse business. A schematic overview of the model layout (see Figure 3) illustrates the state variables of the agents, as well as the behavioural steps per tick. The overview also shows how money, and new technologies flow into an agent from the environment while products flow out, as well as how knowledge flows into and out of each agent through the connections between agents.
- 3.14
- Internal to each agent are several state variables which are set during the initialization of the model. The first of these state variables, the company specs, describes the surface area and crop type of the agent which cannot change during the course of the simulation. The surface area can range from 1 to 25 to represent the number of hectares under glass or the growing capacity of the greenhouse, and the sizes are distributed according to a power law so as to roughly match the real world distribution of greenhouse sizes in the Westland. The crop type designation determines whether the agent grows vegetables or flowers to reflect the crop specialization of modern greenhouse growers.
- 3.15
- All agents begin the simulation with the same account balance and they all receive a selection of technologies. There are three technology categories, loosely meant to represent the technological systems in modern greenhouses such as heating, irrigation, or lighting systems, and each agent receives one random technology in each category.
- 3.16
- Each agent also receives a technology library and a satisfaction state variable. These both begin as totally blank but are used to record opinions of the various technologies encountered during the simulation. The satisfaction records the opinion an agent has of his own technologies and is rewritten each turn, while the technology library incorporates the satisfaction of the agent as well as opinions shared through the communicative network and accumulates over the entire simulation.
- 3.17
- The network of neighbours is determined by two things. First, each agent is connected to other agents in a network, also according to a power law distribution as an approximation for the way real human social networks are connected (Newman 2003). Then, a variable for degree of neighbours determines whether each agent's set of neighbours contains only the directly linked agents or also contains agents connected more distantly (the neighbours' neighbours).
- 3.18
- Finally, the agents all have innovator specs. Of these, the stubbornness quotient describes how their own satisfaction is weighted against information from other agents as they build their technology libraries each turn. This stubbornness quotient is not directly based on any theory of decision making, but reflects the results of the survey where growers expressed the most trust in their own experience, followed by some trust in the experiences of other growers. Thus, if an agent and his neighbour have exactly the same arrangement of technologies but have different satisfactions as a consequence of a difference in crop type or greenhouse size, a high stubbornness quotient ensures that each grower's final opinion as recorded in his technology library will more closely match his own satisfaction than that of his neighbour. The agents also have an opinion change rate which controls how new information (both from his own satisfaction as well as knowledge from neighbours) is weighted when added to the opinions already recorded in the technology library each turn. A higher opinion change rate means that agents could dramatically swing from approval to disapproval, or vice versa, after only a few ticks while a slower change rate means that the agents would require consistent feedback on a given technology in order to change their opinion of it. The final innovator spec is the innovativeness quotient which describes how often that agent will disregard the rules governing his normal decision making and instead make an innovative technology purchase. A higher innovativeness quotient means that the agent will make an innovative purchase more often.
- 3.19
- All agents have identical stubbornness quotients and opinion change rates, but if the innovator probability is set above 0, then that percentage of agents will be designated as innovators. These agents represent the early adopters described in DoI literature (Rogers 1995). Those agents designated as innovators will all have the same innovativeness quotient which can be set as high as 1. An innovativeness quotient of .2 would mean that agents usually follow the normal purchasing rules, but in one out of five purchasing decisions, would ignore their technology libraries and purchase an unknown technology.
- 3.20
- In addition to the state variables, each agent has a set of behaviours including producing and selling crops, updating the satisfaction, sharing knowledge with neighbours, updating the technology library, and checking the ages of the technologies that they own. These behaviours are performed every tick, and the behaviours associated with purchasing new technologies, should any of their current technologies need to be replaced, are performed as needed.
Crop and technology descriptions
- 3.21
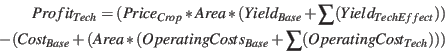
- Crops are produced each tick and the entire yield is multiplied by the crop selling price before subtracting the production costs to find the profit (see Equation 1). Both crop types have unique values for the crop price, basic yield, basic costs, and basic operating costs (operating costs are multiplied by the surface area). These values are set by the modeller, do not change throughout the simulation and determine the best possible yield and profit if there were no technologies used at all. These values are meant to reflect differences between flower and vegetable production. Vegetables have a higher basic production function, but flowers have a higher selling price and the base costs for vegetables is higher than for flowers, but the base operating costs for flowers are higher than for vegetables.
- 3.22
- The crop designations are assigned randomly to agents when the simulation is initialized and cannot be changed during an agent's lifetime. However, if an agent runs a deficit for too long by spending more on operating the greenhouse or technology investment than he brings in through crop sales, he will run out of credit and be declared bankrupt. Bankrupted agents are re-initialized, and receive a new credit balance, a cleared satisfaction and technology library, a new selection of random technologies, and a new random crop designation.
- 3.23
- Technology purchases are the only way agents can affect their production output and profits. Technologies have an operating cost (multiplied by the surface area) and an effect on yield that interacts with the basic yield to alter the amount of crops produced (see Equation 2). The effect on yield for each technology is different for both crop types and can be large or small, positive or negative. Thus, some technologies will increase a vegetable yield but decrease a flower yield, or vice versa, and some will have a large effect on yield while others are negligible. Each technology also has a fixed purchase price and maximum lifespan as well as a current age, which advances at each time step after purchase. The technologies each belong to one of three categories, meant to loosely mimic heating, lighting and irrigation systems in greenhouses. Agents always have exactly one technology from each category at any one time in the simulation. One technology from each category represents the optimum for at least one crop, so that the optimal heater for vegetables may or may not be the same technology as the optimal heater for flowers. All non-optimal technologies cost more to operate or produce fewer crops. If a flower grower has all three optimal flower technologies, he will be more profitable than a vegetable grower of the same size who has all three optimal vegetable technologies, but for most technology combinations with at least one non-optimal technology, vegetables are more profitable. 4
Detailed model narrative
- 3.24
- At each time step, the agents calculate their profits from the previous time step and update their satisfaction according to how their profits compare to their neighbours. If an agent is more profitable than all of his neighbours he sets his satisfaction at 1, but if he is the less profitable than all his neighbours, he sets it to -1. All the other possibilities fall proportionally in between 1 and -1. All three of the currently owned technologies share the satisfaction regardless of the actual contribution of each technology toward the profit. Agents do not have access to the yield, costs, or effect on production that determine their profits so cannot know whether a poor relative profit is due to lower than optimal production or excessive costs. After updating their satisfaction, the agents examine the technologies owned by their neighbours looking for unknown technologies, which they add to their technology library with a blank opinion. Then, the agents incorporate their own satisfaction and the neighbours' opinions into their technology libraries according to the stubbornness quotient and opinion change rate, filling in any blank opinions from previously unknown technologies and altering the cumulative opinions of the known technologies.
- 3.25
- Finally, each technology currently owned increases its current age by one. If one of the currently owned technologies has a current age equal to its maximum lifespan, the owner will replace it by purchasing a technology from the same technology category. Agents do not have access to the purchase price, operating costs, effect on crop production, or maximum lifespan of the technologies, so cannot take these features into account when making a technology purchase. Instead they will attempt to purchase the technology that has the highest opinion rating in their technology library. If they do not have enough credit to do so, they will purchase the technology with the highest opinion rating that they can afford. They do not seek to directly maximise profit when investing in technology as they have no way to calculate what effect a given technology will have on their own profit. They are totally motivated by their accumulated opinion ratings when making technology investment decisions, and these opinion ratings are formed by the relative profits of many agents with many different size, technology, and crop combinations. Thus, the agents are profit-maximisers in a round-about, distorted way. The only exception to the rule that they will purchase the technology with the highest opinion rating and that they can afford is if the agent is an innovator. Innovators behave as do other agents except with a small probability that, when prompted to purchase a technology, rather than consult their technology library they will purchase a completely unknown technology. As there are a limited number of technologies, after an innovator becomes aware of all available technologies, he will behave identically to non-innovator agents.
Modelling assumptions
- 3.26
- A few assumptions need to be clarified to further understand the model behaviour. In order to simplify the complex reality of greenhouse operation, the different actions of the agents all happen once per time step, meant to represent one year. Agents uniformly obey the budget restrictions set at model initialization, which determines how much of their remaining credit can be spent on a single technology. All prices in this model are set in the code and do not change throughout the simulation so there are are no market effects, neither for the crops produced nor the technologies available for purchase. While it is clearly unrealistic to assume that there is a willing purchaser for all products at an average price, the inclusion of market effects falls outside the scope of this model, would have made interpreting the model much more difficult, and might have pushed the model out the other side of the Medewar zone. Future versions could benefit from adding market effects to see how they alter the dynamics.
- 3.27
- The satisfaction each agent records is spread across all three currently owned technologies. Thus, if an agent is profitable compared to his neighbours, the high satisfaction he records will translate into an increased opinion for all three technologies when he updates his technology library, even if one or more of the current technologies is non-optimal or deleterious. This is not realistic as growers can be very happy with some aspects of their operation and unhappy with others. But the model does reflect that when technologies are used together, the individual contribution of each can be obscured. Meanwhile, since the technologies have different lifespans and are replaced at different times, the changes in performance will translate to changes in satisfaction that reflect the new selection. Thus, if a poor performing technology is replaced, the co-owned technologies could get a satisfaction that better matches their actual contribution, and vice versa.
- 3.28
- Agents do not have information about the basic production functions of the crops, the effect on production from each technology, nor the technology costs, and so cannot calculate optimal technology investments. Real-life growers have access to some of this kind of information, such as the current cost for a given technology or their best crop output in the past, but the survey revealed that many growers find that they are unable to calculate with any certainty which technology option is best for them for a variety of reasons. Instead they must make decisions based on partial, distorted, anecdotal, and subjective information. In this model, the agents are deliberately ignorant of the details to represent the real-world grower's inability to be certain.
- 3.29
- The technologies available remain constant and are distributed randomly to newly initialized agents, at the start of the simulation and after a bankruptcy. The agents assigned better performing technologies act as a source of the diffusion process, rather than advanced technologies being fed into the model in order to provoke a diffusion. Physical distance is not explicitly modelled, as the transfer of information is expected to be unaffected by physical distance within the region. This would appear to be realistic as growers report being well connected through wide ranging grower associations, online forums, and even having each others' mobile numbers handy. Further, the power law distribution of network connections suggests that scaling up to a larger area would not affect the network behaviour.
- 3.30
- When an agent is unprofitable and runs out of credit, it will be reinitialized, with newly randomized technologies, cleared satisfaction and technology libraries, a renewed credit balance and a fifty percent chance of being reinitialized with a different crop designation. This is meant to reflect that greenhouse growers have history, experience and investments in growing a single crop as competitively as possible and are not often able produce anything else, while a newly acquired greenhouse can change production if the new owner has a different focus, experience and range of technology investments. However, the surface area and network connections do not change after a bankruptcy to reflect that space is at a premium in the Westland, and growers cannot easily or freely expand. Thus, total greenhouse growing capacity does not change during the simulation, and bankrupted greenhouses are assumed to be sold as a unit to a new grower who cannot change the size of the greenhouse or the neighbours.
Experimental set up and results
- 4.1
- The experiments were conducted in two parts. The first sought to isolate and explore the diffusion and evolution behaviours of the model by averaging the results of 100 repetitions at fixed parameter settings. The same basic parameter settings, although with more agents, were then allowed to run to 2500 ticks (results averaged over 30 repetitions) to observe whether convergence on the best technologies was possible in a very long run. The settings chosen for these experiments (see Table 7) are based on the survey results, DoI literature, and calculations of model interactions. For example, the survey suggested that greenhouse growers valued their own experience very highly when forming opinions, so the stubbornness quotient was set to weight personal experience at .75 and opinions received from others at .25, the innovator probability was set at 2.5% in accordance with Rogers (1995) on the prevalence of innovators in society, and the opinion change rate was set to .20 so that an opinion could not change completely in one tick, but would require several ticks of consistent influence in order to completely change.
- 4.2
- The second part of experimentation tested the relationships between varying agent and network characteristics on the basic behaviours observed in part 1. Latin Hypercube Sampling was used to generate a distribution of points in the parameter space, and the results of multiple runs at these points were averaged. Even with Latin Hypercube Sampling, the number of experiments grows very rapidly with the number of parameters varied, so only those parameters of most interest were used (see Table 8). Other parameters, such as the number of agents, the budget (the proportion of remaining credit that can be spent on a technology purchase) or the innovativeness (the probability that an innovative agent would ignore his opinion tables and take a risk), were held constant to limit the number of experiments run.
Table 7: Parameter settings for the experiments in Part 1 Part 1 Isolate processes Test convergence Ticks 250 2500 Repetitions 100 30 Number of companies 50 100 Budget .33 .33 Degree of neighbours 1 1 Innovator probability 2.5% 2.5% Innovativeness .20 .20 Stubbornness quotient .75 .75 Opinion change rate .2 .2
Table 8: Parameter settings for the experiments in Part 2 Part 2 Parameter sweep 1 Parameter sweep 2 Ticks 500 500 Repetitions 30 15 Number of companies 100 100 Budget .33 .33 Degree of neighbours 1 1, 2, 3 Innovator probability 0% - 20% by 2% increments 2.5% Innovativeness .20 .20 Stubbornness quotient .5 - .99 by .05 increments .75 Opinion change rate .2 0 - 1 by .04 increments LHS pairs 20 sample pairs (10/variable) 25 sample pair
Part 1 results and discussion
- 4.3
- The first experiments focus on the flow of information through the network of agents. The model was designed to capture all the relevant details of modern greenhouse operation that lead to decisions to adopt a technology, but unlike classic DoI studies, agents had to choose between several available technologies, information could be positive or negative, and agents can abandon a previous adoption in favour of another. There is no single optimal arrangement and every agent has access to different information. Each agent must find a unique way to diversify, adapt, try new things, and take risks, which keeps the entire competitive field, available information, and agent behaviours in constant flux. Although individual agents obey simple rules, the entire system does not behave simply. Some innovations diffused according to the predictions of DoI, but not all of them. It was not always possible to predict which ones would diffuse well or exactly how well individual technologies would diffuse.
- 4.4
- In the long term, the better performing technologies generally followed the pattern of logistic growth, or S-shaped curve, as predicted by DoI. Although inverted, this S-curve is most clearly seen in Figure 4 which shows the total number of agents owning each technology on the Y axis and the time steps on the X. At the beginning, the technologies are evenly distributed but over time technology 7 gains quickly, before levelling off and remaining roughly steady at about 80% of all growers. Technology 3 is the next most popular, but sees an initial decline before regaining some adopters. Thus, this technology also has an S-curve, although flatter and with the growth phase delayed when compared to the S-curve for technology 7. All other technologies appear to decline with no gains at all, meaning that they do not show any S-curve.
Figure 4: Agent ownership of technology category 1, for both crop types. Logistic growth is visible for those technologies that, after an initial even distribution, show a rapid increase in the number of agents using that technology before levelling off at about 300 ticks. The model does not converge on one technology per category, even at 2500 ticks. 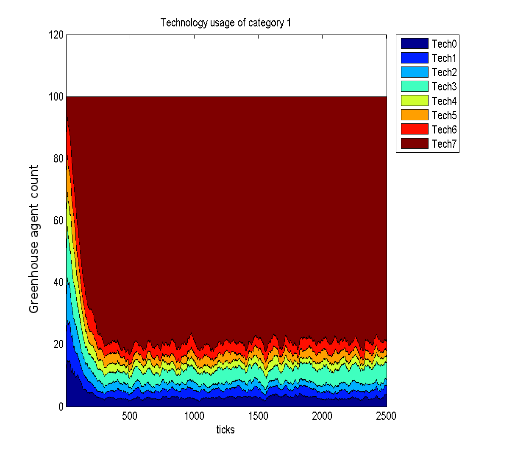
- 4.5
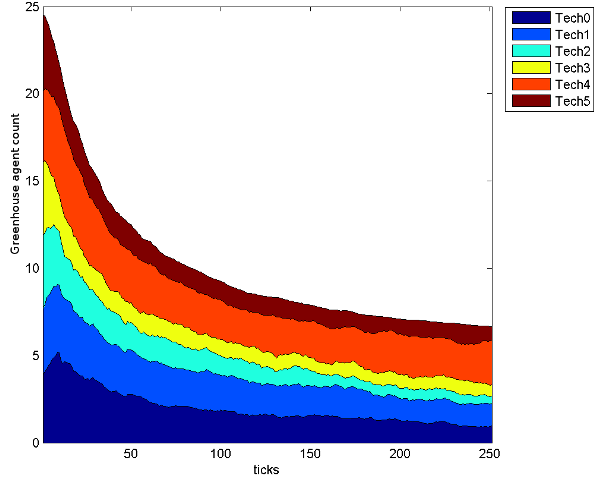
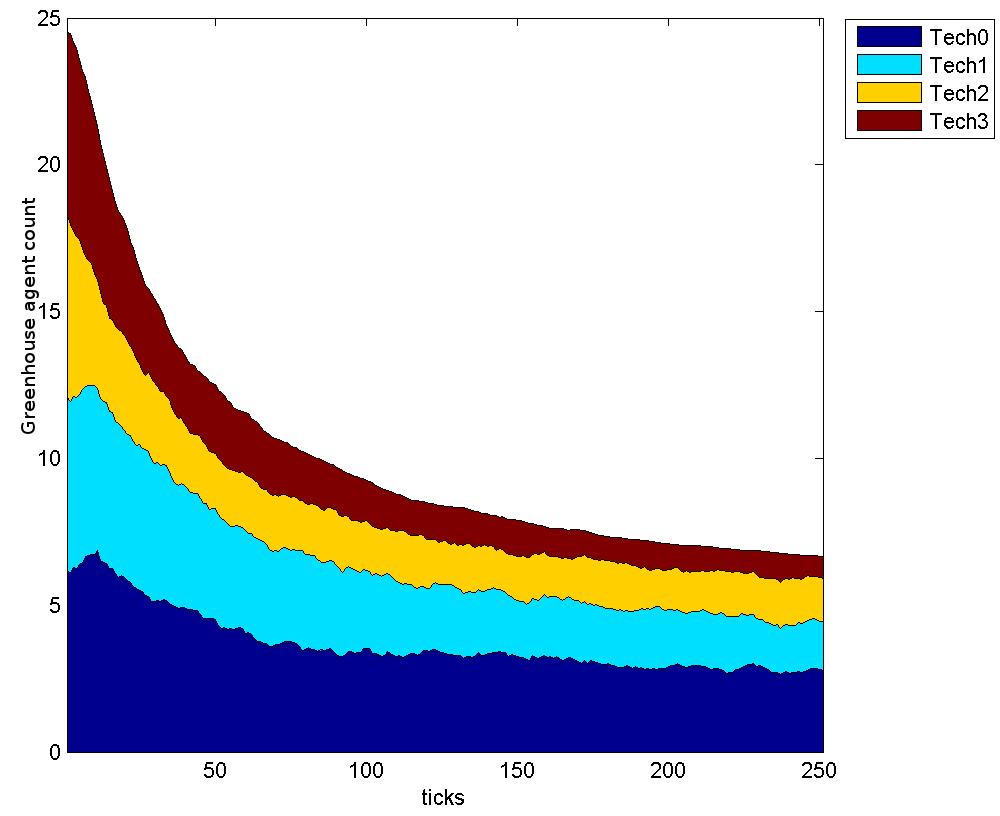
- The two crops were designed to be neutrally profitable for average sized greenhouses, but the technologies that best suited vegetable production more closely matched the patterns of DoI, as seen in Figures 5, 6 and 7. These figures show the number of agents that own a given technology over the course of the simulation, but unlike Figure 4, are split by crop type so do not have a constant number of agents over time. With lower base production and a higher selling price, flower production had more potential for profit, but also more to lose from poor technology investments. Consequently, flower producers struggled to recover from early losses and were less likely to be satisfied with their technologies (even with the optimal flower production technologies) so copied their more profitable vegetable producing neighbours to their own detriment. For example, in technology category 3, technology 1 is optimal for flower growers, technology 2 is optimal for vegetable growers and technology 0 is second best for both crop types5. Figure 7 shows that among flower growers technology 0 is the most popular, while the optimal technology 1 is only slightly more popular than technology 2, which is best for the vegetable growers but not much good for the flower growers. As flower growers copied their vegetable growing neighbours and went bankrupt, a feedback loop formed. Bad investments lead to flower grower bankruptcies, decreasing the number of flower growers from 25 to only 7, and leading to further bad investments and bankruptcies. With a smaller, more widely spaced population of flower growers, even the optimal flower technologies diffused relatively poorly and did not achieve the predicted logistic growth (see Figures 5b, 6b and 7b)
- 4.6
- DoI says that a diffusion ends as the supply of potential adopters is exhausted and the adoption rate declines. In this experiment, the supply of potential adopters can diminish, but never be fully exhausted because new agents can be introduced following a bankruptcy, and agents can adopt, reject, and re-adopt an innovation, distorting the logistic function for the rate of new adoptions. The poorest performing technologies never achieved an increase in adoptions, instead declining almost immediately, while the best performing technologies plateaued or declined as a result of competition even when many potential adopters remained. The vegetable growers quickly concentrated on the technologies that optimized vegetable production in all three technology categories, but never completely converged in any category (see Figures 5a, 6a and 7a), not even after 2500 when we checked explicitly for convergence (see Figure 4). The boundedly rational agents remain ignorant of many details and use relative profit when forming opinions, so can never be sure that they have the best possible arrangement of technologies and even very successful agents are susceptible to trying something new.
- 4.7
- From the perspective of the innovation, and from the perspective of DoI, the inability to completely exhaust the supply of potential adopters is a failure or a difficulty to overcome. But from the perspective of the entire system, or from a UD perspective, the lack of convergence is a success. A mechanism that prevents full convergence on one technology maintains the possibility of introducing totally new innovations in the future while keeping the system robust to the weaknesses associated with reliance on a single technology.
- 4.8
- The flower growers were less able to converge on the optimal technologies for flower production in each technology category (see Figures 5b, 6b and 7b) exacerbated by the decrease in flower growers. The more numerous vegetable growers, with higher profits and vegetable oriented opinions, distorted the flower growers' decision making. This shows that the successful diffusion of some technologies can crowd out the diffusion of other good technologies, even those aimed at a different population, which corroborates the survey results (see Table 4) showing that growers are not influenced by crop when making technology decisions. Producers of less common products will be influenced by the producers of dissimilar but more common products, although this homogenizing influence is not enough to overcome the drive to explore motivated by competition. In the real world, this is also complicated by the infrequency of replacing a given technology, the costs associated with switching, and the interactions between the various technologies, meaning that retaining a technology, even when it is known to be sub-optimal, may be preferable to investing in alternatives with untested effects and additional integration costs.
- 4.9
- DoI doesn't look for and couldn't predict these result although they are visible in the real world. Crop types and technologies are very unevenly distributed (Tüzel & Özçelik 2004; Breukers et al. 2008), technological advances spread rapidly but never totally dominate the growers' urge to experiment with new technologies (Breukers et al. 2008), and the producers of less common crops have to make do with less specialized equipment and information targeted to growers of more common products. UD would look for, even expect to find these patterns, although it would be unable to predict the specifics of which technologies or crops would fail as a result of competition with uneven rewards (Witt 1992). Policy or management decisions need to look beyond DoI if they want to predict or deal with the way that a population targeted for diffusion might swell or shrink, the way feedback loops form as a result of competition on information flows, the way adoption decisions are a competitive exploration of the potential solution space rather than a simple, infection-like spread of knowledge or fully informed rational decisions, and the way external populations might feed irrelevant or detrimental information or technologies into the target population, crowding out the desired diffusion.
Figure 5: Distribution of category 1 technologies owned by agents over time 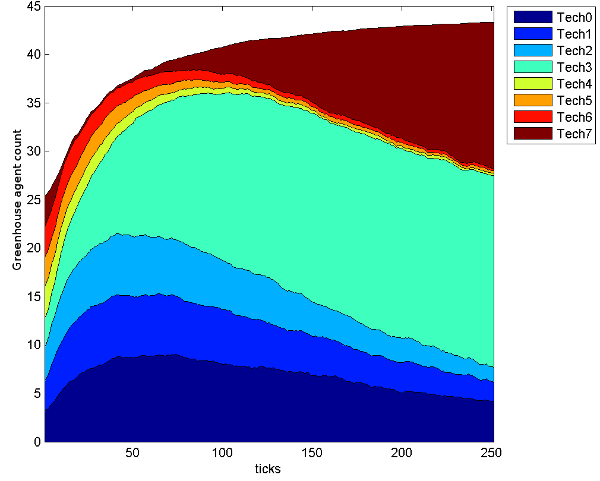
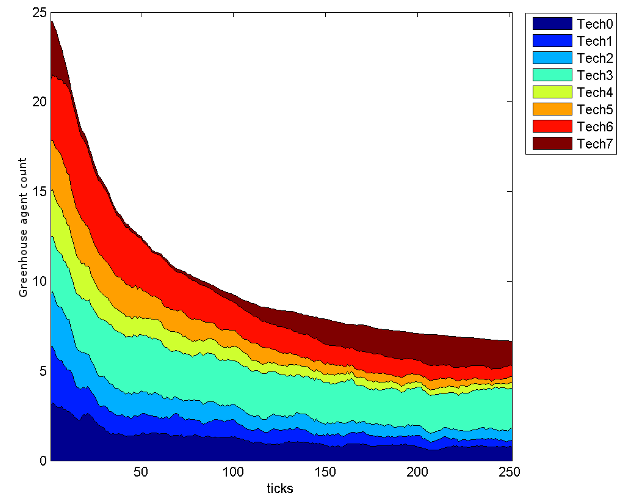
Vegetable producers Flower producers
Figure 6: Distribution of category 2 technologies owned by agents over time 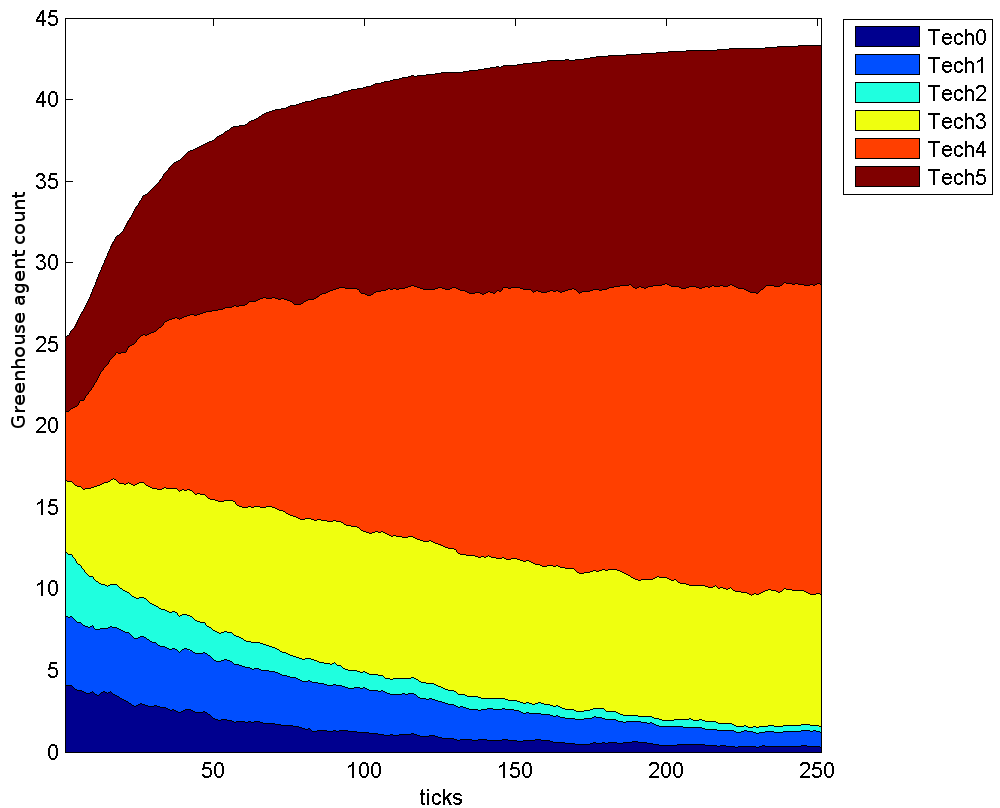
Vegetable producers Flower producers
Figure 7: Distribution of category 3 technologies owned by agents over time 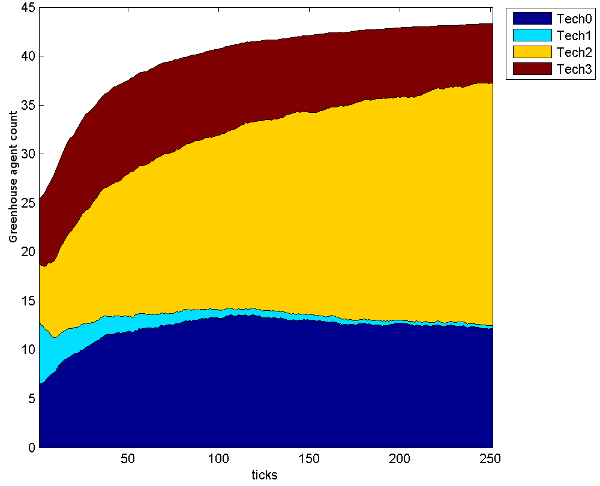
Vegetable producers Flower producers Part 2 results and discussion
- 4.10
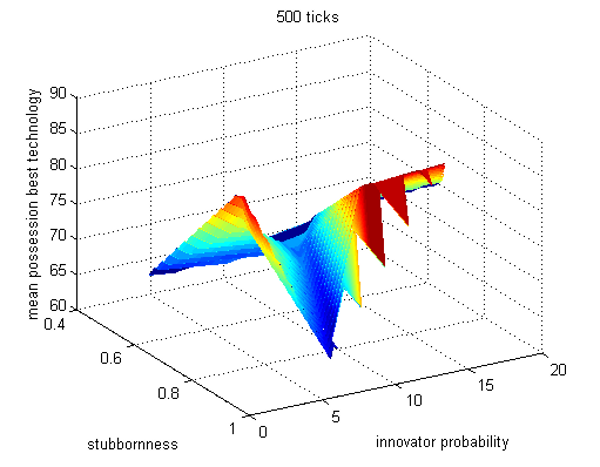
- The second set of experiments showed that adding more complexity leads to some further interesting and counter-intuitive behaviours in the interactions between parameters, and between parameters and time (van den Berg 2010). For example, DoI predicts that refusing to adopt new innovations is a disadvantage, and that innovativeness, or risk taking, is an advantage to the innovative individual. We tested these assumptions by varying the agent characteristics of stubbornness (how an agent weights his own opinion against the opinions of his neighbours) and innovator probability (the percentage of the population designated as innovators) and sampled the population of agents at two different points in the simulation to see which settings led to better mean possession of the optimal technologies. As the results relate to an emergent property as a consequence of the interaction of two continuously varying factors, we present the results in 3D fitness landscapes (see Figure 8).
- 4.11
- By tick 75, a wide region of the parameter space covering low stubbornness and low innovator probability shows a high mean possession of the best technology. This is because agents with a low stubbornness are easily persuaded to adopt the technology choices of their neighbours and with low innovator probability almost everyone follows the normal purchasing rules. However, by tick 500, this has been reversed. Highly stubborn agents have had time to find a technology that works well for themselves, even if it does not work well for their neighbours, and these stubborn agents cannot be persuaded to switch while the easily influenced agents could not resist abandoning a good technology on the advice of their neighbours (see Figure 8). And while a high innovator probability meant more agents sometimes behave erratically in the short term, by tick 500 their exploratory behaviour has benefited the entire community by speeding up the rate of new information flowing along the network. The limited number of available technologies means that innovative agents, and in fact the entire network of agents, quickly become familiar with all available technologies. After full exploration of the technology options, the innovators behave just like non-innovative agents, and purchase technologies strictly on the basis of their technology libraries. Thus, the entire population of agents in runs with high innovator probability have had more time to form opinions of the entire set of technologies.
- 4.12
- Of course, there is no such cap on the total number of technologies in the real world. In reality, non-innovative individuals may benefit from the presence of innovative individuals, but innovative individuals might be taking all the risks without any assurance of benefit. Interestingly, there is a smaller, second region of high mean possession of the optimal technology in the later stage landscape. When agents are highly stubborn but have a zero or very low innovator probability, they also achieve good mean rates of possession of the best technologies, suggesting that a high stubbornness is more important than having many exploratory, risk-taking agents. However, a high stubbornness and middling innovator probability shows very poor rates of optimal technology possession, so the situation is not so simple.
- 4.13
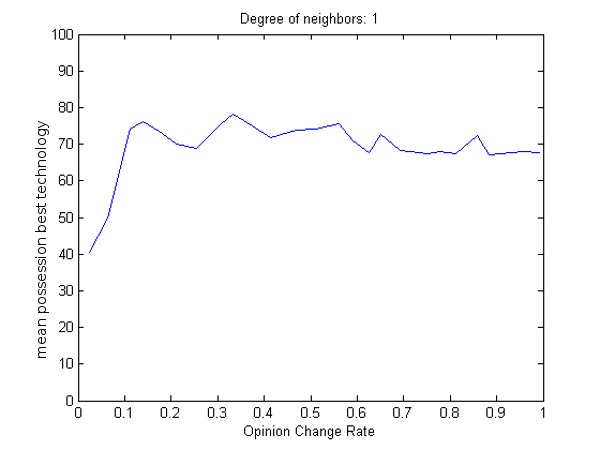
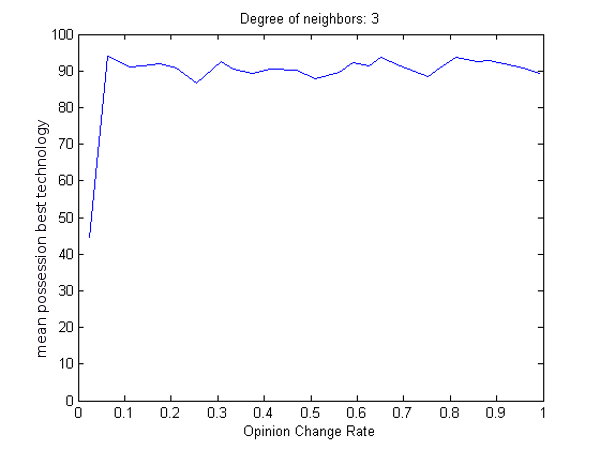
- We also tested the interaction of opinion change rate and the degree of neighbours. DoI sees receiving more information as positive because the spread of knowledge is the first step to adoption. The opinion change rate determines how agents weight new information against old when updating their technology libraries, so at low opinion change rates, agents require many ticks to change an opinion about a technology. Degree of neighbours determines whether an agent compares their profits and technology libraries with only directly linked neighbours, or also with those linked to their neighbours by one or two degrees of separation. With a higher degree of neighbours, every agent has access to much more information and knowledge is shared much faster. Since the degree of neighbours is not a continuously varying parameter, we can present the results of these experiments in 2D figures (9 and 10).
- 4.14
- Like highly stubborn agents, agents with low opinion change rates tend to stick with whatever technologies they were randomly assigned while at higher opinion changes rates agents are more willing to change. At tick 100, low opinion change rates have low rates of optimal technology possession for all degrees of neighbours. Mean possession of the optimal technology improves with an increase in opinion change rate, before hitting a plateau at .5 or .6 for 1 degree of neighbours and .4 for 3 degrees of neighbours. Beyond these points, there is no further advantage to an increase in opinion change rate. Mean possession of the optimal technology also improves over time, effectively pushing back the point at which the advantage to an increase in opinion change rate plateaus. By tick 250, only agents with a very low opinion change rate show poor possession of the best technology, both at 1 and 3 degrees of neighbours. Degree of neighbours clearly improves mean possession of the optimal technologies at all time scales, overcoming the detrimental effects of a low, but not very low, opinion change rate. Nevertheless, the differences between tick 100 and 250 show that even a high degree of neighbours needs some time to take effect.
Figure 8: Dark reddish brown marks those regions with the highest mean possession of the optimal category 1 technology for agents of both crop types as stubbornness and innovator probability vary. An early advantage (a) goes to a wide range of low stubbornness/low innovator probability combinations, the late advantage (b) is found in only two small regions, both with high stubbornness. 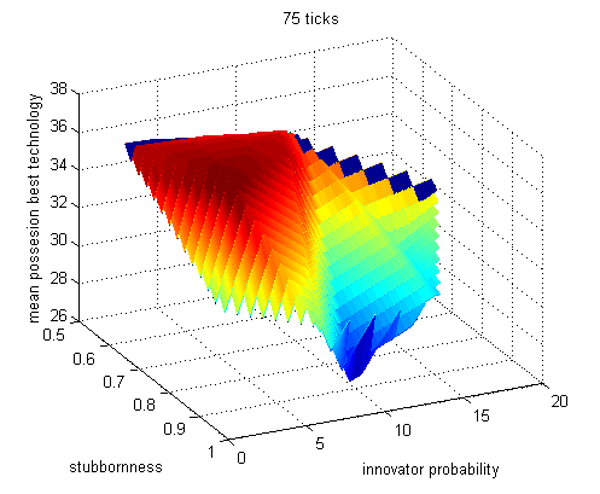
(a) (b) Figure 9: For 1 degree of neighbours, mean possession of the optimal technology increases with opinion change rate until .5 or .6 at 100 ticks (a) and .1 or .2 at 250 ticks (b). 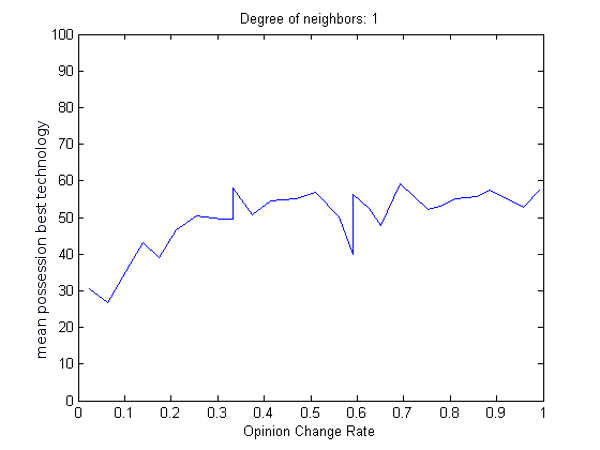
(a) (b) Figure 10: For 3 degrees of neighbours, mean possession of the optimal technology increases with opinion change rate until .4 at 100 ticks (a) and .1 at 250 ticks (b). 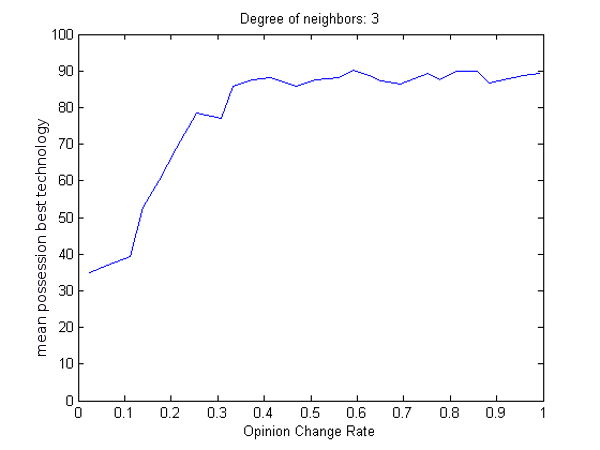
(a) (b) - 4.15
- The second set of experiments showed that the assumptions of DoI were not as straightforward or universal as might be expected. Stubbornness was detrimental in the short term, but an advantage in the long run, many innovative agents was a benefit to the community, but not to the innovative agents themselves, and a higher opinion change rate was positive, but only up to a point. As predicted by DoI, a higher degree of neighbours was both beneficial and very influential. All of these results indicate that, in the short term, more information (from a higher innovator probability, a higher degree of neighbours, lower stubbornness or higher opinion change rates) leads to higher mean possession of the best technology. In the long term, a higher degree of neighbours is still a benefit, but less rapid information flows are related to higher mean possession of the optimal technologies.
Table 9: Summary of results from the experiments in Part 2 Variable DoI predicts Observed Prediction matches observation? Low stubbornness quotient Advantage Early advantage Incomplete match High stubbornness quotient Disadvantage Late advantage Incomplete match Low innovator probability Disadvantage Early advantage to individual Poor match High innovator probability Advantage Late advantage to community Poor match Low opinion change rate Disadvantage Disadvantage Complete match High opinion change rate Advantage Advantage (no added benefit for very high rate) Incomplete match Low degree of neighbours Disadvantage Disadvantage Complete match High degree of neighbours Advantage Advantage Complete match
Conclusions
- 5.1
- Governments, industries, communities and businesses are currently under a great deal of pressure to become more sustainable and more productive through innovation. The Netherlands is particularly interested in the greenhouse horticulture industry, as an important component of the economy, and wants to see rapid improvement in both sustainability and productivity. The case study shows that the greenhouse horticulture industry of the Westland, in the Netherlands, has seen large increases in productivity in the recent past. These improvements can be attributed to the diffusion of innovations or to a complex web of interconnected and adaptive influences reaching far and wide in both time and space. DoI is a simple framework that focusses on one particular diffusion pattern, the logistic curve, which is found at a single scale and level of organization, and as such DoI offers appealingly clear goals and advice which is unfortunately too reductionist and structurally unrealistic to provide a good foundation for predictions or policy goals. On the other hand, UD embraces multiple patterns at multiple scales and organizational levels, but is so complex and unwieldy to analyse that it too cannot offer useful predictions, goals or policy advice. Both DoI and UD fall outside of the optimal balance of usefulness and interpretability.
- 5.2
- ABM offers a way to balance the two extremes, by dropping some unrealistic and overly reductionist simplifications of DoI, while maintaining control over experimental variables (even in a complex system) to improve analysis. We adapted the basics of DoI with the results of a survey of real-life greenhouse growers, to produce an ABM that bridged the gap between DoI and UD by allowing multiple, competing innovations to diffuse through a more dynamic population. We were thus able to reveal the classic DoI patterns and interactions as well as others unavailable in a pure DoI model. The experiments show that not only are DoI and UD related theories that address different levels of focus, but also that many of the predictions of DoI change significantly when the theoretical simplifications, such as no competition, are removed. Sensitivity to initial conditions and feedback loops interact with competition to mean that even the best performing innovations might not diffuse well, while those that diffuse the best will never achieve full convergence. Further, a second set of experiments show that under the competitive, dynamic conditions assumed by UD, agent characteristics, such as innovativeness or being receptive to the information available through the network, are not an advantage at all time scales.
- 5.3
- The most important take away points for policy making or industry management would be that the behaviours and attitudes of individual growers, as reported by those growers in the survey, are not clearly good or bad, but have costs and benefits in relation to the entire network and to a time frame. Any policy aiming to increase innovativeness, for example, needs to be prepared for the fact that innovative individuals could be worse off, although their community will be better for their risk taking. And any management ideas that simply seek to increase the amount of information flowing through the network have to anticipate how to deal with the increase in inappropriate as well as appropriate advice, so that while more individuals might be part of determining the best technologies, more will also be swayed negatively by those neighbours that are too dissimilar to give useful information. Policy makers and managers will have to be explicit about the time scale at which they expect to see benefits, as well as who is expected to benefit the most and who is expected to take the most risk. While the simplicity and clarity of DoI make it tempting as a tool to make predictions or goals, the too-narrow focus, the reductionist simplifications, and the lack of structural reality that our case study and ABM reveal show that DoI is a poor basis for such predictions and goals. Policies or strategies drawing on DoI must also draw on the more complex and dynamic UD theories as well to look at multiple patterns, scales and levels of focus.
Acknowledgements
-
The research has been supported by the European Regional Development Fund and the Duurzame Greenport Westland-Oostland Task Force.
Notes
- 1
- Universal Darwinism as first introduced by Dawkins (2006) means only that all life in the universe would have evolved through the same basic process of natural selection. This is fairly uncontroversial, and is still biological evolution.
- 2
- The full survey (in the original Dutch), the anonymized details of all 7 respondents and the full survey results (in English) are available at http://repository.tudelft.nl/view/ir/uuid:4c1a3c58-2589-4447-a4d1-7bdf1e0f3711/
- 3
- The model code and a more extensive description are available at http://www.openabm.org/model/2999/version/1/view or at http://wiki.tudelft.nl/bin/view/Education/SPM955xABMofCAS/StudentPages/UDInGreenhousesProject
- 4
- Full details of all costs, yields, and technology effects is available in the model code at http://www.openabm.org/model/2999/version/1/view or at http://repository.tudelft.nl/view/ir/uuid:4c1a3c58-2589-4447-a4d1-7bdf1e0f3711/
- 5
- For the full breakdown of which technologies are optimal for each category and crop type, see the full model code or extensive description at http://www.openabm.org/model/2999/version/1/view or at http://repository.tudelft.nl/view/ir/uuid:4c1a3c58-2589-4447-a4d1-7bdf1e0f3711/
References
-
ABRAHAMSON, E. & ROSENKOPF, L. (1997).
Social network effects on the extent of innovation diffusion: A
computer simulation.
Organization science, 8(3), 289-309. [doi:10.1287/orsc.8.3.289]
ASHBY, W. (1968). Variety, constraint, and the law of requisite variety. In Buckley, W. (ed.), Modern Systems Research for the Behavioral Scientist. Chicago: Aldine, 129-136.
BLACKMORE, S. (2000). The meme machine. Oxford University Press, USA.
BOSERUP, E. (2005). The conditions of agricultural growth: The economics of agrarian change under population pressure. Aldine De Gruyter.
BREUKERS, A., HIETBRINK, O. & RUIJS, M. (2008). The power of Dutch greenhouse vegetable horticulture: an analysis of the private sector and its institutional framework. LEI, The Hague .
BROWN, S. & EISENHARDT, K. (1997). The art of continuous change: Linking complexity theory and time-paced evolution in relentlessly shifting organizations. Administrative Science Quarterly 42, 1-34. [doi:10.2307/2393807]
BUURMA, J. & RUIJS, M. (2011). Sustainable greenhouse horticulture and energy provision: two regional transition processes compared. Transformation and sustainability in agriculture , 91-111. [doi:10.3920/978-90-8686-717-2_8]
CHANDLER, A. (2005). Shaping the industrial century: the remarkable story of the evolution of the modern chemical and pharmaceutical industries, vol. 46. Harvard Univ Pr. [doi:10.4159/9780674029378]
CHAPPIN, É. (2011). Simulating Energy Transitions. Ph.D. thesis, PhD thesis, Delft University of Technology, Delft, the Netherlands. http://chappin.com/ChappinEJL-PhDthesis. pdf.
CHAPPIN, E. J. L. & DIJKEMA, G. P. J. (In Press). Modeling for Transition Management. In Review.
COHEN, J. & STEWART, I. (2000). The collapse of chaos: Discovering simplicity in a complex world. ePenguin.
DARWIN, C. (1985). The Origin of the Species. Penguin books.
DAVIS, K. (1966). The urbanization of the human population. The city reader , 3-20.
DAWKINS, R. (2006). The selfish gene. Oxford University Press, USA.
DENNETT, D. (1996). Darwin's dangerous idea: Evolution and the meanings of life. Simon and Schuster.
DEWAR, R. (1984). Environmental productivity, population regulation, and carrying capacity. American Anthropologist 86(3), 601-614. [doi:10.1525/aa.1984.86.3.02a00040]
FLEMING, L. & SORENSON, O. (2001). Technology as a complex adaptive system: evidence from patent data. Research Policy 30(7), 1019-1039. [doi:10.1016/S0048-7333(00)00135-9]
GEELS, F. (2002). Technological transitions as evolutionary reconfiguration processes: a multi-level perspective and a case-study. Research policy 31(8), 1257-1274. [doi:10.1016/S0048-7333(02)00062-8]
GEELS, F. (2006). Co-evolutionary and multi-level dynamics in transitions: the transformation of aviation systems and the shift from propeller to turbojet (1930-1970). Technovation 26(9), 999-1016. [doi:10.1016/j.technovation.2005.08.010]
GERMING, G. (1975). Industrial crop production. In: Symposium on Protected Cultivation of Flowers and Vegetables 51. ISHS. [doi:10.17660/actahortic.1975.51.37]
GOLDENBERG, J., LIBAI, B., SOLOMON, S., JAN, N. & STAUFFER, D. (2000). Marketing percolation. Physica A: Statistical Mechanics and its Applications 284(1), 335-347. [doi:10.1016/S0378-4371(00)00260-0]
GRIMM, V., REVILLA, E., BERGER, U., JELTSCH, F., MOOIJ, W., RAILSBACK, S., THULKE, H., WEINER, J., WIEGAND, T. & DEANGELIS, D. (2005). Pattern-oriented modeling of agent-based complex systems: lessons from ecology. science 310(5750), 987-991.
HEICHEL, G. (1976). Agricultural Production and Energy Resources: Current farming practices depend on large expenditures of fossil fuels. How efficiently is this energy used, and will we be able to improve the return on investment in the future? American Scientist 64(1), 64-72.
HIX, J. (1996). The glasshouse. Phaidon Press.
HOEFSLOOT, L. & VAN REEVEN, L. (2010). Import of Horticulture Produce from Foreign Countries and Global Warming. Ph.D. thesis, Erasmus University.
HOLLAND, J. (1996). Hidden order: How adaptation builds complexity. Basic Books.
JOHNSON, S. (2010). Where good ideas come from: The natural history of innovation. ePenguin.
KAMPP, A. (1937). Cultivation and Export of Netherlands Fruit. Economic Geography 13(3), 315-324. [doi:10.2307/141230]
KASMIRE, J., DIJKEMA, G. & NIKOLIC, I. (2012). Diffusion: Key to Horticulture Innovation Systems in Proceedings of the Third International Engineering Systems Symposium, Council of Engineering System Universities.
KASMIRE, J., NIKOLIC, I., VAN DEN BERG, W. & BERGWERFF, L. (2011). Universal Darwinism in greenhouses: Proof of concept using an agent based model. In: Networking, Sensing and Control (ICNSC), IEEE International Conference.
KAUFFMAN, S. & JOHNSEN, S. (1991). Coevolution to the edge of chaos: Coupled fitness landscapes, poised states, and coevolutionary avalanches*. Journal of Theoretical Biology 149(4), 467-505. [doi:10.1016/S0022-5193(05)80094-3]
KELLY, K. (2010). What technology wants. Viking Pr.
KEMP, R., LOORBACH, D. & ROTMANS, J. (2007). Transition management as a model for managing processes of co-evolution towards sustainable development. The International Journal of Sustainable Development & World Ecology 14(1), 78-91. [doi:10.1080/13504500709469709]
KIM, J. (1999). Making sense of emergence. Philosophical studies 95(1), 3-36. [doi:10.1023/A:1004563122154]
KIRBY, S. (2001). Spontaneous evolution of linguistic structure-an iterated learning model of the emergence of regularity and irregularity. Evolutionary Computation, IEEE Transactions on 5(2), 102-110. [doi:10.1109/4235.918430]
LUND, J. & FREESTON, D. (2001). World-wide direct uses of geothermal energy 2000. Geothermics 30(1), 29-68. [doi:10.1016/S0375-6505(00)00044-4]
MALTHUS, T. (1959). Population: the first essay. Univ of Michigan Pr.
NELSON, R. & WINTER, S. (1982). An evolutionary theory of economic change. Belknap press.
NEWMAN, M. (2003). The structure and function of complex networks. SIAM review , 45(2), 167-256. [doi:10.1137/S003614450342480]
NIKOLIC, I. (2009). Co-Evolutionary method for modelling large scale socio-technical systems evolution. Ph.D. thesis, TU Delft.
NIKOLIC, I. & KASMIRE, J. (2012). Theory Chapter in Agent-based modelling of socio-technical systems. Springer Press.
PANNEKOEK, L., VAN KOOTEN, O., KEMP, R. & OMTA, S. (2005). Entrepreneurial innovation in chains and networks in Dutch greenhouse horticulture. Journal on Chain and Network Science 5(1), 39-50. [doi:10.3920/JCNS2005.x053]
PEDERSEN, M. (2010). Tuning & simplifying heuristical optimization. Ph.D. thesis, PhD thesis, University of Southampton.
PINCKAERS, M. (2005). Netherlands agricultural situation: The Benelux horticultural market 2005. GAIN report no: NL 5002. USDA Foreign Agricultural Service. http://www.fas.usda.gov/gainfiles/200501/146118432.pdf.
PLATT, T. & BEVER, J. (2009). Kin competition and the evolution of cooperation. Trends in ecology & evolution 24(7), 370-377. [doi:10.1016/j.tree.2009.02.009]
POPPE, K. & VAN MEIJL, H. (2004). Adjustment and differences in farm performance: a farm management perspective from the Netherlands. In: IAPRAP \ IATRC Summer Symposium, Adjusting to Domestic and International Agricultural Reform in Industrial Countries, June 6-7, 2004, Philadelphia, PA. International Agricultural Policy Reform and Adjustment Project (IAPRAP).
ROGERS, E. (1995). Diffusion of innovations. Free Pr.
ROTMANS, J., KEMP, R. & VAN ASSELT, M. (2001). More evolution than revolution: transition management in public policy. Foresight 3(1), 15-31. [doi:10.1108/14636680110803003]
RYBACH, L. & SANNER, B. (2000). Ground source heat pump systems, the European experience. GHC Bull 21, 16-26.
SHENNAN, S. (2002). Genes, memes and human history: Darwinian archaeology and cultural evolution. Thames & Hudson London;.
SHOVE, E. & WALKER, G. (2007). Caution! Transitions ahead: politics, practice and transition management. Environment and Planning A 39(4), 763-770. [doi:10.1068/a39310]
SIMON, H. (1982). Models of Bounded Rationality. MIT Press.
STONEMAN, P. & DIEDEREN, P. (1994). Technology diffusion and public policy. The Economic Journal 104(425), 918-930. [doi:10.2307/2234987]
TESFATSION, L. (2006). Agent-based computational economics: A constructive approach to economic theory. Handbook of computational economics 2, 831-880. [doi:10.1016/S1574-0021(05)02016-2]
THIERRY, B. (1990). Feedback loop between kinship and dominance: the macaque model. Journal of theoretical Biology 145(4), 511-522. [doi:10.1016/S0022-5193(05)80485-0]
TNO (2010). Natural Resources and Geothermal Energy. Tech. rep., TNO.
TOMCZAK, J. (2005). Implications of fossil fuel dependence for the food system. Michigan State University, Tompkins Country Relocalization Project, California: Post Carbon Institute. http://www.energybulletin.net/17036.html
TüZEL, Y. & ÖZçELIK, A. (2004). Recent trends and developments in protected cultivation of Turkey. In: International Work shop on La Produzione in serra dopo l’era del bromuro di metile.
VAN DEN BERG, W. (2010). Technology diffusion in the Westland: An informed Agent Based approach. Master's thesis, TU Delft.
VAN DEN MUIJZENBERG, E. (1980). A history of Greenhouses. Institute for Agricultural Engineering.
VASEY, D. (2002). An An Ecological History of Agriculture 10,000 BC to AD 10,000. Purdue Univ Pr.
VERBONG, G. & GEELS, F. (2007). The ongoing energy transition: Lessons from a socio-technical, multi-level analysis of the Dutch electricity system (1960-2004). Energy Policy 35(2), 1025-1037. [doi:10.1016/j.enpol.2006.02.010]
VOS, J. (1992). A case history: Hundred years of potato production in Europe with special reference to The Netherlands. American Journal of Potato Research 69(11), 731-751. [doi:10.1007/BF02853816]
WALDORP, M. (1992). Complexity: The emerging science at the edge of order and chaos. Simon and Schuster, New York. [doi:10.1063/1.2809917]
WALSINGHAM, J. et al. (1976). The production and use of energy in agriculture. Journal of Agricultural Economics 27(1), 19-30. [doi:10.1111/j.1477-9552.1976.tb00963.x]
WEISBUCH, G. & STAUFFER, D. (2000). Hits and flops dynamics. Physica A: Statistical Mechanics and its Applications 287(3), 563-576. [doi:10.1016/S0378-4371(00)00393-9]
WILENSKY, U. (1999). Netlogo: Center for Connected Learning and Computer-Based Modeling, Northwestern University. Evanston, IL.
WITT, U. (1992). Evolutionary Concepts in Economics. Eastern Economic Journal 18(4), 405-419.