
 Abstract
- Technical, environment, social, economic and political constraints are critical barriers to the development of new renewable energy supplies. SEMPro is an agent-based, predictive analytics model of energy siting policy in the techno-social space that simulates how competing interests shape siting outcomes to identify beneficial policy for sustainable energy infrastructure. Using a high voltage transmission line as a case study, we integrate project engineering and institutional factors with GIS data on land use attributes and US Census residential demographics. We focus on modeling citizen attitudinal, Community Based Organization (CBO) emergence and behavioral diffusion of support and opposition with Bilateral Shapley Values from cooperative game theory. We also simulate the competitive policy process and interaction between citizens, CBOs and regulatory, utility and governmental stakeholders using non-cooperative game theory. We find CBO formation, utility message and NGO messaging have a positive impact on citizen comments submitted as a part of the Environmental Impact Statement process, while project need and procedure have a negative impact. As citizens communicate and exchange political opinions across greater distances with more neighbors, less CBOs form but those that do are more effective, increasing the number of messages citizens send.
- Keywords:
- Infrastructure Siting, Policy Informatics, Computational Economics, Community Based Organizations, Citizen Participation, Game Theory
Introduction
- 1.1
- Growing consumer demand for environmental sustainability coupled with new regulatory requirements have increased pressure on utilities, stakeholders, and government officials to find new and creative solutions to the complex problems of sustainable resource use. Due to of the complexity of these issues, public policy debates have typically occurred at the elite level without significant input by ordinary citizens, especially those in underserved communities.
- 1.2
- While most agree that reducing carbon emissions and increasing the use of renewable energy are worthy goals, competing interests among varied constituencies make implementation difficult. This is particularly problematic in areas where urban demands for power are increasing but the most cost-effective renewable resources are located outside demand centers. While regulators and consumers demand more energy from renewable sources, projects are blocked or delayed by a variety of regulatory agencies with overlapping jurisdiction over various aspects of such projects or property owners who typically do not want new power plants or transmission lines in their field of view. Environmental activists who are concerned about biodiversity, aesthetic, and water quality issues can effectively delay or block new transmission siting as well.
- 1.3
- The Sustainable Energy Modeling Program (SEMPro) models technical, environment, social, economic and political barriers to the development of new energy supplies in an agent-based, predictive analytics model of the energy siting policy in the techno-social space (Vespignani 2009). Agents are homeowners, regulators, US resource agencies, utilities, power producers, environmental organizations, and others with an interest in siting that interact against the backdrop of political institutions, proposed infrastructure siting routes, the local populace and the environment. Agents' preferences are fed into the model which uses game theory, bargaining dynamics, and network theory to predict agents' actions and reactions in the policy realm. We identify actionable strategies to help build energy infrastructure in a more timely and less conflictual manner than current processes typically allow.
- 1.4
- SEMPro offer ideas about policy levers, issue linkage strategies, bargaining positions, and other tactical and strategic advice to users about how to reach consensus on any issue given its dynamics. It is not a typical siting decision support tool, but employs both cooperative and non-cooperative game theoretic frameworks to simulate citizen, group and regulator politics surrounding sitting. This illuminates both what matters for moving from stewardship to sustainability, in terms of tactics and strategies for any particular situation, but more importantly how-to align disparate interests towards sustainability. We believe approaches like SEMPro can serve as an platform for ideas about issue framing and scenario analysis to explore key uncertainties, and can identify equitable solutions to energy problems that are supported by local communities.
Electricity Policy Dynamics Literature
- 2.1
- SEMPro was developed using a range of relevant social science theories grouped into three categories. The first type of theoretical and empirical support for the model development comes from the siting literature. Citizen opposition is a function of a) perceived risk from the infrastructure project (Furby et al 1988) b) proximity or distance to the project (Edison Electronic Institute 1992) c) the land use attributes of the land parcels (Devine-Wright 2009) and d) expected property value impacts due to visual impairment and health and safety concerns (Jackson and Pitts 2010). Cain and Nelson (2013) integrate and evaluate these diverse literatures and argue that understanding citizen opposition is not adequate to explain observed siting outcomes, and posit a framework that includes institutional factors under Environmental Impact Assessment (EIA) processes. These institutional variables are included in the SEMPro model. Research shows that project outcomes are typically not directly influenced by explicit environmental or social variables, but rather by political concerns as well as elite preferences (Wood 2003; Jay et al 2007). The stakeholder and regulator modules explicitly include elite preferences that shape environmental outcomes. These include citizen trust in the sponsoring entity or agency (Chiu and Lai 2009), because in order to support a project, citizens need to think that decision makers will honestly include their preferences (Hendry 2004). SEMPro also includes the perceived need of the project as opposed to alternatives such as customer sited renewables like solar photovoltaics.
- 2.2
- The second body of literature that governs citizen agent interactions comes from communications literature. The two basic theoretical foundations of SEMPro are how people communicate about important societal issues and the effect that communication has on the views people hold. Corman et al. (2007) describe communication as a ''source'' transmitting a ''message'' via a ''channel'' to a ''receiver''. These messages are subject to noise and distortion. Even in an age of cheap and easy electronic communication, proximity between a source and a receiver are important. Geographic proximity leads to greater frequency of communication and building of ties (McPherson et al. 2001).
- 2.3
- Berlo's Communications Penetration Model describes how messages may not be received or accepted because the receiver is not exposed to the message, does not pay attention to the message or does not accept the sentiment of the message (Berlo 1969). Social Judgment Theory describes how the positions of two agents can be conceived along a Downsian continuum and distance between these positions affects the likelihood of one accepting the other's position. A message that is close to a receiver's position has little effect because it is not different enough to cause a large change, and one that is far from a receiver's position is likely to be rejected, but messages ''at a moderate distance'' from the receiver's position may be able to have a strong influence (Siero and Doosje 2006). Messages can be repeated multiple times and via various channels to increase the likelihood of acceptance (Corman et al. 2007).
- 2.4
- Empirical research shows that people also exhibit homophily, a tendency to associate more with people similar to themselves. Homophily promotes communication receptivity because messages are both more frequent and more successful between similar people (Rogers and Bhowmik 1970). Additionally, individuals with higher confidence are less likely to change their position based on communication (Bennett 2010). In sum, agent communications in our model follow Berlo (1969), in that message, source, and receiver are all important in determining whether a message is accepted. We also look at spatial homophiliy through the concept of talkspan. Neighborhood distance and communication methods impact the potential social-spatial feasibility set (McPherson et al. 2001). Thus talkspan limits each individual agent's interactions to various neighborhood sizes for potential local partners.
- 2.5
- The third and final category of literature comes from expected utility and game theory to govern CBO formation, as well as stakeholder and regulatory bargaining and coalition formation. Expected utility has been described as the ''major paradigm in decision making'' (Schoemaker 1982). CBO formation is based on cooperative game theory (Suijs 2000). Citizens will join CBOs if it increases their power to potentially influence the regulatory process as long as the CBO's position is acceptable given the citizen's initial position (Ketchpel 1995).
Model Entities and Variables
- 3.1
- The model is implemented in NetLogo (Wilensky 1999) and Appendix 1 contains pseudo code. SEMPro has several classes of entities, state variables and scales. Entities span GIS attributes, power lines, agent individuals, the utility, CBO groups, as well as stakeholder and government agencies. State variables include disruption (the height and type of tower), talkspan (the distance within which citizens talk with each other), perceived project need, procedural justice, utility message, NGO message, and the political preferences in a local population.
- 3.2
- One of the most important variables is disruption, which are the engineering characteristics of the transmission line. Zero is benchmarked to the status quo land use and a value of 1 is calibrated to simulate a giant, 200ft 500Kv high voltage transmission tower on a narrow right-of-way. Disruption has dramatic impacts across several agent attributes, including salience, salient preferences, influence messages and the resulting citizen comments.
- 3.3
- The first entity is the geophysical environment of Southern California, spanning Los Angeles, Orange, San Bernardino and Riverside Counties, using a Robinson GIS projection of block groups from the US Census Bureau (2010). The GIS shape file includes patches characterized by type: block group, or transmission line, land use attribute such as state or municipal parks), areas of land, and areas of water.
- 3.4
- Second, citizen agents are instantiated as individual citizens within block groups based on population from US census data. Individuals are characterized by the following state variables: household income, education, power (education * income, normalized between 0 and 1), ideological attitude based on party affiliation from congressional district data variables (liberal-conservative score ranging from 0 to 100), as well as proximity (distance from the nearest transmission line). An emergent class of entities is CBOs, that form when groups of citizens coalesce for social action around perceived threats to their community.
- 3.5
- Both individual citizens and CBOs also have other attributes which are calculated by state variables: attitude (ideology * 0.9 + random term * 0.1), preference (((disruption * proximity * 100) + attitude)/2), type (CBO or not, if in CBO, = 2; if not, = 1), salience (salience = disruption * proximity * type). Influence message is the number of messages citizens sent as comments at each timestep in the model ((preference * power * salience * 0.9 + random term * 0.1) * 1.2/9200 * 1.5)), message (cumulative influence message at every tick), salient preference ( salience * preference), CBO, CBO power, and CBO utility. Other metrics include aggregated opposition as the sum of all citizen preferences. The larger the number, the more negative citizens are about the power line. Finally, total power is the sum of all citizens' power, which is a function of education and income.
- 3.6
- As the transmission siting process involves not just individuals but various organizational interests, the fourth class of entities are stakeholders which have the potential to influence the siting process. Specifically, these include regulators, US resource agencies, utilities, power producers, and environmental organizations. Similar to citizen agents, stakeholder agents also have preferences, power and utility.
- 3.7
- One key question is how does utility outreach messages influence citizen attitudes and actions on siting projects (Bray 2011). The utility influences citizen agents through the utility-info procedure similar to Social Judgment Theory (Jager and Amblard 2004). The utility sends out a message to all citizen agents. This message can take the form of flyers, phone calls, town halls, or neighborhood coffee meetings.
- 3.8
- This signal is subsequently received according to citizen attitude and a random stochastic component. The more positive the agent's attitude is, the more likely they are to accept the utility's message. If the random number component is larger than the citizen's attitude, the citizen becomes more disposed to the utility's position by the same random amount. If the utility is sending out more messages than what the citizen wants to accept for the power line's need level, the citizen will be turned off by the utility and become more opposed to the power line. Need is a parameter in the model that represents the perceived project need, the highest value is when the project has been approved by the state transmission operator to provide reliability for the local communities affected by the power line. Need is lower when the power line carries power to other regions without significant local benefit.
- 3.9
- If utility message values are smaller than project need, citizens can change their attitude closer to the utility's preference. The stronger the utility message, the more citizens can move closer, while the shorter the preference distance between citizens and the utility, the more citizens will be receptive to utility messages.
- 3.10
- NGO messages influence citizens in a similar manner as utility messages and make citizens either more supportive or more opposed to the transmission line. This parameter is set at a range between 1 and 10.
- 3.11
- The time step is one month; simulations are usually run over twenty months coinciding with the EIA process that typically lasts between 18 and 24 months. This is the period when the EIA opens for citizen comments on the EIA scoping document all the way to comments on the final EIA document.
Architecture and Modules
- 4.1
- SEMPro model has three sequential submodels, a citizen/CBO formation module, a stakeholder lobbying module, and finally a regulatory decision making module. Figure 1 depicts the high level process and multi-module architecture. Intuitively, citizens react to transmission siting projects by forming opinions as well as attempting to shape others' opinions. These behaviors can result in the formation of CBOs that either support or oppose such projects. Citizens and CBOs that support the proposed project perceive greater utility from the project being built. Against this backdrop of political and social opinion formation and transmission processes, organized stakeholders seek to lobby not only citizen opinions and the emergent CBOs that form as inputs into the siting process, but also other stakeholders in order to maximize their organizational interests. Finally, given the interplay between citizens, stakeholders and society, the regulatory decision making module simulates how regulators ultimately approve or deny siting activities given the constantly shifting techno-social landscape.
- 4.2
- Actionable policy levers for shaping the transmission siting process include project disruption, utility and NGO messaging outreach, as well as perceived project need and procedure surrounding the process. For the citizen module, after we load GIS data and initialize the model, citizen agents exchange their opinions with each other, decide to form CBOs or not, and update CBO preference and power accordingly.
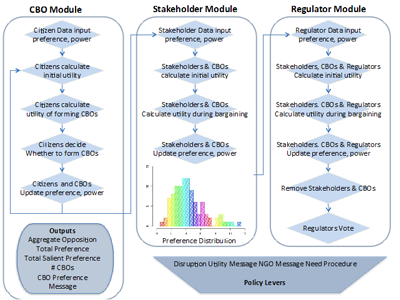
Figure 1. SEMPro Architecture - 4.3
- Citizens are queued and processed according to their patch or grid location in fixed order, using synchronous updating for preference communication and CBO formation in one tick time steps. Given CBO formation, stakeholders then bargain over support or opposition to the project within the same time step. Given new non-cooperative bargaining outcomes, stakeholder and CBO coalition formation change the CBO weighted preferences, which are then fed back into the CBO module for processing in the next time step. This parallel, linked module processing then iterates. Policy lever inputs condition relevant data and processes at each time step. Below we detail only the CBO and Stakeholder Bargaining Modules, but the Regulator Module foundation is similarly built.
Citizen Participation and CBO Formation Submodel
- 4.4
- The citizen participation module focuses on the micro-foundations of political and social attitude formation surrounding transmission siting and the resulting behavioral impacts. Figure 2 details the citizen module processor. Conceptually, the citizen and CBO formation module proceeds in four phases; local information derivation, communication, calculation, and bilateral agreement stages (Yeung et al. 1999).
- 4.5
- For local information, agents first receive their initial preference and power (income * education), from two sources. The first is the GIS shape file of US census block data described above. The second are individual citizen preferences and utility, derived from ideology as well as proximity (distance from the nearest power line). A key property of the citizen module is modeling CBO emergence based upon individual political preferences and local social interactions.
- 4.6
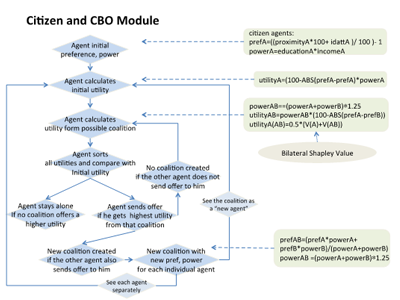
Figure 2. Citizen Participation and CBO Formation Decision Process - 4.7
- The following phases are based on calculation of Bilateral Shapley Values (BSVs) of all citizen agents. BSV is a concept in cooperative game theory for explaining coalition formation, and thus a natural modeling strategy to use in CBO formation (Ketchpel 1995). Each citizen agent is assumed to be autonomous, with bounded rationality, maximizing it's own utility subject to the geophysical, engineering and social constraints of its environment (Yeung et al. 1999). BSV computes all combination of all possible coalitions that citizens can join that maximize citizen utility, and then compares all possible coalition utilities in deciding whether or not to join or form a larger CBO. BSV dynamics thus focus on the permutations of individuals in different coalitions based on the marginal utility gained from CBO formation.
- 4.8
- To define agent characteristic functions, each agent A has an initial preference and power, and their utilityA is calculated as power multiplied by the distance between actual preference and their preference where utilityA = (100-ABS (prefA-prefA)) * powerA. We assume that when keeping power constant, agents maximize their utility when the actual preference is the same as their own preference. When two agents form a coalition utilityAB, the coalition utility is calculated by the distance between their preferences and the sum of their power, where utilityAB = (powerA+powerB) * 1.5 * (100-ABS (prefA-prefB)). For the individual citizen agent in this coalition, utility is calculated as utility(AB)= 0.5 * (V(A)+V(AB)utilityA + utilityAB). This equation takes into account original citizen utility and the contribution from a possible new coalition. We only calculate individual utility and do not compare individual utility with CBO utility.
- 4.9
- At the decision phase, agent A compares the coalition value with their original utility utilityA and make a decision-if utilityA(AB)>utilityA then formation the coalition with B; if not then they remain as an individual. As to agent B, if utility(AB)>utilityB, they also decide to join coalition AB. Each agent performs the same calculation with all other individual citizen agents N within their talkspan. They choose the coalition (or individuality) that maximizes their utility. Only when both agents agree to join each other can the coalition be created. This is to satisfy the super-additivity requirement that all players in a grand coalition are collectively rational. For an agent with multiple choices, they will choose to join the coalition that has the shortest distance between coalition preference and their own preference. After a citizen agent joins a CBO, their preference changes to the CBO preference.
- 4.10
- One critical element of the BSV calculation is talkspan, which determines the extent of each individual citizen's local social interaction with other citizens when calculating BSV. The BSV algorithm originally looks at all permutations of possible agent parings in coalition formation and thus is exponential. Talkspan defines spatial proximity interactions, ranging from 1 to 20, defining the grid size radius for the local neighborhood. At talkspan of 1, citizens only interact and evaluate BSV coalition formation with direct neighbors, while at 20, citizens can potentially interact with up up to 1200 neighbors. However, this can be limited by low population densities when neighborhood patches are empty given empirical GIS data.
Stakeholder Bargaining Submodel
- 4.11
- For the stakeholder module, we incorporate a non-cooperative bargaining model to reflect competing interests during the siting process. CBOs formed in the first module bargain with agency and NGO stakeholders. Similar to what we have in the first module, agents in this module also have initial preferences and power. Individual utility is calculated with the equation utilityA= (100-ABS(prefA-prefA) * powerA)), which multiplies power by distance between actual preference and original preference. The smaller the distance, the higher the utility. Thus, if an agent does not join a CBO, their utility equals 100 multiplied by their own power. When two agents decide to form a coalition, the coalition preference is calculated by the weighted individual preference: prefAB= (prefA*powerA + prefB*powerB)/(powerA+ powerB). Coalition power is calculated as the sum of individual power: powerAB = powerA + powerB. For each individual stakeholder, their coalition utility is calculated as: utilityA(AB)= (100- ABS (prefA-prefAB)) * (powerA + (powerAB - powerA) * (powerA / powerAB)). The first half of the equation represents the distance between the coalition preference and agent A's own preference. The latter half of the equation shows that power is calculated as A's own power plus the weighted coalitional power gain. Only when both agents' offers are mutually reciprocated can the coalition be created.
- 4.12
- Similar to the CBO module, after each stakeholder calculates their utility and makes a decision, stakeholders and CBOs then bargain in the stakeholder module, updating their preference according to new coalition preferences. In the second round, each coalition calculates their utility to decide if it is better to form a new coalition with other coalitions or individual stakeholders. Simultaneously, each individual in the coalition also calculates the utility of separating from the current coalition and forming a new coalition with someone else. All coalitions and individual stakeholder agents perform the same process at each iteration until no coalition can provide higher utilities for all joining agents.
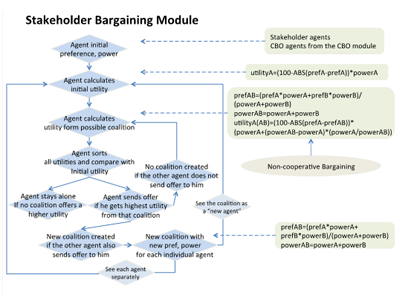
Figure 3. Stakeholder Bargaining Module and Decision Process Interface
- 4.13
- Figure 4 shows the NetLogo interface. The center map represents the techno-social output space with the geo-physical environment. White lines represent separate Census block groups (2010) of Los Angeles, Kern, and San Bernardino counties. The black line indicates the transmission line. Parks are represented in green and yellow. Citizen agents (figures) and CBO agents (faces) are sized by the number of influence messages that they send. Citizen and CBO preference is differentiated by color gradations where red indicates opposition and blue indicates support for the project.
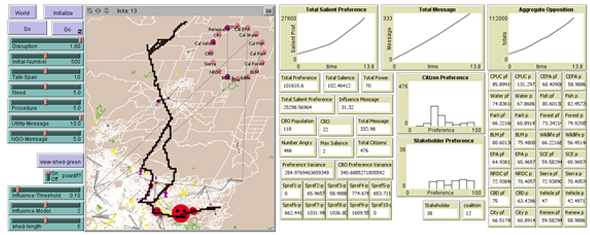
Figure 4. SEMPro Dashboard - 4.14
- The dots arranged in a circle in the upper right quadrant of the map are a static depiction of the 16 stakeholders that comprise the bargaining process. Stakeholders are labeled and their color is set by five preference ranges where blue indicates support and red indicates opposition to the siting project. Data is from stakeholder response surveys described in the data section below. Lines interconnecting stakeholders, individual citizens and CBOs visualize the network of interactive messaging and utility comparison effects at any tick.
- 4.15
- On the left side are ten sliders to control model parameter settings and input data. Disruption indicates the level of physical disruption the proposed siting project causes relative to the existing land use described in Section 3.2. Initial-Number is the sample number of citizen agents we run in the model randomly selected from the census block group data. Talk-Span is the neighborhood grid distance in which citizen agents interact with each other and make decisions on whether or not to form CBOs. Need is the perceived project need as described in Section 3.8. Need can also be an indicator for opposition to any new energy infrastructure project, no matter what its social footprint. Procedure is an indicator for procedural justice, or how the citizens think their preferences will be included in regulatory decision-making. Utility-Message indicates the number of utility, pro-development outreach messages the utility sends to citizens to shape public attitudes. NGO-Message is the number of anti-development outreach messages the NGO sends to citizens to help inform and shape public opinion.
- 4.16
- The three sliders at the bottom left are model processing control switches: for Influence-Model 1 attitude is pent up and then released. At 2 agents convey their attitude every iteration, and at 3 agents convey their attitude every iteration only after reaching a certain value set by Influence-Threshold slider. Here we set the model processing at 2--conveying attitudes at each time step. Shed-length can be adjusted to show the viewshed, the area of disturbance where citizens can see the transmission tower given it's physical height. Powdif calculates citizens' power using education and income census data instead of assigning an equal weight across all citizens. This is useful to explore the socioeconomic impact of political power and attitude formation compared to an explicitly egalitarian siting process.
- 4.17
- On the right side of the dashboard, we display several intermediate plot windows. Aggregated Opposition is the sum all citizen preferences. The larger the number is, the more negative citizens are about the transmission line. Power is the sum of citizens' power, which is a function of the distribution of education and income in the project area. Influence message sums the total number of comments sent by all citizens, which is a function of preference, power, salience, and a random stochastic component. CBO Population is the number of citizens that participate in CBOs, and CBO is the number of CBOs. Number Angry is a quick sum of the number of citizens with opposition preferences over 80. Preference Variance and CBO Preference Variance lists the variance of citizens' preference and CBOs' preference and is a measure of result volatility.
- 4.18
- The Citizen Preference histogram shows the preference distribution of all citizens. This allows us to see a quick sample of public opinion distributions for or against the project by deciles. Stakeholder Preference is a similar histogram, but includes both stakeholders as well as emergent CBOs. We also monitor individual stakeholder and CBO preferences and power at each iteration.
Input data
- 4.19
- In addition to the 2010 US Census block group and GIS data, we also geocoded citizen comments from Southern California Edison's Tehachapi Renewable Transmission Project approved by the California Public Utilities Commission in 2009. Stakeholder data on preferences comes from a web-based survey collected by the authors between July 2011 and July 2013. All other parameters are set at values consistent with either the above empirical data or subjectively set to match project baseline characteristics.
Parameterization and Simulations Experiments
-
Calibration
- 5.1
- The citizen module of SEMPro was validated against historical spatial and citizen outcome data. First, we compared the number of messages generated in the citizen module against the approximately 600 actual comments received during the EIA process for the Tehachapi project from 2007-2009 (California Public Utilities Commission 2012). The mean number of negative comments generated in SEMPro tends to be about 10% less than the actual number. Second, we validate the location of the citizen opposition against the addresses of citizens who submitted written or email comments in the actual EIA process. The model predicts opposition in high residential population density areas, consistent with observed data.
- 5.2
- In previous research we reported the results of applying the SEMPro model to three California case studies of siting transmission lines (Nelson 2011). These case studies presented varied project attributes as well as siting outcomes. The input parameters for each case study were varied to represent project attributes and the resultant outcomes were consistent with observed data.
Simulation Experiments
- 5.3
- We conducted a quasi-global sensitivity analysis by varying all input parameters across their entire range in quintile steps for 20 time steps, which resulted in 2500 runs. All state variables and model attributes were recorded. Specific output variables captured besides the ones detailed above include both preference and CBO preference variance. Pooled OLS estimation was used to create standardized β coefficients for input parameter comparability and model performance.
Results
-
Model Testing
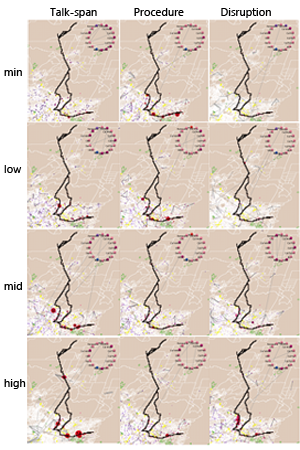
Figure 5. State Variable Levels and Performance - 6.1
- In assessing the overall results of the citizen module in siting opposition, Figure 5 shows the resulting geophysical and political outcomes as a response across four state variable input levels. The size of CBO circles indicates the number of messages sent by the CBO while color indicates support for or against the project, with red indicating opposition and blue showing support.
- 6.2
- In the first column, we see that at minimum levels of talkspan, CBOs are highly dispersed and socially decentralized, with few messages being effectively sent. However, as talkspan increases, we see a decrease in the total number of CBOs, but with many more citizens within a CBO, indicating increased social connectivity increases CBO efficacy. In column two, with procedural justice at its lowest levels, we see strong citizen opposition with red CBOs in high density areas. With high justice levels, purple or pro-development CBOs form in high density areas, and less citizen comments are sent. Column three shows disruption, which at minimum levels intuitively shows no CBOs form. As disruption increases, the number of CBOs, resultant messaging and the strength of opposition increase dramatically. Overall, SEMPro results are consistent with observed data.
- 6.3
- Figure 6 below visualizes the social connectivity of CBOs given individual citizen's political attributes. Individual nodes are citizen agents coded by their unique agent ID number. The size of each citizen node shows the level of betweenness, with larger nodes more socially connected to other individual citizens, with node color showing eigenvector centrality. The lines connect individual citizens to a particular CBO, while the width of the lines shows increasing power. Here we can clearly see for a particular simulation, that CBO formation occurs in clusters, with powerful, highly connected individuals and CBOs in scale free network structure, with little cross individual or CBO connectivity.
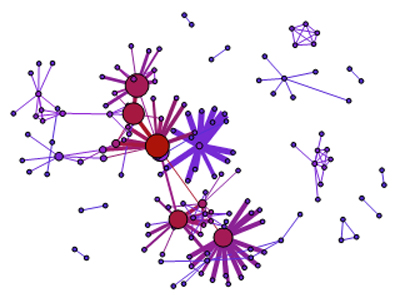
Figure 6. Example Individual and CBO Network - 6.4
- Figure 7 depicts the phase space of average message and average total preference for all simulations, with different utility messaging parameters, ranging from minimal at 1 to high messaging at 10. When utility messaging is minimal, we can see that early on in the simulation trajectory, up to tick 12, we see average messaging increasing rapidly, which we would expect in an environment where the utility is not actively engaged. However, between tick 12 and 15, we see a punctuated equilibria where inaction has direct effects at increasing dissatisfaction among individuals, which subsequently has a transitional impact on the total number of messages sent on the project. Looking at higher utility messaging values of 2 through 10 produce qualitatively different effects of monotonically negative outcomes, where more utility involvement provokes both higher messaging and more anti-project attitudes. These initial results suggest further scaling and calibration, but provide interesting insights on non-montonic, nonlinear effects and potentially harmful assumptions of linear, additive policy actions.
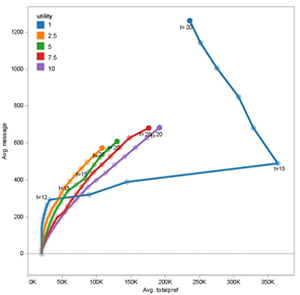
Figure 7. Utility Messaging Policy Impact Sensitivity
- 6.5
- Below we detail global sensitivity analysis for message as our primary dependent variable of interest. Table 1 details the impact of input parameters and intermediate outputs on citizen messages sent to regulators regarding the siting project to explore nonlinearity. β coefficients are standardized so substantive effects can be compared. With an overall R2 of .465, all input parameters are significant. CBO formation has a small positive impact (β = .0116) as expected on citizen comments. Talkspan has a small and significant positive impact (β = .0156) on citizen comments consistent with the observations that CBOs form in larger, less tight knit communities. Total preference is strongly positive (β = .1825) as should be expected, when citizens are more displeased and opposed to the project, they should naturally be more expressive in their comments.
N = 2500. F(7, 2492) = 308.85. Prob > F = 0.0000. R-squared = 0.4645. Adj R-squared = 0.4630. RMSE = .21641.Table 1: OLS on Messages and Policy Lever Heat Map Coef. Std. Err. t P > t [95% Conf. Interval] CBO population .0115831 .0014944 7.75 0.000 .0086527 .0145134 Talk-span .0156573 .003365 4.65 0.000 .0090589 .0222558 Total preference .1825985 .005162 35.37 0.000 .1724763 .1927207 NGO message .0210787 .0013315 15.83 0.000 .0184676 .0236897 Utility message .0045018 .0014406 3.13 0.002 .001677 .0073267 Need -.0044998 .0013699 -3.28 0.001 -.007186 -.0018136 Procedure -.0137265 .0013879 -9.89 0.000 -.016448 -.0110051 _Constant -2.799726 .0627497 -44.62 0.000 -2.922773 -2.67668 - 6.6
- NGO message is significant and positive (β = .0210) as expected as credible NGO messaging can serve as a catalyst for citizen activism. Utility message is positive (β =.0045) but has less impact than other parameters including NGO messaging. This potentially indicates that utility outreach programs may be less effective at shaping citizen opposition in project siting than previously thought. Need is significant and negative as expected, but its impact is minimal.
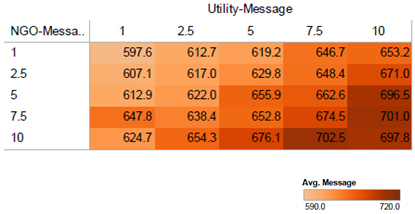
Figure 8. Heatmap - 6.7
- The accompanying heat map in Figure 8 shows the interactive effects of both NGO and Utility message on the resulting number of citizen project comments. High levels of both NGO and utility messaging produce the largest levels of citizen comments, while low levels of both messaging produce the smallest levels of citizen comments. This fits well with polarized project environments where both NGO and utility participation produce citizen activism. Both variables have similar levels of impact. Given that the sensitivity analysis was performed on a particular techno-social space in Southern California, we reserve making broad, generalizable policy conclusions until we can populate SEMPro with multiple siting projects from other regions.
Discussion
- 7.1
- The dynamic landscape around siting sustainable energy provides an environment to test various siting solutions and explore NIMBY (Not In My BackYard) dynamics (Kelly 2011). The simulation results are validated by observed data of the number and location of citizen comments sent to regulators. These results are consistent with the project attributes for the Tehachapi power line engineering attributes as well as the socio-economic and environmental characteristics of the impacted area.
- 7.2
- One of the main theoretical contributions of the research relates to the importance of transaction costs and the size of social communication networks for citizens (Adamowicz et al. 1997). With high costs and low talkspan, citizen opposition is fragmented and policy entrepreneurs such as CBOs arise to transmit citizen opposition. With higher talkspan, increased opposition emerges as seen through stated preferences. However, fewer citizens submit messages as talkspan increases. The total number of messages as a revealed preference is slightly lower with higher talkspan as citizens tend to fend for themselves and do not have CBOs to increase opposition salience, which motivates the decision to send a message. This phenomena is reflected in observed data where only a small fraction of affected citizens actually participate in institutional processes.
- 7.3
- As the role of social media on human behavioral interactions is in vogue currently, we cannot help but to examine the implications of talkspan and spatial proximity. We see interesting and prima facie, counterintuitive behavior. When talkspan is low, the potential social space for individual citizen political preference exchange is small. Under these conditions, we see many, highly dispersed CBOs form given the decentralized nature of politics. As talkspan is increased and the potential social space for coalition formation is large, we do not see an increased number of CBOs form, but a decline in CBO numbers. What we do see at increased talkspan values is increased efficacy, as seen in higher citizens comments, and power of individual CBOs as their potential pool of individual members is larger. From an organizational behavior market perspective, increasing social space seems to decrease the democratization of CBO autonomy, but increases CBO power and efficacy.
- 7.4
- Our global sensitivity results on policy lever elasticity shows at best fallacious, and at worst dangerous, the working assumption of policy monotonicity made by so many decision makers. “More is better” whether on money, outreach, or NGO support is definitely not the case to help getting to yes in our project siting model. Utility messaging efforts are a clear example of this in SEMPro. In specific conditions, increasing utility outreach, townhall meetings and neighborhood coffee meetings can have a positive, informative impact that helps bridge community differences in getting to yes. Under other conditions where NGO engagement and the span of the social neighborhood differs, the exact same utility messaging efforts have dramatic and drastically different, damaging effects.
- 7.5
- SEMPro provides multiple benefits for stakeholders across the siting process. It provides sustainable energy policy leaders with strategic guidance on building stakeholder consensus to move from stewardship to sustainability, including negotiation strategies, identification of potential alliances, communication and educational approaches. It also serves as an platform for ideas about issue framing for successful policy dialogues, as well as scenarios analyses to explore key political, environmental, and regulatory uncertainty and identify which solutions resonate with underserved communities.
- 7.6
- Lessons learned through SEMPro can facilitate energy policy goal achievement and help jurisdictions to prepare for a carbon constrained world. By understanding stakeholder preferences, barriers, as well as potential interventions, regulators and electricity providers may be able to predict resistance to new initiatives while building civic participation among underrepresented groups for effective pathways to environmental stewardship.
Appendix I. Pseudo Code
-
Import GIS data
Set citizen preference and power
Set stakeholder preference and power
Citizens calculate own utility
Citizens calculate expected utility of cooperating with others
  If utility from cooperation is greater than own utility, form a CBO
  If utility from cooperation is less than own utility, stay alone
Citizens update preference and power
Citizens send out messages
Stakeholders and CBOs calculate own utility
Stakeholders and CBOs calculate expected utility of cooperation
  If utility from cooperation is greater than own utility, form a coalition
  If utility from cooperation is less than own utility, stay alone
Stakeholders and CBOs update preference and utility
Citizens in CBOs update preference accordingly
Next run: returns to citizens calculate own utility
References
-
ADAMOWICZ, W., Swait, J., Boxall, P., Louviere, J. and Williams, M. (1997). Perceptions Versus Objective Measures of Environmental Quality in Combined Revealed and Stated Preference Models of Environmental Valuation. Journal of Environmental Economics and Management, 32, 65-84. [doi:10.1006/jeem.1996.0957]
BRAY, S. and Siedschlag, E. (2011). Does the Shoe Still Fit? An Analysis of the Role of Public Outreach in The Transmission Line Siting Process. Presentation at Edison Electric Institute and The National Rural Electric Cooperative Association 2011 Utility Siting Workshop. 2-5 October. Vancouver, BC. October. http://www.eei.org/meetings/Pages/2011-10-5-UtilitySitingWorkshop.aspx
BENNETT, W.H. (2010). Media and influence. In: Kott, A. and Citrenbaum, G. (Eds.), Estimating Impact: A Handbook of Computational Methods and Models for Anticipating Economic, Social, Political and Security Effects in International Interventions. Heidelberg: Springer. [doi:10.1007/978-1-4419-6235-5_5]
BERLO, D.K., Lemert, J.B. and Mertz, R.J. (1969). Dimensions for evaluating the acceptability of message sources. Public Opinion, 33, 563-576. [doi:10.1086/267745]
CAIN, N.C. and Nelson, H.T. (2013). What Drives Opposition to Energy Infrastructure Projects? Land Use Policy, 33, 204-213. [doi:10.1016/j.landusepol.2013.01.003]
CALIFORNIA Public Utilities Commission. (2012). Southern California Edison's Tehachapi Renewable Transmission Project. ftp://ftp.cpuc.ca.gov/gopher-data/environ/tehachapi_renewables/TRTP.htm
CHIU, C. and Lai, S. (2009). An Experimental Comparison of Negotiation Strategies for Siting NIMBY Facilities. Environment and Planning B: Planning and Design, 36, 956-967. [doi:10.1068/b35037]
CORMAN, S.R., Trethewey, A. and Goodall, B. (2007). A 21st Century Model for Communication in the Global War of Ideas. Report #0701, Consortium for Strategic Communication, Arizona State University.
DEVINE-WRIGHT, P. (2009). Rethinking NIMBYism: The Role of Place Attachment and Place Identity in Explaining Place-Protective Action. Journal of Community & Applied Social Psychology, 19, 426-441. [doi:10.1002/casp.1004]
EDISON Electric Institute. (1992). Perceived Impacts of Electric Transmission Facilities: A Review of Survey-Based Studies. Edison Electronic Institute, CA.
FURBY, L., Slovic, P., Fischhoff, B. and George, R. (1988). Public Perceptions of Electric Power Transmission Lines. Journal of Environmental Psychology, 8, 19-43. [doi:10.1016/S0272-4944(88)80021-5]
HENDRY, J. (2004). Decide, Announce, Defend: Turning the NEPA Process into an Advocacy Tool Rather Than a Decision-Making Tool. In: Depoe, S.P., Delicath, J.W. and Elsenbeer, M.A. (Eds.), Communication And Public Participation In Environmental Decision Making. Albany: SUNY Press.
JACKSON, T.O. and Pitts, J. (2010). The Effects of Electric Transmission Lines on Property Values: A Literature Review. Journal of Real Estate Literature, 18, 239-259.
JAY, S., Jones, C., Slinn, P. and Wood, C. (2007). Environmental Impact Assessment: Retrospect and Prospect. Environmental Impact Assessment Review, 27, 287-300. [doi:10.1016/j.eiar.2006.12.001]
JAGER, W. and Amblard, F. (2004). Uniformity, Bipolarization and Pluriformity Captured as Generic Stylized Behavior with An Agent-Based Simulation Model of Attitude Change. Computational and Mathematical Organization Theory, 10, 295-303. [doi:10.1007/s10588-005-6282-2]
KELLY, J. (2011). NIMBY. In: Mulvaney, D. and Robbins, P. (Eds.), Green Politics: An A-to-Z Guide. Thousand Oaks: SAGE. [doi:10.4135/9781412971867.n88]
KETCHPEL, S. (1995). Coalition Formation Among Autonomous Agents. Lecture Notes in Computer Science. 957, 73-88. [doi:10.1007/BFb0027057]
MCPHERSON, M., Smith-Lovin, L. and Cook, M. (2001). Birds of A Feather: Homophily in Social Networks. Annual Review of Sociology, 27, 415-44. [doi:10.1146/annurev.soc.27.1.415]
NELSON, H.T. (2011). Getting to Yes? Stakeholder Simulations of Transmission Project Siting. Presentation at Edison Electric Institute and The National Rural Electric Cooperative Association 2011 Utility Siting Workshop. 2-5 October. Vancouver, BC. http://www.eei.org/meetings/Pages/2011-10-5-UtilitySitingWorkshop.aspx
ROGERS, E.M. and Bhowmik, D.K. (1970). Homophily-Heterophily: Relational Concepts for Communication Research. Public Opinion, 34, 523-538. [doi:10.1086/267838]
SCHOEMAKER, P.J.H. (1982). The Expected Utility Model: Its Variants, Purposes, Evidence and Limitations. Journal of Economic Literature, 20, 529-563.
SIERO, F.W. and Doosje, B.J. (2006). Attitude Change Following Persuasive Communication: Integrating Social Judgment Theory and The Elaboration Likelihood Model. European Journal of Social Psychology, 23, 541-554. [doi:10.1002/ejsp.2420230510]
SUIJS, J. (2000). Cooperative Game Theory. In: Suijs, J. (Eds.), Cooperative Decision Making Under Risk. Heidelberg: Springer. [doi:10.1007/978-1-4615-4637-5_2]
U.S. Census Bureau. Census of Population and Housing. (2010). http://www.census.gov/prod/www/abs/decennial/.
VESPIGNANI, A. (2009). Predicting The Behavior of Techno-Social Systems. Science, 325, 425-428. [doi:10.1126/science.1171990]
WILENSKY, U. (1999). NetLogo. http://ccl.northwestern.edu/netlogo/. Center for Connected Learning and Computer-Based Modeling, Northwestern University, Evanston, IL.
WOOD, C. (2003). Environmental Impact Assessment: A Comparative Review. New York: Pearson.
YEUNG, C., Poon, A. and Wu, F. (1999). Game Theoretical Multi-Agent Modeling of Coalition Formation for Multilateral Trades. IEEE Transmission on Power Systems, 14, 929-934. [doi:10.1109/59.780905]