
 Abstract
- This research develops then merges two separate models to simulate electric vehicle diffusion through recreation of the Boston metropolitan statistical area vehicle market place. The first model is a mixed (random parameters) logistic regression applied to data from the US Department of Transportation's 2009 National Household Travel Survey. The second, agent-based model simulates social network interactions through which agents' vehicle choice sets are endogenously determined. Parameters from the first model are applied to the choice sets determined in the second. Results indicate that electric vehicles as a percentages of vehicle stock range from 1% to 22% in the Boston metropolitan statistical area in the year 2030, percentages being highly dependent on scenario specifications. A lower price is the main source of competitive advantage for vehicles but other characteristics, such as vehicle classification and range, are demonstrated to influence consumer choice. Government financial incentive availability leads to greater market shares in the beginning years and helps to spread diffusion in later years due to an increased base of initial adopters. Although seen as a potential hindrance to EV diffusion, battery cost scenarios have relatively small impacts on EV diffusion in comparison to policy, range, miles per gallon (MPG), and vehicle miles travelled (VMT) as a percentage of range assumptions. Pessimistic range assumptions decrease overall PHEV and BEV percentages of vehicle stock by 50% and 30%, respectively, relative to the EPA-estimated range scenarios. Fuel cost scenarios do not considerably alter estimated BEV and PHEV stock but increase the ratio of car stock to light truck stock in the internal combustion engine (ICE) vehicle spectrum. Specifically, cars are estimated at 55% of ICE vehicle stock in the default fuel price scenario but increase to 62% of ICE vehicle stock in the high world oil price scenario, with LTs covering the appropriate differences.
- Keywords:
- Electric Vehicle, Diffusion, Mixed Logit, Vehicle Choice, Network Effects
Introduction
- 1.1
- Before the Model T, engines were primarily designed to run on steam and then ethanol or biodiesel (Hamlyn 1967). Henry Ford's wife, Clara Ford, drove an electric-powered vehicle; at the time, electric vehicles held a small but substantial-enough niche market with well-to-do urban housewives (Henry Ford Estate 2007; Romero 2009). These vehicle types were quickly phased out by the mass-produced internal combustion engine (ICE) vehicles. Over the past century, automobile enthusiasts have introduced alternative fuel vehicles (AFVs) but none have held a substantial share in the US transportation market. Until recently, electric vehicles (EVs) were primarily put together by the end-users from kits sold by the manufacturer. Now, in 2012, the largest automobile manufacturers in the US have introduced electric vehicles into their model lineup and are pushing forward with research and development.
- 1.2
- Proponents of alternative fuels are challenging petroleum's dominance in the transportation sector. Realizing climate change and energy security benefits, US governments at the state and federal level have incentivized AFV purchases in an attempt to increase deployment. Over the past decade, more than 20 US states have offered financial incentives of various types and the US federal government has offered tax waivers towards the purchase of hybrid electric vehicles (HEVs), battery electric vehicles (BEVs), and plug-in hybrid electric vehicles (PHEVs). Additionally, energy security concerns and the economic effects of national petroleum reliance during periods of substantial petroleum price fluctuation have become more salient following significant gasoline price increases in 2008.
- 1.3
- The two largest, broadly-grouped barriers commonly cited in EV deployment are technological development and social acceptance. The primary concern with the former is the range of the vehicle, typically referenced as "range anxiety," as well as price. The basis for the latter concern is that over this past century vehicles have primarily run on gasoline and, even if they were cost-competitive, EVs still face an uphill battle in being accepted as a primary means of personal transportation. This study models the spreading of individuals' willingness to consider (WtC) electric vehicles EVs through an agent-based model of vehicle innovation diffusion. Agents' social interactions are used to model the spread of WtC and if an agent has exceeded its WtC threshold (i.e. caught the "PHEVer") it will introduce EVs into their vehicle choice sets.
Literature Review
-
System and Agent-Based Models of Vehicle Choice and AFV Diffusion
- 2.1
- The model developed in this paper draws from key strengths included in other recently created, agent-based vehicle choice models (VCMs). The decision-making component of this model utilizes survey data from the 2009 National Household Travel Survey (NHTS; US DOT 2009) to determine vehicle attribute valuation, similar to other past studies (de Haan and Mueller 2009; de Haan, Mueller, and Scholz 2009; Zhang et al. 2011; Cui et al. 2011). In previous agent-based VCMs, researchers have utilized a variant of logistic regression (logit) decision making methods (de Haan and Mueller 2009; de Haan, Mueller, and Scholz 2009; Cui et al 2011; Zhang et al 2011), while other researchers developed mathematical and systems-based estimates of consumer behavior (Struben and Sterman 2008, Sullivan et al 2009; Eppstein et al 2011). Prior research has primarily utilized two methods to incorporate agent attributes into their vehicle choice models. The first method creates synthetic agents from population characteristics (Eppstein et al. 2011; Cui et al. 2011). The second method replicates survey respondents as agents (de Haan and Mueller 2009; de Haan, Mueller, and Scholz 2009; Zhang et al. 2011). Government intervention and manufacturer response functions have also been incorporated into an agent-based VCM framework (Zhang et al. 2011).
- 2.2
- The prior-cited agent-based VCMs generally include the variables of fuel savings and annual income but, unlike most other VCMs, also include media and/or social interactions as influential variables which affect consumers' willingness to consider (WtC) or purchase AFVs. Prior agent-based VCMs model social interactions simulated in a spatially explicit environment (Eppstein et al. 2011; Cui et al. 2011). Researchers have simulated threshold ranges for consideration of an AFV (Eppstein et al. 2011) while others endogenously incorporated the agents' social network conditions into the agents' utility functions, derived from primary research and Bayesian mixed logit methodologies (Zhang et al. 2011). In the majority of cited studies, as well as other models, diffusion aspects are modeled using the theory of homophily which, in its simplest form, theorizes that people's beliefs tend to drift towards those that are similar to them (Schelling 1978).
- 2.3
- Eppstein et al. (2011) created a unique attribute in their simulations which involved a threshold to consider AFVs; simulated interactions among agents impacted their consideration threshold for EVs. The threshold is normally distributed around a mean derived from survey data analyzed by Curtin et al. (2009). The authors initiated the environment such that interactions among agents are done within a social network and develop a heuristic valuation of media and social influences, determined by an agent's susceptibility to as well as the assumed amount of media coverage. The model presented here draws heavily on Eppstein et al.'s consumer interaction framework while incorporating mixed logit parameter estimates.
- 2.4
- Struben and Sterman (2008) developed a framework and model for AFV diffusion based on consumers' WtC AFVs. In their simulations, WtC is affected by total exposure to the platform which is primarily influenced through three main channels: marketing, social exposure from drivers of vehicles, and word of mouth on vehicles from non-drivers. Additionally, consumers gauge the attractiveness of an AFV based on price, performance, operating costs, safety, range, and ecological impact which maintain a dynamic relationship with automobile producers and fossil fuel prices. The model in this paper seeks to be adaptable for several different instances of influential factors indicated by Struben and Sterman (2008) through flexibility in model assumptions and data sources related to fuel costs and vehicle characteristics.
Social Influence as a Factor Affecting AFV Consumers
- 2.5
- Driving a more environmentally-friendly vehicle is greatly influenced by individuals' social networks (Heffner et al. 2005; Kahn and Vaughn 2008; Sexton and Sexton 2010). The role of peer influence on consumer decisions has been observed in multiple past studies. Bearden and Etzel (1982) originated the quantitative assessment of peer influence on consumer decisions using a nested repeated measures design. Their results suggest that peer influence has a strong role in consumer decision-making processes, mostly for those products which are portrayed in public settings. The results of Bearden and Etzel's analysis have been repeated elsewhere (Childers and Rao 1992; Makgosa and Mohube 2007). Similarly, evidence has been found for over 100 different studies in which homophily was present (McPherson et al. 2001). Blending the primary aspects of the aforementioned studies, research has indicated that media and social networks can significantly impact consumer decisions (Aral and Walker 2011a; 2011b) as well as travel model choice (Dugundji et al. 2008; Dugundji et al. 2011).
- 2.6
- Considering that driving a vehicle is a public behavior and people tend to identify themselves and make a statement with their vehicles (Choo and Mokhtarain 2004; Sexton and Sexton 2010), peer influence and social networks can be deduced and have been recognized as an influential determinant of vehicle choice. Realizing these influences on vehicle choice, studies have introduced social and psychological (Bolduc et al. 2008) as well as neighbor effects (Mau et al. 2008) into their VCMs. This study merges homophily with social network effects to endogenously determine the vehicles available in consumers' choice sets, the inclusion being spurred by exceeding agents' WtC threshold through simulated idea diffusion.
Logit Models and Surveys of Vehicle Choice
- 2.7
- Researchers have developed logit models for a variety of purposes to assess vehicle choice and consumer valuation of vehicle features. Whether it is determining the reason behind falling market shares of US automobile manufacturers (Train and Winston 2007), examining the effects of time series variation in gasoline price expectations on the prices and shares of vehicle with different fuel economy ratings (Allcott and Wozny 2010), or gauging whether a consumer will lease or buy a vehicle (Dasgupta, Siddarth, and Silva-Risso 2007), vehicle choice models have been used for a variety of different applications and purposes. The core idea is consistent across all studies: estimating, and in certain cases simulating, consumer behavior and valuation of various vehicle attributes. The research presented here develops a similar discrete choice statistical framework for vehicle choice but determines the power type of vehicles available in each agent's choice set through simulated social network interactions.
- 2.8
- Several VCMs are capable of estimating consumer valuation of fuel economy improvements. Greene (2010) reviewed several past consumer valuation studies of vehicles and fuel economy with various methodologies: mixed logit, nested logit, stated and revealed preference data, hedonic price, and price regression. Fuel economy valuation estimates were found to be rather inconsistent between studies; a finding similar to the United States Environmental Protection Agency's review of fuel economy valuation (US EPA 2010). Greene's analysis and review indicated that consumers were estimated to be willing to pay from <1% up to 400% of discounted present value for fuel economy improvements. additionally, there was no evident explanation for the wide differences among the estimates.
Methods and Model Outline
-
Mixed Logit Model
- 3.1
- For an overview of mixed logit methodology, see Train (2009). Mixed logit has two benefits to the purposes outlined in this model and agent-based models in general. First, it permits a heterogeneous set of consumer valuations of vehicle attributes by allowing agents to place unique emphases, drawn from specific distributions, on the observable characteristics in the choice set. Essentially, mixed logit models estimate both the mean and spread of an explanatory variable's influence on the probably of the dependent variable's occurence. Second, after estimation of parameters, the simulations are straightforward to conduct within an agent-based framework.
- 3.2
- Logit models are often referred to as random utility models (RUMs); the main purpose of a RUM is to estimate and evaluate utility functions based on different product attributes. Within a RUM context, this mixed logit model's RUM representation is:
(1) Where:
Ui,j: Utility of observation i for vehicle j
Cj: Class of vehicle j (e.g. CUV, SUV, sedan, etc.)
HPj: Horsepower of vehicle j
FPj: Foot-pound of torque of vehicle j
Safetyj: Safety rating in stars of vehicle j
K: Income category (low, middle, high)[1]
Dk: Dummy variable for income category k
MSRPj: Manufacturer's Suggested Retail Price of vehicle j
DPGi: Dollars per gallon of gasoline for observation i during month of purchase, by state
MPGj: EPA miles per gallon estimate of vehicle j
VMTi: Average daily vehicle miles travelled of observation i - 3.3
- Explanatory variables in this paper's mixed logit model are representative but non-exhaustive (due to data limitations) of those found in the studies reviewed by Greene (2010). The daily gas cost (DGC) variable is the product of state-level price per gallon of gasoline at the month of purchase divided by the respective vehicle's miles per gallon of gasoline (MPG) and the average daily vehicle miles travelled. Manufacturer suggested retail price[2] (MSRP) and gasoline prices are adjusted to January 2011 dollars using the consumer price index. Different classes of vehicles are implemented as dummy variables; all class dummy parameter estimates are in reference to the convertible class baseline and defined by Ward's (2011). The geometric mean of torque, in foot-pounds, and horsepower parameters at the Wards-measured engine rotations per minute (RPM) is used as a measure of vehicle performance; for simplification this will be referred to as the 'power' variable. This variable's form proved best after three prevailing conditions were observed:
- Including both parameters separately in the same model introduced collinearity issues.
- The form provides a significantly higher addition to the log-likelihood estimate for each market sector than either parameter individually.
- The geometric mean provides a significantly higher addition to the log-likelihood estimate for each market sector than only the product of the two terms
Table 1: Mixed Logit Regression Parameter Results Parameter Estimates[4] Grouping Single, No Children Single, With Children Married, No Children Married, With Children Retired Sedan 2.433**** 0.981** 1.735** 1.653*** 1.618*** CUV 3.069** 1.272*** 1.704**** 1.954** 1.447*** Pickup 2.040**** -0.271*** 1.538** 1.308** 1.294* SUV 2.067** 0.554** 1.184**** 0.8509**** 0.467** Coupe 2.841*** 0.323* 0.769*** 1.223**** 0.537** Hatchback 2.136**** -0.483* -0.021* 0.465**** 0.101* Wagon 0.415*** 0.746** -0.125** 0.978*** -0.464*** Van 1.725*** 1.261**** 0.834** 1.732*** 1.380**** ln(Safety) 2.105** 2.958*** 2.583*** 3.25**** 2.852*** ln(Power) 2.41*** 1.950** 2.521*** 1.99** 2.64*** ln(MSRP_Low) -4.267*** -5.067** -4.233**** -4.853*** -3.991**** ln(MSRP_Mid) -3.426** -4.396*** -3.509**** -4.299*** -3.525*** ln(MSRP_High) -3.044*** -3.904** -3.474*** -4.274*** -3.177*** ln(DGC_Low) -2.937** -2.126*** -2.592**** -2.769*** -2.678**** ln(DGC_Mid) -2.556**** -2.942*** -2.825**** -2.726**** -2.359*** ln(DGC_High) -3.29*** -1.993** -2.254*** -1.985*** -2.654**** Standard Deviation ln(Safety) 0.985** 0.568* 0.795*** 0.689*** 0.897** ln(Power) 0.567*** 0.298*** 0.354*** 0.453** 0.378*** ln(MSRP_Low) 0.614** 0.490** 0.693**** 0.772**** 0.595**** ln(MSRP_Mid) 0.524** 0.596** 0.594**** 0.658*** 0.595*** ln(MSRP_High) 0.673** 0.880* 0.792** 0.635** 0.839** ln(DGC_Low) 1.252** 1.013** 1.375*** 1.235*** 1.2943*** ln(DGC_Mid) 1.341*** 1.198** 1.125*** 1.123*** 0.986*** ln(DGC_High) 1.120*** 1.001** 1.135** 1.356*** 0.978**** Number of Observations 2136 527 17978 2162 10432 Log-Likelihood -8.5E+6 -1.7E+6 -5.4E+07 -3.3E+6 -1.4E+07 Social Actors and Behaviors
- 3.4
- Each model agent is parameterized for every NHTS survey respondent from Metropolitan Statistical Area (MSA) groupings[5] (US DOT 2009). The agents are located in their environment by region and then to the furthest extent possible, down to the MSA and then further placed accordingly by the respondent-indicated population density at the tract-level county subdivisions (US Census Bureau 2012). Location attributes are implemented to control for possible correlations among agents' demographics and their location. The agents are randomly located in an orbital fashion around the city center with distance dependent on the population density records in the 2009 NHTS, the individuals with higher reported densities being closer to the city center.
- 3.5
- The agents are originally limited to explore options within the fuel type class of their currently-owned model[6] but will explore other options after their individual consideration threshold has been met through simulated social interactions. Interactions with four neighbors are implemented to incorporate the similarities with lattice neighborhoods models, by which the idea diffusion equation is heavily influenced.
- 3.6
- Corresponding with the beliefs of peer influence on consumer decision making and homophily, as well as Eppstein et al.'s (2011) vehicle consideration functions, interactions modeled by Molofsky et al (1999), Struben and Sterman's (2008) implementation of fractional decay, and considerable inspiration from Hiebeler (forthcoming), consumers' willingness to explore other vehicle types in their purchase decision is modeled using the following equation:
(2) Where:
Ev,i,t: Willingness parameter for agent i during time t to consider vehicle type v
F: Annual fractional decay rate
j: Other agents within the agent i 's social network
J:Total number of agents with which agent i interacts
v: Vehicle power type (Hybrid, Plug-in Electric)
(3) W(j_i),t : Referenced as a similarity index[7] p: Agent trait index (age, income, highest educational attainment) Cp: Characteristic of type p of agent i or j
- 3.7
- When Ev,i,t exceeds the randomly-assigned heterogeneous threshold for vehicle consideration the consumer will consider (through mixed logit derived parameters) vehicle options from vehicle power type, v. Within the model, the option exists to allow for agents only to consider BEVs if another member of the household has a vehicle which is not a BEV. The heterogeneous threshold is a crucial component of the analysis and thus a target of sensitivity analysis. Last, if the agent does not purchase an AFV in that year, their present WtC decreases at a fractional decay rate, similar to Struben and Sterman (2008).
- 3.8
- Figure 1 provides an overview and pseudo-code of the decision making sequence for each agent. Order is determined by which agent has the least amount of time remaining in vehicle ownership; ties are settled by coin flips. The table following Figure 1 provides a legend and information regarding the variables presented in Figure 1.
Figure 1. Flow Chart of Agent Decision-Making Variable / Index Agent (A) or
Global (G)Description Neighbors A Other agents in social network Attributes A Attributes of agents i A Focal agent j A Other agent TraitRatio A W(j|i) in interaction equation SimIndex A Numerator in second portion of interaction equation VEH G ICE, Hybrid, or Electric T G Year DecayRate G Fractional decay rate of WtC from (T-1) to T MonthsRemaining A Months remaining in vehicle ownership YearsToOwn G Years of ownership of new vehicle purchasers HybridsSold G Hybrids sold in year T AllVehSold G All vehicles sold in year T MaximumMarketShare G Maximum vehicle penetration rate from NEMS AllHybridsSold G All hybrids sold up to year T MAN G Manufacturer index PopRatio G P' in incentive availabity equation NationalVehicleSales G Total, national vehicles sold from 2012 to year T IncentiveLimit G Incentive limit on number of vehicles sold MSRP G Manufacturers' suggested retail price HybModel G Index of hybrid models iH A Other agents in i's household DailyVMT A Survey reported average daily VMT Range G Estimated range of BEVModel, given assumption K BEVsSold G Number of BEVs sold in year T AllBEVsSold G All BEVs sold up up to year T BEVModel G Index of BEV models BatCost G Battery cost from UK CCC's battery cost report (2012) Class G Car or Light Truck ChargerCost G Cost of charging equipment PresentValueBatDep G Present value of battery depreciation DiscRate G Discount rate, assumed at 7% AllPHEVsSold G All PHEVs sold up to year T PHEVModel G Index of PHEV Models DGC A Daily fuel cost in year T DPGGE G Dollars per gallon of gasoline equivalent MPG G Miles per gallon of gasoline equivalent MPGROC G Miles per gallon rate of change (ANL 2012) DailyVMT A Daily vehicle miles travelled VehChoice A Vehicle selected which maximizes i's utility Utility A Utility from vehicle models ChoiceSet A Vehicle choice set of agent ML_Parameters A/G Agent's mixed logit parameters from global distributions R G Number of repetitions for utility calculations, Train (2009)
Data
- 4.1
- Figure 2 summarizes the various data sources and their respective purposes in each model.
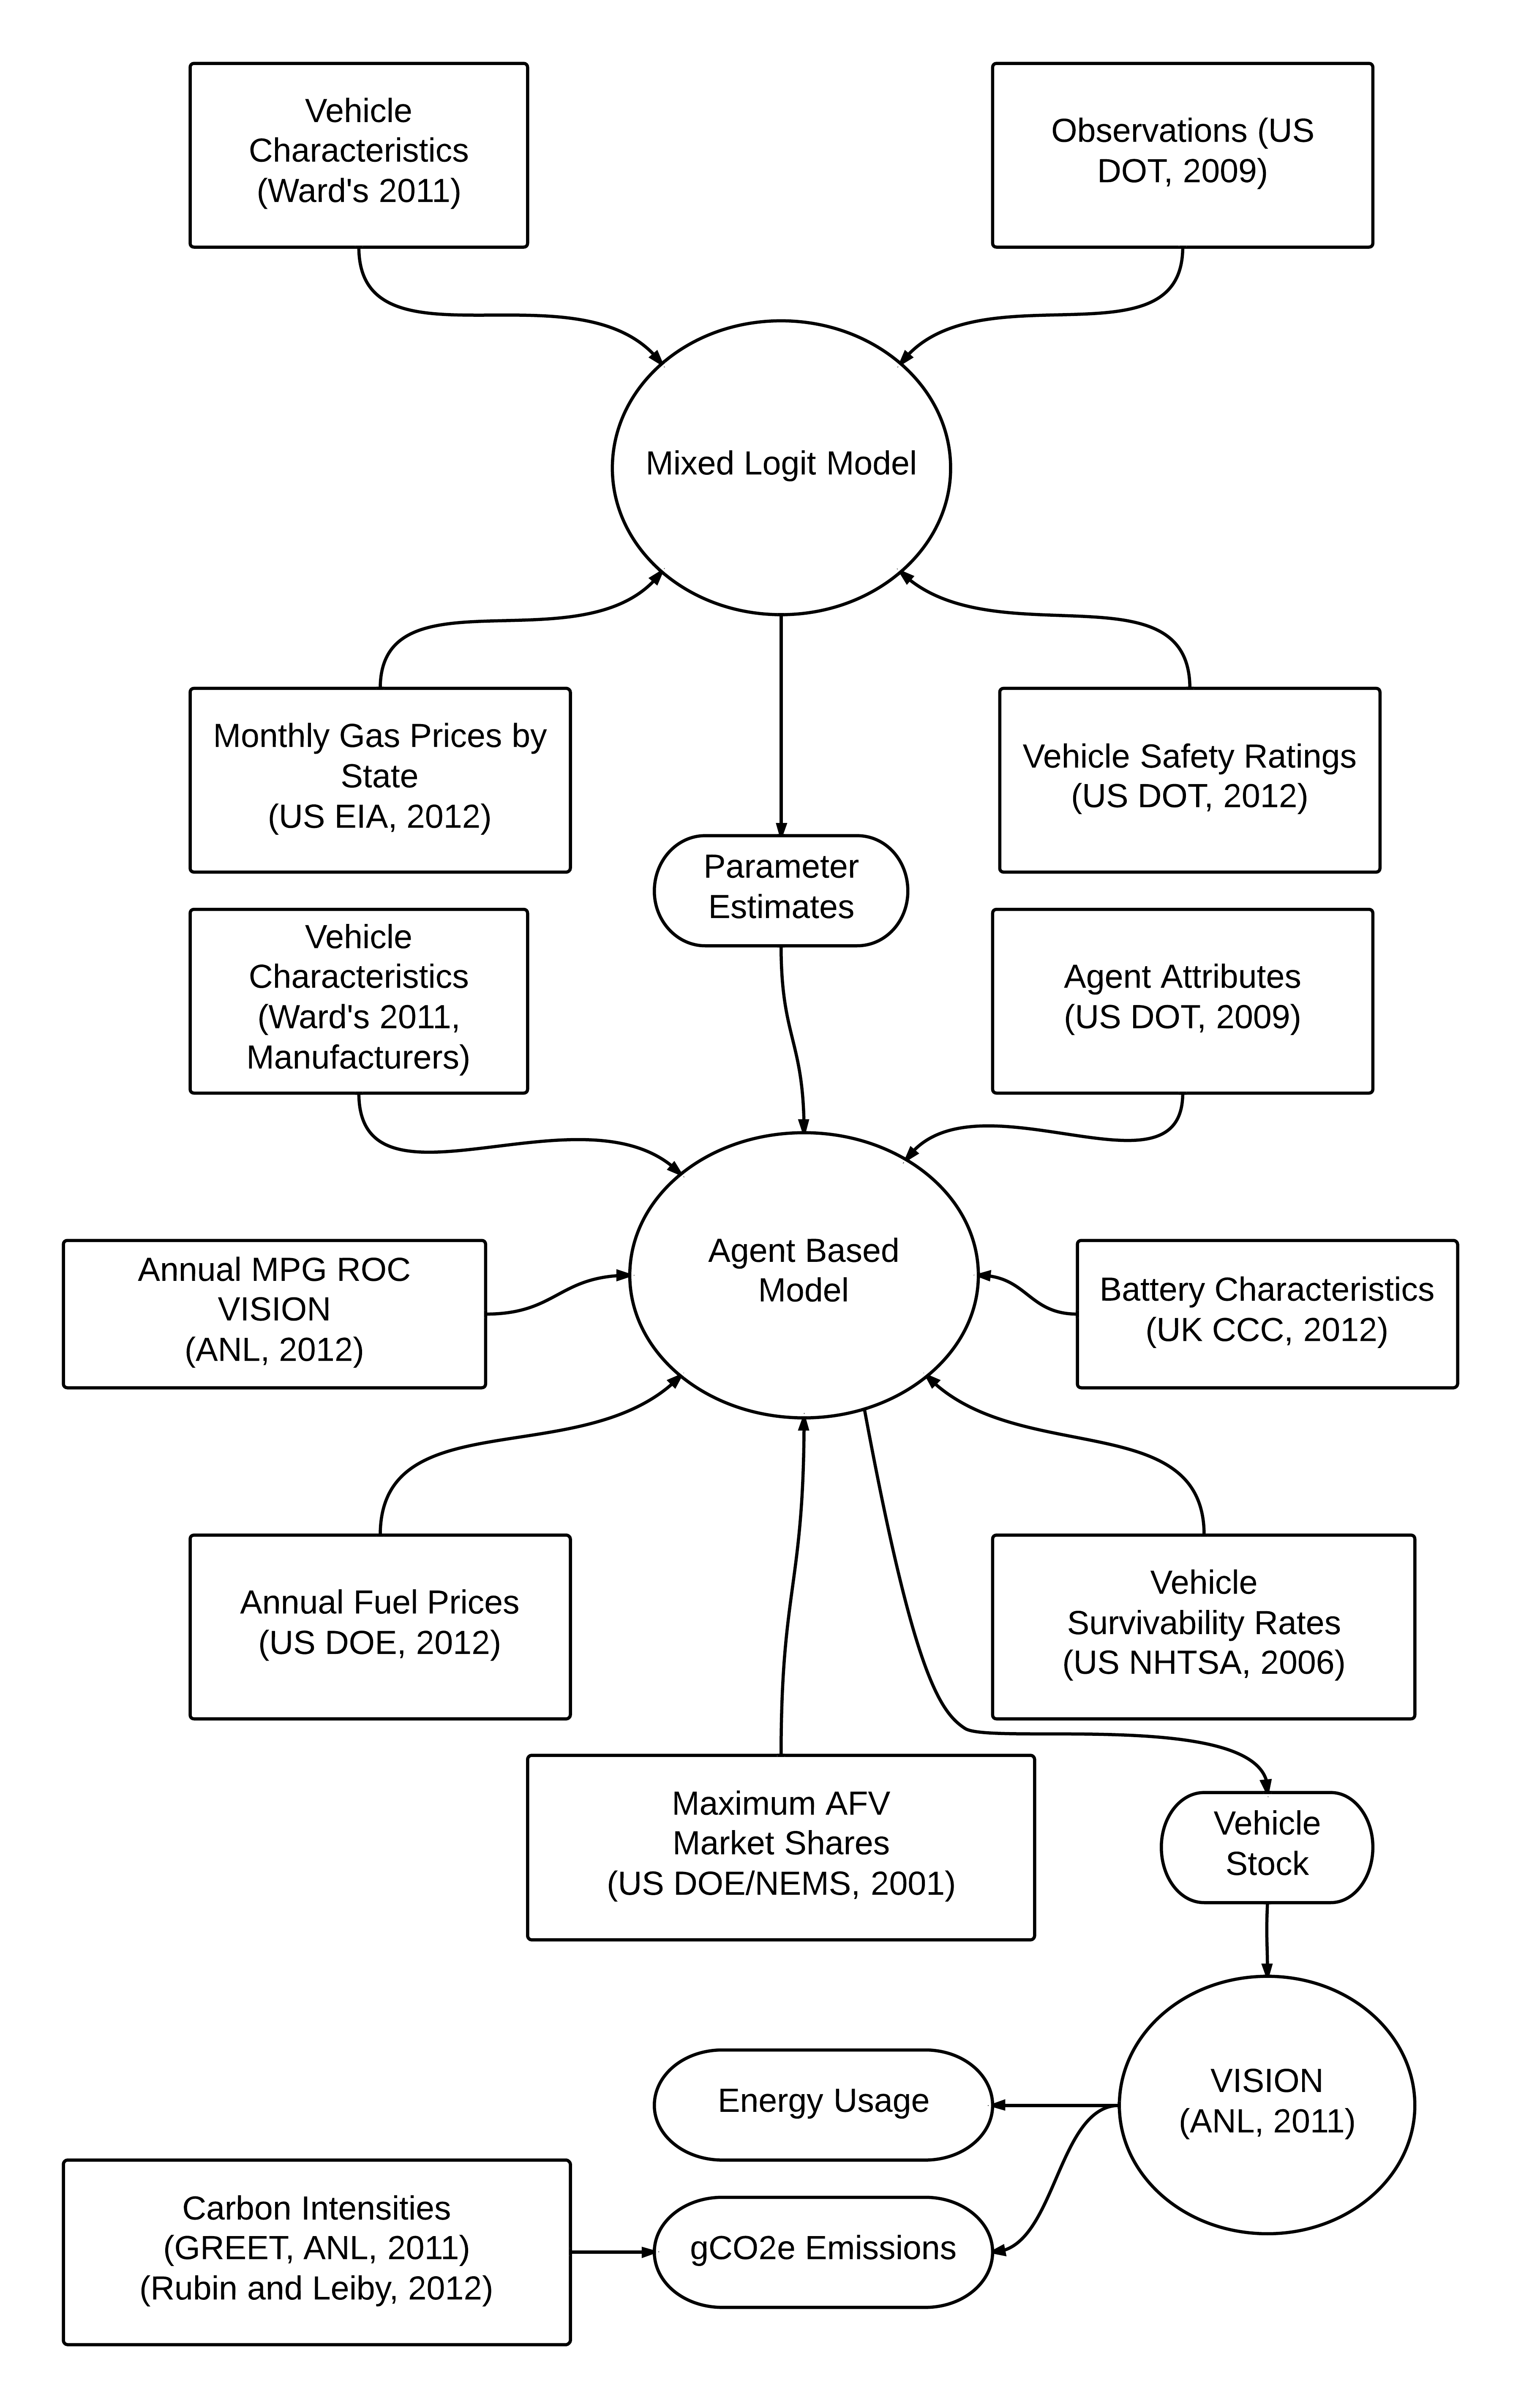
Figure 2. Map of Data Flow - 4.2
- The largest source of data detailing agent attributes is the 2009 NHTS (US DOT 2009). The 2009 NHTS is a nationally representative survey of travel behavior conducted from April 2008 through April 2009. The 2009 NHTS sample size was 150,147 households, including a national sample of 25,000 households and separate samples from twenty state Departments of Transportation that together added 125,147 completed households. These two sample units brought the 2009 NHTS sample size to approximately 150,000 households and 300,000 people.
- 4.3
- The second main source of data, related to vehicle characteristics, is Ward's Automotive Information Products (2011). These data entail detailed characteristics of vehicles produced from 2004-2011 which were available for purchase in the United States. These data were purchased in July 2011. The NHTS 2009 does not supply detailed automobile information in their publicly available data files but National Automobile Sampling System (NASS) codes are provided which are used to match each observation's vehicle to its respective attributes. NASS vehicle codes used in this analysis were extracted from the Department of Transportation's (DOT) manual (NHTSA 2011). Another requirement to produce the final data set was the collection of safety data measured in the average stars. These data were retrieved through the US DOT (via SafeCar.gov; US DOT 2011). Future vehicle specifications are explained in APPENDIX 2.
- 4.4
- Although multiple data sources are utilized to allow for assumptions on vehicle attributes, it is not entirely realistic to assume that specific model types used to calibrate the model (e.g. a 2012 Ford Focus; see APPENDIX 2) will still be around by 2030. Instead the model's results should be understood and interpreted that the market shares of a mid-class vehicle with attributes similar to said vehicles is likely to grow or shrink by 2030 compared to other vehicles characterized through data assumptions related to future vehicle attributes.
- 4.5
- The price of gasoline at the individual state level during the month of purchase (Energy Information Administration 2011), based on the difference between month when the survey was taken and stated months of ownership, was matched to each vehicle and household observation. Costs per mile and daily gas costs were then computed for each vehicle choice available to the consumer. Survey research indicates that vehicle consumers normally do not or erroneously calculate annual fuel costs (Kurani and Turrentine 2004), thus the fuel costs for the time at purchase are included and daily VMT is used to scale observations based on their average amount of driving. Average gasoline prices throughout 2011 at the state level are used as the reference points during the initial time period and then the gasoline price is adjusted according to the 2012 Annual Energy Outlook's (AEO; US EIA 2012) marginal annual rate of change. These values remain in constant 2011 dollars throughout projected periods. In the US Department of Energy's (US DOE) National Energy Modeling System (NEMS;US DOE 2001), the market shares of any vehicle type are calculated using a combination of vehicle and population characteristics as well as technology costs and regulatory costs implemented on manufacturers to improve fuel economy. Within NEMS, the maximum values for alternative fuel car and light truck market shares are dependent on the past time period's market share, car vehicle markets being more responsive and flexible than the light truck market shares. Within this paper's model, these data determine the maximum amount of AFVs available by class given extensive demand; this is to reflect producers' responses and ability to adjust manufacturing schedules. A future extension of this model would be the inclusion of a dynamic manufacturer profit maximization function similar to Zhang et al (2011). The limits for maximum market shares are computed following individual agents' choices.
- 4.6
- Survivability rates by age schedules are needed to accurately estimate vehicle expiration rates. Vehicle survivability rates are taken from the US DOT National Highway Traffic Safety Administration's (NHTSA) 2006 technical report (NHTSA 2006).
- 4.7
- To compute the grams of carbon-dioxide equivalent (gCO2e) emissions and subsequently Average Fuel Carbon Intensity, the gCO2e/MJ of electricity are taken from the Greenhouse Gases, Regulated Emissions, and Energy Use in Transportation (GREET) Model (Argonne National Laboratory 2011). The carbon intensities for blended motor gasoline are computed using values from the Transportation Regulation and Credit Trading (TRACT) model (Rubin and Leiby 2012).
Vehicle Purchase Incentive Policies
- 4.8
- As the results section of this analysis focuses on the State of Massachusetts and more specifically the MSA of Boston, only the federal incentive will be offered on vehicles. The federal incentives from the Plug-In Electric Vehicle Credit in the amount of $7,500 are available until a limit of 200,000 vehicles nationally sold per manufacturer is reached (IRC 30 and IRC 30D;Internal Revenue Service 2011). The incentive is applied in the model until the proportion of vehicles that have been purchased of that vehicle type is greater than or equal to the same proportion relative to the estimated national vehicle fleet from the 2012 AEO (US EIA 2012). For example, if a specific EV were to reach 20,000 total sales and the MSA has 200,000 vehicles sold already, then the amount assumed to have been sold on a national level is 10% of the projected national vehicle sales up to that year. Essentially, if
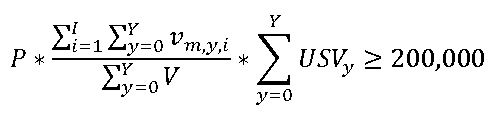
(4) then incentives are not included on vehicle manufacturer m 's model(s).
Where:
P: Population adjustment factor[8]
v: Vehicles sold from manufacturer m of model i
m: Index of vehicle manufacturers
i: Index of vehicle models
V: All vehicles sold in simulated market in year y
Y: Current year
USVy: Amount of vehicles sold in the US in year y - 4.9
- Since the hybrid and EV federal tax credits are available on a per-manufacturer basis, this rate is applied only to vehicle manufacturers that have not exceeded the limit as of May 2012, as indicated by Advanced Fuel Data Center (AFDC, 2012). Additionally, the national amount of vehicles sold, as indicated by Wards (2011), of each manufacturer's incentive-eligible vehicles is deducted from the federal incentive's thresholds. The same rule regarding proportions of EVs is present in determining availability of hybrid vehicle tax incentives. Although a phase-down period exists following the expiration of incentive availability, the scope of time is arbitrary relative model time scale.
Results
- 5.1
- The model is capable of importing agent characteristics from several different metropolitan statistical areas (MSAs). This set of sensitivity analysis and results focuses on the Boston Massachusetts MSA which has a good balance of:
- High survey response rate
- Representative population proportions to those present in the mixed logit parameter estimation data
- Adequate number of agents to reliably demonstrate core concepts and model dynamics without constraining result production and analysis through limits on computer resources
- The limited amount of publicly available higher percentage biofuels and CNG stations available (AFDC, 2012) minimizes potential concurrent effects from other alternative transportation fuels
- 5.2
- The range of forecast years is set at 2009-2030 throughout this results section. The model can forecast out further (to 2100) while keeping several variables constant at the 2030 level[9], but the additional time required to run the simulations out to 2100 and the declining reliability of simulations deterred the author from extended-range forecasting.
Sensitivity Analysis of Core Model Parameters and Assumptions
- 5.3
- Results presented within this and other sections are the average over a burn-in of 250 runs. Recognizing that initial conditions impact outcomes of networked discrete choice models (Dugundji and Gulyás 2013), agent location and WtC thresholds are reset at the beginning of each simulation. As opposed to various scenario results, this section explores the different implications that underlying fundamental model assumptions have on estimated results.
Table 2: Potential Scenarios for the Vehicle Marketplace Model
Item in Secondary LegendTranslation Potential Values Mean WtC Mean WtC Parameter Eager
Neutral
ReluctantWtC FD Rate Annual Fractional Decay Rate of WtC Values 0.5
0.75
1Econ Scen Economic Scenario Business-As-Usual (BAU)
Low Economic Growth (LEG)
High Economic Growth (HEG)Pop Ratio Population ratio for policy analysis 0.5
1
2Bat Scen Battery costs scenario Business-As-Usual (BAU)
Conservative
OptimisticVMT as Range Limit Percentage of daily VMT which the BEVs range has to be in order to consider 50%
75%
100%MPG Miles-per-Gallon/GGE EPA
MFRRange Range of BEV and PHEV C&D
EPA
MFRFuel Price[10] Gasoline and electricity price scenarios Business-As-Usual (BAU)
High World Oil Price (HWOP) - 5.4
- A driving assumption behind the vehicle consideration component of the agent-based model is the distribution of WtC thresholds. In the first graph, the percentage of the agents which have surpassed their personal threshold is plotted over time for various threshold means and a constant fractional decay rate of 0.75, indicating that each agent's WtC is 75% of the prior periods. The lower limit fractional decay rate is set at 0.5, approximately the decay rate with which decay becomes too severe and no one considers EVs. Thus, a decay rate of 1 indicates that agents' WtC does not decline between time periods. In the analyses, the decay rate is assumed at 0.75 and thus the resulting eager, neutral, and reluctant scenarios' percentages of population exceeding WtC thresholds are displayed in Figure 3.
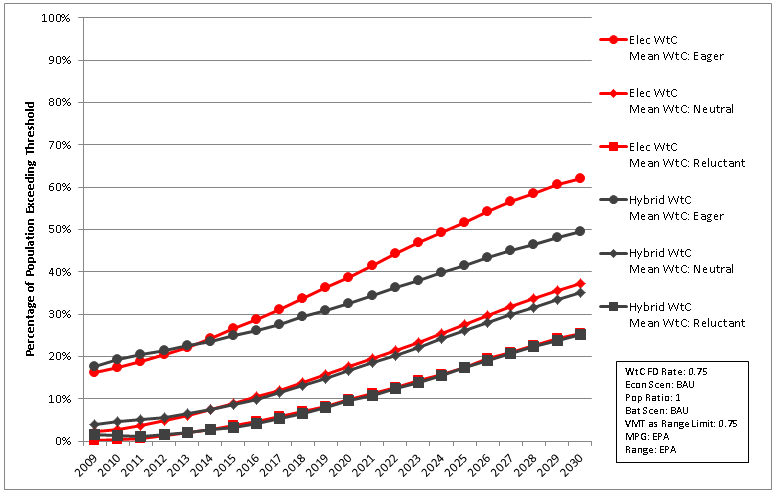
Figure 3. Comparison of Mean WtC with Decay Held Constant - 5.5
- A recurring, and especially noticeable with the eager scenario, result is that even though the WtC for EVs begins at a slightly lower point (since hybrid owners already exist) it increases at an increasing rate following the spread induced by initial adopters. Note: the beginning percentages of population exceeding the threshold is greater than zero since the left-hand tail of the normal distribution passes over the Y-axis while WtC values are assumed to range between 0 and 100.
- 5.6
- An interesting and important aspect regarding the assumption of mean WtC is the amount of diffusion, measured in this analysis as the percentage of vehicle stock of each vehicle type. As shown in Figure 4, the mean WTC assumption has varying yet profound effects on the diffusion of different vehicle types. In conjunction with aforementioned parameter assumptions, the values demonstrate the effects of the different mean WtC thresholds. Notably, the diffusion rates of change roughly resemble the exponential growth function, representative of product diffusion theory (Rogers 1963).
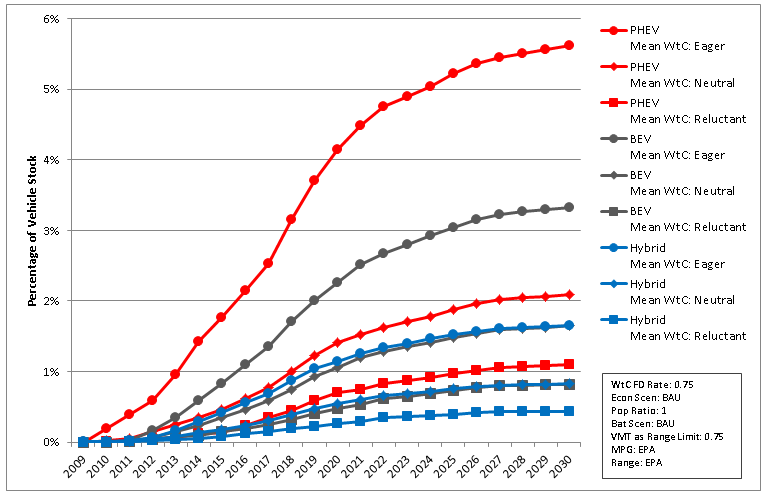
Figure 4. AFV Stock Percentages with Different Mean WtC Thresholds Incentive Policy Population Ratio
- 5.7
- The 2012 Annual Energy Outlook (AEO;US DOE 2012) estimates great variability in regional usage of alternative fuels. Given that other regions are estimated to have different usage rates of FFVs, CNG vehicles, and EVs, assuming a one-to-one ratio of national vehicle sales to Boston MSA vehicle sales could hinder reliability by skewing national EV consumption estimates. A ratio greater than one indicates that a lesser amount of the national EV incentives are available to the Boston MSA residents than other areas. Because of the multiple concurrent policies related to AFV deployment and alternative fuel usage (e.g. the California Low Carbon Fuel Standard and the Renewable Fuel Standard revised under the Energy Independence and Security Act), the ratio of Boston MSA vehicle stock to national vehicle stock becomes a focus of incentive policy structure sensitivity analysis.
- 5.8
- The most pertinent result from the incentive policy structure analysis is that the greater availability of incentives in the beginning periods adds to the base of initial adopters which in turn increases the overall spread of WtC over the modeled periods. An incentive-dependent population ratio that is beneficial for the Boston MSA (i.e. Population Ratio < 1) results in a higher overall stock of evs but percentages of vehicle stock by model have varied responses. both vehicles estimated to have the highest stock levels, the focus and volt, incur relatively lesser increases in estimated vehicle stock with increased incentives. the miev, given its unfavorable categorization of a hatchback (based on mixed logit parameter estimates) but lower msrp, incurs the largest relative increase with greater availability of incentives as the vehicle's lower msrp begins to outweigh the generally relative disutility of being a hatchback. from observing the characteristics of buyers by model of ev, prius purchasing is primarily done by drivers with very low vmt and lesser aversions to msrp. given that the prius and rav4 are both produced by the same manufacturer the availability of incentives, and thus estimated percentages of vehicle stock, are interdependent.
Effects of MPG and Range Assumptions
- 5.9
- Estimates of range have been produced from manufacturers (MFR), the government through the Environmental Protection Agency (EPA), and Car and Driver (C&D). Additionally, MPG rates have been measured by manufacturers as well as the EPA. In this section, the simulations are conducted with these six different assumptions on the range and MPG of electric vehicles. Results indicate that, similar to the sensitivity analysis involving the limit of daily VMT as range, the estimated range of BEVs has a critical impact on the deployment of electric-only vehicles. The overall percentage stock of vehicles varies by nearly 1.2% from the optimistic (MFR) to the pessimistic (C&D) estimates of BEV range. Hybrid vehicles are also influenced by the various assumptions of BEVs and PHEVs; when the range estimates come from the most pessimistic source, hybrid vehicles' 2030 percentage of vehicle stock increases by approximately 0.6% over the other most optimistic range assumptions scenarios. Similar to BEVs, PHEVs as a percentage of vehicle stock are significantly impacted by the various range and MPG assumptions yet the effect is much more substantial between the EPA and C&D scenarios which entail an estimated 1% decrease in percentage of vehicle stock in 2030.
Battery Characteristics
- 5.10
- Although seen as a potential hindrance to EV diffusion, the different characteristics of battery costs have relatively small impacts on EV diffusion in comparison to policy, range, MPG, and VMT as range assumptions. In comparison to the other primary financial-centric model mechanism of policy population ratios, the 2030 estimates for battery costs vary by approximately $1000-$2000 whereas the financial incentives reduce the MSRP by $7500 in the beginning years when EVs are still relatively expensive, adding to the base of initial adopters and encouraging WtC diffusion.
- 5.11
- Even the optimistic battery scenarios could be significantly overestimating the future costs of batteries. The batteries and EV portion of the American Recovery Act (US DOE 2012) anticipates that investments in batteries alone should help lower the cost of some electric car batteries by nearly 70% by the end of 2015, with the largest proportion of vehicle cost reductions occurring between 2009 and 2013. Additionally, the American Recovery Act anticipates that the expected lifetime of a typical EV battery will increase by 350% in the same time period, allowing the battery to last up to and potentially beyond the vehicles' anticipated lifetimes and decreasing the present value of battery depreciation over ownership periods. The UK CCC modeled changes in EV battery costs are much less optimistic and with the American Recovery Act's assumptions[11], total EV diffusion is increased by approximately 0.85% over the optimistic scenario by the UK CCC. Other vehicle characteristics themselves which would be affected in these scenarios are simplified in this portion of the analysis and would likely play a major role in consumer decision-making.
High World Oil Price (HWOP) Scenario
- 5.12
- For this scenario, the rates of change of all fuel prices were adjusted using the HWOP data from the AEO 2012 (US EIA 2012). The estimated effect that the HWOP conditions had on EV stocks was minimal, but the effects on the ICE portions of vehicle stock of cars and light trucks (LTs) are worth mentioning. Consumer substitution of LTs for cars increases the estimated stock of cars by approximately 5.1% by 2030 in the HWOP scenario over the BAU scenario. Figure 15 displays the Car and LT percentages of ICE stock under the BAU and HWOP scenarios. In the HWOP scenario, the stock of cars is expedited due to the relatively large gas price marginal rates of change estimated in the first few years of simulations. Following the early greater divergence from the BAU scenario ICE stock percentages, the HWOP car and truck ICE stock percentages adjust at less intense rates but still more rapidly than in the BAU scenario.
- 5.13
- With respect to Figure 5, there is an innate institutional and market place lag associated with shifting stocks and thus gas price increases will not force immediate shifts of vehicle characteristics. Although it is intuitively expected with rising gas prices that LT percentages of vehicle stock would immediately fall, agents with higher aversion to DGC are seeking higher MPG LTs as well as alternative, non-ICE vehicles which meet these standards. Additionally, survivability rates from NHTSA favor LTs slightly more than cars. For some agents, in the later years, with an increased disutility of increased DGCs, they are willing to sacrifice the purchase of an LT categorized vehicle for a car.

Figure 5. Percentage of ICE Stock by Vehicle Type and Fuel Price Scenario[12] Most Optimistic Scenario
- 5.14
- In this scenario, the most optimal conditions are set to investigate the upper bound on EV diffusion; these conditions are to have optimistic battery costs, eager WtC, no WtC decay, 0.5 Population Ratio, and manufacturer-estimated MPG and range. The VMT as Range Limit is left at 0.75 since this component has been shown to not have a considerable impact on BEV diffusion over the full-range scenario but is necessary to maintain realism in agents' BEV considerations. When the opposite (most-conservative) simulations are conducted, percentages of vehicle stock of BEVs and PHEVs approach zero and hybrid vehicles' percentage of vehicle stock is estimated at approximately 0.25% by the year 2030. In the most optimistic scenario, PHEVs and BEVs are estimated to maintain 12.2% and 8.4% of vehicle stock in 2030.
Discussion
- 6.1
- Results from this analysis are highly variable depending on model specifications with the underlying core parameters having the highest influence on resultant scenarios. This reflects the wide range in potential model inputs as well as the agent-based model's assumptions. Recent survey work has indicated that a majority of consumers are either likely or moderately likely to consider the purchase of an AFV, with the two most deterring aspects being vehicle prices and refueling options (Michniak et al. 2012). Thus, it may be more appropriate to assume an eager mean WtC. Neutral scenario results were displayed to provide conservative estimates and the main intention of this paper's results section is to demonstrate model dynamics from imposed scenario assumptions. To develop the 'true' mean WtC distribution, further purpose-specific primary research is required to quantify consumers' willingness to explore AFV options; this source of uncertainty is the model's largest shortcoming in terms of external validity.
- 6.2
- Hybrid and Plug-in EV (PEV) percentages of vehicle stock and market shares are demonstrated to be interdependent. When the characteristics of PEVs are improved to make said vehicles more desirable with respect to consideration assumptions[13] and mixed logit derived parameters, hybrid vehicles are displaced by the more attractive PEVs; this displacement is especially evident in scenarios involving range and MPG assumptions. At the same time, this model does not take into account how learning-by-doing in the supply chain by PHEVs and BEVs assisting improvements in one another. That is, even if PHEVs displace BEVs in early years, they help develop and lower the cost of technology that can assist BEVs.
- 6.3
- Similar to past studies of financial policy efficacy (Gallagher and Muehlegger 2011), hybrid vehicle percentages of vehicle stock are estimated to be responsive to financial policy availability assumptions. In these simulations, hybrid vehicles are estimated to be the most responsive in terms of percentage of vehicle stock. Financial policy efficacy is not particularly evidenced for the PHEV percentages of vehicle stock as their higher MSRP and lower consideration rates in the beginning years, even with the incentive, is a major deterrent to diffusion. Estimates of BEVs as a percentage of vehicle stock rise substantially more than PHEVs as a percentage of vehicle stock since their generally lower MSRP relative to PHEVs becomes even more attractive when the incentive is applied; this also helps to alleviate the disadvantageous categorization of the MiEV as a hatchback vehicle. This leads to higher overall diffusion of PHEVs and BEVs since the WtC is able to spread at an increased rate following more initial adopters in the beginning periods of simulations.
- 6.4
- Vehicle selection of BEVs and PHEVs generally favor the models with the lower MSRP and sedan categorization, since these are given the higher relative part-worth estimates from the mixed logit model. Green automobile columnists are currently denoting the RAV4 EV as a niche vehicle designed for wealthy early-adopters (Voelcker 2012; Marchetti 2012) but as battery characteristics improve consumers with lower aversions to MSRP and higher aversions to DGC are estimated to purchase the vehicle at small yet still considerable rates. Given its relatively low value, sensitivity analysis was conducted on the Prius' range by adjusting it to hypothetical values; the vehicle becomes much more competitive when ranges are increased to the average of its PHEV competitors. Within the context of this model's mixed logit parameters there is only a small range of agents willing to spend extra money on a car with less range; generally only consumers with higher incomes, much less daily VMT, and higher safety parameter part-worths are estimated to purchase the Prius PHEV. These households were generally the married, higher-income households with low daily VMT.
- 6.5
- In the AEO 2012, PEVs and AFVs are estimated to reach approximately 1.6% and 19.81% of vehicle stock, respectively. Higher estimates of PEVs as a percentage of vehicle stock are anticipated in most scenarios since substitutions of PEVs by other AFVs are not incorporated into this analysis. This model replicates a market place where the only alternative option to an ICE is an EV and thus consumers are assumed to seek alleviation from higher DGC through this single channel, creating the spread between this model's and the AEO 2012's estimates of EVs as a percentage of vehicle stock. In the most optimistic scenario, the EVs as a percentage of vehicle stock nearly match but slightly exceed the AEO 2012's estimate of AFVs as vehicle stock in 2030.
- 6.6
- Similar to Karplus (2011) but not a focal objective of this analysis, simulations demonstrate that US households are estimated to purchase more fuel efficient vehicles in response to gasoline price increases (evidenced by Figure 5). However, dissimilar in these simulations to Karplus' analysis is the non-distinct income groupings of households that switch their vehicle consumption behavior. The ambiguous behavior by household categorical groupings lends itself to the randomness inherit in the mixed logit parameters which have overlapping estimated distributions.
- 6.7
- Overall, a high amount of variation is estimated with respect to all scenario assumptions and results. The most optimistic scenario estimates EVs at approximately 22% of 2030 vehicle stock, much less than more optimistic estimates (Becker, Sidhu, and Tenderich 2009) but the landscape is continually changing on both the fossil fuel and EV sides. Although gasoline prices have increased greatly over the past few years, the growing extraction rates of unconventional sources of petroleum in the Bakken tight shale formation and Canadian oil sands have dramatically altered the perceptions of the future in the North American petroleum market. In general, EV proponents are optimistic of the future of the electric automobile but might face an uphill battle if major rises in petroleum prices are a prerequisite to EV deployment.
Limitations
- 7.1
- Throughout this analysis, multiple assumptions were imposed and demonstrated to alter results. There is great uncertainty in the future characteristics of automobiles and, although this model attempts to ground itself in statistics and data, an infinite number of different outcomes are possible. In these simulations alone, the permutations of possible scenarios amount to 8,748 different combinations of assumptions. As in any other model, it should be thought of as a simplified version of reality and treated as a well-informed thought experiment.
- 7.2
- A large assumption is that consumers value these vehicles equally as they would their ICE counterparts. At the time this is written, EV technologies have not been around in sufficient quantities to fully assess consumer valuation functions with revealed preference data. Another approach to developing the mixed logit parameters in this study would be to perform primary research with stated preference data acquired through conjoint analysis, or wait for AFVs to become more mainstream vehicles and then re-assess the statistical portion of this analysis. Performing this task would provide an interesting and valuable analysis but is outside current time and resource availability.
- 7.3
- As mentioned, EV technologies have not been around for a substantive-enough amount of time. This creates uncertainty in the future characteristics of vehicles. This analysis incorporated constant producer and battery manufacturer responses whereas a more dynamic depiction would be a profit-maximization response of vehicle and component manufacturers, similar to Zhang et al (2011).
- 7.4
- Past studies have indicated that several other social factors influence consumer adoption and perceptions of vehicles (Choo and Mokhtarain 2004;Turrentine and Kurani 2007). Incorporating network interactions into a VCM is done to include these effects but further research is required to investigate human interactions in a mathematical framework. The model presented here is a simplification of these interactions and the assumptions applied have a substantial effect on the model's outcome.
Appendix
-
Additional Mixed Logit Model Assumptions
- 8.1
- Discrete choice models require data to be formatted so that a single choice is made among alternatives. With respect to the new vehicle marketplace, there are more purchase options present than current statistical software packages can reasonably handle. Due to these restrictions, the vehicle consumer was originally designated to have chosen among 100 different randomly-determined (without replacement) vehicle options from the same year the observed vehicle was purchased. After several statistical runs and based on convergence and estimation efficiency, the choice set was limited to 20 randomly-included chosen vehicles. The final amount of potential options available in the choice set also presented assurance in both the reliability and consistency of estimation results.
- 8.2
- The probability that a specific vehicle is incorporated into the choice set is based on the annual market share of said vehicle. For example, in 2004, the Ford F150 market share was 5.29% (Wards 2011), meaning that in each observation's choice set the probability that the Ford F150 is included is 5.29%. The accuracy of the market shares and their probabilities to be included is to the nearest 1e-4, any vehicle below this value was not included in observations' choice sets.
- 8.3
- The software package chosen for estimation is Stata/SE 64-bit and the procedure utilized is 'mixlogit' (Hole 2007). Weights from the 2009 NHTS were incorporated as frequency weights in the analysis. Additionally, since the large amount of observations and variability in the data presented challenges for the standard algorithm to reach convergence, the standard Newton-Raphson algorithm were supplemented with the steepest ascent method developed by Gould and Scribney (1999) as well as Gould, Pitblado, and Scribney (2003). This replacement only impacted the number of iterations required to reach convergence and not the resulting parameter estimates or model qualities.
- 8.4
- Since "[t]he objective function optimized to estimate the coefficients of [mixed logit] models is generally highly nonlinear, and thus prone to multiple, local optima" (Greene 2010, p. 12), post-optimization algorithm sensitivity analysis was performed. The product of the parameters following convergence and randomly-assigned values were used as starting parameters in the optimization process to insure the algorithm acquired the same convergence values. The parameters obtained following the original optimization were subsequently multiplied by randomly-assigned values from the following sets: (-1.1, 1.1), (-1.5, 1.5), and (-2, 2). Following these modifications, the algorithm reached convergence with the same parameters; the amount of additional iterations required depended on the extent of the distortion applied to the original parameter set.
- 8.5
- In this model, distributions are imposed using the best fit method described by Train and Sonnier (2004). First, the models were run with zero and then only one of each explanatory variable with an imposed log-normal distribution. If multiple explanatory variables solely provided an increase in the log-likelihood value, the explanatory variable with the greatest marginal contribution towards the log-likelihood function was introduced as the first log-normally distributed explanatory variable. The second greatest contributing explanatory variable to the log-likelihood value from log-normal distribution specification is then introduced and the log-likelihood value compared to the prior model's log-likelihood estimation, and so on. In the analyses, the households with children incurred the best fit when only the log-normal distribution is applied to the safety parameter. Imposing the log-normal distribution on the power parameter only improved the retired household's model fit. None of the groupings' model fits improved when imposing the log-normal distribution on either the DGC or MSRP parameters. The results for log-normal distributed parameters presented in Table 1 have undergone the necessary conversion calculations.
- 8.6
- Observations from the 2009 NHTS with incomplete information for values included in this study were excluded resulting in a loss of approximately 5% of the original sample. Also, in order to take into account recent vehicle characteristics, only new vehicles purchased from 2004 to the date of the survey taken were included in the mixed logit model. The NHTS 2009 queried neither the vehicle's condition when purchased (new or used) nor the price of the vehicle and thus two assumptions need to be made. First, the date of purchase needed to be within the new model year's selling period, assumed to be August the prior year of release to December of the vehicle year. Second, the consumer paid the inflation-adjusted manufacturer's suggested retail price (MSRP)[14]. In the end, the dataset used in the mixed logit model contained 33,235 observations of vehicles matched with their primary drivers and respective households.
- 8.7
- Since National Automotive Sampling System (NASS) vehicle codes do not differentiate between vehicle trim levels, the observations' vehicle trim level was determined by the closest match within vehicle model based on the reported MPG level from the 2009 NHTS.
Future Vehicle Specifications
- 8.8
- Vehicle consumers will choose among the subset of vehicles available for purchase in the 2011 vehicle fleet but limited to those which meet the same market share percentages as those included in the mixed logit model dataset construction. These vehicles are fixed in specifications except for the attributes of MPG which increases, for each vehicle, with respect to the annual marginal rates of change (ROC) of each vehicle's power type (ICE, BEV, PHEV, HEV) and class (car and light truck) indicated in Argonne National Laboratory's VISION model (ANL, 2011).
ICE
- 8.9
- A caveat with the simulations is that the choice set from which the mixed logit derived parameters were estimated is smaller than the choice set available to consumers within the ABM simulations.
HEV
Car Class Light Truck Class Chevrolet Cruze Eco
Ford Fusion Hybrid
Honda Civic Hybrid
Honda Insight
Honda CR-Z and CR-Z EX
Hyundai Sonata Hybrid
Kia Optima Hybrid
Lexus CT 200h and 200h Premium
Lexus GS 450h
Lexus HS 250h and 250h Premium
Lincoln MKZ Hybrid
Mercedes Benz S500 Hybrid
Nissan Altima Hybrid
Toyota Camry Hybrid
Toyota Prius I-VBMW Active Hybrid X6
Cadillac Escalade Hybrid
Chevrolet Silverado 1500 Series Hybrid
Chevrolet Tahoe Hybrid
Ford Escape Hybrid
GMC Sierra 1500 Series Hybrid
GMC Yukon Hybrid
Mercedes Benz ML450 Hybrid
Porsche 911 Cayenne S Hybrid
Toyota Highland Hybrid
Volkswagen Touareg HybridPHEV
- 8.10
- Chevrolet Volt
Toyota RAV4 Electric[15],[16],[17]
Toyota Prius[18]BEV
- 8.11
- Nissan Leaf
Ford Focus Electric
Mitsubishi i (MiEV)[19],[20],[21]
Tesla Model S[22] (with 40, 60, and 85 kWh battery capacities, at base MSRP)Recharging System Costs, PHEV DGC, and Battery Costs
- 8.12
- Fueling station availability and range anxiety have been a significant limitation with consideration to the diffusion of BEVs (Tate, Harpster, and Savagian, 2008). In the model, if the household is considering an EV, the fixed price for a level 2 charging station is $2000[23] and is incurred as a fix cost added to the MSRP. To account for range anxiety, a consumer will only consider an electric vehicle if their average daily vehicle miles travelled is less than or equal to a specified percentage of the range of the BEV being assessed. This specified percentage is explored in the Results section.
- 8.13
- Agent i's DGC for PHEV model j is computed as:
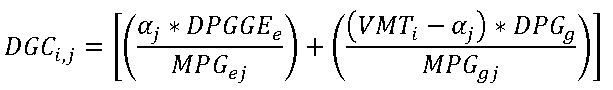
(5) where:
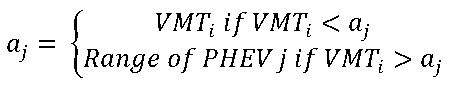
(6) DPGGEe: Dollars per gallon of gasoline equivalent[24] MPGej: Miles per gallon of gasoline equivalent VMTi: Average daily vehicle miles travelled of agent i DPGg: Dollars per gallon of gasoline MPGgj: Miles per gallon of the gasoline portion of PHEV j
- 8.14
- BEV and PHEV battery ranges have been evaluated by three different groups: manufacturers, government (EPA), and the private sector (Car and Driver). Since the range of the vehicle is a serious consideration for buyers, scenarios are implemented which reduce the agents' range of each BEV and PHEV model by different specifications. Manufacturers, the EPA, as well as Car and Driver estimate the maximum, median, and minimum of range estimates, respectively. If the EPA has tested the vehicle, that reduction goes into place. If not, the average percentage reduction of that vehicle type's range is applied. Since Car and Driver has only reviewed and supplied estimates for the Nissan Leaf and Chevrolet Volt (as of May 2012), the same percentage reductions will be applied on the range of said vehicles' class. Additionally, MPG is adjustable between manufacturer and EPA estimates, and average percentage reductions if not available from the prior source.
- 8.15
- Since battery depreciation and costs are a barrier to consumer adoption of EVs (Morales-Espana 2010), the price of EVs is adjusted annually to the rate of change, by vehicle class (car and light truck) and BEV/PHEV designation, according to the schedule estimated by the UK Commission on Climate Change's (CCC) report regarding future battery specifications (UK CCC 2012). These data are manufacturer prices and thus an assumed markup of 10% is included. Additionally, since the battery maintains a large replacement cost, the net present value of the total depreciated value of the battery at time of resale is included at the time of purchase. This is done with an assumed constant failure rate at 10 years. In equation form:
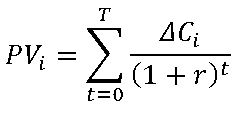
(7) Where:
PVi: Present value of battery depreciation of vehicle i
T: Years of ownership (pre-determined at time or purchase)
ΔCi: Annual change in battery value
r: Discount rate[25]FFV Utilization
- 8.16
- Although other work has researched consumers' choices in using E85 fuels (Greene and Zhou 2008), usage rates for E85 are not simulated in this research endeavor. Even though biofuels are an important component of a less-carbon intensive and more energy secure future (Leiby and Rubin 2012), several limitations on biofuel utilization have been on the industrial structure, feedstock, and financial components in the industrial sphere (Rabago 2008) which are outside of this model's purpose. This is a potential model expansion currently being explored.
Acknowledgements
- This work would not be possible without the guidance and support of my advisor, Dr. Jonathan Rubin. Thesis committee members Dr. Gary Hunt and Dr. Timothy Waring deserve considerable appreciation for helping me complete this task. Additionally, I am fortunate and thankful for the four anonymous reviewers who greatly helped in refining this paper.
Notes
-
1 Ranges for annual income are as follows:
Low: ≤ $45,000
Middle: $45,000< x<$125,000
high: ≥ $125,000
2 Gas-guzzler tax is included for cars meeting the criteria
3 Methods for estimating safety ratings changed for year 2011 vehicles; safety ratings used in this analysis are those present during vehicle choice decision-making
4 Significance levels: *: 0.15 **: 0.10 ***: 0.05 ****: 0.01
5 Although possible to replicate the entire US population it is discouraged due to extensive computing times
6 If the agent owns an EV, they will still consider the status quo of ICE vehicles
7 This variable functions similarly to the 'susceptibility' variable from Eppstein et al (2011)
8 This parameter becomes the focus of incentive policy structure sensitivity analysis in the Results section.
9 After 2035, annual rates of change for gasoline prices are from VISION 2011
10 Because this scenario only changes once, it is not normally presented in the secondary legend
11 Includes extended-life on the present value calculations of battery depreciation and battery cost adjustments but does not include efficiency gains from energy density improvement benefits.
12 Assumed gasoline heating value of 125,000 BTU
13 For example, range is increased and thus VMT as a range limit is not as binding
14 All monetary values in this model were adjusted to 2011 dollars using the Consumer Price Index (2011)
15 Model information taken from Toyota (2012a) and Edmunds (2012)
16 Target Launch Date of Spring 2013 (Edmunds, 2012)
17 Volume assumed to be the same as the 2011 model ICE counterparts
18 Model information taken from Toyota (2012b)
19 Model information taken from Mitsubishi (2012) and Edmunds (2012)
20 Target Launch Date of Fall 2012
21 At the time this was written, safety information was not available; therefore the rating from the European New Car Assessment Programme (Euro NCAP) of four stars was assumed (EuroNCAP, 2012)
22 Source for information: Tesla Motors (2012); currently set only to be available in California
23 Based on Nissan's estimates for charger and installation (Nissan, 2012)
24 Assumed gasoline heating value of 125,000 BTU/gallon
25 Assumed discount rate of 7%
References
-
ALLCOTT, H. and N. Wozney (2010). "Gasoline prices, fuel economy, and the energy paradox." from http://www.nber.org/papers/w18583.
ALTERNATIVE FUELS ADVANCED VEHICLES DATA CENTER (AFDC) (2012). "Alternative Fuel Stations." Retrieved January, 15, 2012, from http://www.afdc.energy.gov/afdc/fuels/stations.html.
ARAL, S. and D. Walker (2011a). "Creating social contagion through viral product design: A randomized trial of peer influence in networks." Management Science 57(9): 1623-1639. [doi:10.1287/mnsc.1110.1421]
ARAL, S. and D. Walker (2011b). "Identifying Social Influence in Networks Using Randomized Experiments." IEEE Intelligent Systems, September-October In press. [doi:10.1109/mis.2011.89]
ARGONNE NATIONAL LABORATORY (2011). "The VISION Model — 2011 AEO Base Case" from http://www.transportation.anl.gov/modeling_simulation/VISION/.
BEARDEN, W. O. and M. J. Etzel (1982). "Reference Group Influence on Product and Brand Purchase Decisions." Journal of Consumer Research 9: 183-481. [doi:10.1086/208911]
BECKER, T., Sidhu, I., and Tenderich, B. (2009). "Electric vehicles in the United States: A new model with forecasts to 2030." University of California, Berkeley Center for Entrepreneurship and Technology. Retrieved May 21, 2012 from: http://cet.berkeley.edu/dl/CET_Technical%20Brief_EconomicModel2030_f.pdf
BOLDUC, D., N. Boucher, et al. (2009). "Hybrid choice modeling of new technologies for car choice in Canada." Transportation Research Record, Journal of the Transportation Research Board Planning and Administration: 63-71.
CHILDERS, T. L. and A. R. Rao (1992). "The Influence of Familial and Peer Based Reference Group Influence on Consumer Decisions." Journal of Consumer Research 19: 198-211.
CHOO, S. and P. Mokhtarian (2004). "What type of vehicle do people drive? The role of attitude and lifestyle in influencing vehicle type choice." Transportation Research Part A 38(2004): 201-222. [doi:10.1016/j.tra.2003.10.005]
CUI, X., H. Kim, et al. (2011). A multi agent-based framework for simulating household PHEV distribution and electric distribution network impact. Paper in Conference Proceeding, Transportation Research Part A: Policy and Practice, Washington, DC. June 2011.
CURTIN, R., Y. Shrago, et al. (2009). "Plug-in Hybrid Electric Vehicles." from http://www.ns.umich.edu/Releases/2009/Oct09/PHEV_Curtin.pdf.
DASGUPTA, S., S. Siddarth, et al. (2007). "Lease or Buy: A Structural Model of a Consumer's Vehicle and Contract Choice Decisions." Journal of Marketing Research 44(3): 490-502. [doi:10.1509/jmkr.44.3.490]
DE-HAAN, P. and M. Mueller (2009) "How much do incentives affect car purchase? Agent-based microsimulation of consumer choice of new cars Part I: Model structure, simulation of bounded rationality, and model validation."
DE HAAN, P., M. Mueller, et al. (2009). "How much do incentives affect car purchase? Agent-based microsimulation of consumer choice of new cars-Part II: Forecasting effects of feebates based on energy-efficiency." Energy Policy 37(3): 1083-1094. [doi:10.1016/j.enpol.2008.11.003]
DUGUNDJI, E.R., A. Páez and T.A. Arentze (2008). Social Networks, Choices, Mobility and Travel. Environment and Planning B: Planning and Design, 35 (6), 2008, 956-960.
DUGUNDJI, E.R., A. Páez, T.A. Arentze and J.L. Walker (2011). Transportation and Social Interactions. Transportation Research Part A: Policy and Practice, 45 (4), 2011, 239-247. [doi:10.1016/j.tra.2011.01.001]
DUGUNDJI, E.R. and L. Gulyás (2013). Socio-Dynamic Discrete Choice on Networks in Space: Impact of Initial Conditions, Network Size and Connectivity on Emergent Outcomes in a Simple Nested Logit Model. Studies in Computational Intelligence Series, Springer, vol. 424, 2013, pp. 149-160. [doi:10.1007/978-3-642-30287-9_16]
EDMUNDS (2012). "Car Reviews." from http://www.edmunds.com/car-reviews/.
EPPSTEIN, M., D. Growever, et al. (2011). "An agent-based model to study market penetratio of plug-in hybrid electric vehicles." Energy Policy 39(2011): 3789-3802. [doi:10.1016/j.enpol.2011.04.007]
EUROPEAN NEW CAR ASSESSMENT PROGRAM (EuroNCAP) (2012). "EuroNCAP Safety Ratings." from http://www.euroncap.com.
GALLAGHER, K.S. and E. Muehlegger (2008). "Giving Green to Get Green? Incentives and Consumer Adoption of Hybrid Vehicle Technology." Journal of Environmental Economics and Management. 61(1): 1-15. [doi:10.1016/j.jeem.2010.05.004]
GOULD, W., J. Pitblado, et al. (2003). Maximum likelihood estimation with STATA, Second Edition. College Station, TX, Stata Press.
GOULD, W. and W. Scribney (1999). Maximum Likelihood Estimation with STATA. College Station, TX, STATA Press.
GREENE, D. (2010). How consumers value fuel economy: a literature review. UA Environmental Protection Agency (EPA). Washington, DC.
GREENE, D. and J. Zhou (2008). "Consumer Choice of E85 : Lessons from Minnesota's Experience." Transportation Research Record, Journal of the Transportation Research Board, 650(TRB 09-3018).
HAMLYN, P. (1967). Cars Cars Cars Cars. Published by The Hamlyn Publishing Group LTD. Middlesex, England.
HEFFNER, R., K. Kurani, et al. (2005). "Effects of Vehicle Image in Gasoline-Hybrid Electric Vehicles." UC Davis Institute of Transportation Studies: UCD-ITS-RR-05-08.
HENRY FORD ESTATE (2007). "Inside Henry Ford's Garage - 1914 Detroit Electric." Retrieved Janurary 12, 2012 from: http://www.henryfordestate.org/claracar.htm
HIEBELER, D. (forthcoming) Introduction to Simulating and Modeling Spatial Population Ecological and Epidemiological Dynamics.
HOLE, A. (2007). "Fitting mixed logit models by using maximum simulated likelihood." The Stata Journal 7(3): 388-401.
INTERNAL REVENUE SERVICE (2011). "Plug-in Electric Vehicle Credit." Retrieved December 2, 2011 from: http://www.irs.gov/businesses/article/0,,id=214841,00.html
STRUBEN, J. and Sterman, J (2008). "Transition Challenges for Alternative Fuel Vehicle and Transportation Systems". Environment and Planning B 35(6) 1070 – 1097. [doi:10.1068/b33022t]
KAHN, M. and R. Vaughn (2009). "Green Market Geography: The Spatial Clustering of Hybrid Vehicle and LEED Registered Buildings." The BE Journal of Economic Analysis & Policy 9(2). [doi:10.2202/1935-1682.2030]
KARPLUS, V. (2011). "Climate and Energy Policy for U.S. Passenger Vehicles: A Technology-Rich Economic Modeling and Policy Analysis." PhD Dissertation, MIT Engineering Systems Divison.
KURANI, K. and T. Turrentine (2004). "Automobile Buyer Decisions about Fuel Economy and Fuel Efficiency, Final Report to the Department of Energy." from http://escholarship.org/uc/item/5hh5k3j3.pdf.
LEIBY, P. and J. Rubin (2012). "Energy Security Implications of a National Low Carbon Fuel Standard." Energy Policy, In Press.
MAKGOSA, R. and K. Mohube (2007). "Peer influence on young adults' products purchase decisions." African Journal of Business Management 1 (3), 64-71.
MARCHETTI, N. (2012). "Toyota RAV4 Electric SUV: A $50,000 toy or statement?" Retrieved June 19, 2012 from http://www.tgdaily.com/sustainability-features/63346-toyota-rav4-electric-suv-a-50000-toy-or-statement
MAU, P., J. Eyzaguirre, et al. (2008). "The 'neighbor effect': Simulating dynamics in consumer preferences for new vehicle technologies." Ecological Economics 68(2008): 504-516. [doi:10.1016/j.ecolecon.2008.05.007]
MCPHERSON, M., L. Smith-Lovin, et al. (2001). "Birds of a feather: homophily in social networks." Annual Reviews of Sociology 27: 415-444.
MICHNIAK, B., R. Morin, et al. (2012). "Consumer attitudes and behaviours related to alternatively fueled vehicles." Retrieved June 19, 2012 from http://uwaft.com/wp/wp-content/uploads/SS-Consumer-Attitudes-and-Behaviours-Related-to-AFVs.pdf
MITSUBISHI MOTORS (2012). "MiEV." Retrieved March 4, 2012 from http://i.mitsubishicars.com/.
MOLOFSKY, J., R. Durrett, et al. (1999). "Local Frequency Dependence and Global Coexistence." Theoretical Population Biology 55: 270-282. [doi:10.1006/tpbi.1998.1404]
MORALES-ESPANA, G.A. (2010). "Electric vehicle diffusion: exploring uncertainties using system dynamics." Delft University of Technology Institutional Repository. Retrieved April 6, 2012 from: http://repository.tudelft.nl/view/ir/uuid%3A70105630-9dc9-445c-8e0e-71b5987d1384/
NATIONAL HIGHWAY TRAFFIC SAFETY ADMINISTRATION (NHTSA) (2006). Vehicle Survivability and Travel Mileage Schedules. Department of Transportation. Washington, DC.
NATIONAL HIGHWAY TRAFFIC SAFETY ADMINISTRATION (NHTSA) (2011). National Automotive Sampling System (NASS) General Estimates System (GES) Analytical Users Manual 1988-2010. U. S. Department of Transportation (DOT). Washington, DC.
NISSAN (2012). "Nissan Leaf charging, how to charge at home." Retrieved February 8, 2012 from: http://www.nissanusa.com/leaf-electric-car/home-charging
POLK (2012). "U.S. consumers hold on to new vehicles nearly six years, an all-time high." Retrieved April 14, 2012 from: https://www.polk.com/company/news/u.s._consumers_hold_on_to_new_vehicles_nearly_six_years_an_all_time_high
RABAGO, K. (2008). "A review of barriers to biofuel market development in the United States." Environmental and Energy Law and Policy 179.
ROGERS, E. (1963). Diffusion of Innovations. New York, NY: Free Press.
ROMERO, F. (2009) "A brief history of the electric car." Retrieved January 12, 2012 from http://www.time.com/time/business/article/0,8599,1871282,00.html
RUBIN, J. and P. Leiby (2012) . "National Low Carbon Fuel Standard: Tradable Credits System Design and Cost Savings." Energy Policy, In Press.
SCHELLING, Thomas C. 1978. Micromotives and Macrobehavior. New York: W. W. Norton.
SEXTON, S. and A. Sexton (2010). "DRAFT: Conspicuous Conservation: The Prius Effect and WTP for Environmental Bona Fides." from http://areweb.berkeley.edu/fields/erep/seminar/Prius_Effect_V1.5.1.pdf.
STRUBEN, J. and J. Sterman (2008). "Transition Challenges for Alternative Fuel Vehicle and Transportation System." Environment and Planning B 35: 1070-1097. [doi:10.1068/b33022t]
SULLIVAN, J. Salmeen, I, and Simon, P. (2009) "PHEV Marketplace Penetration An Agent Based Simulation." University of Michigan Transportation Research Institute. Retrieved May 19, 2012 from http://141.213.232.243/bitstream/2027.42/63507/1/102307.pdf
TATE, E., O. Harpster, et al. (2008). "The Electrification of the Automobile: From Conventional Hybrid, to Plug-in Hybrids, to Extended-Range Electric Vehicles." from http://www.media.gm.com/content/dam/Media/microsites/product/volt/docs/paper.pdf.
TESLA MOTORS (2012). "Tesla Motors, Premium Electric Vehicles." from http://www.teslamotors.com/.
TOYOTA (2012a). "RAV4 EV." Retrieved March 6, 2012 from http://www.toyota.com/concept-vehicles/rav4ev.html.
TOYOTA (2012b) "2012 Toyota Prius Plug-in." Retrieved March 7, 2012 from http://www.toyota.com/prius-plug-in/
TRAIN, K. (2009). Discrete Choice Methods with Simulation, Cambridge University Press.
TRAIN, K. and G. Sonnier (2004). "Mixed Logit with Bounded Distributions of Correlated Partworths." from http://elsa.berkeley.edu/~train/tsaug04.pdf.
TRAIN, K. and C. Winston (2007). "Vehicle Choice Behavior And The Declining Market Share Of U.S. Automakers." International Economic Review 48(4): 1469-1496. [doi:10.1111/j.1468-2354.2007.00471.x]
TURRENTINE, Thomas S. and Kenneth S. Kurani (2007) Car buyers and fuel economy?. Energy Policy 35 (2007), 1213 - 1223. [doi:10.1016/j.enpol.2006.03.005]
UK COMMITTEE ON CLIMATE CHANGE (2012). "Cost and performance of EV batteries." Retrieved May 7, 2012 from http://www.axeon.com/getdoc/77fbadce-7d3e-4f13-b996-e8224330db44/CCC-battery-cost-report_March2012_Public.aspx
UNION OF CONCERNED SCIENTISTS (2011). States and federal hybrid incentives. Retrieved January 9, 2012 from http://go.ucsusa.org/hybridcenter/incentives.cfm
US CENSUS BUREAU (2012). "The 2012 Statistical Abstract." from http://www.census.gov/compendia/statab/.
US DEPARTMENT OF ENERGY (2001). The Transportation Sector Model of the National Energy Modeling System, Model Documentation Report. DOE/EIA-M070(2001). Retrieved from: ftp://ftp.eia.doe.gov/modeldoc/m0702001.pdf
US DEPARTMENT OF ENERGY (2012). "The Recovery Act: Transforming America's transportation sector, batteries and electric vehicles." Retrieved May 1, 2012 from: http://www.whitehouse.gov/files/documents/Battery-and-Electric-Vehicle-Report-FINAL.pdf
US DEPARTMENT OF TRANSPORTATION (DOT) (2012). "Vehicle Safety Ratings." from http://www.safercar.gov.
US DEPARTMENT OF TRANSPORTATION (DOT) AND FEDERAL HIGHWAY ADMINISTRATION (2009). "National Household Travel Survey ". from http://nhts.ornl.gov.
US ENERGY INFORMATION ADMINISTRATION (US EIA) (2011). "2012 Annual Energy Outlook." from http://www.eia.gov/forecasts/aeo/er/.
US ENERGY INFORMATION ADMINISTRATION (US EIA) (2012). "Gasoline Prices by Formulation, Grade, Sales Type." from http://205.254.135.7/dnav/pet/pet_pri_allmg_a_EPM0_PTC_Dpgal_m.htm.
US ENVIRONMENTAL PROTECTION AGENCY (2010). Environmental Protection Agency Fuel Economy Label Literature Review. U. S. Environmental Protection Agency (EPA). Washington, DC.
VOELCKER (2012). "2012 Toyota RAV4 EV electric SUV: Fewer than 1,000 a year." Retrieved June 20, 2012 from: http://www.greencarreports.com/news/1075962_2012-toyota-rav4-ev-electric-suv-fewer-than-1000-a-year
WARD'S AUTOMOTIVE INFORMATION PRODUCTS (2011). Vehicle specifications and characteristics. Purchased July, 2011. Contact: McLincha, Amber. amclincha@wardsauto.com
ZHANG, T., S. Gensler, et al. (2011). "A study of diffusion of alternative fuel vehicle: An agent-based modeling approach." Journal of Production Innovation and Management 28: 152-168. [doi:10.1111/j.1540-5885.2011.00789.x]