
 Abstract
- This paper presents an agent-based model of the standard U.S. k-12th grade classroom using NetLogo. By creating an artificial society, we identify the casual implications of the same-race effect (a moderate sized academic boost to students whose teachers have the same race) on the national educational achievement trends. The model predicts sizeable achievement gaps at the national level, consistent in size with those documented by the US National Report Card (NAEP) stemming from moderate sized same race effects. In addition, matching effects are found to be a source of increased heterogeneity in academic performance for the minority group. These results hold for all teacher-student matching phenomena and have implications for educational policy at the aggregate level. Using artificial societies to disentangle the aggregate effects of hypothesized causes of the achievement gap is a promising strategy that merits further research.
- Keywords:
- NetLogo, Agent Based Simulation, Racial Disparities, Achievement Gap, United States
Introduction
- 1.1
- One of the most salient US educational policy problems is the amelioration of the Black-White gap in student achievement (Braun, Chapman, & Vezzu 2010). As documented by the National Assessment of Educational Progress (NAEP) long-term study, the average Black-White educational gap from 1990-2008 ranges from 0.72 to 0.83 (Cohen's d) for the various grades assessed (Planty, Hussar, & Snyder 2009). The Black-White gap starts in early childhood and cannot be explained by differences in family or test characteristics (Brooks-Gunn, Klebanov, Smith, Duncan, & Kyunghee 2003).
- 1.2
- Attempts to explain the Black-White academic performance gap include attributing it to differences in the academic engagement of students, differences in their social capital, differences in their cultural capital, differences in the quality of schools, and race-contingent treatment of students by teachers. In a nationally representative study, Oates (2009) tested these five hypotheses simultaneously on the NELS data and found that race-contingent treatment and quality of education were more powerful predictors of black-white disparities than academic engagement, or differences in students' social and cultural capital. Research on race-contingent treatment of Black students by White teachers has shown that teachers are more likely to view and evaluate differently children who are of a different race (Alexander, Entwisle, & Thompson 1987; Downey & Pribesh 2004; Ehrenberg, Goldhaber, & Brewer 1995; Muller 1998; Oates 2003).
Agent-Based Modeling in Educational Research
- 2.1
- There are two inter-related but distinct agent-based modeling academic literatures in the field of education: (a) pedagogical articles describing how students learn about complex systems and how agent-based models—often using NetLogo (Wilensky 1999)—facilitate such learning (Goldstone 2006; Jacobson 2001; Jacobson & Wilensky 2006; Jacobson 2008; Jacobson, Kapur, So, & Lee 2011; Jones & Laughlin 2009; Jones & Laughlin 2010; Kottonau 2011; Levy & Wilensky 2009; Raia 2005; Stieff & Wilensky 2003; Wilensky & Reisman 2006; Wilensky & Resnick 1999), and (b) research articles that use agent-based modeling as a tool to understand or evaluate educational policy. This brief review will focus on the second literature, which is still in an early stage of development.
- 2.2
- Henrickson (2003) conducted a feasibility study to determine if agent-based modeling (programmed in C++) could produce results substantially similar to those reported in McDonough's (1994) empirical study of college choice. She developed her agent-based model using social capital theory and cultural reproduction theory (Bordieu 1984). The model used rich input data from the Cooperative Institutional Research Program 1994 Freshman Survey, administered by the Higher Education Research Institute. Her study used the input data and the model to generate an output dataset that would be similar to the one used in empirical research. Regression conducted on the agent-based model output data resulted in coefficient estimates with correct signs, and in the same order of magnitude as those obtained by logistic regression analysis in the original empirical work.
- 2.3
- Maroulis (2009) used a complex systems perspective and agent-based models to analyze two areas of educational reform: why program reforms do not take hold and public school choice. His first model provided explanations for how institutional inertia emerges in a school where all individual teachers seek to improve. In his second model, he studied school choice showing that, paradoxically, if parents pick schools solely on achievement the highest achievement school will not emerge as the sole winner of the school choice mechanism, even in the absence of capacity or mobility constraints. This result occurs because the migration of low performing students into the highest performing school bring its aggregate performance down and generates unexpected dynamics.
- 2.4
- Maroulis has continued his work on agent-based models of school choice to better understand the impact of school choice in Chicago public schools (Maroulis, Bakshy, Gomez, & Wilensky 2010; Maroulis et al. 2010). These models have become increasingly realistic by adding geographic features of the Chicago area public schools as well as capacity constraints.
- 2.5
- In sum, the use of agent-based models to research educational policy is still in its infancy but the models are very promising to explain paradoxes or well established educational phenomena that are not well understood.
Purpose of the research
- 3.1
- In educational policy research, we face a fundamental macro-micro divide problem. In our case, we wanted to know if we could provide any evidence that micro-level same-race teacher effects can cause achievement gaps at the national macro-level. Because there are a myriad of confounding factors in the real world and large-scale randomized trials are unlikely, it is difficult to establish this cause and effect claim with any certainly. Even the best empirical study (Oates 2009) can only establish correlation. The correlational approach presents difficulties because correlational studies multiply rather than reduce the number of hypothesis for any observed phenomenon. When a correlational study discovers a relationship between a variable and an outcome, the new variable increases the list of potential causes for the outcome (for example, recent studies have correlated the Black-White gap with parenting (Mandara, Varner, Greene, & Richman 2009), and family wealth (Yeung & Conley 2008)). In this paper, we propose an alternative approach that uses the NetLogo environment to simulate a small but relevant aspect of the classroom environment, create an artificial society were only one factor is manipulated and estimate the results for the whole population in a similar manner as we do with the US national report card (the NAEP—National Assessment of Educational Process).
- 3.2
- By creating an artificial world where all Black and White students have identical ability, personal and familial resources and where education is delivered by teachers of identical quality, we can investigate whether the existence of a same-race teacher student effect is enough to generate the widely reported Black-White educational gap. In sum, the purposes of this study were (1) to determine if, in an artificial society that simulates an idealized randomized trial, the same race teacher effect is capable to generate the Black-White achievement gap similar in size (Cohen's d within 1/10 standard deviation) to those reported by the US National report card long-term study, and (2) to understand the relationship between the same race teacher effect and the size and timing of the gap.
Methods
-
Description of the model
- 4.1
- The model was constructed in NetLogo, an agent-based simulation software. We created two sets of agents: students (represented by the human figure) and teachers (represented by the house figure). All students are in the same grade and form a cohort. Students and teachers were randomly assigned to minority (represented in blue color) and majority (represented in yellow) status using the calibration parameters described in the next section. Two concentric circular displays were chosen to facilitate the visualization of classrooms, with teachers in the inner circle and students in the outer circle. Students remain in place in an intact class and are randomly assigned to a new teacher each year. Student assignment is represented graphically by a line segment (link) between teacher and student. If there is a race match the segment is green, if not red. Thus, a wedge of green lines represents a classroom where teacher and students are of the same race (typically white).A mostly red wedge identifies a Black teacher teaching mostly White students, while the occasional red line indicates either a Black pupil with a White teacher or a White pupil with a Black Teacher. Figure 1 shows the display. After teachers are randomly assigned to students, the programs determines if there has been a same race match, colors the link appropriately, and calculates the academic production function for each student.
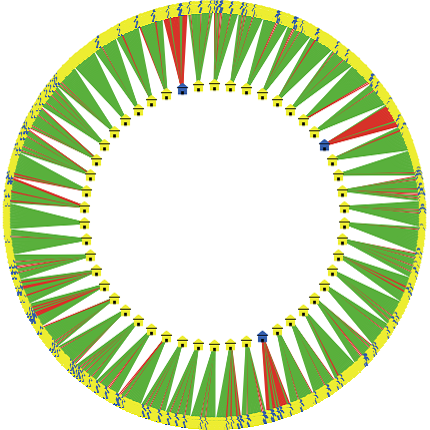
Figure 1. Display of a simplified display with 20 teachers (house image) in classrooms of 10 students (person image). Red link indicates race mismatch. Green link indicates race match. - 4.2
- Because of the nature of the publicly available dataset used for calibration and evaluation of the model, we chose a policy relevant but conceptually simple theoretical framework: value-added educational production functions. For the last decade, there has been a growing theoretical and empirical literature on the uses, biases and statistical issues associated with value-added production functions to measure teacher accountability (Ballou, Sanders, & Wright 2004; Braun 2005; Briggs & Domingue 2011; Harris 2008; McCaffrey, Lockwood, Koretz, & Hamilton 2003; Rubin, Stuart, & Zanutto 2004; Sanders, Wright, Rivers, & Leandro 2009; Wright & Sanders 2007). In 2010, the Obama's administration Race to the Top educational reform legislation has mandated the use of student growth (value-added) models to measure teacher and principal performance. Consequently, a majority of US states have implemented or are in the process of deploying implementation of comprehensive value-added monitoring for elementary and secondary public schools.
- 4.3
- In the economics of education literature (Hanushek & Welch 2006), educational production is modeled with a value-added linear function where current achievement is a function of past achievement, a constant teacher effect, the same race effect, and a normally distributed random disturbance (Achievement (t) = Achievement (t-1) + teacher effect + same-race effect + disturbance). Initially, achievement is thought to be measured in some suitable absolute metric (e.g. number of correct responses) at the end of the academic year. The starting achievement point is zero for all students. The constant teacher effect can be thought of as the overall quality of the teacher, as it is commonly done in educational value-added formulations. In this paper, the teacher effect is assumed to be constant so that all teachers are of identical quality and do not confound the investigation of same race effects. The normally distributed, unbiased, random error models other factors that impact achievement in this artificial environment. Thus, the educational production function specifies that in this artificial world students' achievement accumulates by adding the homogenous teacher effect and the same-race effects. As it is typically done in education and psychology, both teacher effect and the same race effect are measured in Cohen's d effect size metric, standard deviations from the mean. Because there are no other systematic causes of achievement in the artificial environment and all teachers are of identical quality, the results of achievement gaps are necessarily caused by the same race effect.
- 4.4
- Next, student achievement is normalized by expressing the relative achievement in z-scores (by subtracting the mean and dividing by the standard deviation). Thus, the average relative achievement is always zero for each year and the associated standard deviation is 1. The relative achievement score indicates how many standard deviations from the mean for the current grade is any particular student's achievement, and it simulates performance on the relative metric of standardized testing. This process is then repeated for 13 years (K-12).
- 4.5
- Absolute and relative gaps are calculated for each run and year of schooling by subtracting scores of Black students from those of White students.
Calibration of the model
- 4.6
- The model was calibrated using data from the Condition of Education 2009, an official, annual comprehensive report issued by the National Center of Education Statistics of the US Department of Education. Each year the report covers the enrollment characteristics, learner outcomes, and context of education for pre-Kindergarten to Doctoral school range. Not every indicator is reported each year. If the needed data was not available in the 2009 edition, we searched for it in a previous edition.
- 4.7
- White students comprised 55.9% of the K-12 public school enrollment in 2007, with 15.3% Black students, 20.9% Hispanic students and 4.1% Asian students (Planty, et al., 2009).
- 4.8
- Data on the racial distribution of full-time, public school teachers was not available in the 2009 edition; it was published in the 2007 edition. In 2003-04, 81.6% of full-time, public school, elementary grades teachers were white, compared to 8.8% Black, 7% Hispanic and 1.3% Asian. The corresponding numbers for Secondary schools were comparable: 84.2% white, 7.5% Black, 5.5% Hispanic and 1.3% Asian (Planty, Provasnik, Hussar, Snyder, & Kena, 2007). Thus, on average over the 13 years or K-12, 7.15% of teachers self-identified as Black.
- 4.9
- In our model, we simulate a world were only Black and White students and teachers exist. Based on the percentages above, Black students were set at 15.3% and Black teachers at 7.15%. Because our program uses the normal distribution to pick the race of students and teachers at random, we set the normal distribution cutoffs at -1.02365 and -1.46471 respectively.
- 4.10
- The student/teacher ratio was 15.8 for regular public schools in 2006 (Planty, et al., 2009). Thus, we set student/teacher ratio at 16 in our simulations.
- 4.11
- In summary, our simulations have 800 students and 50 teachers. In a typical run, 4 teachers will be Black and 122 students will be Black.
Benchmarks for the outcomes
- 4.12
- We used the NAEP data explorer to obtain the estimates of the average reading scores and standard deviations for White and Black students from 1990 to 2008. We calculated by subtracting the average score of Black students from the average score of White students and dividing by the standard deviation of White students. The average standardized Black-White gap in reading scores at age 13 was 0.73 standard deviations. The corresponding estimate for reading scores at age 9 was 0.81, 0.73 for age 17. The standard deviations of reading scores were quite comparable for all age groups; with Black students showing slightly more variable scores at age 9 and 13, while having similar variability at age 17.
Simulation
- 4.13
- We ran 100 simulations for each value of the same-race effect ranging from a minimal effect size of 0.01 to a sizeable (for educational interventions) effect size of 0.40, at intervals of 0.01 for a complete set of 4000 runs. The general teacher effect, T, was set at zero to simplify the presentation of results. We ran other simulations with various positive T values and obtained substantially the same results.
Results
- 5.1
- Figure 2 shows the White and Black absolute achievement by size of same race effect at the end of the final year (grade 12). The data shows that the same-race effect size is linearly and positively related with absolute achievement. The relationship between Black absolute achievement and same race teacher effect is also linear but very weak. Note also that Black children have a much higher dispersion. This effect is produced by the greater variability in the probability of matching with a same race teacher, compared to that of white children.
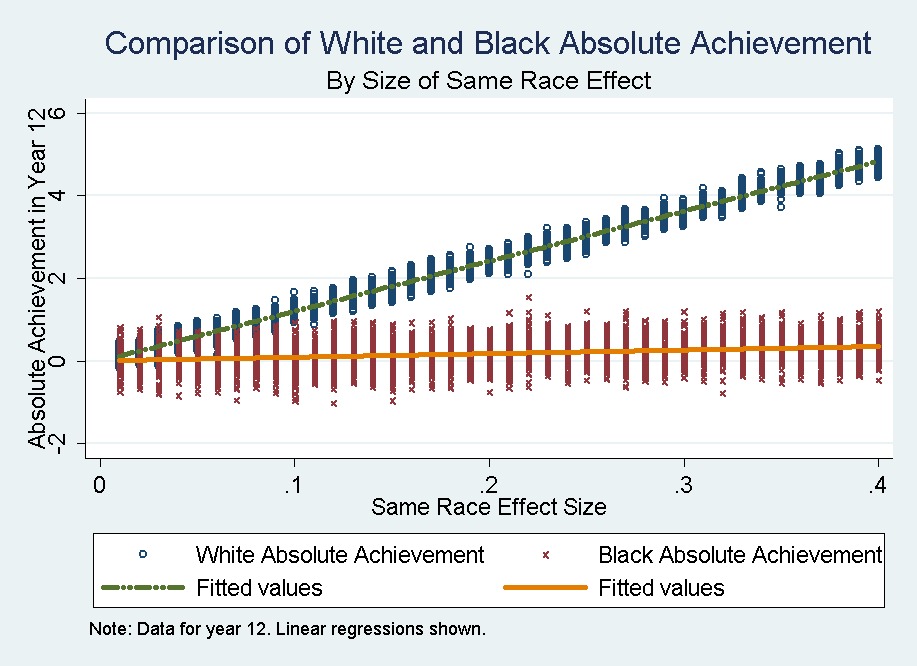
Figure 2. Comparison of 12th grade White and Black absolute achievement by size of same race effect. - 5.2
- Figure 3 shows the 12th grade relative achievement of Black and White students by same race teacher effect size. Because White children are the majority of the sample, they are de facto the normative group, thus their relative achievement is close to the overall mean of the score, arbitrarily set at zero. Thus, in relative performance measures, Black children at the end of 12th grade appear as being substantially below average, with the effect decreasing linearly with the same-race teacher effect size. In this relative metric, for a small same race effect size of 0.10, we expect Black children who were initially comparable to White children to score about ¼ standard deviations below the mean by 12th grade. For a larger same race effect size of 0.40, we expect that Black children to score a full standard deviation below the mean, even though Black and White children have identical initial achievement or ability and equally effective teachers.
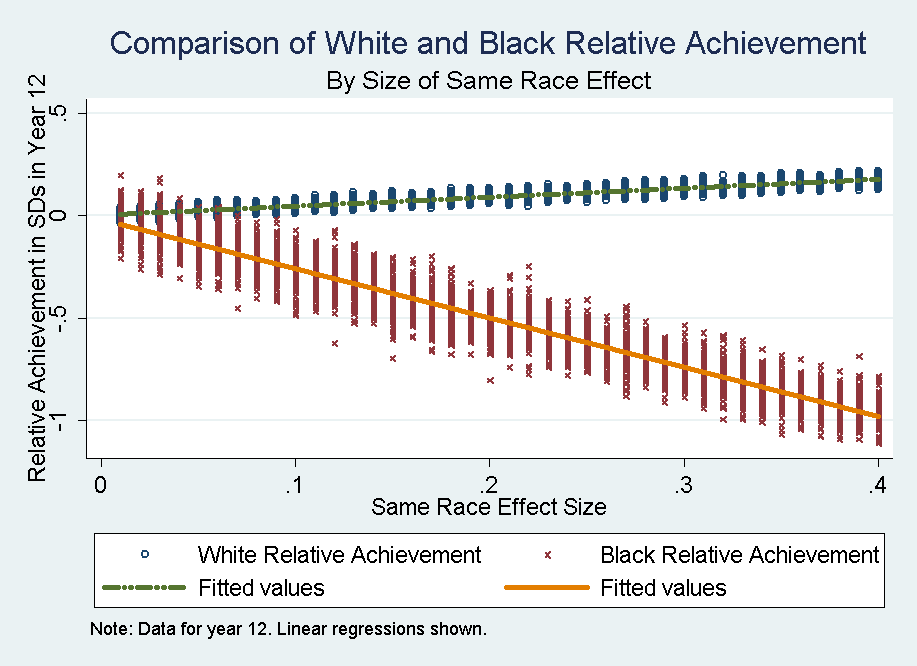
Figure 3. Comparison of 12th grade White and Black relative achievement by size of same race effect. - 5.3
- Figure 4 shows the 12th grade relative achievement gap by same race teacher effect. This chart is a summary representation of the gap between the White and Black trends shown in figure 2. There is a well-fitting linear relationship between same race effect size and the size of the relative achievement gap (Gap=0.02+2.84 Same-race-teacher-effect, R2=0.93, slope coefficient was statistically significant, p<.05). the relationship can be described by the concept of a multiplier between the same-race teacher effect and the cumulative impact on the relative achievement gap by 12th grade. Our estimate is that the multiplier is 2.8, indicating that same race effects result in triple-sized cumulative relative gaps by the end of 12th grade. For example, for a small effect size of 0.1 we expect a 12th grade relative gap around 1/3 standard deviations; for an initial effect size of 0.2 we expect a gap of 3/5 or 60% a standard deviation. In summary, same race teacher effects result in effects on the relative performance gap of roughly 3 times their size.
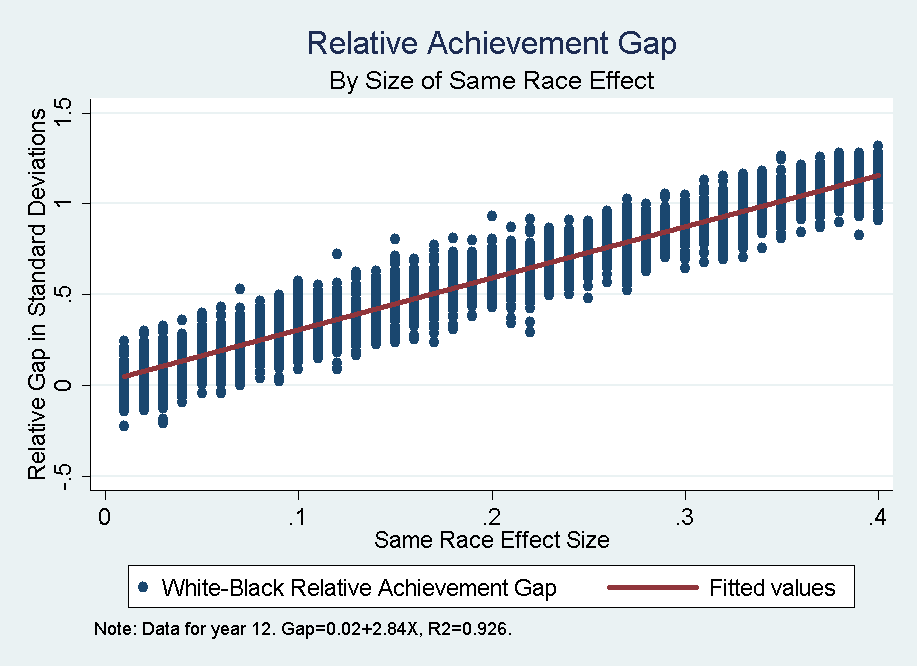
Figure 4. Relative Black-White 12th grade achievement gap by size of same race effect - 5.4
- Figure 5 plots the relationship between the relative achievement gaps by year for a same race teacher effect of 0.35. As we can see, the first year (year 0 - Kindergarten) has the largest increase in the relative gap with a size comparable to the teacher effect size. Each subsequent year adds to the gap but a decreasing rate (a logarithmic curve) until by the end of the 12th grade the average gap is the initial effect size times the multiplier. Thus, although the effect of same-race teacher matches accumulates over time, on a population basis most of it occurs in elementary school.
- 5.5
- We plotted similar figures for other effect sizes and found them to all belong to the same family of logarithmic curves starting at zero, jumping to the same race teacher effect at the end of Kindergarten, and ending on the multiplier times the initial effect size.
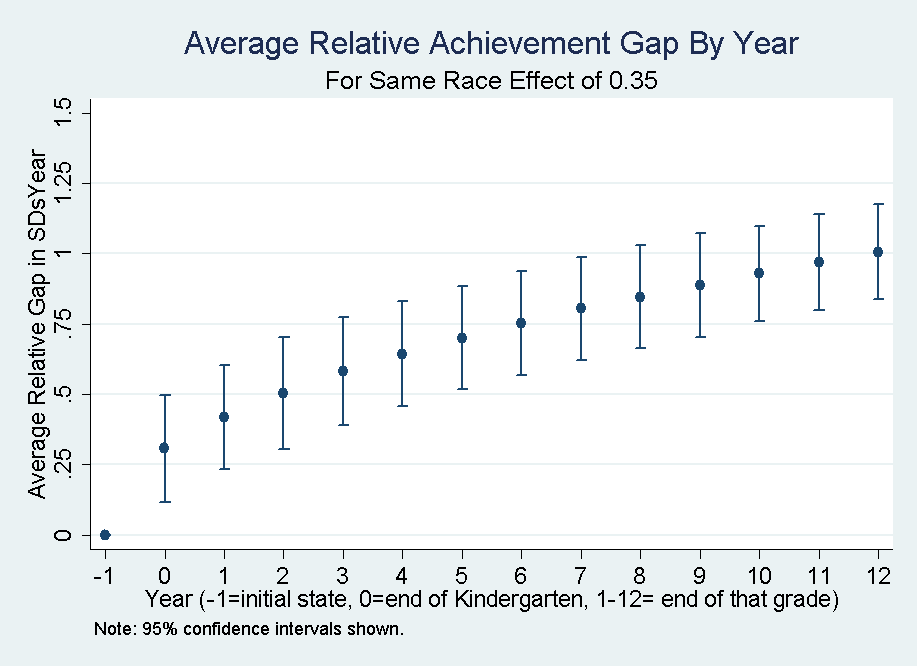
Figure 5. Average relative Black-White achievement gap by year for same race effect of 0.35. Summary of Results
- 5.6
- In summary, the conclusions of this simulation are as follows. In a world where Black and White students have identical ability, personal and familial resources, and where education is delivered by teachers of identical quality but there exists a same-race teacher effect (1) that effect alone is sufficient to create a substantial Black-White relative achievement gaps of about three times the size of the same race effect ; (2) it results in Black students being below average on a population basis and Whites being slightly above average; (3) it results in greater variability of achievement among Blacks compared to Whites, and (4) large and increasing racial gaps start in the early grades, particularly in the earliest grade with full participation (e.g. Kindergarten or 1st grade depending on the state).
Assessment of Simulation against the Benchmarks
- 5.7
- The NAEP long-term average Black-White achievement gap from 1990-2008 ranges from 0.72 to 0.83 for various age groups. A same-race teacher effect of 0.25 generates these benchmarks within 1/10 of a standard deviation. Thus, a relatively small same race effect could cause Black-White performance gap of similar size to those reported by the long-trend NAEP study.
- 5.8
- Our simulation showed that the same race effect should also result in greater variability of performance scores for Black students at any grade. This pattern was confirmed by the data only for ages 9 and 13. At age 17, scores of Black and White students were equally variable in the long-term NAEP average for 1990-2008. Yet in our artificial society no students dropped out while the age 17 NAEP is calculated on survivors only. Disproportionate dropping out behavior by Black students would substantially reduce their standard deviation, compared to that of white students. Thus our simulation results are generally consistent with the evidence.
Discussion
- 6.1
- We have created an artificial world where same race teacher effects are the only possible cause of increased achievement. In such a world, the presence of relatively small same race teacher effects yields substantial relative Black-White achievement gaps of the size observed in the NAEP data. Because we have complete control of the artificial environment, we can attribute cause and effect, and thus we have proven the following proposition: relatively small same-race teacher effects can cause measurable racial gaps in achievement as measured by standardized testing.
- 6.2
- Although constructing an artificial world has the great advantage of complete control, it can never establish that the phenomenon occurs in the real world. Thus, we have not proven that same-race effects exist, although there is correlational support for their existence (Alexander et al. 1987; Muller 1998; Oates 2009). What we have shown is that under ideal conditions, the same race effect reported in the literature can generate Black-White achievement gaps comparable in size to those reported by the NAEP. Thus, we conclude that while same-race effects may very well be a cause, although not likely to be the sole cause, of the Black-White achievement gap.
- 6.3
- Importantly, we have demonstrated that relatively small sized same race effects lead to much larger Black-White aggregate gaps in the absence of any institutional disparity other than the same race effect. Scholars have suggested that same race effects may occur through the practice of tracking (i.e. giving different placements to children of different races) (Oates 2003), but in this paper we show that same race effects accumulate into large Black-White aggregate gaps even if students are never tracked at any point of their academic careers. In our artificial society, each student is given a different, randomly assigned teacher each year. There is neither tracking nor any communication between past and current teacher, nor any impacts of student race on school policy (Hawley & Nieto 2010), and yet the simple fact that the Black student is less likely to have a teacher of his own race compared to a typical White peer results in the aggregate Black-White gap. Certainly, if in addition to a same race effect we add additional mechanisms such as communication (e.g. sharing of expectations) between teachers or tracking of students into groups of homogenous ability, as perceived by teachers, we would expect that the gap would widen. This more advanced model, however, would benefit from the simple model presented in this paper as a benchmark case.
- 6.4
- The model presented in this paper has proven a larger proposition, namely, that any matching process that confers an advantage to children matched to particular teachers will accumulate and result in sizeable achievement gaps in relative achievement measures by the matching factor. This process occurs whenever groups have a different likelihood of matching, and results in a multiplier effect of the matching effect. The multiplier effect depends on the probability of matching, determined by the percentage of the student and teacher population who have the minority condition, as well as the error of the process. This would apply to any matching effect, such as matching by socio-economic status, gender, or any other characteristics empirically shown to confer benefits to the matched recipient.
Limitations
- 6.5
- The model has a number of limitations. The only free, non-calibrated, parameter is the standard deviation of the error term in the educational production function. We set it at 1 standard deviation (the standard convention for z scores) indicating substantial variability among students. Good measures of the real variability could be obtained from randomized experiments, but were unavailable to us. Variations in the standard deviation of the error term do not qualitatively change any of our results and are inversely related to the multiplier effect. Smaller standard deviations facilitate the visualization of model results.
Possible expansions of the model
- 6.6
- The model was created to be expandable and adopt many other features, yet in this first paper, we use the model in a very simple way: assuming random assignment of teachers and no peer effects as a way to model the results one would obtain through an ideal randomized trial. We are quite cognizant that the current model does not exploit the capabilities of NetLogo to model educational outcomes in society. We are working on expansions of the model to include the effect of de facto racial segregation in US public schools and the presence of reinforcing peer effects to determine how these more realistic conditions impact the results presented in this paper which simulates an idealized randomized trial. As mentioned above, the addition of tracking practices to the model may also change the results and deserves careful exploration. Additionally, the same race effect may be moderated by teacher variables such as self-efficacy or teacher preparation and such moderation could be added to the existing model (Hines & Kritsonis 2010; Kukla-Acevedo 2009). The incorporation of these variables into the model will necessitate augmenting the value-added theoretical framework with richer theoretical orientations that explain how teachers and students related to each other. Other possible extensions, suggested by the importance of the adoption of value-added models as key components of teacher's evaluation in Race to the Top legislation, will include the exploration of how value added of teachers will be impacted by same race effects. In a reanalysis of the Project STAR experimental data, Konstantopoulos (2009) found that teacher effects interacted with the race of student in some grades but not others and it would be interesting to model such effects in our artificial society.
Implications
- 6.7
- Methodologically, we have shown that the creation of artificial world can aid in our understanding of the educational process by providing an environment in which variables can be changed one at a time in a systematic manner. In doing so, the model yields corollary empirically testable findings that were not immediately obvious before simulation and not reported in the empirical literature (e.g. greater variability in the minority achievement, increased gap by age). In addition, it allows us to conceptually disentangle hypotheses often confused in the literature (e.g. same race effect and tracking).
- 6.8
- Substantively, we have shown that same-race effects are capable of causing sizeable racial educational disparities at the national level and thus deserve careful empirical measurement and additional research. Generally, our model shows that any student-teacher matching effect will result in (a) an achievement gap by the matching characteristic, and (b) increased achievement heterogeneity for the students with the characteristic that has lower probability of matching. Because a multiplier effect will amplify initially small matching effects into larger achievement gaps, a better understanding of matching effects is important to design correct educational policy, including Race to the Top teacher accountability systems.
- 6.9
- A procedure to determine the impact of any possible matching factors is to (a) conduct small scale randomized trials on the matching effect to obtain unconfounded effect sizes for both the matching effect and for standard deviations in academic tests. Once this information is known, an artificial society can be constructed to determine the likely impact of these matching factors on aggregate educational data trends. As the societies are perfected, educational policy can be first modeled in the artificial society to understand its likely impact on key outcomes.
Appendix: Netlogo Code
-
;Montes, G. (2011). Using artificial societies to understand the impact of teacher student match on
;; academic performance: the case of same race effects

globals [nstudents matcheffect cuttoff differential counter]
breed [teachers teacher]
breed [students student]
teachers-own [race distr]
students-own [race distr achiev match rachiev nmatches]


to setup
 clear-all
 ask patches [set pcolor white]
 set counter 0


 ; Blue is Black or minority group and yellow is White or majority group.
 ; I use the normal distribution to set the groups to calibrated percentages.

 set nstudents pupilsperclass * nteachers
 create-ordered-students nstudents [set shape "person"
                                    set color red
                                    fd 16
                                    set distr random-normal 0 1
                                    set achiev 0
                                    set rachiev 0
                                    set nmatches 0
                                    set match 0
                                    ifelse distr <= -1.02365  [set race -1 set color blue][set race 1 set color yellow]]
 create-ordered-teachers nteachers [set shape "house"
                                    set color blue
                                    fd 10
                                    set distr random-normal 0 1
                                    ifelse distr <= -1.46471  [set race -1 set color blue][set race 1 set color yellow]]
 student-assignment
 ask links  [ifelse [race] of end1 * [race] of end2 > 0
                               [set color green
                                set thickness 0.2
                                ask end1 [set match 1
                                          ;set nmatches nmatches + 1
                                          ]]
                               [set color red
                                ask end1[set match 0] ]]
 setup-graph
end

to student-assignment
  let i nstudents
  let j 0
  let h 1
  while [ i < nstudents + nteachers]
     [ ask teacher i [create-link-with student j]
       ifelse h < pupilsperclass [set h h + 1][set i i + 1 set h 1]
       set j j + 1
       ]
end

to go
   ifelse counter > 12 [stop][
   graph
   academicprod  ;; procedure to increase academic production
   normalize
   gradechange   ;; procedure to change grade and get a new teacher
  ]
end

;; penalty simply substracts a percentage of the teacher effect
to academicprod
  ask students [set achiev achiev + teffect + match * tmatch + random-normal 0 error
                set nmatches (nmatches + 1 * match)]
  set counter counter + 1
end

to gradechange
 ask teachers [set distr random-normal 0 1]
 teacher-race
 det-match
end

to teacher-race
  ask teachers [ifelse distr <= -1.46471 [set race -1 set color blue][set race 1 set color yellow]]
end

;;end 1 is student
;; end 2 is teacher
;; if condition uses the fact that if races match product is positive and if they do not it is negative
;; green colored link indicates match

to det-match
 ask teachers[ ask links  [
             ifelse [race] of end1 * [race] of end2 > 0 [set color green
                                                         set thickness 0.2
                                                         ask end1[ set match 1
                                                                   ;set nmatches nmatches + 1
                                                                   ]]
                                                         [set color red
                                                          ask end1 [set match 0]]]]


end

to normalize
 ask students [
    set rachiev (achiev - mean [achiev] of students)/ standard-deviation [achiev] of students
     ]
end

;; Used code form the standard netlogo library to create charts
to setup-graph
  set-current-plot "Relative Achievement"
  set-current-plot-pen "axis"
  ;; we don't want the "auto-plot" feature to cause the
  ;; plot's x range to grow when we draw the axis.  so
  ;; first we turn auto-plot off temporarily
  auto-plot-off
  ;; now we draw an axis by drawing a line from the origin...
  plotxy 0 0
  ;; ...to a point that's way, way, way off to the right.
  plotxy 1000000000 0
  ;; now that we're done drawing the axis, we can turn
  ;; auto-plot back on again
  auto-plot-on

  set-current-plot "Absolute Achievement"
  set-current-plot-pen "axis"
  ;; we don't want the "auto-plot" feature to cause the
  ;; plot's x range to grow when we draw the axis.  so
  ;; first we turn auto-plot off temporarily
  auto-plot-off
  ;; now we draw an axis by drawing a line from the origin...
  plotxy 0 0
  ;; ...to a point that's way, way, way off to the right.
  plotxy 1000000000 0
  ;; now that we're done drawing the axis, we can turn
  ;; auto-plot back on again
  auto-plot-on


  set-current-plot "Relative Achievement by Number of Matches"

end

to graph
  set-current-plot "Relative Achievement"
  set-current-plot-pen "Minorities"
  plot mean [rachiev] of students with  [color = blue]
  set-current-plot-pen "Whites"
  plot mean [rachiev] of students with  [color = yellow]

  set-current-plot "Absolute Achievement"
  set-current-plot-pen "Minorities"
  plot mean [achiev] of students with  [color = blue]
  set-current-plot-pen "Whites"
  plot mean [achiev] of students with  [color = yellow]

  set-current-plot "Relative Achievement by Number of Matches"
  ask students [plotxy nmatches rachiev]

end
Acknowledgements
- I thank Dr. Jeannine Dingus-Eason and Dr. Bernard Ricca for suggestions that improved this manuscript; and Dr. Uri Wilensky, Dr. James Levin, and Dr. Michael Jacobson for assistance in locating agent-based modeling literature on education.
References
-
ALEXANDER, K. L., Entwisle, D. R., & Thompson, M. (1987). School performance, student relations, and the structure of sentiment: Bringing the teacher back in. American Sociological Review, 52, 665-682. [doi:10.2307/2095602]
BALLOU, D., Sanders, W., & Wright, P. (2004). Controlling for student background in value-added assessment of teachers. Journal of Educational and Behavioral Statistics, 29(1), 37-65. [doi:10.3102/10769986029001037]
BORDIEU, P. (1984). Distinction: A social critique of judgement of taste. Cambridge, MA: Harvard University Press.
BRAUN, H., Chapman, L., & Vezzu, S. (2010). The Black-White achievement gap revisited. Education Policy Analysis Archives, 18(21), 1-95.
BRAUN, H. I. (2005). Using student progress to evaluate teachers: a primer on value-added models. Princeton, NJ: Educational Testing Service.
BRIGGS, D., & Domingue, B. (2011). Due diligence and the evaluation of teachers: A review of the value-added analysis underlying the effectiveness rankings of Los Angeles unified school district teachers by the Los Angeles Times. Boulder, CO: National Education Policy Center.
BROOKS-GUNN, J., Klebanov, P. K., Smith, J., Duncan, G. J., & Kyunghee, L. (2003). The Black-White test score gap in young children: Contributions of test and family characteristics. Applied Developmental Science, 7(4), 239. [doi:10.1207/S1532480XADS0704_3]
DOWNEY, D. B., & Pribesh, S. (2004). When race matters: Tecahers' evaluations of students' classroom behavior. Sociology of Education, 77, 267-282. [doi:10.1177/003804070407700401]
EHRENBERG, R. G., Goldhaber, D. D., & Brewer, D. J. (1995). Do teachers' race, gender and ethnicity matter? Evidence from the National Longitudinal Study of 1988. Industrial and Labor Relations Review, 48, 547-561. [doi:10.1177/001979399504800312]
GOLDSTONE, R. L. (2006). The complex systems see-change in education. The Journal of the Learning Sciences, 15(1), 35-43. [doi:10.1207/s15327809jls1501_5]
HANUSHEK, E. A., & Welch, F. (2006). Handbook of the Economics of Education: North Holland.
HARRIS, D. N. (2008). Would accountability based on value-added be smart policy? An examination of the statistical properties and policy alternatives. Paper presented at the University of Wisconsin National Value-Added Modeling Conference.
HAWLEY, W. D., & Nieto, S. (2010). Another inconvenient truth: Race and ethnicity matter. Educational Leadership, 68(3), 66-71.
HENRICKSON, L. (2003). A feasibility study of the use of computational modeling in education research: an agent-based model of the college choice/college access problem in higher education. Dissertation & Theses, 0031, Publication No. 3100662.
HINES, M. T., & Kritsonis, W. A. (2010). The interactive effects of race and teacher self efficacy on the achievement gap in school.. National Forum of Multicultural Issues Journal, 7(1), 1-14.
JACOBSON, M. (2001). Problem solving, cognition, and complex systems: Differences between experts and novices. Complexity, 6(3), 41-49. [doi:10.1002/cplx.1027]
JACOBSON, M., & Wilensky, U. (2006). Complex systems in education: Scientific and educational importance and implications for the learning sciences. The Journal of the Learning Sciences, 15(1), 11-34. [doi:10.1207/s15327809jls1501_4]
JACOBSON, M. J. (2008). A design framework for educational hypermedia systems: theory, research, and learning emerging scientific conceptual perspectives. Educational Technology, Research and Development, 56(1), 5-28. [doi:10.1007/s11423-007-9065-2]
JACOBSON, M. J., Kapur, M., So, H.-j., & Lee, J. (2011). The ontologies of complexity and learning about complex systems. Instructional Science, 39(5), 763-783. [doi:10.1007/s11251-010-9147-0]
JONES, T., & Laughlin, T. (2009). Learning To Measure Biodiversity Two Agent-Based Models That Simulate Sampling Methods & Provide Data for Calculating Diversity Indices. The American Biology Teacher, 71(7), 406-410. [doi:10.2307/20565343]
JONES, T. C., & Laughlin, T. F. (2010). PopGen Fishbowl: A Free Online Simulation Model of Microevolutionary Processes. The American Biology Teacher, 72(2), 100-103. [doi:10.1525/abt.2010.72.2.9]
KONSTANTOPOULOS, S. (2009). Effects of teachers on minority and disadvantaged students' achievement in the early grades. Elementary School Journal, 110(1), 92-113. [doi:10.1086/598845]
KOTTONAU, J. (2011). An interactive computer model for improved student understanding of random particle motion and osmosis. Journal of Chemical Education, 88(6), 772-775. [doi:10.1021/ed100088h]
KUKLA-ACEVEDO, S. (2009). Do teacher characteristics matter? New results on the effects of teacher preparation on student achievement. Economics of Education Review, 28(1), 49-57. [doi:10.1016/j.econedurev.2007.10.007]
LEVY, S. T., & Wilensky, U. (2009). Crossing levels and representations: The Connected Chemistry (CC1) Curriculum. . Journal of Science Education & Technology, 18(3), 224-242. [doi:10.1007/s10956-009-9152-8]
MANDARA, J., Varner, F., Greene, N., & Richman, S. (2009). Intergenerational family predictors of the Black-White achievement gap. Journal of Educational Psychology, 101(4), 867-878. [doi:10.1037/a0016644]
MAROULIS, S. (2009). Agents, networks, and markets: Three essays from a complex systems perspective on educational change. Dissertation & Theses, 0163, Publication No. 3355704.
MAROULIS, S., Bakshy, E., Gomez, L., & Wilensky, U. (2010). An agent-based model of intra-district public choice. Retrieved from http://ccl.northwestern.edu/papers/choice.pdf
MAROULIS, S., Guimera, R., Petry, H., Stringer, M., Gomez, L., Amaral, L., & Wilensky, U. (2010). A complex systems approach to Educational Policy Research. Science, 330(6000), 38-39. [doi:10.1126/science.1195153]
MCCAFFREY, D. F., Lockwood, J. R., Koretz, D. M., & Hamilton, L. S. (2003). Estimating value-added models for teacher accountability. Santa Monica, CA: RAND.
MCDONOUGH, P. M. (1994). Buying and selling higher education: The social construction of the college applicant. Journal of Higher Education, 65(4), 427-446. [doi:10.2307/2943854]
MULLER, C. (1998). The minimum competency exam requirement, teachers' and students' expectations, and academic performance. Social Psychology of Education, 2, 199-216. [doi:10.1023/A:1009658725797]
OATES, G. L. S. C. (2003). Teacher-student racial congruence, teacher perceptions and test performance. Science Quarterly, 84, 508-525. [doi:10.1111/1540-6237.8403002]
OATES, G. L. S. C. (2009). An empirical test of five prominent explanations for the black-white academic performance gap. Social Psychology of Education, 12(4), 415-441. [doi:10.1007/s11218-009-9091-5]
PLANTY, M., Hussar, W. J., & Snyder, T. D. (2009). Condition of Education 2009: National Center for Education Statistics.
Planty, M., Provasnik, S., Hussar, W., Snyder, T., & Kena, G. (2007). Condition of Education, 2007: Education Dept. Institute of Education Sciences.
RAIA, F. (2005). Students' Understanding of Complex Dynamic Systems. Journal of Geoscience Education, 53(3), 297-308.
RUBIN, D. B., Stuart, E. A., & Zanutto, E. L. (2004). A potential outcomes view of value-added assessment in education. Journal of Educational and Behavioral Statistics, 29(1), 103-116. [doi:10.3102/10769986029001103]
SANDERS, W., Wright, S. P., Rivers, J. C., & Leandro, J. G. (2009). A response to criticisms of SAS EVAAS.: SAS Institute.
STIEFF, M., & Wilensky, U. (2003). Connected Chemistry-Incorporating Interactive Simulations into the Chemistry Classroom. . Journal of Science Education & Technology, 12(3), 285-302. [doi:10.1023/A:1025085023936]
WILENSKY, U. (1999). NetLogo. http://ccl.northwestern.edu/netlogo/ Center for Connected Learning and Computer-Based Modeling. Northwestern University, Evanston, IL.
WILENSKY, U., & Reisman, K. (2006). Thinking like a wolf, a sheep, or a firefly: Learning biology through constructing and testing computational theories - an embodied modeling approach. Cognition and Instruction, 24(2), 171-209. [doi:10.1207/s1532690xci2402_1]
WILENSKY, U., & Resnick, M. (1999). Thinking in levels: A dynamic systems perspective to making sense of the world. Journal of Science Education & Technology, 8(1), 3-19. [doi:10.1023/A:1009421303064]
WRIGHT, S. P., & Sanders, W. L. (2007). Decomposition of estimates in a layered value-added assessment model: SAS Institute.
YEUNG, W. J., & Conley, D. (2008). Black-White achievement gap and family wealth. Child Development, 79(2), 303-324. [doi:10.1111/j.1467-8624.2007.01127.x]