
 Abstract
- A seamless integration of software platforms for implementing agent-based models and for analysing their output would facilitate comprehensive model analyses and thereby make agent-based modelling more useful. Here we report on recently developed tools for linking two widely used software platforms: NetLogo for implementing agent-based models, and R for the statistical analysis and design of experiments. Embedding R into NetLogo allows the use of advanced statistical analyses, specific statistical distributions, and advanced tools for visualization from within NetLogo programs. Embedding NetLogo into R makes it possible to design simulation experiments and all settings for analysing model output from the outset, using R, and then embed NetLogo programs in this virtual laboratory. Our linking tools have the potential to significantly advance research based on agent-based modelling.
- Keywords:
- Agent-Based Modelling, Design of Experiments, R, NetLogo, Model Analysis, Modelling Software
Introduction
- 1.1
- Agent-based models (ABMs) are simulation models that explicitly represent individual agents, which can be humans, institutions, or organisms with their traits and behaviour (Grimm & Railsback 2005;Gilbert 2008; Squazzoni 2012). They are an established and increasingly used tool in a wide range of research fields including social sciences, economics, ecology and evolution (Thiele, Kurth & Grimm 2011).
- 1.2
- To learn as much as possible from ABMs, it would be desirable if they were routinely analysed in a comprehensive and structured way. However, in the ABM literature such analyses are the exception rather than the rule. One reason seems to be that software platforms for implementing ABMs and for statistical analysis are separated, so that thorough model analysis requires the cumbersome transfer of data via file output and input. Thorough model analysis could be simplified if agent-based simulation platforms were embedded into statistical analysis tools. A seamless integration of software for implementation and analysis would support, for example, the design of simulation experiments, the systematic storage of simulation results, and the use of advanced statistics for analysing model outputs. Furthermore, it is sometimes useful to use the functions provided by statistical software directly within an ABM implementation, for example, specific random distributions, or advanced graphical output.
- 1.3
- Such a seamless link already exists between NetLogo (Wilensky 1999) and Mathematica (Wolfram Research 2010): the NetLogo-Mathematica link (Bakshy & Wilensky 2007). It would, however, also be desirable to link NetLogo with open source statistical software. NetLogo, which was designed for implementing ABMs, has become an established and widely used free software platform and language. It has a flat learning curve, includes powerful software concepts, and is on the way to becoming a standard tool in ABM development and prototyping (Railsback & Grimm 2012). Le Page, Becu, Bommel and Bousquet (2012) show that the use of NetLogo has increased dramatically in recent years and it was the most frequently used ABM platform in 2009.
- 1.4
- We scanned agent-based modelling studies published between January 2010 and January 2012 in JASSS regarding the language or software platform used for implementation (Figure 1). In nearly one-third of the ABM studies where information about the language/toolkit was given, NetLogo was used. Moreover, at the end of 2011, the NetLogo source code was opened to the public under GPL license (Wilensky 2011), increasing its relevance as a scientific tool (Greve 2003).
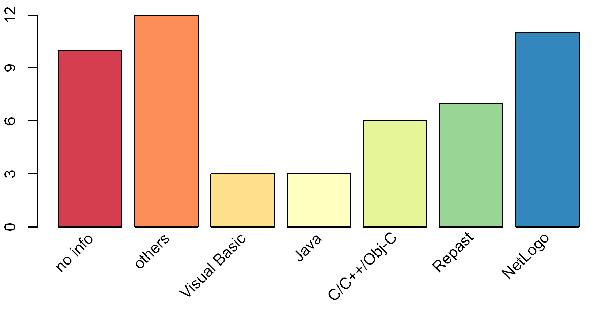
Figure 1. Review of agent-based simulation studies published in JASSS between January 2010 and January 2012 regarding the language/software platform used for the model implementation. Languages/platforms used less than three times are summarized into "others", which are namely Delphi, Python, LISP, AnyLogic, Fortran, JAS, PS-I, LEADSTO/TTL, Blanche and Cormas. "No info" means that no information about the language/platform used was given in the article. - 1.5
- On the statistics side, R (R Development Core Team 2011a) is already the standard open-source software for scientific statistical analysis as indicated, for example, by the large number of textbooks. There are currently more than 30 textbooks available on R (R Development Core Team 2011b), e.g. Crawley (2005); Dalgaard (2008); Zuur, Ieno and Meesters (2009). Furthermore, the R language ranked 19th in the TIOBE Programming Community Index for the year 2011 and competes with general purpose languages (Smith 2012). In doing so, it outpaced SAS, S, S-Plus, and Matlab (Smith 2011). Due to its extensibility a huge number of packages exist which extend the basic functionality of R or connect R to other software. Examples are the gam package (Hastie 2011) for fitting generalized additive models, the sna package (Butts 2010) for analysing social networks, or the survival package (Therneau 2011) for survival analysis. There are several so-called CRAN Task Views, where lists of available packages addressing specific topics can be found, like "Statistics for the Social Sciences" (Fox 2011) or "Computational Econometrics" (Zeileis 2012). Two other Task Views of potential interest in the context of social simulation are "Psychometric Models and Methods" (Mair & Hatzinger 2012) and "Empirical Finance" (Eddelbuettel 2011).
- 1.6
- The purpose of this communication is to make agent-based modellers in the social sciences aware of recently developed tools that allow them to link NetLogo with R. Two of these have been described in more detail elsewhere (Thiele & Grimm 2010; Thiele, Kurth & Grimm 2012), but the Rserve-Extension is new.
Embedding R in NetLogo
- 2.1
- The R-Extension (Thiele & Grimm 2010) and the Rserve-Extension of NetLogo have been developed to make the functionality of R available in NetLogo. Both extensions make it possible to send NetLogo variables to R and to get results from R back to NetLogo. They include functions (called primitives/reporters in NetLogo language) for sending variable values of agents to R, which are then transformed to appropriate R data structures. Potential uses of these extensions of NetLogo are advanced plots provided by R, the calculation of home ranges in ecological models, spatial statistics, network analysis, and the usage of specific random distributions.
- 2.2
- The difference between the R- and the Rserve-Extension is the underlying technique for communicating with R. As shown in Figure 2, the R-Extension uses a direct path via the R package "rJava" (Urbanek 2011a) whereas the Rserve-Extension communicates via a network connection with an Rserve server (for details about Rserve see Urbanek 2011b). Both extensions share the same syntax, but the Rserve-Extension does not offer the possibility to attach the underlying R session in an interactive R editor/console to NetLogo (called interactiveShell). The Rserve-Extension makes it possible to connect not only to local servers but also to remote servers. This means that multiple users can share the same R installation via a network connection and, for example, some basic data and custom functions can be supplied via a central Rserve remote server. This functionality may be of interest for class rooms or summer schools where the R-Extension is not to be configured on every computer or where a team is working with large, centrally maintained datasets in R. Furthermore, Rserve can be used simultaneously with the RNetLogo package (described in the next section).
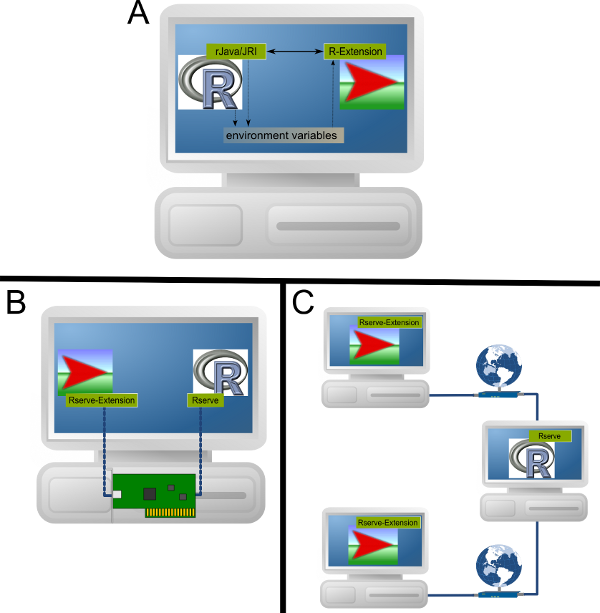
Figure 2. Communication of NetLogo's R- and Rserve-Extension with R. For the R-Extension, NetLogo uses the extension to communicate directly with R's rJava package (A). The R-Extension locates R and the rJava/JRI package by using environment variables of the operating system. For the Rserve-Extension, NetLogo uses a local network connection to communicate to an Rserve server running locally on the same machine (B) or one or multiple NetLogo clients use the Rserve-Extension to connect to a remote Rserve server via a network connection (C). - 2.3
- After a successful installation, as described in the documentation, the R- and Rserve-Extension can be included into a NetLogo model by pasting extensions [r] and extensions [rserve], respectively, at the top of the Procedures Tab. For the Rserve-Extension one has to connect to an Rserve server with the rserve:init primitive, first. After this, it is possible to send NetLogo variables to R using primitives like r:put, r:putdataframe or r:putagent (for the Rserve-Extension just replace the r: part in the primitives by rserve:). Assuming a NetLogo model contains two lists, mylist1 and mylist2, with the same number of entries, a call of (r:putdataframe "df1" "v1" mylist1 "v2" mylist2) would create an R data.frame with the name df1 and two columns v1 and v2. The values of the columns would come from the values of the two NetLogo lists. The same would be possible with agent variables. Assuming the NetLogo turtles have two turtle-own variables v1 and v2, one could create a data.frame with the same structure as above by executing (r:putagentdf "df1" turtles "v1" "v2").
- 2.4
- To execute an R function there is the r:eval primitive available. To get a visual impression of the above created data.frame one could create a boxplot in R by executing r:eval "boxplot(df1)". Furthermore, calculating a Spearman's correlation coefficient on the data.fame is possible by executing r:eval "cor <- corr.test(df1$v1, df1$v2, method=\"spearman\")" in NetLogo.
- 2.5
- To get values/variables from R into NetLogo there is the r:get reporter available. For example, to use the result of the correlation analysis in NetLogo just execute r:get "cor$estimate" to receive the correlation coefficient and r:get "cor$p.value" to get the corresponding p-value.
- 2.6
- It is also possible to get the result of an R function directly into NetLogo. For example, a NetLogo list with ten random values following a Weibull distribution can be processed by simply executing r:get "rweibull(10, shape=1) ". This calls the rweibull function of R and sends the result to NetLogo.
- 2.7
- Some examples of use are included in the examples folder of the extensions and one example is visualized in Figure 3. The extensions are available for download at sourceforge: http://r-ext.sourceforge.net and http://rserve-ext.sourceforge.net, respectively.
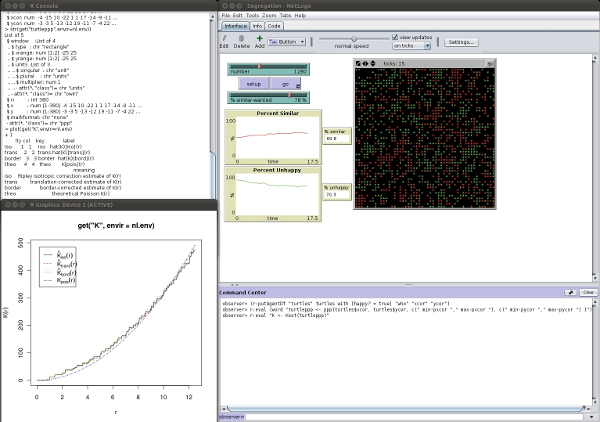
Figure 3. Example application of the R-Extension to calculate Ripley's L (from package spatstat; Baddeley & Turner 2011) for analysing the spatial distribution of happy people based on the Segregation model (Wilensky 1997a) from NetLogo's Model Library. The upper left window shows the interactiveShell editor (an R console for using/accessing the underlying R session opened directly from NetLogo; available since R-Extension version 1.0beta). The lower left window is the R plot showing Ripley's L-function, and on the right window is the NetLogo interface.
Embedding NetLogo in R
- 3.1
- As experienced modellers know, it is much more time consuming and complicated to analyse ABMs than to formulate and implement them. It therefore makes sense to use model analysis software as the primary working basis for simulations. The RNetLogo package (Thiele et al. 2012) for R makes it possible to control and analyse NetLogo simulations from R. NetLogo can be started in the so-called GUI mode or in the headless mode. The first option opens the NetLogo Graphical User Interface (GUI). In this mode, the modeller can control simulations from R as well as from the NetLogo GUI. In the headless mode, NetLogo runs in the background without a GUI. In this case, it is possible to start several NetLogo sessions in one R session.
- 3.2
- The RNetLogo package has functions for loading models, sending commands from R to NetLogo and reporting NetLogo variables to R. While using R, parameter values of the NetLogo program can be set, primitives, procedures and reporters can be executed, and values of agents can be assigned to R variables. Agents can be created and even NetLogo model source code can be extended and changed from within R.
- 3.3
- Potential uses include the exploration of models (Figure 4), the comparison of analytical models with ABM implementations, simultaneous visualizations of different state variables, and self-documentation and reporting of simulation experiments using tools like Sweave (Leisch 2002), odfWeave (Kuhn 2010) or SWord (Baier 2009). Furthermore, with the RNetLogo package and tools like RExcel (Heidberger & Neuwirth 2009), NetLogo simulations can be embedded into spreadsheets. RNetLogo is available for download at RForge and CRAN.
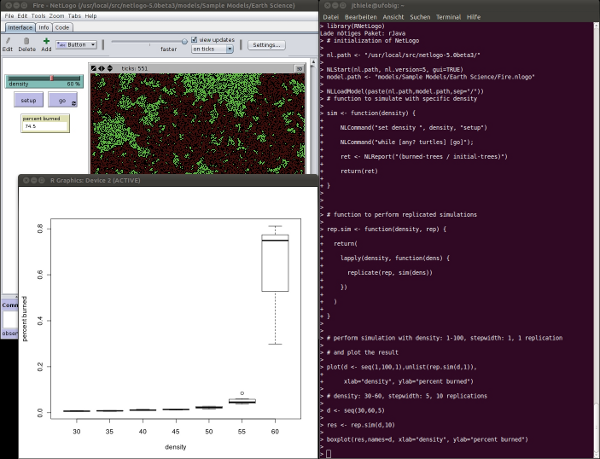
Figure 4. Example application of the RNetLogo package for model exploration, here of the Fire model (Wilensky 1997b) from NetLogo's Model Library (full example can be found in the tutorial of the RNetLogo package). On the right hand side is the basic R shell, on the upper left the NetLogo instance controlled by the R shell, and on the lower left the R plot window with the aggregated output of multiple runs for model exploration.
Conclusions
- 4.1
- Agent-based models usually include a large number of entities, processes, variables, and parameters quantifying relations between state variables. Therefore, in contrast to simple mathematical models, simulation experiments are required to test the model's implementation, to compare model output to data, patterns, and stylized facts (Meyer 2011), and to understand how model behaviour emerges. Such experiments fully correspond to real experiments in empirical research: they need to be carefully designed and controlled, and their output needs to be analysed thoroughly (Lorscheid, Heine & Meyer 2011).
- 4.2
- Agent-based modelling has not yet adopted the professional attitude of experimenters. Often, simulation experiments are designed ad hoc, are not comprehensive, and are not well communicated (Schmolke, Thorbek, DeAngelis & Grimm 2010). A change in this situation will be an indicator of the maturation of agent-based modelling as a scientific tool. To foster this development, the next generation of modellers will need to be better trained in model analysis (Railsback & Grimm 2012; Squazzoni 2012). And, we need software tools that allow agent-based modellers to make direct use of the vast amount of software available for model analysis. This is the purpose of the tools we presented here.
Acknowledgements
- We thank an anonymous reviewer for valuable comments on an earlier version of the paper.
References
-
BADDELEY, A. and Turner, R. (2011). Package 'spatstat' Manual. http://cran.r-project.org/web/packages/spatstat/. Last accessed March 14th, 2012.
BAIER, T. (2009). Package 'SWordInstaller' Manual. http://cran.r-project.org/web/packages/SWordInstaller/. Last accessed March 14th, 2012.
BAKSHY, E., and Wilensky, U. (2007). Turtle Histories and Alternate Universes; Exploratory Modeling with NetLogo and Mathematica. In M. J. North, C. M. Macal and D. L. Sallach (Eds.), Proceedings of the Agent 2007 Conference on Complex Interaction and Social Emergence (pp. 147-158). IL: Argonne National Laboratory and Northwestern University.
BUTTS, C.T. (2010) Package 'sna' Manual. http://cran.r-project.org/web/packages/sna/. Last accessed March 14th, 2012.
CRAWLEY, M. J. (2005). Statistics: An Introduction Using R. Chichester: John Wiley & Sons. [doi:10.1002/9781119941750]
DALGAARD, P. (2008). Introductory Statistics with R (2nd ed.). New York: Springer Verlag. [doi:10.1007/978-0-387-79054-1]
EDDELBUETTEL, D. (2011). CRAN Task View: Empirical Finance. http://cran.fyxm.net/web/views/Finance.html. Archived at http://www.webcitation.org/669j07qZQ.
FOX, J. (2011). CRAN Task View: Statistics for the Social Sciences. http://cran.r-project.org/web/views/SocialSciences.html. Archived at http://www.webcitation.org/669j651ON.
GILBERT, N. (2008). Agent-based Models. Quantitative Applications in the Social Sciences, SAGE Publ., Los Angeles.
GREVE, G.C.F. (2003). Brave GNU World. Linux Magazine Dec. 2003, pp. 89-91. http://www.linux-magazine.com/w3/issue/37/Brave_GNU_World.pdf. Archived at http://www.webcitation.org/669jIR5HQ.
GRIMM, V. and Railsback, S.F. (2005). Individual-based Modeling and Ecology. Princeton N.J.: Princeton University Press. [doi:10.1515/9781400850624]
HASTIE, T. (2011). Package 'gam' Manual. http://cran.r-project.org/web/packages/gam/. Last accessed March 14th, 2012.
HEIDBERGER, R.M. and Neuwirth, E. (2009). R Through Excel: A Spreadsheet Interface for Statistics, Data Analysis, and Graphics. Dordrecht: Springer Verlag. [doi:10.1007/978-1-4419-0052-4]
KUHN, M. (2010). Package 'odfWeave' Manual, http://cran.r-project.org/web/packages/odfWeave/. Last accessed March 14th, 2012.
LEISCH, F. (2002). Sweave: Dynamic Generation of Statistical Reports Using Literate Data Analysis. In: W. Härdle and B. Rönz (eds.): Compstat 2002 - Proceedings in Computational Statistics, pages 575-580. Heidelberg: Physica Verlag. [doi:10.1007/978-3-642-57489-4_89]
LE PAGE, C., Becu, N., Bommel, P. and Bousquet, F. (2012). Participatory Agent-Based Simulation for Renewable Resource Management: The Role of the Cormas Simulation Platform to Nurture a Community of Practice. Journal of Artificial Societies and Social Simulation 15(1) 10. https://www.jasss.org/15/1/10.html.
LORSCHEID, I., Heine, B.-O. and Meyer, M. (2011). Opening the 'Black Box' of Simulations: Increased Transparency and Effective Communication Through the Systematic Design of Experiments. Computational & Mathematical Organization Theory. 18(1) 22-62. [doi:10.1007/s10588-011-9097-3]
MAIR, P. and Hatzinger, R. (2012). CRAN Task View: Psychometric Models and Methods. http://cran.r-project.org/web/views/Psychometrics.html. Archived at http://www.webcitation.org/669jrwyq1.
MEYER, M. (2011). Bibliometrics, Stylized Facts and the Way Ahead: How to Build Good Social Simulation Models of Science? Journal of Artificial Societies and Social Simulation 14 (4) 4 https://www.jasss.org/14/4/4.html.
R DEVELOPMENT CORE TEAM (2011a). R: A Language and Environment for Statistical Computing. R Foundation for Statistical Computing, http://www.r-project.org/. Last accessed March 14th, 2012.
R DEVELOPMENT CORE TEAM (2011b). Books Related to R. http://www.r-project.org/doc/bib/R-books.html. Archived at http://www.webcitation.org/669k2IZUM.
RAILSBACK, S.F. and Grimm, V. (2012). Agent-based and Individual-based Models: A Practical Introduction. Princeton N.J.: Princeton University Press.
SCHMOLKE, A., Thorbek, P., DeAngelis, D.L. and Grimm, V. (2010). Ecological Modelling Supporting Environmental Decision Making: A Strategy for the Future. Trends in Ecology and Evolution 25: 479-486. [doi:10.1016/j.tree.2010.05.001]
SMITH, D. (2011): R Overtakes SAS and Matlab in Programming Language Popularity. Revolutions Blog. http://blog.revolutionanalytics.com/2011/02/r-overtakes-sas-and-matlab-in-programming-language-popularity.html. Archived at http://www.webcitation.org/65T2E9qh9.
SMITH, D. (2012): R Jumps from 25 to 19 in Annual TIOBE Rankings of Programming Language Popularity. Revolutions Blog. http://blog.revolutionanalytics.com/2012/01/r-jumps-from-25-to-19-in-tiobe-rankings.html. Archived at http://www.webcitation.org/65T2MAqz1.
SQUAZZONI, F. (2012): Agent-Based Computational Sociology. John Wiley & Sons. [doi:10.1002/9781119954200]
THERNEAU, T. (2011). Package 'survival' Manual. http://cran.r-project.org/web/packages/survival/. Last accessed March 14th, 2012.
THIELE, J.C. and Grimm, V. (2010). NetLogo Meets R: Linking Agent-based Models with a Toolbox for Their Analysis. Environmental Modelling and Software 25(8): 972 - 974. [doi:10.1016/j.envsoft.2010.02.008]
THIELE, J.C., Kurth, W. and Grimm, V. (2011). Agent- and Individual-based Modelling with NetLogo: Introduction and New NetLogo Extensions. In: K. Römisch, A. Nothdurft and U. Wunn (eds.): Deutscher Verband Forstlicher Forschungsanstalten. Sektion Forstliche Biometrie und Informatik, Internationale Biometrische Gesellschaft - Deutsche Region, AG Ökologie und Umwelt. 22. Tagung, Göttingen, 20th-21st September 2010 (pp. 68-101), ISSN 1860-4064.
THIELE, J.C., Kurth, W. and Grimm, V. (2012). RNetLogo: An R Package for Running and Exploring Individual-based Models Implemented in NetLogo. Methods in Ecology and Evolution. In press. [doi:10.1111/j.2041-210X.2011.00180.x]
URBANEK, S. (2011a). Package 'rJava' Manual. http://cran.r-project.org/web/packages/rJava/. Last accessed March 14th, 2012.
URBANEK, S. (2011b). Package 'Rserve' Manual. http://cran.r-project.org/web/packages/Rserve/. Last accessed March 14th, 2012.
WILENSKY, U. (1997a). NetLogo Segregation Model. Center for Connected Learning and Computer-Based Modeling, Northwestern University, Evanston, IL. http://ccl.northwestern.edu/netlogo/models/Segregation. Last accessed March 14th, 2012.
WILENSKY, U. (1997b). NetLogo Fire Model. Center for Connected Learning and Computer-Based Modeling, Northwestern University, Evanston, IL. http://ccl.northwestern.edu/netlogo/models/Fire. Last accessed March 14th, 2012.
WILENSKY, U. (1999). NetLogo. Center for Connected Learning and Computer-Based Modeling. Northwestern University, Evanston, IL. http://ccl.northwestern.edu/netlogo. Last accessed March 14th, 2012.
WILENSKY, U. (2011). Open Source, Message on the NetLogo Mailing List at October 27th, 2011, http://groups.yahoo.com/group/netlogo-users/message/13238. Archived at http://www.webcitation.org/669kKtxvl.
WOLFRAM RESEARCH, Inc. (2010). Mathematica Edition: Version 8.0. Champaign, Illinoise.
ZEILEIS, A. (2012). CRAN Task View: Computational Econometrics. http://cran.r-project.org/web/views/Econometrics.html. Archived at http://www.webcitation.org/669kQ1hDD.
ZUUR, A. F., Ieno, E. N., and Meesters, E. (2009). A Beginner's Guide to R. New York, NY: Springer Verlag. [doi:10.1007/978-0-387-93837-0]