
 Abstract
- This paper reports the results of the inaugural modeling competition sponsored by the Network for Computational SocioEcological Sciences (CoMSES Network). Competition participants were provided with a dataset collected from human-subjects experiments and were asked to develop an agent-based model that replicated behavioral patterns reflected in the data with the goal of using the model to predict behavioral changes in a slightly modified experimental treatment. The data were collected in a resource foraging experiment in which human subjects moved avatars on a computer screen to harvest tokens in a common pool resource. In the original experiments, on which the competition participants based their models, the subjects possessed full information about the state of the resource and the actions of the other group members sharing the resource. The competition challenged participants to predict what would happen if the experimental subjects had limited vision. Using only the data from the original experiment, participants had to design a model that would predict the behavioral changes that would be observed in the new experiment treatment. We compared the models on their assumptions about speed, direction, and harvesting decisions agents make. All the submitted models underestimated the amount of resources harvested. The best performing model was the simplest model submitted and had the best fit with the original dataset provided.
- Keywords:
- Pattern-Oriented Modeling, Competition, Calibration, Empirical Data, Behavioral Experiments
Introduction
- 1.1
- Agent-based models are typically used to study patterns in complex systems. These patterns—the "defining characteristics of a system and [its] underlying processes" (Grimm et al. 2005)—may be the spatial distribution of a resource or the temporal frequency of a human agent's resource harvesting decisions. These patterns also exist at different scales of a system, at the level of an individual agent's decisions or across a population of agents. Agent-based models enable us to understand what the underlying mechanisms might be generating the observed patterns.
- 1.2
- However, one of the main challenges in scientifically using agent-based models is in how to empirically validate them. Grimm et al. (2005) propose pattern-oriented modeling as a solution for systematically approaching the complexity of complex systems, and they argue that when a greater number of diverse types of spatial and temporal patterns are correctly reproduced for a given system, the more likely a model is structurally correct. If we test models on patterns, which patterns are sufficient? How do we evaluate multiple patterns? Currently, there are no clear guidelines for selecting and evaluating appropriate patterns.
- 1.3
- In this paper we present the results of the inaugural modeling competition sponsored by the Network for Computational Social-Ecological Sciences (CoMSES Network). Competition participants were provided with a dataset collected from a computer-based lab experiment and were asked to develop an agent-based model that replicated behavioral patterns reflected in the data with the goal of using the model to predict behavioral changes in a slightly modified experimental treatment. The task was thus to use the given patterns in the baseline experiment data to model the mechanisms underlying the experiments well enough to predict the outcomes of experiments in a new setting. The data were collected in a resource foraging experiment in which subjects moved avatars on a computer screen to harvest tokens in a common pool resource. In the original experiments on which the competition participants based their models, the experiment subjects possessed full information about the state of the resource and the actions of the other group members sharing the resource. The winner of the competition was the model that had the closest fit to data from a new set of experiments where participants were only provided limited vision of the resource space and the actions of the other group members.
- 1.4
- As some reviewers commented, one could argue that it is not fair to ask participants to predict outcomes of experiments with altered settings. In fact, the past experiment data were intentionally insufficient to test the models for these altered settings. We argue that this procedure enables us to test the predictive power of a model by observing its ability to perform in the new situations. The participants were given the specifications of the altered setting and could test the implications of their model and its assumptions. This is a much more difficult task than fitting data from past experiments. Besides requiring a structurally well-designed model, one has to make valid assumptions about how the agents might behave in new conditions. This is the typical use of models in forecasting.
- 1.5
- The competition was an initiative of the Network for Computational Modeling for SocioEcological Sciences (CoMSES Network), to hold annual challenges with a specific goal to advance a common set of activities within the community. Competitions have been used to advance agent-based models in the early days of social simulation (Axelrod 1980) and in recent times (e.g. Rendell et al. 2010). Those competitions requested models that competed with each other in an artificial world. In our inaugural challenge, we provided data from behavioral experiments and asked participants to predict the outcome of a different treatment. Because the scope of agent-based modeling is rather broad, we envision holding diverse challenges in coming years.
- 1.6
- In the next sections we present the experimental environment and the data provided to the participants. The models submitted and their performance are discussed thereafter. Next, we present a model that provides an appropriate fit for both datasets, building on the submitted models. We conclude with lessons learned from the inaugural CoMSES challenge.
Experiment design
- 2.1
- The data used in the competition were based on behavioral experiments to study self-governance of groups with members who share common resources. When individuals share a common resource, there can be a tension between individual and group motives. When individuals behave in a selfish rational manner, one might expect over-harvesting of the common resource. Data in this competition came from experiments in which participants share a spatially-distributed renewable resource during a period of a few minutes. The experimental results show that groups indeed over-harvest their common resource when there is no opportunity for communication (Janssen et al. 2010).
- 2.2
- In the experiments, the participants collect tokens from a shared renewable resource environment. Groups consist of five participants who share a 29 × 29 grid of cells (the borders do not wrap around). At the start of the experiment, 25% of the grid space is filled with tokens, thus 210 tokens are randomly allocated on the board. Each participant is assigned an avatar, which they are able to control using the arrow keys on the computer keyboard to move left, right, up, and down. The avatars are initially placed in the middle row of the screen with equal distances between the avatars. When a participant wishes to harvest a token, they have to position their avatar on top of that token and press the spacebar. Each token harvested is worth a certain amount of money (in these sessions, 2 cents each.) Participants have full view of the harvesting environment, can see the positions of all the tokens, and can observe the harvesting actions of other group members in real-time. Furthermore, counters at the top of their screens allows the participants to see the total number of tokens all participants have harvested.
- 2.3
- Every second, empty cells have a possibility of generating a new token. The probability, pt, that a given empty cell will generate a new token is density-dependent on the number of adjacent cells containing tokens. The probability pt is linearly related to the number of neighbors containing tokens: pt = P · nt / N where nt is the number of neighboring cells containing a token, N is the total number of neighboring cells (N = 8), and P = 0.01. If an empty cell is completely surrounded by eight tokens, it will generate a token at a higher rate than an empty cell that abuts only three tokens. The model space is not toroidal, so cells located at the edges of the screen have fewer neighbors than interior cells. For example, a corner cell only has 3 neighbors (N=3). At least one adjacent cell must contain a token for a new token generation to occur. Therefore, if participants appropriate all of the tokens on the screen, they have exhausted the resource and no new tokens will be generated. By designing the environment in this manner, the experiment captures a key characteristic of many spatially-dependent renewable resources.
Experimental data
- 3.1
- The experimental data were collected from experiment sessions in which five groups were formed consisting of five participants each (Janssen et al. 2010; Janssen 2012). Prior to forming groups, the participants received instructions on the experiment and were tested for their understanding of those instructions. They were then allowed to practice at their workstation for 4 minutes on an individual 13 ×13 grid. They did not know at that time that they would be put together into groups for the actual experiment phase. In the group experiment, each participant saw their own avatar as a yellow dot, while the avatars of other participants were blue. Each avatar also had a number 1, 2, 3, 4 or 5 (Figure 1).
- 3.2
- The experiments consisted of multiple 4-minute decision periods in which different treatments were used. The dataset provided for this competition only included the first decision period from the experiments. We did this to avoid the complications of model learning and communication. Hence we used only the data of the simplest situation, where participants could neither communicate nor punish, and are participating together for the first time to share a common resource.
- 3.3
- We will now present the aggregated data of the baseline experiments on which the competition participants based their models. We also include the data from the limited-vision treatment which was used for measuring the predictive fit of the model submissions.. The detailed information on the data can be found at http://www.openabm.org/page/2010-modeling-competition-instructions. The new experiment situation that the competition participants were asked to predict had one difference from the original treatment: the experiment participants had only limited vision. They could only see tokens and avatars within a 6-cell radius of their own avatar. As we will see, all competition submissions systematically mispredicted the effect of reduced vision.
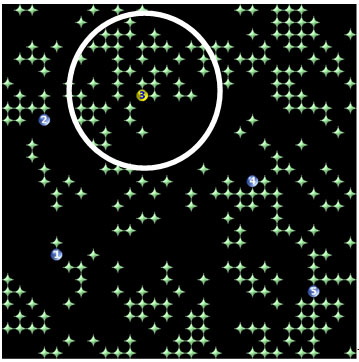
Figure 1. A screenshot of the experiment environment. The green star-shaped figures are resource tokens; the circles are the subjects' avatars (yellow is the subject's own avatar; blue represents other group members. The large white circle denotes avatar 3's visual range in the limited-vision treatment. In those experiments, avatar 3 is only able to see the tokens and avatars inside that circle. - 3.4
- In the following figures, we have included the aggregated data from the baseline and altered-treatment experiments that we asked to be predicted. Each of these measurements was also provided by the model submitters for cross-model comparison, including a test for closeness of fit. Figure 2 depicts the average number of tokens still on the screen. This was a key measurement in studying the outcomes of the models, because we found they all exhausted the resource much more quickly than the experimental groups.
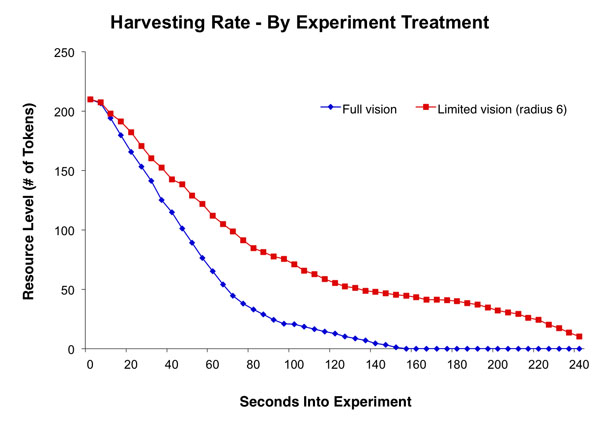
Figure 2. The average amount of tokens in the common resource for the two conditions: Participants having full vision and full information of the actions of others, and limited vision where participants have limited information of the actions of others. - 3.5
- The total number of tokens harvested per group was 285 for the full-vision condition, and 340 for the limited-vision condition. One possible explanation for the higher resource levels in the limited-vision condition relates to conditional cooperative behavior. With limited vision, participants are not able to directly observe when other participants harvest more and faster than they do. This leads to a delay of rapid harvesting. In Janssen (2012) the experimental results of limited- and full-vision are discussed, showing that after the first round, there are no differences in harvesting behavior between limited- and full-vision. This can be explained by the observation that many participants in social dilemma experiments are conditionally cooperative. They cooperate if others do too. In the full-vision treatment, they quickly observe the other participants harvesting rapidly, and they begin harvesting rapidly too. In the limited-vision treatment however, this information diffusion is delayed. But in round two the expectations on what others do is corrected, and they will harvest quickly from the start in the limited-vision treatment, like in the full-vision treatment.
- 3.6
- The second statistic we considered was the distribution of harvesting events to number of neighboring tokens. As discussed in "Experimental Design," the greater the number of neighboring cells that are occupied with tokens, the higher the probability that an empty cell will be replenished in the subsequent time step. An optimal strategy of harvesting to maximize regrowth and harvesting profits would involve maintaining a checkerboard pattern of tokens. In other words, four tokens around a cell that is harvested. Figure 3 shows that the groups harvested the most tokens when only 2 or 3 tokens were on neighboring cells.
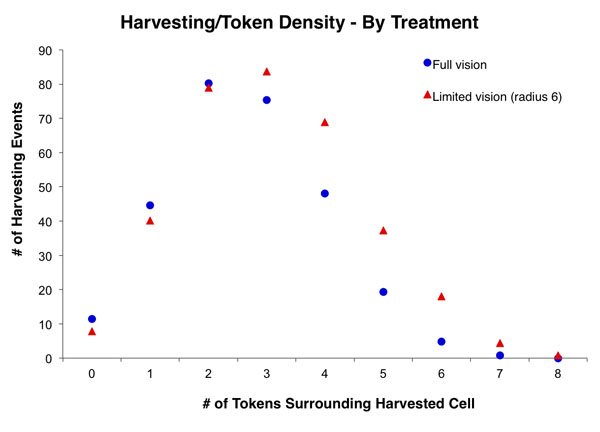
Figure 3. The distribution of harvesting events defined by the number of tokens around a cell that is harvested. The distribution is defined by the harvesting events of all groups in each treatment. - 3.7
- In addition to the harvesting distribution, the avatars moved around but not in a random walk. As discussed in Janssen et al. (2009), participants are more likely to move in straight lines. This might be due to the cost, namely time, in changing directions. Figure 4 shows the distribution of straight moves over all movements for the experimental groups.
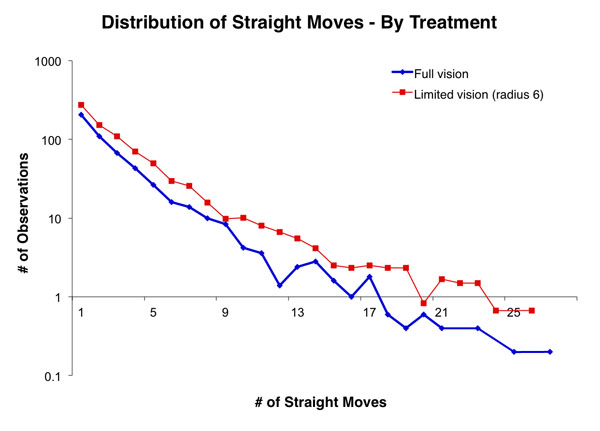
Figure 4. Distribution of number of straight moves of an avatar before changing direction. - 3.8
- The final statistic we considered was the distribution of earnings within groups. There was a significant difference in the number of tokens collected by individuals within each group. The average gini coefficient of the baseline dataset was 0.204. The average gini coefficient from the limited-vision experiments was slightly smaller: 0.199.
- 3.9
- To determine the winner of the competition, we calculated a Closeness of Fit score for each model based on its results in each of the above metrics compared to the new dataset from the limited-vision experiments. In order to compare the different metrics, we first normalized each metric to an equivalent scale:
- Resource size values (Figure 2) were divided by 210, the initial number of tokens on the screen.
- The number of tokens harvested was scaled by subtracting 210 tokens and then dividing that value by 400. Division by 400 was based on the fact that the maximum number of tokens that can be harvested in a decision period of 4 minutes is just above 600 tokens.
- The number of harvesting events for each level of token density (number of tokens on neighboring cells as shown in Figure 3) were divided by the total number of harvesting events.
- The number of observations for each level of straight moves (as depicted in Figure 4) were divided by the total number of movements.
- The gini coefficient was already between 0 and 1.
- 3.10
- Then, we calculated xr,i,j, the squared difference between the empirical data and the simulated data for each metric. Since the actual experiments were performed with 6 groups (the 5 baseline groups, plus the new limited-vision group), we compared the metrics of the average numbers of these 6 groups with 6 simulated groups. To reduce the effect of the stochastic elements of the agent-based models, we ran the models 100 times for each of the 6 groups. The resulting Closeness of Fit score S of the model is defined as:
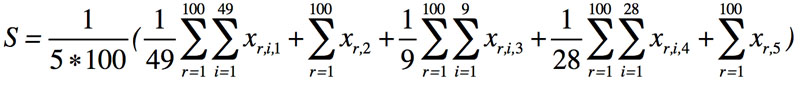
(1) The best score possible is 0. The model that resulted in the best score among the submitted models was the winner of the competition.
Results
-
Models submitted
- 4.1
- Five entries were received, and all models were implemented in NetLogo. We first analyzed the differences between the models in their assumptions. The participants knew about the model published by Janssen et al. (2009), which provided an agent-based model for a similar environment. In that model, the agents' movement rate were heterogeneous and drawn from an empirically derived distribution. Agents moved towards the token with the highest value-weighting indicators. Agents valued tokens positively when they were in a straight line, when they were nearby and not many other agents were around it. The agents were more likely to harvest a token if more tokens were around the cell on which the agent was located. Some of the entries in this competition were inspired by Janssen et al. (2009), but they all differed in various ways. To maintain the anonymity of the contributors, we will refer to the models as M1 to M5.
Action Rates
- 4.2
- Some models implemented movements and harvesting actions as discrete keystrokes that counted against an agent's keystroke limit. Not all models did, however. M3 explicitly implemented a keystroke logic that checked to see if an agent had any keystrokes available before performing a movement or harvest. Model M1, likewise, included harvesting events in its logic, by allowing an agent to either harvest or move during its turn, thus enforcing a strict keystroke limit. The other models did not make that distinction, like M4, which always harvested a token immediately after moving to a patch containing one.
- 4.3
- All models but one, M2, used fixed keystroke rates. In these cases, agents performed a fixed number of actions each time step and did not alter their rate anytime during the model run. While models M3 and M5 each implemented homogenous agent keystroke rates—where all agents performed the same number of actions each time step—the other models implemented heterogeneous action rates, where each agent potentially performed a unique number of actions during a given time step. Model M1 assigned a rate to each agent from a distribution of 3, 1, 2, 2, 2 for the five agents, and M4 assigned a random rate to each agent during model setup, so that the average rate for all agents was 3.
- 4.4
- Model M2's innovation for movement rate was a dynamic rate that each agent chose each time step based upon the number of tokens within its visual field. The author's assumption was that an agent would move faster if fewer tokens were visible and less urgently if many tokens were available.
Movement Direction
- 4.5
- All models, except M5, implemented some level of awareness that straight moves are preferable to frequent changes in direction. The most common solution was to include a probability that an agent would change its direction. The agents in M2, for example, always had a 98% probability of moving in the same direction they took in the previous time step. If they didn't continue straight, then they aimed for the patch with the strongest distance and token-density relationship. Models M1 and M3 each included a dynamic probability for straight moves. M1 used a probability of continuing a straight move if no tokens are visible. M3 calculated the probability for continuing straight based on the number of time steps passed in the model run, so the probability increased as time passed.
- 4.6
- The most complex algorithm for direction selection was found in M4. In this model, an agent chooses a direction by weighing the strength of each potential destination patch within its visual field based on four factors to produce a single "Token Value" for that candidate: (1) the current direction the agent is facing and the number of tokens in that heading, (2) the number of tokens adjacent to a potential destination patch, (3) the number of other agents in the vicinity of that patch, and (4) the distance to that patch.
Harvesting
- 4.7
- Harvesting strategies varied between the models. In M1 and M4, agents always harvested tokens from the patches they moved onto. In M2, agents always had a 50% chance to harvest a token. M3 used a more complicated harvesting scheme including a heterogeneous agent commons-concern parameter that determined the probability an agent would harvest a token.
Inter-Agent Strategy
- 4.8
- Only two models included adaptation of agent behavior based on the activity of other agents. M4 included the presence of agents near a potential target token as a disincentive factor against choosing to move toward that token, and M5 modeled agent sensitivity to the level of cooperation expressed by the other agents, based on the availability of tokens in view, on whether to be cooperative or not.
Table 1: Basic assumptions of the 5 submitted models Model Speed Direction Harvest M1 Fixed distribution of movements per second: 1, 2, 2, 2, 3 Target the token closest to the agent within the radius. If there is no token within the radius move straight with probability 0.95k , where k is the number of straight moves Always when a target is reached M2 Minimal two moves. Less moves when there are more to tokens are nearby Move to the direction with the token that maximizes (1 / distance) plus the number of tokens around the token. If there are no tokens in vision, move randomly 50% of the time when on a cell with a token M3 8 keystrokes per second (harvesting and movement) Targets nearby tokens more frequently the more seconds have passed. A 30% probability to randomly change direction. If next cell is occupied turn 180 degrees. Always when neighbors cells have 1 token. Otherwise, agents have different preferences how frequent to harvest. On average 80% of the time, but standard deviation of this rate is 25% M4 In the first few seconds of the experiment the speed is low and agents speed up to about 3 moves per second. Individual speed is fixed and range between 2 and 4 moves per second. Agents evaluate tokens in vision. Tokens are valued if they are in straight line of direction of agent, have many nearby tokens, have not many other avatars nearby and are close to the agent. Each agent has a unique level of bounded rationality which determines how many tokens to explore to find the best token value. Always when agent is on a cell with a token M5 Six moves per second Agents evaluate whether there is at least a certain fixed number of tokens in the vision. If so, agents are cooperative and move randomly around. Otherwise, agents are non cooperative move to the cell with a token. If agent is in cooperative mode harvest only if there are at least 3 tokens around the cell. If agent is not in cooperative mode, harvest always if token on a cell. Performance of predictions
- 4.9
- Table 2 presents the model scores for each metric as well as the average of the metrics. Since not all the models had implemented the data output algorithms correctly or consistently, we corrected those models and ran all models for the results presented here. Model 1 has on average the lowest score and is the winner of the competition. This model was submitted by Giangiacomo Bravo. Interestingly, this model was only the best performing model for two of the metrics, namely the harvesting distribution and the gini coefficient. Model M2 had the best score for two metrics (Resource Level and Total Harvest), as well as tying with M4 for a third (Straight Moves).
Table 2: Scores of predictions. M1 is best performing model on average M1 M2 M3 M4 M5 Resource level 0.0296 0.0291 0.0402 0.0592 0.1035 Total harvest 0.0198 0.0076 0.0229 0.0336 0.0554 Distribution harvest 0.0102 0.0118 0.0123 0.0120 0.0124 Straight moves 0.0003 0.0002 0.0017 0.0002 0.0060 Gini 0.0004 0.0167 0.0013 0.0042 0.0014 Total 0.0120 0.0131 0.0157 0.0218 0.0357 - 4.10
- Model M1 is an interesting situation, because besides performing so well overall, it had one of the least complicated designs of all the submissions. It doesn't specifically include logic for adaptive harvesting or token density. Agents aim for the nearest token in their visual field, and they harvest every token they come across. The primary constraint on agent movement and harvesting is in their keystroke rates, set individually for each agent from a master distribution list: 3, 1, 2, 2, 2. Thus one agent has a rate of 3 keystrokes per time step, one agent has only 1, and the others each have 2. M1 is also only one of two models that accounts for harvesting actions as keystrokes, thus reducing the number of moves an agent may take during that time period. It is likely the author's calibration of the keystroke rate distribution that explains the model's overall success, as well as its success with the distribution harvest metric. It should also be noted that the model's simplicity also resulted in a smaller variance in the model's data output due to less adaptation in agent behavior, which also contributed to its stronger performance in the metrics. The greater variability in results generated by the other models is due to their more adaptive logic and sensitivity to starting conditions, thus their increased variance put them at a disadvantage in the metric calculations.
- 4.11
- Model M2 had the best scores for 3 of the 5 metrics, Resource Level, Total Harvest, and Straight Moves. As previously described, the resource level metric is a measure of the health of the resource over the duration of the experiment, and the closer a model is able to replicate the experiments' resource depletion rate over time, the better the score that model will receive (Figure 5.)
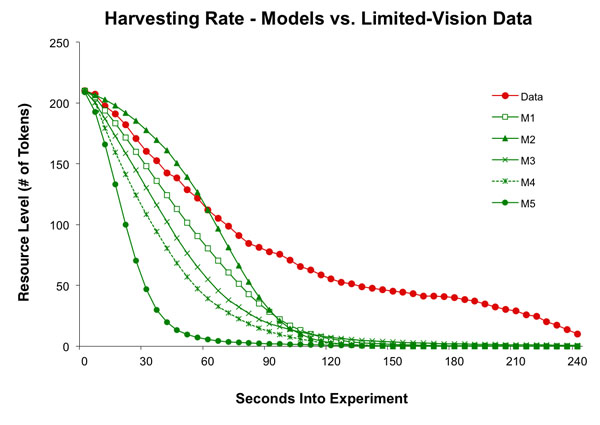
Figure 5. The average amount of tokens in the common resource for the experiment with limited vision, and the predicted amount by the five models. - 4.12
- Total Harvest, on the other hand, measured the total number of tokens all agents harvested over the full experiment. Due to resource regrowth, more moderate harvesting could result in improved regrowth rates and increased wealth generation for the session. As seen in Table 3, M2 came the closest to the dataset's total harvest rates, while simultaneously generating the most equitable distribution for the agents.
Table 3: The average amount of tokens harvested by the group and the average gini coefficient experiment for experiments with limited vision and for the predictions of the six models Total harvest amount Gini Data 340.0 0.199 M1 284.0 0.204 M2 307.1 0.071 M3 280.0 0.217 M4 268.5 0.224 M5 246.0 0.173 - 4.13
- The Harvest Distribution metric is a measure of how often a token is harvested based on the number of neighbor patches that also contain tokens, thus it is a measure of harvesting rates associated with token density. Although M1 had the best score for Harvesting Distribution, as Figure 6 shows none of the models accurately predicted the distribution in the experimental data. The curve in the limited-vision data is nearly identical to the distribution in the full-vision treatment, and the author of M2 specifically discussed this distribution in his documentation. Interestingly, he posited that this distribution would change in the limited-vision treatment to be more left-side dominant like the results the models all generated.
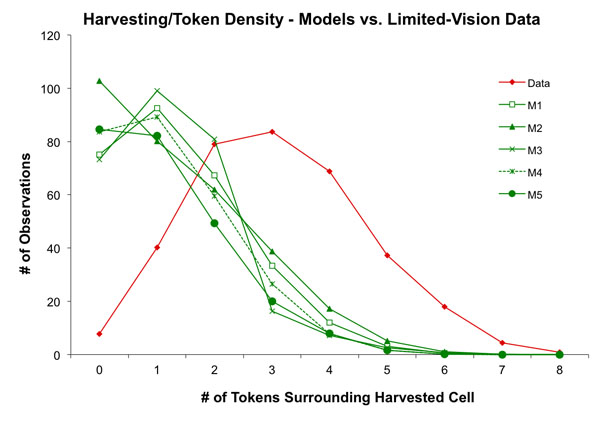
Figure 6. The distribution of harvesting events defined by the number of tokens around a cell that is harvested. The data is from experiments with human participants and limited vision, as well as the prediction of five models - 4.14
- Model M4 tied with M2 for the best predictions of straight moves. Both of these models used complex algorithms for determining agent behavior, although M4 was the most complex of the submissions. In modeling straight movements, the author of M2 derived a frequency table of straight moves against total moves from the original, full vision dataset, and assumed that the experiment subjects in the limited-vision treatments would not favor straight moves quite as heavily due to increased risk, and M2 was calibrated accordingly.
- 4.15
- While other models accounted for distance and token density in choosing destination patches, M4's direction sub-model is based upon 4 weighted factors to produce a sum value for each potential destination patch. These factors, in line with Janssen et al. (2009), corresponded to: (1) the current direction the agent faced and the token density in that direction, (2) the number of tokens adjacent to a potential destination patch, (3) the number of agents near that potential destination patch, and (4) the distance to that potential destination patch.
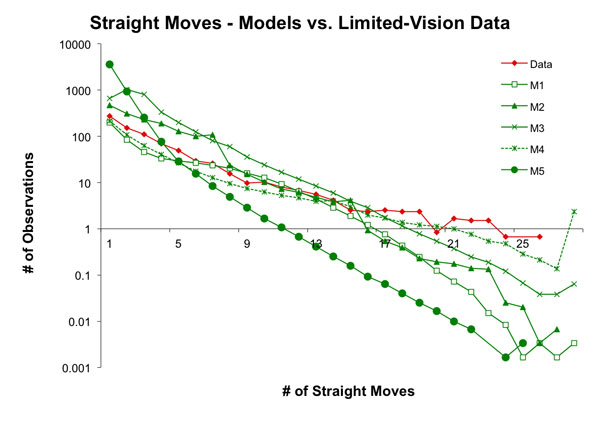
Figure 7. Distribution of number of straight moves of an avatar before changing direction for experiments with human participants in the limited vision treatment and the predictions of five models Calibration of the model
- 4.16
- In order to get a sense of how strongly each model was calibrated with the full-vision data before they were altered for the limited-vision treatment, we adjusted the models to use full-vision and collected their data output for another full set of test runs. We did this by increasing the vision radius checks to encompass the entire model space regardless of agent location.
- 4.17
- We found two models did not perform correctly under full vision, models M2 and M5 (Figure 8.) We know that M2 was calibrated on the original dataset but the modeler adjusted the parameters for limited vision to account for expected changes in strategies. We did not receive the parameters used for the baseline calibration. A core design principle in M5 is agent sensitivity to the harvesting behavior of other agents. Depending on the quantity of tokens an agent can observe, it follows two possible behavioral modes, cooperative or non-cooperative. In the cooperative state, an agent moves randomly and probabilistically harvests the tokens it comes across. If the number of tokens in visual range drops below a threshold, an agent then moves toward patches with tokens and harvests every token it can. M5's limited success in both limited-vision and full-vision treatments appear to be due to a lack of calibration of the model's parameters. Likewise, the threshold parameter must be adjusted for the increased vision radius, because agents' cooperation threshold was never crossed due to the number of total tokens in the full world space.
- 4.18
- M1 was best calibrated model, and performed the best on 4 of the 5 indicators. Note that M1 predicted a slight but significant increase in the average number of tokens collected (284 versus 281) if we reduce the vision, while we actually observed a large increase (284 versus 340) in the actual data. Hence, the model might be improved to capture the large effect of limited vision with human participants.
Table 4: Scores of calibration. M1 is best performing model on average M1 M2 M3 M4 M5 Resource level 0.0014 0.9799 0.0034 0.0224 3.3467 Total harvest 0.0002 0.0034 0.0009 0.0009 0.2834 Distribution harvest 0.0070 0.0005 0.0085 0.0088 0.0100 Straight moves 0.0012 0.0027 0.0023 0.0080 0.0014 Gini 0.0003 0.0163 0.0014 0.0041 0.0563 Total 0.0020 0.2005 0.0033 0.0088 0.7396 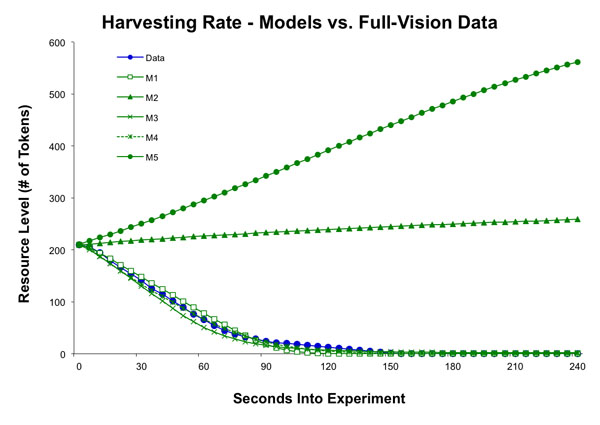
Figure 8. The average amount of tokens in the common resource for the experiment with full vision, and the predicted amount by the five models
Conclusions
- 5.1
- As the inaugural CoMSES challenge, we have learned some lessons about preparing a competition like this, as well the challenges in modeling empirical datasets and calibrating models to data.
- 5.2
- In addition to the questions we received during the competition and from analyzing the models submitted, it is clear that our initial instructions were not as clear and unambiguous as we originally thought. Analyzing the submissions proved challenging due to these discrepancies, and we had to resolve potential issues by altering or adding our own output code to ensure the data was output in a consistent format for analysis, while carefully ensuring we did not touch any model logic.
- 5.3
- There is a delicate balance between providing too much information to frame the development of the model, which could reduce the diversity of innovative solutions by focusing attention on our framing of the model, and the amount of work participants have to perform to participate in the competition. We made the decision to not provide a reference model or demonstration code, because we anticipated submissions would make use of a variety of different modeling platforms, such as NetLogo, RePast, or MASON. We also did not want to influence possible solutions authors might explore with our own code. In practice, all models were developed in NetLogo.
- 5.4
- In hindsight, we should have provided a basic NetLogo model as a framework that supplied the basic user interface and data output structures on which the modeling solutions could be implemented. This would have ensured the submitted models produced appropriate output statistics and included the correct basic assumptions, such as resource regeneration. Additionally, we should have specified more precisely the quality of model documentation to be provided.
- 5.5
- The programming quality of the submitted models was quite diverse. In future challenges we should request cleaned up code with clear documentation and comments (in English). We also noted that two models changed their parameters values from the calibration for full-vision to the predictions for the limited-vision. If the aim of testing models on experimental data is to develop more general models of decision making, changing the parameters of the decision making process for new treatments should not be permitted.
- 5.6
- It was interesting that the best-performing model was only best on average. The winning model did not receive the strongest Closeness-of-Fit scores for all metrics. Instead, it was simply not terribly far off in any. We used a highly specific equation on how we weighted the different metrics, which was provided in the competition instructions. Different weightings of the metrics may have led to a different winning model. This is likely an unavoidable problem if we want to test the model on different patterns.
- 5.7
- A remarkable finding of the competition was that the models did not predict the much higher quantity of total harvested tokens in the limited vision treatment. In fact, the submitted models did not include assumptions about agent expectations of other agents' behavior. The best performing model on the limited vision treatment was also the best calibrated on the provided dataset. Nevertheless, the systematic underestimation of the effect of limited vision shows the importance of challenging modelers with out-of-sample predictions to reveal potential lacunas of the model. Janssen (2012) argues that the difference is due to conditional cooperation. When people can see the behavior of others, they may catch up quickly with the fastest harvester. In the limited vision perspective, most participants overestimated the level of cooperation and continued modest harvesting rates for a longer time. None of the models submitted explicitly included the aspect of conditional cooperation.
- 5.8
- We have presented the results of a modest inaugural modeling competition. Within computer science these competitions have been very fruitful to improve the field. We plan to do so in the coming years. If you would like to participate or have suggestions for future challenges, check http://www.openabm.org.
Acknowledgements
- We acknowledge the financial support from the National Science Foundation and feedback on earlier versions of the manuscript by Volker Grimm, Michael Barton and the competition participants.
References
-
AXELROD, R. (1980). Effective Choice in the Prisoner's Dilemma. Journal of Conflict Resolution, 24(1), 3-25. [doi:10.1177/002200278002400301]
GRIMM, V., Revilla, E., Berger, U., Jeltsch, F., Mooij, W.M., Railsback, S.F., Thulke, H-H., Weiner, J., Wiegand, T. and DeAngelis, D. (2005). Pattern-Oriented Modeling of Agent-Based Complex Systems: Lessons from Ecology. Science, 310, 987-991. [doi:10.1126/science.1116681]
JANSSEN, M.A. (2012). The role of information in governing the commons: experimental results, in review.
JANSSEN, M.A., Holahan, R., Lee, A. and Ostrom, E. (2010). Lab Experiments to Study Social-Ecological Systems. Science, 328, 613-617. [doi:10.1126/science.1183532]
JANSSEN, M.A., Radtke, N.P., Lee, A. (2009). Pattern-oriented modeling of commons dilemma experiments. Adaptive Behaviour, 17, 508-523. [doi:10.1177/1059712309342488]
RENDELL, L., Boyd, R., Cownden, D., Enquist, M., Eriksson, K., Feldman, M.W., Fogarty, L., Ghirlanda, S., Lillicrap, T. and Laland, K.N. (2010) Why Copy Others? Insights from the Social Learning Strategies Tournament. Science, 328, 208-213. [doi:10.1126/science.1184719]