
 Abstract
- The process by which genes and memes influence behaviour is poorly understood. Genes generally may have a strong influence as predispositions directing individuals towards certain behaviours; whereas memes may have a less direct influence as information inputs to cognitive processes determining behaviour. In certain areas of medical science, knowledge has progressed towards approximate quantification of genetic influences, while social psychology can provide models of mimetic influence as the spread of attitudes. This paper describes a computational model integration of genetic and mimetic influences in a healthcare domain. It models mimetic influences of advertising and health awareness messages in populations with genetic predispositions towards obesity; environmental variables influence both gene expression and mimetic force. Sensitivity analysis using the model with different population network structures is used to investigate the relative force of meme spread and influence.
- Keywords:
- Agent Models, Network Simulations, Health Informatics, Bayesian Models
Introduction
- 1.1
- Since Dawkins (1976) launched memes as a rival but complementary influence to genes, the relative influence exerted by memes and genes has inspired much debate (Tooby & Cosimides 2005; Whiten et al. 2011). The spread of memes, or in more neutral terminology of ideas, norms and information, has been modelled extensively in the diffusion of innovations (Rogers 2003; Dunn & Gallego 2010) and cultures (Acerbi & Parisi 2006). Similarly, genetic influence has been subject to extensive simulation in evolutionary models for the emergence of cooperative behaviour (Nowak & Sigmund 1998, 2004; Hruschka & Henrich 2006; Roberts & Renwick 2003). However, models combining both gene expression and mimetic propagation are less common, possibly because developing such models has proven difficult given the scarcity of empirical data on nature-nurture influences.
- 1.2
- Memes generally are held to be units of information which can be transmitted between humans and have some influence on the behaviour or attitude of the recipient (Dawkins 1989). As memes are spread through a population they undergo some transformation during their propagation, hence blending models have been proposed for mimetic spread which are similar to more general theories of social learning and information diffusion in groups (Boyd & Richerson 2005; Van Schaik & Burkart 2011; Heylighen & Chielens 2008). As Blackmore (1999) points out, mimetic propagation depends on faithful copying of ideas or mimicry of behaviour, which may be underpinned by a genetic predisposition.
- 1.3
- The process by which genes and memes influence behaviour is poorly understood, although genes generally may have a stronger influence as predispositions directing individuals towards certain behaviours (e.g. tendency to become obese, Yang et al. 2007); whereas memes may have a less direct influence as information inputs to cognitive processes determining behaviour. However, gene-meme interactions are likely to be very variable and context dependent. Although gene-meme interaction is complex, in certain areas of medical science knowledge has progressed towards approximate quantification of genetic influences, while social psychology and marketing can provide models of mimetic influence as the spread of attitudes (Mahajan et al. 1995; Grier & Bryant 2005). For example, genes that influence obesity, and their possible expression in populations, have been investigated (Lyon & Hirschorn 2005). Genetic influences on behaviour are generally acknowledged to be influenced by the environmental context, as predispositions that influence personality and cognitive processes such as decision making (Payne et al. 1993). While decision making is a complex cognitive function at the individual level, the influence of ideas on attitudes and behaviours in populations has been empirically quantified in surveys (Canoy & Buchan 2007; James 2008; WHO 2000). It is therefore becoming feasible to model combined effects of genetic and mimetic influences in some areas where empirical investigation and theory have advanced sufficiently to propose preliminary computational models. Computational models can summarise the current state of knowledge in an area, and more importantly provide an exploratory 'what-if?' tool to investigate and motivate further hypotheses and theory development (Epstein 2008).
- 1.4
- However, given the complexity of gene expression and gene interaction, let alone gene-meme interaction, it is prudent to first explore the potential simulation architecture to evaluate the scale of problems which could be addressed and assess the role of simulations in progressing scientific inquiry in medicine. This motivation arose from preliminary discussion with medical researcher colleagues in epidemiology who, while being sceptical about the value of computational modelling given the incompleteness of knowledge in many medical domains, nevertheless supported development of a 'proof of concept' demonstration to explore the potential of simulation in their domain of obesity research. The paper describes a computational model for investigating the relative influence that genes and memes may exert on human behaviour within a population over a behavioural time-scale, i.e. the genes are assumed although their phenotypes may vary. We anchor the modelling in a healthcare domain where some data exists to cross-check the model output with empirical observations. First, the background and model specification are described, followed by the results of scenario-based simulations. We then reflect on our experience and discussions with medical colleagues on the model output and future potential.
Healthcare Domain: The Obesity Crisis
- 1.5
- Increase in obesity is a widespread concern for healthcare professionals in OECD countries. The tendency to put on weight appears to be subject to genetic variation (James 2008; WHO 2000); however, obesity is also known to be influenced by socio-demographic factors (i.e. the environment), and mimetic influences such as healthy-living campaigns and advertising by the fast-food industry (UK Department of Health 2008; Grigsby-Toussaint et al. 2011). A current and continuing concern in healthcare research is how to make healthy living campaigns more effective, to encourage people to improve their diet and take more exercise (Williams et al. 2007; Bouchard et al. 1993). A parallel debate focuses on arguments about the relative influence of advertising and availability of foods which are likely to encourage obesity (UK Department of Health 2008; WHO 2000). Hence, modelling the relative influences of these positive (healthy lifestyle) and negative (advertising) memes within a genetic context is of considerable interest to healthcare researchers, professionals and policy makers.
Model Architecture
- 2.1
- We chose to model the interaction between genes and memes with Bayesian networks, because most influences are probabilistic rather than deterministic, and Bayesian nets support modelling multiple causal influences on behaviour. Gene-meme interaction is a particular concern for researchers in epidemiology where genetic influences on obesity are acknowledged to be affected by environmental factors (Yang et al. 2007; McLaren 2007), while researchers in health interventions and epidemiology are interested in the interaction between persuasion, health-related information (i.e. memes) and behavioural outcomes. (Lucas 2004). Bayesian nets have been developed as multivariate causal models in a variety of domains; for example, to assess risk and the operational reliability of air traffic control systems (Luxhøj et al. 2001). Furthermore, Bayesian models are familiar in medical informatics (Lucas 2004).
- 2.2
- Bayesian nets are causal networks that enable reasoning about probabilistic relationships between variables, based on the sound mathematical basis of Bayes' Theorem (Pearl 1988). The example in Figure 1 is a model fragment that describes the influence of the sea-state and visibility (prior probabilities, known or estimated as input) on external environmental conditions (posterior probability calculated by Bayes' Theorem).
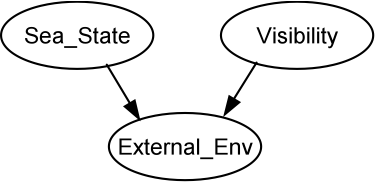
Figure 1. Fragment of a Bayesian net model - 2.3
- Bayes' theory is based on the distribution of influences of prior probabilities on posterior probabilities, which are defined in a Conditional Probability Table (CPT), as shown in Table 1. For example, if we know that the probability of the sea-state being bad is high and the visibility low, then the overall probability of the external environment being poor is increased. Hence in Table 1, column 1, the analyst has asserted that if the sea-state is high (bad) and the visibility is low, then the probability of the external environment being poor is 1.0, with zero probabilities of it being medium or low. CPTs are configured by estimating the probabilities for the output variables by an exhaustive pairwise combination of the input variables.
Table 1: Conditional probability table for the external environmental variable. The probability distribution in this example uses three possible states (h/m/l) Sea-state High Medium Low Visibility H M L H M L H M L External Environment Poor 0.33 0.75 1 0.2 0.5 0.75 0 0.25 0.6 Medium 0.34 0.25 0 0.2 0.3 0.20 0 0.35 0.3 Good 0.33 0.00 0 0.6 0.2 0.05 1 0.40 0.1 - 2.4
- When the net and CPTs have been completed, Bayes Theorem is used to calculate the probability of each state of each node in the net. The theorem is shown in equation 1:
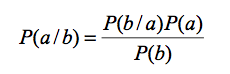
(1) where
P(a/b) = posterior (unknown) probability of a being true given b is true
P(b/a) = prediction term for b given a is true (from CPT)
P(a) = prior (input) probability of a
P(b) = input probability of b
or, less formally: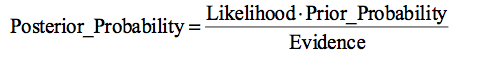
- 2.5
- Input evidence values are propagated through the network, updating the values of other nodes. The network predicts the probability of certain variable(s) being in particular state(s), given the combination(s) of evidence entered. BNs have to conform to a strict hierarchy since cycles lead to recursive and non-terminating propagation of probabilities by the algorithm. This imposes some compromises in modelling influences, which can be partially overcome by introducing additional input nodes to model cyclic influences, although this increases the complexity of the network and the control process for the algorithm.
- 2.6
- Causal networks can be constructed by sequential application of Bayes' formula, in which the relative influences are set in conditional probability tables. CPTs can be created automatically by learning algorithms when large-scale datasets associating prior and posterior variables are available; however, complete data is frequently not available, so CPTs are set by expert judgement in combination with historic data when it is available (Neil et al. 2000; Luxhøj et al. 2001). The Bayesian network for the obesity healthcare domain is illustrated in Figure 2.
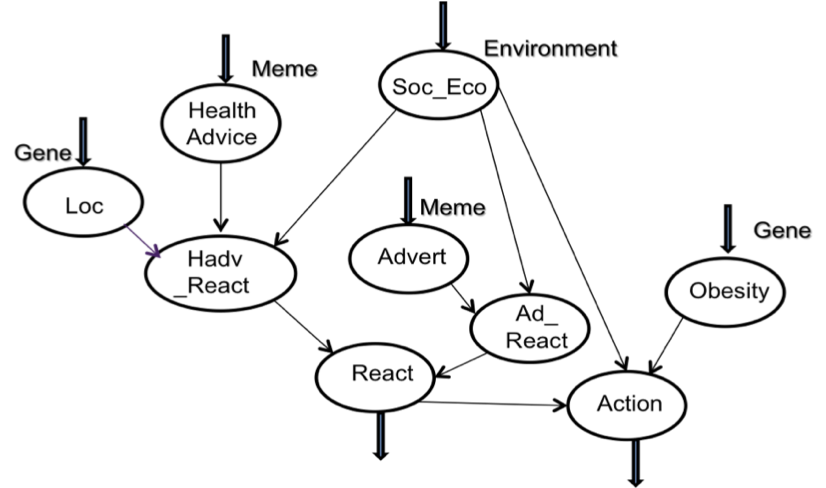
Figure 2. Gene-Meme Bayesian Network. Arrows at the top indicate input nodes for scenario settings; arrows at the bottom show output nodes which give probabilities for outcomes - 2.7
- The model was derived from the literature on medical investigations into the causes of obesity and healthcare management (UK Department of Health 2008; Haslam & James 2005; Goodman at al. 2003; Canoy & Buchan 2007) in consultation with healthcare researchers. Model specification was an iterative process organised in cycles of eliciting knowledge from medical experts and the literature, and drafting initial network diagrams which were explained to medical researchers in 'walkthroughs' of the causal influences. Medical experts in Warwick Medical School (Professor Frances Griffiths and colleagues) provided advice on the model in meetings during September to December 2010, while more general domain knowledge on the epidemiology of obesity was elicited from medical researchers in the School of Medicine, University of Manchester (Professor Iain Buchan and Dr D. Canoy). Notes were taken during meetings and the 'walkthrough' which were similar to semi-structured interviews. This led to considerable discussion about the uncertainty of many influences, given the partial evidence in the literature. Rather than model many fine-grained influences, a policy was adopted to keep the model simple and adopt coarser and more general influences where some evidence was available, even though precision was sacrificed. For example, the socio-economic effect on obesity, although well established, is complex and varies between countries (McLaren 2007). Females who are better off in poor countries tend towards obesity, while the converse is true in richer countries. Males do not show such a strong association. Similarly, the relationship influence of adverts on different socio-economic classes is complex even within the food industry, as it depends on product type, how it is presented, etc. Rather than model all these influences explicitly, the generalisation policy resulted in two influence relationships for adverts in the meme part of the model and one for the genetic influence, even though this also masks considerable complexity (Yang et al. 2007). The model has five child nodes at the top of the diagram which represent:
HAdv Health Advice is the meme representing information on healthy lifestyles. Although health awareness campaigns usually combine advice which could be treated as several separate memes, e.g. dietary advice, encouraging exercise, eating less, etc., for simplicity we treat this advice as one meme. The strength of this meme is assigned as input energy which reflects how well the advice is argued and delivered.
Ad Adverts or the meme describing promotion by the food industry of products likely to encourage obesity (i.e. fast food). Although this information is complex and multi-variate, e.g. television and in-shop adverts, it is feasible to treat this as a single meme which has a continuing presence. The meme represents information that influences food consumption choices. It is assigned an input energy to represent the force of product advertising.
Ob Obesity; this is the genetic tendency for an individual to gain weight on any particular diet. Genes which have a significant influence on people becoming obese have been reported in the medical literature (Lyon & Hirschorn 2005). Although genetic influence is a complex haplotype (many interacting genes) and gene expression is environmentally dependent (Yang et al. 2007), in the model this was simplified to a single influence on action, as a surrogate for diet and exercise, while the environmental interaction was modelled by a relationship between socio-economic and action.
Loc Locus of control; a personality attribute which determines an individual's predisposition to take decisions and control of their own life as opposed to being influenced by others (Rotter 1966). While no locus of control gene has been identified, it is a stable human characteristic related to personality attributes (McCrae & John 1992) and therefore a good candidate for genetic influence. Some personality attributes are stable across an individual's lifetime, while others, such as openness, can change with age (Acerbi et al. 2009). Locus of control tends to be stable with age.
SocEco Social and economic status, a context variable which is acknowledged to be a key influence on behaviour, including diet and exercise (UK Department of Health 2008; Canoy & Buchan 2007; Bouchard et al. 1993). Low or poor socio-economic status interacts with the genetic tendency to become obese, since overweight parents tend to have higher birth-weight children and this in turn increases the chances of those individuals becoming obese when adults (Goodman et al. 2003; Peña & Bacallao 2000).
- 2.8
- All five of the above input nodes can be set to reflect different modelling scenarios. Although Bayesian nets can accept continuous variables as input, to simplify experimental controls discrete variables with three settings were used:
- HAdv and Ad: energy - High/Medium/Low settings
- Ob: tendency to become obese - High/Medium/Low
- Loc: tendency to take decisions and hence follow health advice - High/Medium/Low
- SocEco - Rich/InBetween/Poor.
- 2.9
- Intermediate nodes integrate influences on meme expression, so HAdvReact calculates the probability of reaction to health advice, given various SocEco environment and Loc (gene) settings, while AdReact calculates the reaction to adverts according to the Loc gene and SocEco environment. Output probabilities from these nodes feed into React which models the likelihood of accepting either meme. Finally, output from React (belief) feeds into Act which calculates the likelihood of taking action based on belief from a combination of the memes, given settings for the Obesity gene and SocEco environment. Separate Act and React nodes allowed us to model the meme-network effects separately from the genetic influences on action, so both React and Act outputs are reported. The React part of the network represents a high-level generalisation of cognitive decision making which combines information inputs and personal characteristics (Payne et al. 1993), while the genetic influence on Act is direct since genetic predispositions are less likely to be conscious, cognitive processes.
- 2.10
- Hence the output variable React models the probable change in attitude in the light of HAdv and Ad, for an individual SocEco and Loc. React is the individual probability of belief prior to action. Act describes the probable Action an individual may take to exercise or improve their diet, given the React input and their Obesity gene. The model assumes positive influences towards accepting healthy lifestyle arguments and adopting advice on diet, exercise, etc. In our health-related model the internode influences are reflected in the CPTs (conditional probability tables) which embed theoretical or empirically based assumptions in the BN model, such as:
- Rich people will be influenced less by adverts than will poor people, and the converse.
- Individuals with low self-efficacy (locus of control, Loc) are less likely to react positively to health advice (HAdv) than are high Loc people.
- High energy Ad memes tend to dominate high HAdv memes (adverts are generally more effective than healthy living advice) to influence React.
- 2.11
- The HAdv-React part of the network represents the influences on decisions to change behaviour that conflict with influences on an existing behaviour to follow a poor diet. React models the battle between the influence of Health Advice memes, combined with the Loc personal predisposition to 'take control' and decide to change, with socio-economic moderation thereon, and the Ad memes with socio-economic moderation which reinforce the current behaviour to follow a poor diet. A sample CPT that implements one of the assumptions is illustrated in Table 2.
Table 2: CPT for prior influences of SocEco and Ad on the AdReact node Soc Eco rich medium poor Ad high medium low high medium low high medium low high 0.5 0.2 0 0.7 0.33 0.1 0.9 0.5 0.2 medium 0.3 0.3 0.1 0.2 0.34 0.2 0.1 0.3 0.3 low 0.2 0.5 0.9 0.1 0.33 0.7 0. 0.2 0.5 - 2.12
- The table shows an exhaustive pairwise combination of all the parent node settings (i.e. 3 nodes × 3 settings = 9), with the posterior probability distribution of the child node (AdReact) being high/medium/low. The influences encoded in CPTs can be summarised approximately as rules, e.g. "When SocEco and Ad are high their influence is equal; but Ad dominates overall". This reflects the dominant influence of adverts on the likelihood of a reaction, although this is tempered by socio-economic status, i.e. rich people are less likely to be swayed by adverts than are poor people.
- 2.13
- The model architecture is summarised in Figure 3. Individual agents were modelled as the BNs illustrated in Figure 2. Agent populations could be configured with genetic predispositions (e.g. Obesity and Health Locus of Control), by setting the desired proportion of agents with high/low input values for the relevant input nodes.
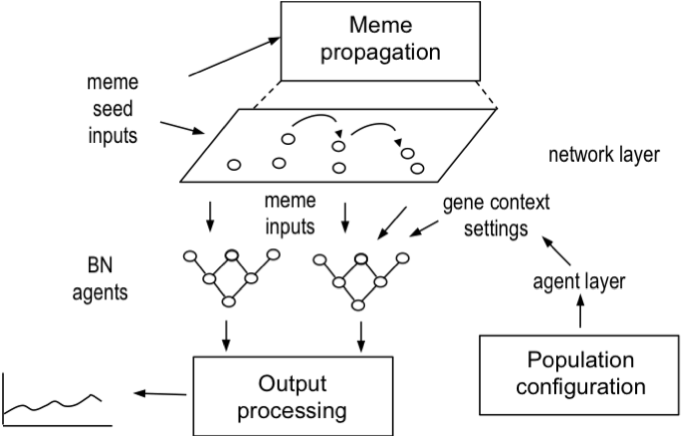
Figure 3. Model of the simulation architecture, showing agents and network layer - 2.14
- Context variables (e.g. socio-economic status) are input settings according to the population scenario being tested. Input variables for the two memes, HAdv and Ad, are assigned to a number of seed agents and then spread according to the network model configuration, (random diffusion, zone diffusion, network constrained diffusion) described in more detail below. Waning parameters control the decay of memes from initial strength settings (high/medium/low) during each cycle of the model run. Model outputs are the probabilities of all agents in the population following the appropriate healthy life style advice (Act) given the conflict between positive health messages and negative advertising to influence the opposite course of behaviour (e.g. eating too much junk food).
- 2.15
- The Gene-Meme BN model was implemented in the Genie open source tool (www.genie.org), with Java scripts for controlling the network layer model and producing output. The Genie BN model and control program can be found in the software library www.abn.org- http://www.openabm.org/model/2558/version/1/view
Simulation Experiments
- 3.1
- The Gene-Meme model was run with an exhaustive combination of input node settings to reflect a range of scenarios, e.g. strong and weak health campaigns (H/M/L HAdv energy) in the presence of stronger or weaker Ad memes, with population variations from rich to poor, Loc (H/M/L) and Obesity (H/M/L). Table 3 illustrates the model's predictions for Reaction (React) and Action (Act) with the most favourable input settings for a health awareness campaign, i.e. the population is rich and hence more susceptible to advice and health issues, Obesity within the population is low so taking exercise is easier, while Locus of Control is high so individuals are more likely to follow advice and take action.
Table 3: Model predictions with the best case input settings Memes Genes Environment Effect HAdv Ad Loc Ob SocEco React Action LOW HIGH HIGH LOW RICH 1.9962 2.2418 MEDIUM HIGH HIGH LOW RICH 2.1307 2.3128 LOW MEDIUM HIGH LOW RICH 2.2671 2.3825 HIGH HIGH HIGH LOW RICH 2.2652 2.3838 MEDIUM MEDIUM HIGH LOW RICH 2.4025 2.4524 HIGH MEDIUM HIGH LOW RICH 2.5379 2.5223 LOW LOW HIGH LOW RICH 2.5379 2.5223 MEDIUM LOW HIGH LOW RICH 2.6739 2.5911 HIGH LOW HIGH LOW RICH 2.8099 2.6599 - 3.2
- React and Action values are expressed as weighted probabilities since the Bayesian net actually produces three probabilities, one for each H/M/L category. High is weighted 3, medium 2 and low 1, to give a net likelihood for the health advice being accepted (React) and then action being taken to lose weight (Act). The net likelihoods are ranked approximately from bottom to top in terms of the desired effect (react positively/take action) with a maximum value of 3. The model demonstrates that the Health Advice meme can produce the desired outcome even in the face of strong competition (Ad = high); however, the better outcomes emerge when the competing meme is weak (Ad = low). Interestingly and somewhat counter-intuitively, the model suggests that health campaigns can succeed in some circumstances, even when they have weak impacts (Adv = low). This is produced by the strong interaction with genes (Ob, Loc) and the positive environmental setting (SocEco = rich). However, most health campaigns have to succeed when these conditions are adverse. The model's predictions for worst case settings are given in Table 4.
Table 4: Model predictions with worst-case settings Memes Genes Environment Effect HAdv Ad Loc Ob SocEco React Action LOW HIGH LOW HIGH POOR 1.1899 1.3445 MEDIUM HIGH LOW HIGH POOR 1.3239 1.4197 HIGH HIGH LOW HIGH POOR 1.4579 1.4948 LOW MEDIUM LOW HIGH POOR 1.4579 1.4948 MEDIUM MEDIUM LOW HIGH POOR 1.5925 1.5733 LOW LOW LOW HIGH POOR 1.7252 1.6459 HIGH MEDIUM LOW HIGH POOR 1.7271 1.6518 MEDIUM LOW LOW HIGH POOR 1.8607 1.7280 HIGH LOW LOW HIGH POOR 1.9962 1.8107 - 3.3
- In this case the settings are the opposite of those in Table 3, i.e. the target population is poor, with a high tendency to be obese, and a low tendency (Loc gene) to take control of their lives and react positively to advice. The net likelihoods for React and Act are ranked approximately from bottom to top of the table, with the worst possible outcomes (i.e. low probabilities of positive action) at the top. The adverse effect of the food industry promotions (Ad = high) of obesity-inducing foods is apparent, and this meme succeeds even in the face of strong health advice memes. Poor outcomes also emerge even when advertising is low and the health advice meme is strong. This reflects the dominance of genes and the environmental context; memes only compete effectively when they interact within favourable contexts. In this case the model reflects what health policy makers are acutely aware of: it is difficult to get poor obese people to change their ways (UK Department of Health 2008).
- 3.4
- When all combinations of input settings are run, the input scenarios which produce the best- and worst-case outcomes can be examined to see if they conform to the initial intuitions illustrated in Tables 3 and 4. Not surprisingly, the best five outcomes for React and Action (see Tables 5a and 5b) share many settings with the best-case scenarios in Table 3; however, some changes are apparent.
Table 5a: Input settings which produced the best-case Reaction likelihoods Rank Memes Genes Environment HAdv Ad Loc Ob SocEco 1 HIGH LOW HIGH HIGH RICH 2 HIGH LOW HIGH MEDIUM RICH 3 HIGH LOW HIGH LOW RICH 4 MEDIUM LOW HIGH HIGH RICH 5 HIGH LOW MEDIUM HIGH RICH Table 5b: Input settings which produced the best-case Action likelihoods Rank Memes Genes Environment HAdv Ad Loc Ob SocEco 1 HIGH LOW HIGH LOW RICH 2 MEDIUM LOW HIGH LOW RICH 3 HIGH LOW MEDIUM LOW RICH 4 HIGH MEDIUM HIGH LOW RICH 5 LOW LOW HIGH LOW RICH - 3.5
- The Obesity gene has more influence on unfavourable reaction outcomes (Table 6a). This is a consequence of the BN model where the obesity gene influences the propensity to continue with an unhealthy lifestyle and not to accept advice. The scenarios where the locus of control gene is medium indicates that health campaigns might succeed even when populations are not strongly predisposed to take advice. This is a realistic assumption, as populations tend to show a normal distribution on the Loc scale (Rotter 1966). However, the model still predicts the dominant effect of the obesity gene and SocEco environment.
Table 6a: Input settings which produced the worst-case Reaction likelihoods Rank Memes Genes Environment (1= worst) HAdv Ad Loc Ob SocEco 1 LOW HIGH LOW HIGH POOR 2 LOW HIGH LOW MEDIUM POOR 3 LOW HIGH LOW LOW POOR 4 LOW HIGH MEDIUM HIGH POOR 5 MEDIUM HIGH LOW HIGH POOR Table 6b: Input settings which produced the worst-case Action likelihoods Rank Memes Genes Environment (1= worst) HAdv Ad Loc Ob SocEco 1 LOW HIGH LOW HIGH POOR 2 LOW HIGH MEDIUM HIGH POOR 3 MEDIUM HIGH LOW HIGH POOR 4 LOW HIGH HIGH HIGH POOR 5 MEDIUM HIGH MEDIUM HIGH POOR - 3.6
- For worst-case outcomes (see Tables 6a and 6b) the environment appears to be the dominant factor since all settings are poor, with the obesity gene exerting a dominant influence. Locus of control is less influential, while the potential for the Ad meme to be successful when it is strong is obvious. The model can be used flexibly to explore many other scenarios which domain experts consider appropriate, for example, medium settings for gene expression (Ob and Loc) are reasonable assumptions for most populations. The variations of health campaigns (HAdv) can be tested for different target populations in the presence or absence of competing Ad memes.
- 3.7
- The Bayesian model simulates competition between memes and genes within one individual which can be scaled to population-level simulations by running multi-agent models; however, this does not account for the spread of memes among a population, i.e. the propagation of memes within a population by copying/imitation. The next stage of the model adds a population dimension as a network layer to model mimetic propagation as a consequence of interaction among many agents, each one represented by a Bayesian net.
Network Layer
- 3.8
- Social influences on obesity include social relationships; for example having obese friends in one's social network increases the chance that an individual will be obese, and kin have a similar influence (Christakis & Fowler 2007). More generally it has been argued that social influences on behaviour depend on the closeness of social relationships, with very intimate friends providing more help and emotional support than less intimate friends (Stiller & Dunbar 2007). Granovetter's (1973) theory of the influence of weak ties in social networks predicts that information spreads through networks via weak ties that connect clusters of individuals. In the medical domain the importance of social networks on information diffusion and product adoption was demonstrated by Iyengar et al. (2010) in a study on drug product adoption in social professional networks of doctors. Many different network influences could be modelled; however, after discussion with our medical expert users, three different network models were chosen to illustrate, at a high level, the effect of simple random diffusion of memes, versus a more geographic spatial spread and finally spread in a social network. The social network was loosely modelled on Dunbar's Social Brain Hypothesis with individuals connected in clusters of strong tie relationships, with weaker connections between clusters (Granovetter 1973), although the model was not based on direct empirical evidence. Consequently, three network architectures, illustrated in Figure 4, were implemented to investigate different modes of meme propagation within a population:
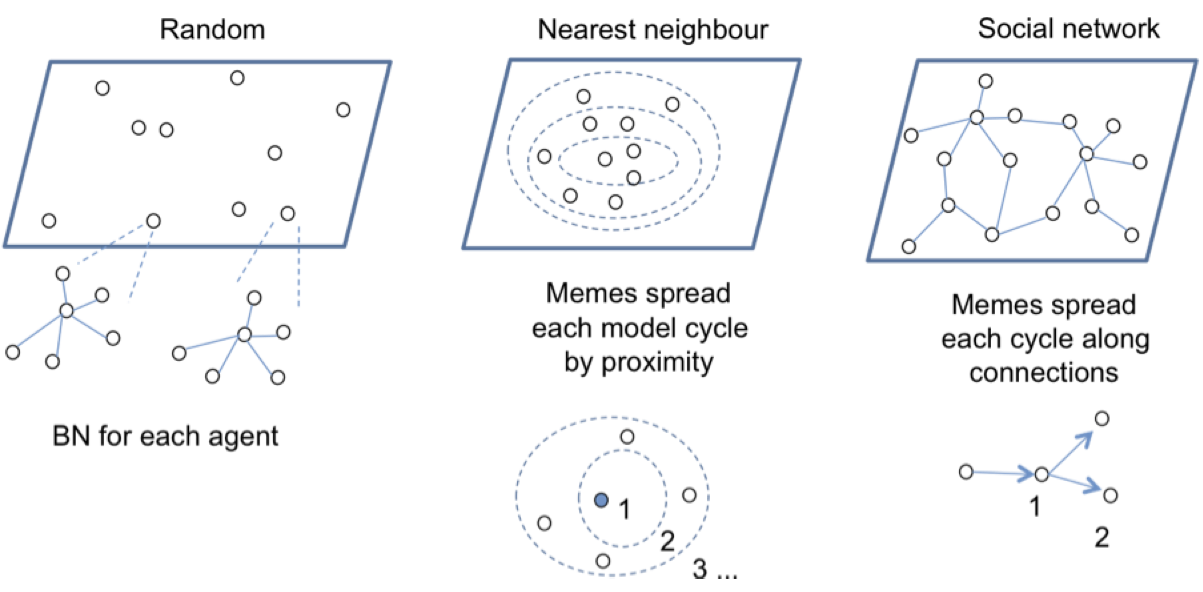
Figure 4. Network layer models Random
- 3.9
- Spread in this population is determined at random according to a chosen diffusion rate, e.g. at 0.02 the meme will propagate from a single seed individual to 2% of the population, so to 20 agents in a population of 1000. Spread is determined by the product of the number of seeds and the rate, so 10 seeds @ 0.02 will spread to 200 agents in each cycle. The diffusion rate is exponential according to the number of seeds or agents which have received the meme.
Nearest neighbour
- 3.10
- This population models a spatial distribution of agents by assigning agents into sub-populations in virtual concentric circles, so a population of 1000 could be organised into five concentric sub-populations of 200 from inner to outer layers. The diffusion rate determines the spread rate from a seed agent which is located in the innermost layer, so the meme first spreads to the next layer (20 agents @ 0.02) then to the next layer and so on. The nearest neighbour model simulates a geographically constrained spread by word of mouth within geographic areas
Network
- 3.11
- Social networks are based on a hub and spokes topography where a central individual is connected to 5-6 good friends; these hubs have relatively sparse connections to other hubs. This reflects findings from empirical surveys of human relationships that people are connected to a small number of best friends, a few more close friends and then a larger number of acquaintances of weak ties (Wellman et al. 1988, 2006; Stiller & Dunbar 2007; Granovetter 1973). Inter-hub connections model weaker ties as friends of friends. Memes spread only along social relationship connections, so from a single seed individual the meme propagates among that individual's immediate social circle before gradually spreading among the whole population. This model is word-of-mouth spread, taking social structures into account.
- 3.12
- The agent population was set at 90, split into 3 × 3 combinations of Obesity and Loc gene settings (H/M/L). The population size of 90 was selected to provide sufficient agents to model a mixture of strong and weak ties in the network configuration, with reasonable run-time efficiency. Increasing the population to N 120 or 150, to reflect Dunbar's predicted limit on social relationships (Stiller & Dunbar 2007) created much longer run times. A population N=90 enabled three settings for each gene expression (strong, medium, weak) within a heterogeneous socio-economic population. SocEco settings were generated from a continuous variable with a normal distribution and randomly assigned to each agent. The categories of SocEco were defined as < 0.3 poor; 0.3 < 1.7 medium; and > 1.7 rich.
- 3.13
- Network variables' settings were:
- Waning rates acted on each meme to decrease the initial strength as cycles progressed. Waning acted on the initial input energy and decreased it (E × WR) at either a rapid rate (0.8) or more slowly (0.97, 0.95).
- Diffusion rates which controlled the rate of spread among the agent population, either quickly (0.03, 0.05) or more slowly (0.02, 0.01).
- Seed agents, the number of agents receiving the meme for the first propagation cycle, either a sparse setting (2, 3) or a more dense initial input (10, 15).
- 3.14
- The model was run for 50 cycles to produce an aggregated total and average React and Action likelihood results for the whole population on a time-line of cycles as the memes spread, while also being subject to waning. Waning modelled the decreasing effectiveness of the memes as the messages became familiar and hence the tendency to act upon them was reduced.
Network Model Results
- 3.15
- The first simulation compared low HAdv seeds (2, 3) and slow diffusion rates (0.02, 0.03) with more favourable Ad seed and diffusion rate settings (10, 15 / 0.05, 0.08) with waning rates that overlapped although overall favouring Ad (0.95, 0.9; HAdv 0.9, 0.8). This equated with a worse case for the health awareness campaign in competition with adverts from the food industry. The most favourable results for HAdv impact from the random network layer are illustrated in Figure 5(a)-(c).
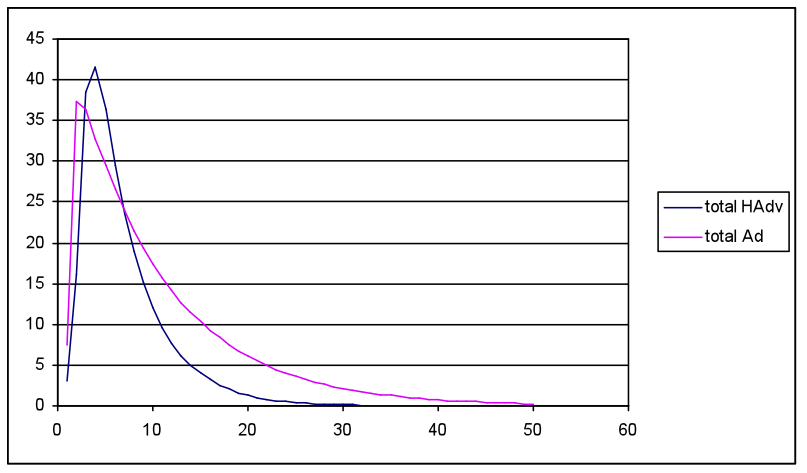
(a) Total meme energy HAdv and Ad over simulation 50 cycles 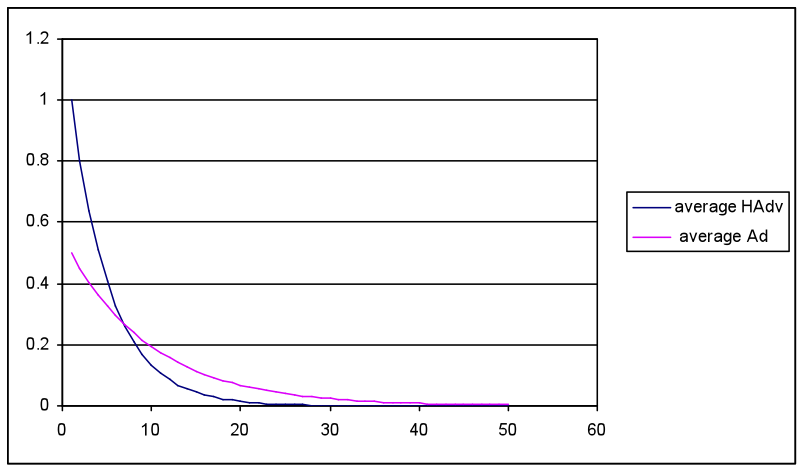
(b) Average meme energy over 50 cycles 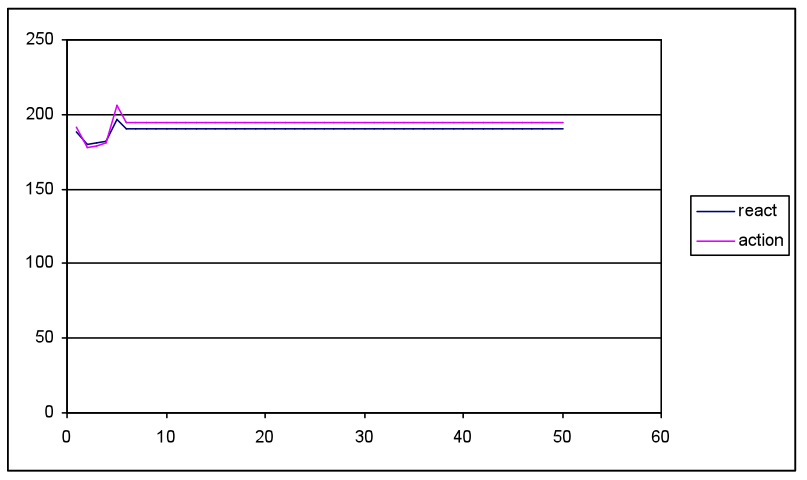
(c) Total output values for Act and React over 50 cycles, where 180 = initial values from agent population settings Figure 5. Diffusion model results with input settings for meme strength Ad= 0.5 (low) and HAdv 1.0 (high), but with unfavourable HAdv settings for seed 3, and diffusion 0.03, and more favourable to Ad (15, 0.05) with equal waning rates (0.9) - 3.16
- Simulation runs with the random network produced a similar pattern to Figure 5, i.e. both total HAdv and Ad peaked within 10 cycles then waned to low levels by cycle 20. The average meme strengths followed the same pattern, although the total strength shows a rapid increase as the memes spread throughout the population. The Act/React values show an initial dip followed by a peak then a plateau. The initial decline matches the more rapid spread and increase in the Ad meme, which adversely influences a favourable React and Act outcome. As HAdv spreads and overtakes the Ad meme it causes a favourable peak in both React and Act. The subsequent plateau is a consequence of the model inputs, where the constant Ob, Loc and SocEco settings interact with declining meme values to produce positive React and Act values, which are slightly higher than the cycle 1 initial results.
- 3.17
- Two runs, which shared high HAdv and low Ad initial strengths, produced higher HAdv peaks than Ad, while overall the results were insensitive to setting/diffusion parameters (i.e. HH, HL combinations produced no marked effects), demonstrating that meme energies (strengths) and waning rates are the more influential parameters. The Act/React graphs showed peaks that mapped to the phasing of Ad and HAdv peaks, for example a later HAdv peak produced a consequent delay in the React/Act peak to cycle 15.
- 3.18
- In the nearest neighbour network simulations with the same inputs and parameter settings, fewer favourable outcomes emerged with only two of the nine runs producing HAdv and Ad peaks, and even then the Ad peak was much higher; see Figure 6.
(a) Total meme strength (b) Total meme strength 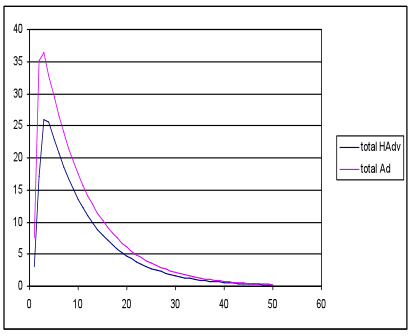
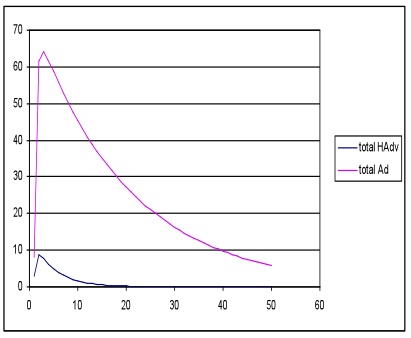
generations generations Figure 6. Favourable (a) and unfavourable (b) outcomes with the nearest neighbour network models, with the same seed, energy and waning rate settings as in Figure 5 - 3.19
- The social network models performed worst with none of the runs producing favourable results, and only three runs had small peaks in HAdv strength. Waning reduced HAdv strength since the propagation constraints in the social network showed spread of this meme, whereas Ad were modelled with a random spread since this was a plausible assumption for TV advertising. Spreading advice by social networks may supplement geographic spread but is unlikely to succeed on its own.
- 3.20
- Comparison of the network layer models illustrates the importance of the spread of mimetic influence. Broadcast produces the most favourable conditions for mimetic competition between Health Advice and Adverts, given the same genetic environment, although higher energies are necessary for HAdv to succeed and even then the advantage of Health Advice is quickly eroded by waning. This result agrees with empirical findings that promoting the effectiveness of health campaigns becomes progressively more difficult over time.
Reflections
- 3.21
- The BN obesity simulation was developed as a concept demonstrator to explore the possibilities of computational models with health-policy and medical-informatics researchers. Its role, therefore, was to demonstrate the potential of computational modelling in medical epidemiology rather than explicitly represent theory or provide a practical decision support system. The specification of the Bayesian model was the outcome of consultation with medical colleagues; however, it was acknowledged that the model was only a best guess for demonstration purposes, since medical experts were not willing to spend more time developing a more accurate model. This was a consequence of the project objectives: to produce a concept demonstrator simulation rather than an operational tool.
- 3.22
- The simulation model with the scenarios and results described in this paper were presented to medical researchers in epidemiology and healthcare management in a series of meetings and workshops. The BN model was received with considerable interest in workshops by the medical researchers. They agreed that while the results were plausible, only limited confidence could be placed in the result since many of the influences were determined by expert judgement rather than empirical data. This led to a debate about the value of simulation in medical research with the conclusions that the incomplete nature of knowledge in many areas of epidemiology and healthcare (e.g. causes and treatment of diabetes) limited the validity of computational models. Even though Bayesian models could allow for uncertainty, medical researchers were unwilling to devote more time to specifying wide-ranging models where theory and empirical knowledge were incomplete.
- 3.23
- Reactions to the concept demonstrator led to exploring more practical, focused models based on empirical datasets: for example, modelling health interventions for diabetes treatment based on empirical studies of different intervention types (patient visits, publicity campaigns, comprehensive manuals for diabetes management) given a heterogeneous population of patient types (positive, negative, responders) and outcome measures. This could be modelled by adapting the concept demonstrator to model health intervention memes accounting for different predispositions to accept advice and diabetes symptom profiles. However, this exercise revealed the limitations of available datasets and reinforced the assumptions that some expert judgement is necessary for model building. While very limited BN models could be automatically learned from empirical data, in this case (the influence of health interventions on clinical measures of diabetes given different patient personality profiles) learning could not be applied to create more extensive models because empirical datasets were not available.
- 3.24
- The effect of a network layer was questioned in the validation meetings as the medical researchers pointed out that health interventions could spread by diffusion and along social networks as the same time, so hybrid network models may be necessary. More generally the network layer added more complexity, which was difficult to justify given the paucity of evidence on the spread of health knowledge within populations. However, the researchers did see a role for simulation in exploring the consequences of health policy strategies in 'what if' scenario analysis.
Discussion and Conclusions
-
Contributions
- 4.1
- The modelling architecture we proposed is unusual in integrating Bayesian models at the agent level with social-level information diffusion models. While Bayesian modelling has been widely applied at the individual agent level and at the systems level (Neil et al. 2000), integrating Bayesian agents and social actors in networks is an original contribution.
- 4.2
- We have demonstrated application of the model in healthcare to produce plausible results and, more importantly, to show how simulations can function as novel artefacts in multidisciplinary research to engage researchers in other domains to explore the possibilities of computational modelling.
- 4.3
- The BN model demonstrated the importance of meme (or information influence) spread on outcomes, suggesting that broadcast-style propagation would be more effective than spread constrained by agent relationships as found in social networks. The superiority of broadcast-style diffusion is not surprising; however, the value in modelling is exploring the interaction between the spread of influences and their waning in a population. One extension of our model is to investigate the trade-off between more effective, but slower, communication via social networks against quicker, broadcast communication where messages may be more susceptible to waning.
- 4.4
- Following discussions with medical researchers we are developing more focused models to investigate the influence of different health interventions (social word of mouth, broadcast media, home visits, etc.) on patient behaviour and aetiology in diabetes management, with different population profiles. These more focused models will migrate the general simulation architecture we describe in this paper towards more practical tools for policy-related decision support and summarising empirical research as theoretical models.
- 4.5
- In Epstein's (2008) perspective of motivations for simulation, our contribution has been to explain possible gene-meme influences in healthcare, demonstrate trade-offs between such influences and context factors, and discover new questions about the relationship between the scope of models and the maturity of knowledge on which they are based. Our 'concept demonstrator' approach illustrates a refinement of the 'promote a scientific habit of mind' by stimulating a debate about how theoretical and empirical knowledge might be encapsulated in a computational model, with sub-themes about the maturity of medical knowledge and when simulations may play a productive role.
Related work
- 4.6
- Our BN model is intended to represent influences at the population level rather than individual decision making; however, Bayesian models have been applied to political decisions (Kim 2011), showing a good correspondence between more detailed cognitively motivated models based on ACT-R and Bayesian nets accounting for the influence of arguments on political attitudes.
- 4.7
- Network models have been used to simulate diffusion of innovation in healthcare, demonstrating the effects on connectivity and clustering in improving the spread of innovations (Dunn & Gallego 2010). Many sophisticated network models have been proposed, although grounding diffusion models in empirically derived social structures needs to be considered, as well as mathematical propagation algorithms (Cointet & Roth 2007).
- 4.8
- Interaction between genes and memes in cultural evolution has been investigated in abstract cellular automata simulations, suggesting that cooperation might arise by either imitative spread of memes or a combination of gene selection and imitation (Jaffe & Cipriani 2007). Simulations of mimetic propagation by evolutionary selection mechanism (Flentge, Polani & Uthmann 2001) show that concepts or norms in social behaviour such as 'possession' could spread, given sufficient rewards.
- 4.9
- In simulations of language evolution Bayesian learning models have demonstrated a hybrid gene-meme effect, whereby word sets evolve by a process of learning frequency patterns that mimics genetic drift, i.e. evolution of parsimonious lexica happens in the presence of random mutation and cross in frequency patterns (Reali & Griffiths 2010). However, Bayesian learning was applied to the evolution of memes (proto-languages) rather than interpretation of memes as ideas.
- 4.10
- Many simulations have demonstrated the plausible spread of cooperative behaviour given rewards and punishments, and reputation mechanisms in the repeated prisoners' dilemma paradigm (Nowak & Sigmund 2005, Roberts & Renwick 2003; Boyd & Richerson 1988). In contrast, our model focused on the contention between predispositions which have evolved and the critical-mass counter-force of memes that may overcome genetically determined behavioural tendencies.
Limitations
- 4.11
- Our network models assumed simple methods of information propagation and acceptance by recipients. Although the nearest neighbour network was based on Granovetter's (1973) concept of weak ties spreading information, it did not assess cascade or interaction effects between neighbours. Clearly more sophisticated models of network spread could be introduced, although the debate between empirical grounded network topologies and more abstract simulations is unresolved (Cointet & Roth 2007).
- 4.12
- The BN agent net is a high-level abstraction of a complex area related to the relative influences of genes and memes on behaviour, where empirical evidence is sparse and few theories have been articulated to bridge the genetic evolutionary and cognitive behaviour view. However, our BN does illustrate how synthesised models can be constructed in domains where sufficient knowledge exists.
Future work
- 4.13
- Future developments of our BN-network model will simulate the effect of health interventions where there is more empirical data for grounding models, and the effect of those interventions on the impact of healthy lifestyle advice.
Acknowledgements
- This research was partially funded by the UK Engineering and Physical Sciences Research Council (EPSRC), grant reference EP/E062083/1, Artificial Cultures. The authors wish to thanks Professor Frances Griffith and colleagues in Warwick Medical School for providing domain knowledge on healthcare and advice on modeling.
References
-
ACERBI, A. & Parisi, D. (2006). Cultural transmission between and within generations. Journal of Artificial Societies and Social Simulation, 9(1), 9. https://www.jasss.org/9/1/9.html
ACERBI A, ENQUSIT M, GHIRLANDA S. (2009) Cultural evolution and individual development of openness and conservatism, Proceedings of the National Academy of Sciences, USA, 106 (45), 18931 - 18935 [doi:10.1073/pnas.0908889106]
BLACKMORE, S. (1999). The meme machine. London: Oxford University Press.
BOUCHARD, C., Deprés, J.P. & Tremblay, A. (1993). Exercise and obesity. Obesity Research, 1(2),133-47. [doi:10.1002/j.1550-8528.1993.tb00603.x]
BOYD, R. & Richerson, P.J. (1988). The evolution of reciprocity in sizable groups. Journal of Theoretical Biology, 132, 337-356. [doi:10.1016/S0022-5193(88)80219-4]
BOYD, R. & Richerson, P.J. (2005). Not by genes alone: How culture transformed human evolution. Chicago: Chicago University Press.
CANOY, D. & Buchan, I. (2007). Challenges in obesity epidemiology. Obesity Reviews, 8, 1-11. [doi:10.1111/j.1467-789X.2007.00310.x]
CHRISTAKIS, N.A., & Fowler, J.H. (2007). The spread of obesity in a large social network over 32 years. New England Journal of Medicine, 357(4), 370-379. [doi:10.1056/NEJMsa066082]
COINTET, J.-P. & Roth, C. (2007). How realistic should knowledge diffusion models be? Journal of Artificial Societies and Social Simulation, 10(3), 5. https://www.jasss.org/10/3/5.html
DAWKINS, R. (1976). The selfish gene. London: Oxford University Press.
DAWKINS, R. (1989). The selfish gene (2nd ed.). London: Oxford University Press.
DUNN, A.G. & Gallego, B. (2010). Diffusion of competing innovations: The effects of network structure on the provision of healthcare. Journal of Artificial Societies and Social Simulation, 13(4), 8. https://www.jasss.org/13/4/8.html
EPSTEIN, J.M. (2008). Why model? Journal of Artificial Societies and Social Simulation, 11(4), 12. https://www.jasss.org/11/4/12.htmlp>
FLENTGE, F., Polani, D. & Uthmann, T. (2001). Modelling the emergence of possession norms using memes. Journal of Artificial Societies and Social Simulation, 4(4), 3. https://www.jasss.org/4/4/3.html
GOODMAN, E., Adler, N.E., Daniels, S.R. et al. (2003). Impact of objective and subjective social status on obesity in a biracial cohort of adolescents. Obesity Reviews, 11(8), 1018-26. [doi:10.1038/oby.2003.140]
GRANOVETTER, M. (1973). The strength of weak ties. American Journal of Sociology. 78, 1360-1380. [doi:10.1086/225469]
GRIER, S. & Bryant, C.A. (2005). Social marketing in public health. Annual Review of Public Health, 26, 319-39. [doi:10.1146/annurev.publhealth.26.021304.144610]
GRIGSBY-TOUSSAINT, D.S., Moise, I.K. & Geiger, S.D. (2011). Observations on marketing of food packaging targeted to youth in retail food stores. Obesity. [doi:10.1038/oby.2011.120]
HASLAM, D.W. & James, W.P. (2005). Obesity. The Lancet, 366 (9492), 1197-209. [doi:10.1016/S0140-6736(05)67483-1]
HEYLIGHEN, F. & Chielens, K. (2008). Cultural evolution and memetics. In: R.A. Meyers (Ed.). Encyclopedia of Complexity and Systems Science. Berlin: Springer.
HRUSCHKA, D.J. & Henrich, J. (2006). Friendship, cliquishness, and the emergence of cooperation. Journal of Theoretical Biology, 239, 1-15. [doi:10.1016/j.jtbi.2005.07.006]
IYENGAR, R., Van den Bulte, C., & Valente, T.W. (2010). Opinion leadership and social contagion in new product diffusion. Marketing Science, 30(2), 195-212. [doi:10.1287/mksc.1100.0566]
JAFFE, K. & Cipriani, R. (2007). Culture outsmarts nature in the evolution of cooperation. Journal of Artificial Societies and Social Simulation, 10(1), 7. https://www.jasss.org /10/1/7.html
JAMES, W.P.T. (2008). The epidemiology of obesity: The size of the problem. Journal of Internal Medicine, 263(4), 336-352. [doi:10.1111/j.1365-2796.2008.01922.x]
KIM, S.-Y. (2011). A model of political judgment: An agent-based simulation of candidate evaluation. Journal of Artificial Societies and Social Simulation, 14(2), 3. https://www.jasss.org/14/2/3.html
LUCAS, P.J.F. (2004). Bayesian networks in biomedicine and health-care (Editorial introduction to special issue). Artificial Intelligence in Medicine, 30, 201-214. [doi:10.1016/j.artmed.2003.11.001]
LUXHØJ, J.T., Choopavang, A. & Arendt, D.N. (2001). Risk assessment of organizational factors in aviation systems. Air Traffic Control Quarterly, 9, 135-174.
LYON, H.N. & Hirschorn, J.N. (2005). Genetics of common forms of obesity: A brief overview. American Journal of Clinical Nutrition, 82(1), 215S-217S.
MAHAJAN, V., MULLER, E. & BASS, F. (1995). Diffusion of new products: Empirical generalizations and managerial uses. Marketing Science, 14(3), G79-G88. . [doi:10.1287/mksc.14.3.G79]
MCCRAE, R.R. & John, O.P. (1992). An introduction to the five-factor model and its applications. Journal of Personality, 60(2), 175-215. [doi:10.1111/j.1467-6494.1992.tb00970.x]
MCLAREN, L. (2007). Socioeconomic status and obesity. Epidemiologic Reviews, 29, 29-48. [doi:10.1093/epirev/mxm001]
NEIL, M., Fenton, N. & Nielsen, L. (2000). Building large-scale Bayesian networks. Knowledge Engineering Review, 15, 257-284. [doi:10.1017/S0269888900003039]
NOWAK, M.A. & Sigmund, K. (1998). The dynamics of indirect reciprocity. Journal of Theoretical Biology, 194, 561-574. [doi:10.1006/jtbi.1998.0775]
NOWAK, M.A. & Sigmund, K. (2004). Evolutionary dynamics of biological games. Science, 303, 793-799. [doi:10.1126/science.1093411]
NOWAK, M.A. & Sigmund, K. (2005). Evolution of indirect reciprocity. Nature, 437, 1291-1298. [doi:10.1038/nature04131]
PAYNE, J.W., Bettman, J.R. & Johnson, E.J. (1993). The adaptive decision maker. Cambridge: Cambridge University Press. [doi:10.1017/CBO9781139173933]
PEARL, J. (1988). Probabilistic reasoning in intelligent systems: Networks of plausible information. San Francisco: Morgan Kaufmann.
PEÑA, M. & Bacallao, J. (2000). Obesity and poverty: A new public health challenge. Washington DC: Pan American Health Organization.
REALI, F. & Griffiths, T.L. (2010). Words as alleles: connecting language evolution with Bayesian learners to models of genetic drift. Proceedings of the Royal Society of London, B, 277, 429-436. [doi:10.1098/rspb.2009.1513]
ROBERTS, G. & Renwick, J.S. (2003). The development of cooperative relationships: An experiment. Proceedings of the Royal Society of London, 270, 2279-2283. [doi:10.1098/rspb.2003.2491]
ROGERS, E.M. (2003). Diffusion of innovations (5th ed.). New York: Free Press.
ROTTER, J.B. (1966). Generalized expectancies of internal versus external control of reinforcements. Psychological Monographs, 80, 609. [doi:10.1037/h0092976]
STILLER, J. & Dunbar, R.I.M. (2007). Perspective-taking and social network size in humans. Social Networks, 29, 93-104. [doi:10.1016/j.socnet.2006.04.001]
TOOBY, J. & Cosmides, L. (2005). Conceptual foundations of evolutionary psychology. In D.M. Buss (Ed.) The handbook of evolutionary psychology (pp. 5-67). Hoboken, NJ: Wiley.
UK Department of Health (2008). Healthy weight, healthy lives: A cross-government strategy for England. London: Dept of Health. Available online at http://www.nhs.uk/Conditions/Obesity/Pages/Causes.aspx. Accessed 5 July 2011.
VAN Schaik, C.P. & Burkart, J.M. (2011). Social learning and evolution: The cultural intelligence hypothesis. Philosophical Transactions of the Royal Society, 366, 1008-1016. [doi:10.1098/rstb.2010.0304]
WELLMAN, B., Carrington, P.J. & Hall, A. (1988). Networks as personal communities. In B. Wellman & S.D. Berkowitz (Eds), Social structures: A network analysis, 130-184. Cambridge: Cambridge University Press.
WELLMAN, B., Hogan, B., Berg, K., et al. (2006). Connected lives: The project. In P. Purcell (Ed.) Networked neighborhoods. Berlin: Springer. [doi:10.1007/1-84628-601-8_8]
WHITEN, A., Hinde, R.A., Laland, K.N. & Stringer, C.B. (2011). Culture evolves. Philosophical Transactions of the Royal Society, B, 366, 938-948. [doi:10.1098/rstb.2010.0372]
WHO. (2000). Obesity: Preventing and managing the global epidemic. Report of a WHO Consultation (WHO Technical Report Series 894). Geneva: World Health Organization.
WILLIAMS, A.E., Vogt, T.M., Stevens, V.J. (2007). Work, weight, and wellness, the 3W program: A worksite obesity prevention and intervention trial. Obesity, 15, 16S-26S. doi:10.1038/oby.2007.
YANG, W., Kelly, T., & He, J. (2007). Genetic epidemiology of obesity. Epidemiologic Reviews, 29(1), 49-61. [doi:10.1093/epirev/mxm004]