
 Abstract
- Costly signaling theory has been employed to explain the persistence of costly displays in a wide array of species, including humans. Henrich (2009) builds on earlier signaling models to develop a cultural evolutionary model of costly displays. Significantly, Henrich's model shows that there can be a stable equilibrium for an entire population committed to costly displays, persisting alongside a no-cost stable equilibrium for the entire population. Here we generalize Henrich's result to the more realistic situation of a population peppered with subgroups committed to high-cost beliefs and practices. The investigative tool is an agent-based model in which agents have cognitive capacities similar to those presupposed in Henrich's population-level cultural evolutionary model, and agents perform similar success-weighting calculations. Unlike in Henrich's model, which has no group differentiation within the population, our model agents use success-weighting calculations to determine whether to join or leave high-cost groups. According to our model, high-cost groups achieve long-term stability within a larger population under a wide range of circumstances, a finding that extends Henrich's result in a more realistic direction. The most important emergent pathway to costly group stability is the simultaneous presence of high charisma and consistency of the group leader and high cost of the group. These findings have strategic implications both for leading groups committed to costly beliefs and practices and for controlling their size and influence within wider cultural settings.
- Keywords:
- Costly Signaling, Credibility Enhancing Displays, Cultural Transmission, Religion, Charismatic Leader, Agent-Based Model
Introduction
- 1.1
- There is growing interest among researchers in how costly beliefs and practices influence group stability and success (Richerson and Boyd 2005). Empirical studies suggest that high-cost groups often grow faster and survive longer than groups that impose few demands on their members (Iannaccone 1992, 1994; Sosis and Bressler 2003; Sosis and Ruffle 2003). Based on foundational work in costly signaling theory by economists (Gintis, Smith, and Bowles 2001; Spence 1973) and biologists (Grafen 1990; Zahavi 1975), an emerging literature focuses on how costly beliefs and practices serve as signals that increase intragroup commitment, trust, and reliability. These analytical tools have applications in interspecies interaction as well as intraspecies sociality; the key in all cases is a communication environment that promotes the sending and receiving of signals, whether authentic or contrived (see Maynard Smith and Harper 2003). Scholars of religion have relied on these models extensively to explain the puzzle of high-cost religious activities, such as rites of terror and counterintuitive beliefs, and to understand how religions that impose considerable demands on their adherents continue to persist and grow—in anthropology (Cronk 1994; Irons 2001; Sosis 2003; Sosis and Alcorta 2003; Dow 2008), biology (Hochberg 2004; Fincher and Thornhill 2008; Wilson 2008), cognitive science (Atran 2002; Atran and Norenzayan 2004), economics (Carr and Landa 1983; Iannaccone 1992, 1994; Berman 2000), philosophy (Bulbulia 2004), and psychology (Norenzayan and Shariff 2008; Rossano 2010). Here we extend a recent cultural evolutionary model by Henrich (2009) that explored the emergence and transmission of costly religious displays.
- 1.2
- Henrich (2009) formalizes and builds upon earlier treatments of religious signaling to develop a cultural evolutionary model of costly ritualized activities such as scarification, animal sacrifice, lavish gifts, and martyrdom, which he refers to as credibility enhancing displays (CREDS). Significantly, Henrich's model shows that there can be a stable equilibrium for an entire population committed to costly displays. For a wide range of initial conditions, the high-cost stable equilibrium coexists with a no-cost stable equilibrium, and the entire population gravitates to one or the other based on initial conditions governing the starting frequency of CREDS in the population. The existence of a high-cost stable equilibrium for an entire population is a valuable insight but quite unrealistic as a description of any actual cultural situation. Intracultural variation is present in all populations (Boster 1987), as Henrich himself recognizes and has demonstrated in his own ethnographic and experimental work (Henrich et al. 2004). Even among high-cost religious groups that appear culturally homogenous to outsiders because of their similar dress and ritual routines, there is considerable heterogeneity in cultural beliefs and practices (Sosis 2009; Winston 2005).
- 1.3
- A theoretically derived stability result for high-cost groups within a larger population would helpfully complement existing empirical observations about, and shed light on the dynamics of, costly groups. For example, such a result could help explain the consistent finding among scholars of religious extremism that extremism emerges concomitantly with pronounced forms of secularism (Armstrong 2000; Bruce 2008; Marty and Appleby 1995), and the fact that both large-scale and small-scale cultures take the form of a landscape of religious and non-religious groups that vary considerably in the costs of their cultural beliefs and practices (Sosis, Kress, and Boster 2007; Whitehouse 2004). A stability result at the subgroup level might also bring depth to partial theoretical insights about costly religious practices, such as the way distinctively religious beliefs in supernatural rewards and punishments stabilize a religious signaling system (Sosis 2003; Bulbulia 2004).
The Starting Point: Henrich's Stability Result
- 2.1
- Henrich's result (2009) helps to put costly signaling approaches to religious displays on a stable theoretical footing by showing that cultural evolutionary models can have a high-cost equilibrium for an entire population. The key to this equilibrium result is the assumption of enough cognitive and communicative complexity in members of the population to support the evaluation of credibility. When high-cost displays match declarations of high-cost beliefs, an observer of such consistent behavior rates the credibility of the observed person more highly, and thereby is rendered more likely to adopt the costly belief-behavior combination. More precisely, credibility-enhancing costly displays mitigate the tendency to be suspicious of people's cheaply expressed beliefs, thereby increasing the effectiveness of communication as a means to strengthen cooperation.
- 2.2
- The distinction between beliefs and behaviors is crucial in Henrich's cultural evolutionary model, since consistency between beliefs and behaviors is what produces the dynamics leading to a stable high-cost equilibrium. His model uses the simplest possible arrangement of variables. The costly belief under evaluation is represented by θ, a discrete variable that can take the values θ = 0 (reject costly belief) and θ = 1 (accept costly belief). The proportion of people in the population with θ = 1 is φ, where 0 ≤ φ ≤ 1. Similarly, the costly practice is represented by x, a discrete variable that can take the values x = 0 (do not participate in the costly practice) and x= 1 (participate in the costly practice). The proportion of people in the population with x = 1 is q, where 0 ≤ q ≤ 1. Equilibrium dynamics are assessed by examining the way the variables φ and q change through the process of interaction among members of the population. The rules governing interactions between members of the population are crucial for understanding the significance of Henrich's stability result. Interactions are fundamentally learning encounters. Because Henrich's model has no agent-based dynamics, there is no selection of agents to encounter; rather, all possible types of encounters are probabilistically weighted in a single complex calculation for each iteration of the model.
- 2.3
- In each iteration of Henrich's model, a learner with a (θ,x) setting encounters an exemplar with a potentially different (θ,x) setting. There are four types of exemplars that a learner may encounter: (θ,x) = (0,0), (0,1), (1,0), or (1,1). Similarly, there are four types of learners: (θ,x) = (0,0), (0,1), (1,0), or (1,1). This makes 16 different types of encounters. The probability of each encounter is governed by the values φ and q, which determine the proportion of people in the population with the corresponding beliefs and practices. The likelihood that a learner will adopt the belief and practice of the exemplar is proportional to the difference in success weighting between the two people. Success weighting is essentially attractiveness in the given cultural context; the existence of meaningful success weightings is one of the core premises of cultural evolution modeling. For example, if a (0,0) learner meets a (0,0) exemplar, there will be no change. But if the same learner meets a (1,1) exemplar, the learner will calculate the difference between the learner's existing success weighting and that of the (1,1) exemplar and adopt the belief θ = 1 and practice x = 1 with probability corresponding to that difference in success weightings.
- 2.4
- Henrich assigns success weightings in natural ways, after making four crucial assumptions. First, he assumes that people are naturally suspicious of cheaply expressed beliefs, which he expresses with a variable, σ (0 ≤ σ ≤ 1) that reduces the success weighting that a learner assigns to every exemplar encountered. Second, he assumes that consistency of high-cost beliefs and practices is impressive and mitigates skepticism by an additive factor of ψ (0 ≤ ψ ≤ σ). Third, he assumes that consistency of no-cost beliefs and practices is also impressive, though to a lesser degree, and this mitigates skepticism by an additive factor of δ (0 ≤ δ ≤ ψ ≤ σ). Fourth, he assumes that someone with belief θ = 1 will experience the practice x = 1 as additionally attractive, expressed with a variable b (0 ≤ b ≤ 1).
- 2.5
- These four assumptions are reasonable and the model requires nothing more to yield a stable equilibrium for the population at (θ,x) = (1,1), alongside the stable equilibrium at (θ,x) = (0,0). The dual-equilibrium situation arises when 0 < δ,ψ ≤ σ and the variable b is less than the cost (between 0 and 1) of the costly belief-practice combination; this covers most cultural situations that we can imagine. The situation where only the high-cost equilibrium is stable occurs when b > cost, δ = 0, and 0 < ψ ≤ σ. Henrich suggests, for example, that expecting rewards in an afterlife can elevate b above the costs that must be paid in this life.
The Model
- 3.1
- Our model extends Henrich's cultural evolutionary model in an incremental way, thereby building confidence in both the original stability finding and in its extension within our own work. Henrich's model is a cultural evolutionary model with replicator dynamics and discrete variables to capture belief and practice states. Our question was whether the same assumptions would yield similar equilibrium dynamics in a model that includes group identities in the simplest way possible. Answering this question required designing an agent-based model whose agents possess the same cognitive, communicative, and interactive capabilities as the population members in Henrich's group-free model, but who can organize themselves into high-cost groups. This requires a suite of changes, all tightly interlinked and intelligible. Specifically, we require the agents in our model to have characteristics pertinent to group dynamics and decisions about joining and leaving groups. The resulting five characteristics—charisma, consistency, sensitivity, tendency to affiliate with a high-cost group, and tendency to leave a high-cost group—are well grounded in social theory. Introducing group dynamics yields a far more realistic framework for answering questions about the stability of costly beliefs and practices. These group dynamics also have concrete strategic implications, both for leaders of high-cost groups within a larger population and for political authorities attempting to regulate the effects of high-cost groups within their societies.
- 3.2
- We describe the model used in this research in terms of the ODD (Overview, Design concepts, and Details) protocol (Grimm et al. 2010).
Purpose
- 3.3
- The purpose of this agent-based model is to assess whether and how high-cost groups can achieve stability within a wider population of individuals equipped with cognition and communication sufficient for exemplar-learner social interactions and group affiliation and deaffiliation decisions.
Entities, State Variables, Scales
- 3.4
- The dynamic entities in the model are leaders of high-cost groups, group followers, and regulars (who are not in any high-cost group). There is also one type of static entity called an enemy. Dynamic agents learn from one another, have the capacity to evaluate consistency, have a few personality characteristics (skepticism, charisma, consistency, sensitivity), and carry variables that track tendencies to join and leave groups. These variables are discussed here, along with other variables used in agent fitness calculations.
- 3.5
- Skepticism Model agents are skeptical toward cheaply expressed beliefs (σ, between 0.01 and 0.99). A learner agent has a tendency to mitigate skepticism based on consistency between high-cost beliefs and practices (φ, between 0.01 and 0.99), and also consistency between low-cost beliefs and practices (δ, between 0.01 and 0.99). These variables are constrained so that 0 ≤ δ ≤ φ ≤ σ. Agent skepticism is magnified for online encounters with people outside their own group (μ, the Online Skepticism Factor, a multiplicative factor between 1 and 5). The multiplicative approach ensures that low-skepticism (gullible) individuals persist but increases every agent's skepticism to some degree.
- 3.6
- Charisma (exemplar's charisma is χ, between 0.01 and 0.99). High charisma magnifies the effect of an exemplar's consistent (and inconsistent) behaviors and beliefs on a learner. Moreover, following a longstanding theory within the social sciences (Weber 1947) and more recent experimental findings (Van Vugt 2006), we presume that a high-cost group forms around a charismatic leader. We also assume that a high-cost group can imbue a charismatic leader with sacred mana (Durkheim 1915), enhancing the leader's power and influence, as is common among traditional and religious communities. Thus, initial group leaders have high charisma. Experimental results suggest that, if a new group forms, a high-charisma agent is likely to become its leader (Van Vugt and De Cremer 1999), and our model adopts this principle: when large groups pass a size threshold, the most frustrated members split off, and the most charismatic agent among the defectors becomes leader of the new group.
- 3.7
- Consistency (exemplar's consistency is κ, between 0.01 and 0.99). Our agents also require the characteristic of consistency, understood as the likelihood that an agent will exhibit behavior that matches beliefs. In accord with well-established social theories of cognitive dissonance (e.g. Berger 1967; Berger and Luckmann 1968), stress on group identity and threats to group stability are directly related to whether group members practice what they preach, and thus whether the group's way of life strikes a member or a potential member as capable of supporting a meaningful way of coping with life challenges. A learner agent encountering a consistent exemplar agent will be more likely to adopt the belief-practice combination of the exemplar.
- 3.8
- Sensitivity (learner's sensitivity is Σ, between 0.01 and 0.99). Personality psychologists have increasingly emphasized the importance of variation in sensitivity within populations (Aron and Aron 1997) —this is sensitivity as a basic organism feature that sets the amplitude of cognitive and behavioral response to environmental stimuli. Sensitivity in this sense is reducible neither to biased perception or credulity, nor to skepticism. Some people respond to encounters with large swings in beliefs and behaviors, while others change in smaller increments. The mathematical effect of sensitivity is, like charisma, essentially amplification, except that sensitivity operates on the learner side of an encounter while charisma operates on the exemplar side. We designed our model to run both with and without the sensitivity of agents enabled. This enabled us to evaluate its role in stability dynamics.
- 3.9
- Affiliation Tendency and Apostasy Tendency (AffTend, between 0 and 100; ApoTend, between 0 and 100). These variables increase and decrease within learners in intuitive ways due to probabilistically governed encounters with exemplar agents. Changes in the variables (ΔAFF, ΔAPO) derive from success weighting (fitness) calculations. These calculations take account of the consistency and charisma of the exemplar agent, the cost of the group (when the encounter is with a group member or group leader), the sensitivity of the learner agent (if sensitivity is enabled), and learner personality characteristics related to skepticism. When Affiliation Tendency and Apostasy Tendency pass model-specified thresholds (the Affiliation Threshold, Aff, and Apostasy Threshold, Apo), the agent joins a high-cost group or leaves a high-cost group, respectively.
- 3.10
- Group Cost (c, between 0 and 1.0). A group is a set of population members who choose to affiliate and who participate in the beliefs and practices of the group, with various degrees of consistency. Group cost is the degree to which participation in the group's characteristic beliefs and behaviors requires the paying of a fitness cost. In practice, costs take a wide variety of forms, from monetary sacrifice to physical mutilation, and from psychological submission to martyrdom.
- 3.11
- Distribution of state variables Each of the personality characteristics (skepticism, charisma, consistency, sensitivity) is distributed normally across the population, with mean and standard deviation set within the model's initial conditions.
- 3.12
- Space and time The model has no spatial dimension; interactions are governed probabilistically according to a distribution customized in the model's initial conditions. Agents do not age so there is no time scale at that level, but groups can die and split based on size thresholds, set in the model's initial conditions.
- 3.13
- Enemies Economists have noted that signaling dynamics within a population are often driven by tension with outsiders (Iannaccone 1992; Berman 2000), such as an occupying military force, a large community of culturally alien immigrants, or representatives of a highly secularized and morally offensive culture (Berman 2009). Indeed, group leaders may welcome and strategically incite mutual animosity between insiders and outsiders both to increase the value of affiliation as protection against the hostility and pollution of outsiders, and to increase the perceived costs of disaffiliation. Our model accommodates this by (optionally) allowing for encounters with enemies. These enemies are not dynamic agents and so do not perform cost calculations or experience conversion or apostasy.
- 3.14
- Online skepticism factor (μ, a multiplicative variable between 1 and 5). Human social life, including religious interaction, is increasingly taking place in cyberspace (for example, see Bunt 2000). In our model encounters can (optionally) occur online as well as in person. Online and personal encounters are assigned different probabilities and impact weightings, and a model setting (online skepticism factor) increases the natural skepticism of online learners toward online exemplars in agent success-weighting calculations.
- 3.15
- Model-level variables The model's initial conditions include a tuning variable that speeds up or slows down model dynamics by two orders of magnitude (β, between 0.1 and 10). There is also an impact factor for each type of type of encounter (ω, between 1 and 10), discussed in the next section. The entire list of variables used in success-weighting calculations in is Table 1. Note that a few variable names are reused from the original Henrich model and that they retain roughly the same meaning in this agent-based model.
Table 1: Variables Used in the Model β = tuning variable (between 0.1 and 10.0) c = group cost (between 0 and 1) av(c) = average group cost (between 0 and 1) ω = impact factor for each type of encounter (between 1 and 10) Σ= learner's sensitivity (between 0.01 and 0.99) σ = learner's skepticism toward cheaply expressed beliefs (between 0.01 and 0.99) μ = magnification of learner's skepticism for online encounters outside own group (between 1 and 5) φ = learner's tendency to mitigate skepticism based on high-cost consistency (between 0.01 and 0.99) δ = learner's tendency to mitigate skepticism based on no-cost consistency (between 0.01 and 0.99) χ = exemplar's charisma (between 0.01 and 0.99) av(Χ) = average charisma for exemplar's type (between 0.01 and 0.99) κ = exemplar's consistency (between 0.01 and 0.99), which means the probability that the exemplar will be consistent in a given encounter n = 0 or 1 (sets calculation positive or negative based on exemplar's consistency and meaning for learner) ΔAFF = change in agent's affiliation tendency ΔAPO = change in agent's apostasy (deaffiliation) tendency Process and scheduling
- 3.16
- First, a run of the model begins by setting model variables, either manually or (depending on the implementation) by a batch process to automate multiple runs. Agent variables are then randomly assigned according to model settings.
- 3.17
- Second, once the model is running, each iteration involves every agent (thought of as a learner agent) meeting one agent (thought of as an exemplar agent) in person and another online (if online encounters are enabled). Encounters are governed not by spatial proximity but by a customizable probability distribution. Quite a few types of encounters are possible. Leaders do not make success-weighting calculations because they do not affiliate and they do not deaffiliate unless the group dies. That leaves ten types of encounters, each of which receives a probability of occurrence and an impact factor (ω) within the model's settings. Regulars can meet group leaders, group followers, other regulars, and (if activated) enemies. Followers can meet their own leaders, followers in their own group, other leaders, followers in another group, regulars, and (if activated) enemies. If online encounters are enabled, there are twenty types of encounters in total. The probabilities and impact factors for these twenty encounters (when enemies were activated) were set as in Table 2. The probability of online encounters (25%) was the figure used for the sub-study of online interactions; for the main study reported here, online encounters were disallowed.
Table 2: Probability Settings Governing Encounters within the Model Learning Has Encounter Personal Encounters (75%) Online Encounters (25%) Agent… With… Probability Impact Factor Probability Impact Factor Regular Leader 0.01 5.0 0.25 1.0 Follower 0.04 2.0 0.25 1.0 Regular 0.85 1.0 0.25 1.0 Enemy 0.10 2.0 0.25 1.0 Follower Own Leader 0.05 5.0 0.20 1.0 Own Follower 0.25 2.0 0.20 1.0 Other Leader 0.01 3.0 0.15 1.0 Other Follower 0.04 1.0 0.15 1.0 Regular 0.55 1.0 0.15 1.0 Enemy 0.10 2.0 0.15 1.0 - 3.18
- We reasoned that online-encounters would have lower impacts than in-person encounters, but that the probability of encountering high-charisma agents (especially group leaders) would be much higher online than in person because the Internet offers leaders much greater accessibility than in-person interactions—an option that group members tend to take advantage of quite intentionally in order to realize the psychological and social benefits of group membership. We further reasoned that generalized skepticism toward cheaply expressed beliefs would be much greater for online encounters than for in-person encounters, that it would be more difficult for learner agents to evaluate the consistency of exemplars encountered online, and that this would reduce the value of high-cost consistency for mitigating Internet skepticism. The exception to this is that followers would personally know their own leader and other followers in their own group, and thus that normal skepticism would apply in those types of online encounters.
- 3.19
- Third, in each encounter, learner agents evaluate exemplar agents by performing success-weighting calculations (essentially fitness calculations, as close as possible to those in Henrich 2009) that modify Affiliation Tendency and Apostasy Tendency. Encountering an enemy increases a learner agent's Affiliation Tendency and decreases Apostasy Tendency. The agents in our model use these success-weighting calculations to determine whether to join or leave high-cost groups, matching our understanding of leader-follower dynamics (Berger and Luckmann 1968). Note that in our model only followers change their apostasy tendency, although we are aware that leaders, including charismatic religious leaders, occasionally apostatize as well (e.g. Berger 1967). The formulas for success-weighting calculations, which push affiliation tendencies and apostasy tendencies up and down, are in Tables 3a and 3b for in-person encounters, and in Tables 4a and 4b for online encounters.
Table 3a: Formulas for Calculating Changes in Affiliation Tendency and Apostasy Tendency for "Regular" Agents Due to In-Person Encounters ΔAFF on meeting a follower or leader = (-1)n β ω Σ [Χ/av(Χ)] [(1-c)/(1-av(c))] [1-σ+cψ+(1-c)δ] ΔAFF on meeting a regular = (-1)n β ω Σ [1-σ+δ] ΔAFF on meeting an enemy = (-1)n β ω Σ ΔAPO = 0 Table 3b: Formulas for Calculating Changes in Affiliation Tendency and Apostasy Tendency for "Follower" Agents Due to In-Person Encounters ΔAFF on meeting own follower or leader = (-1)n β ω Σ [Χ/av(Χ)] [(1-c)/(1-av(c))] [1-σ+cψ+(1-c)δ] ΔAFF on meeting other follower or leader = (-1)n β ω Σ [Χ/av(Χ)] [(1-c)/(1-av(c))] [1-σ+cψ+(1-c)δ] ΔAFF on meeting a regular = (-1)n β ω Σ [1-σ+δ] ΔAFF on meeting an enemy = (-1)n β ω Σ ΔAPO on meeting own follower or leader = (-1)n β ω Σ [Χ/av(Χ)] [(1-c)/(1-av(c))] [1-σ+cψ+(1-c)δ] ΔAPO on meeting other follower or leader = (-1)n β ω Σ [Χ/av(Χ)] [(1-c)/(1-av(c))] [1-σ+cψ+(1-c)δ] ΔAPO on meeting a regular = (-1)n β ω Σ [1-σ+δ] ΔAPO on meeting an enemy = (-1)n β ω Σ Table 4a: Formulas for Calculating Changes in Affiliation Tendency and Apostasy Tendency for "Regular" Agents Due to Online Encounters ΔAFF on meeting a follower or leader = (-1)n β ω Σ [Χ/av(Χ)] [(1-c)/(1-av(c))] [1-μσ+cψ+(1-c)δ] ΔAFF on meeting a regular = (-1)n β ω Σ [1-μσ+δ] Table 4b: Formulas for Calculating Changes in Affiliation Tendency and Apostasy Tendency for "Follower" Agents Due to Online Encounters ΔAFF on meeting other follower or leader = (-1)n β ω Σ [Χ/av(Χ)] [(1-c)/(1-av(c))] [1-μσ+cψ+(1-c)δ] ΔAFF on meeting a regular = (-1)n β ω Σ [1-μσ+δ] ΔAPO on meeting other follower or leader = (-1)n β ω Σ [Χ/av(Χ)] [(1-c)/(1-av(c))] [1-μσ+cψ+(1-c)δ] ΔAPO on meeting a regular = (-1)n β ω Σ [1-μσ+δ] - 3.20
- Note that the expression [χ/av(χ)] expresses the degree to which the exemplar's charisma varies above or below the average charisma for the corresponding group of exemplars (leaders or followers). This ratio reflects the likelihood that people respond to charisma contextually, relative to other people of a similar sort. Similarly, the expression [(1-c)/(1-av(c))] expresses the degree to which group cost varies above or below the average group cost. The expression [1-σ +cψ +(1-c)δ] expresses the learner's general skepticism toward all cheaply expressed beliefs (1- σ) and, in the last two terms, the mitigation of skepticism in the form of a cost-related linear combination of ψ (the learner's tendency to mitigate skepticism based on high-cost consistency) and δ (learner's tendency to mitigate skepticism based on no-cost consistency). If the group cost is the maximum value of 1, cψ + (1-c)(δ) = ψ, whereas if the group cost is the minimum of 0, cψ+(1-c)δ = δ. In most cases the mitigation factor is somewhere in between, depending on how the model weights high-cost consistency. Exemplar consistency affects the calculation by making the entire ΔAFF and the entire ΔAPO amounts positive or negative depending on whether the exemplar's belief-behavior combination makes the learner agent more or less likely to affiliate or deaffiliate.
- 3.21
- Note, too, that considerations pertaining to online encounters required two alterations to the equations governing incremental changes in the affiliation tendency and apostasy tendency variables using the Online Skepticism Factor (see Tables 4a and 4b). Specifically, for in-person encounters, the probability of exemplar consistency is κ, where κ is exemplar consistency. For online encounters, the probability of exemplar consistency is κ(1-σ)/(1-av(σ)), where σ is the learner agent's skepticism and av(σ) is the mean skepticism for all learner agents. This expresses the way that high-skepticism learner agents strongly doubt claims of high-cost consistency whereas low-skepticism individuals are strongly inclined to believe such claims even beyond the credibility of the exemplar.
- 3.22
- Fourth, on a given iteration, after encounters are analyzed and affiliation and apostasy tendencies adjusted accordingly, group affiliation decisions are made. Initial conditions in the model specify an Affiliation Threshold and an Apostasy Threshold (Aff and Apo, both numbers between 50 and 99). If a regular agent's affiliation tendency variable (AffTend) crosses the Affiliation Threshold, that regular becomes a member of the high-cost group associated with the last positive contact (i.e. consistency was such that beliefs matched behaviors), after which AffTend and ApoTend are reduced by amounts specified in the model's initial conditions. If a follower agent's apostasy tendency variable (ApoTend) crosses the Apostasy Threshold, that follower leaves the group and becomes a regular agent, after which AffTend and ApoTend are again reduced by amounts specified in the model's initial conditions.
- 3.23
- Fifth, on a given iteration, after affiliation and apostasy changes are made, group dying and splitting decisions are made. A group dies when it shrinks below a threshold size specified in the model, with the leader and few remaining followers becoming regular agents. A group splits when its size increases beyond another threshold, with the most frustrated followers (those with the highest ApoTend variable) leaving and the most charismatic individual among the defectors becoming the new leader. Both thresholds are set within the model's initial conditions.
Design Concepts
- 3.24
- Basic principles Costly signaling theory is the model's fundamental design principle. This involves an environment of communicating agents who use credibility-enhancing displays to mitigate the skepticism of cheaply expressed beliefs. The secondary design principle is the structure of costly groups, driven by charismatic leaders, populated by followers frustrated with the conditions of ordinary life, remaining small to consolidate commitment to high-cost beliefs and behaviors, and therefore splitting when they get too large.
- 3.25
- Emergence The model is designed to detect the emergent property of stability of the total population in costly groups, and to manifest the pathways by which the system produces such emergent stability.
- 3.26
- Adaptation Personality-related characteristics of agents do not change in this model. But the variables expressing affiliation tendency and apostasy tendency adapt to environmental conditions as mediated by success-weighting calculations in encounters with other agents. Costly groups change membership, die, and split based on these dynamic properties of individual agents.
- 3.27
- Stochasticity Many elements of the model are stochastic, but all stochastic elements are governed by distributions. Specifically, the initial distributions of agent variables and group costs conform to normal distributions, the initial construction of groups is random, the type of exemplar-learner encounter is governed by a custom distribution defined in the model's initial conditions, and whether an exemplar is consistent is governed by a simple step distribution. Success-weighting calculations are not stochastic.
- 3.28
- Observation A large amount of data is collected for each run of the model. Initial settings for groups and individuals are recorded, group follower characteristics and total population of agents in costly groups are recorded after each iteration, a snapshot of groups is taken when they die, and the model can record comprehensive details of interactions for one individual agent on each run. Some of these data are statistically analyzed on the fly because certain averages are used in agent success-weighting calculations.
Initialization
- 3.29
- The most relevant model variables for producing the results described below, along with their settings in this study, are as follows.
- Number of dynamic agents: 300 (since birth, aging, and death were not activated, this remains static)
- Initial number of high-cost groups: 20
- Enemies: allowed on half of the runs and disallowed on half
- Learner sensitivity: allowed on half of the runs and disallowed on half
- Affiliation (Aff) and apostasy (Apo) thresholds: we used a Latin-square distribution to investigate the range of both thresholds from 50-99. We divided the possible values for each threshold variable into five equal ranges and set up Latin Square sampling based on the midpoint of those ranges. This resulted in five combined settings: (Aff,Apo)=(55,85), (65,55), (75,75), (85,95), and (95,65).
- μ = magnification of learner's skepticism for online encounters outside own group: 2 (not relevant in the main study, which disallowed online encounters)
- Number of runs for each set of initial conditions: 5
- Group death threshold: 4
- Group split threshold: 30
- Number of iterations in each run: 5,000
- 3.30
- Normally distributed variables are truncated to the minimums and maximums for each variable, if necessary. The means and standard deviations for the variables that are normally distributed, as set in the study reported on here, are as follows.
- c = group cost: mean (M)=50, standard deviation (SD)=25
- Σ= learner's sensitivity: M=50, SD=25
- σ = learner's skepticism toward cheaply expressed beliefs: M=20, SD=10
- ψ = learner's tendency to mitigate skepticism based on high-cost consistency: M=10, SD=5
- δ = learner's tendency to mitigate skepticism based on no-cost consistency: M=5, SD=2.5
- χ = exemplar's charisma: M=80, SD=10 for initial leaders; M=50, SD=25 for other agents
- κ = exemplar's consistency: M=50, SD=25
Results
- 4.1
- Four settings in our agent-based model are most salient for the question of the stability of the total population in costly groups. They are:
- Affiliation Threshold (Aff)
- Apostasy Threshold (Apo)
- Enemies Allowed (Boolean value: yes, no)
- Agent Sensitivity Allowed (Boolean value: yes, no)
- 4.2
- We call the basic scenario with no enemies and no agent sensitivity the “Henrich scenario” and abbreviate it to H for convenience—this scenario most closely matches the original setup in Henrich's cultural evolutionary model. The others are Henrich with enemies allowed (H-E), Henrich with agent sensitivity allowed (H-S), and Henrich with both enemies and sensitivity (H-ES). For each of these four scenarios, we used five settings for Affiliation Threshold (Aff) and Apostasy Threshold (Apo), using Latin Square sampling of the space of possible settings (described above). Pairing the 4 scenarios with each of the 5 settings for Affiliation Threshold and Apostasy Threshold produces 20 combinations of settings, for each of which we ran the model 5 times. This yielded 100 runs of the model, each run being 5,000 iterations and several hours in length. We also constructed other runs to test side questions, as noted below.
Predicting Ingroup Population
- 4.3
- To assess the stability of high-cost groups, we focused on the number of agents in costly groups (we call this the ingroup population) versus the number not in costly groups (the outgroup population). As the total population is constant (agent death and reproduction model options were not activated for this study), only the ingroup population matters. Table 5 displays ingroup population statistics. Each row shows the mean and standard deviation over the five runs made after 5,000 iterations for each combination of Scenario, Affiliation Threshold, and Apostasy Threshold. The quantity being analyzed from each run is the average ingroup population between 500 and 5,000 iterations-the idiosyncratic effects of initial conditions are washed out after about 500 iterations, allowing innate model dynamics to control the ingroup population size. The final column presents the predicted ingroup population based on the multivariate model to be described shortly.
Table 5: Ingroup population statistics—mean of ingroup population between 500 and 5,000 iterations, averaged over five runs Scenario Affiliation Threshold Apostasy Threshold Ingroup Population Mean Ingroup Population Standard Deviation Multivariate Model Prediction H 55 85 226.9 34.0 219.5 65 55 166.1 41.0 161.6 75 75 195.7 68.7 175.7 85 95 184.8 71.1 189.8 95 65 119.0 58.3 131.9 H-S 55 85 222.3 36.3 205.0 65 55 143.4 60.7 147.1 75 75 172.3 31.3 161.2 85 95 160.4 12.6 175.3 95 65 92.1 32.7 117.4 H-E 55 85 265.0 11.3 289.5 65 55 223.1 24.3 231.6 75 75 250.7 18.6 245.7 85 95 257.8 19.1 259.8 95 65 216.1 15.2 201.9 H-ES 55 85 263.0 10.8 275.0 65 55 211.1 24.9 217.1 75 75 243.9 8.3 231.2 85 95 253.5 20.5 245.3 95 65 198.7 30.7 187.4 - 4.4
- The means from Table 5 are graphed in Figure 1. The linear model fitted to the results translates in Figure 1 to the fit of a plane to the top of the five columns of each scenario.
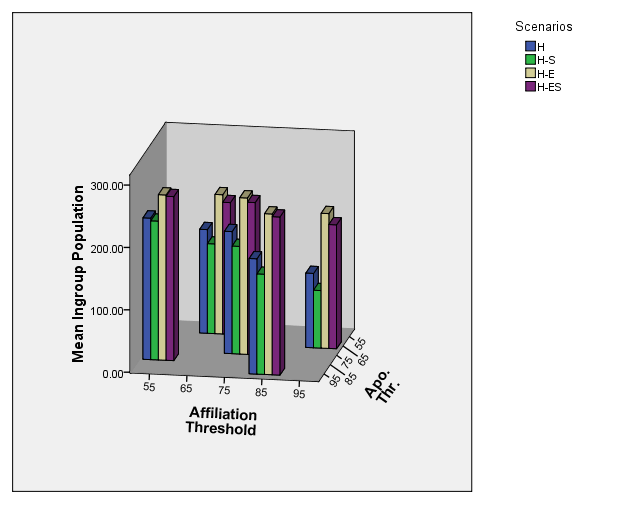
Figure 1. Mean Ingroup Population as a Function of Affiliation Threshold and Apostasy Threshold - 4.5
- To convey this linear relationship in a clearer way it is helpful to break down the three dimensional graph of Figure 1 into a pair of two-dimensional graphs. Figure 2a shows the relationship between mean ingroup population and affiliation threshold while Figure 2b displays the relationship between mean ingroup population and apostasy threshold—both for the base Henrich scenario only. In both cases, the linear model is overlaid on top of the data from the runs.
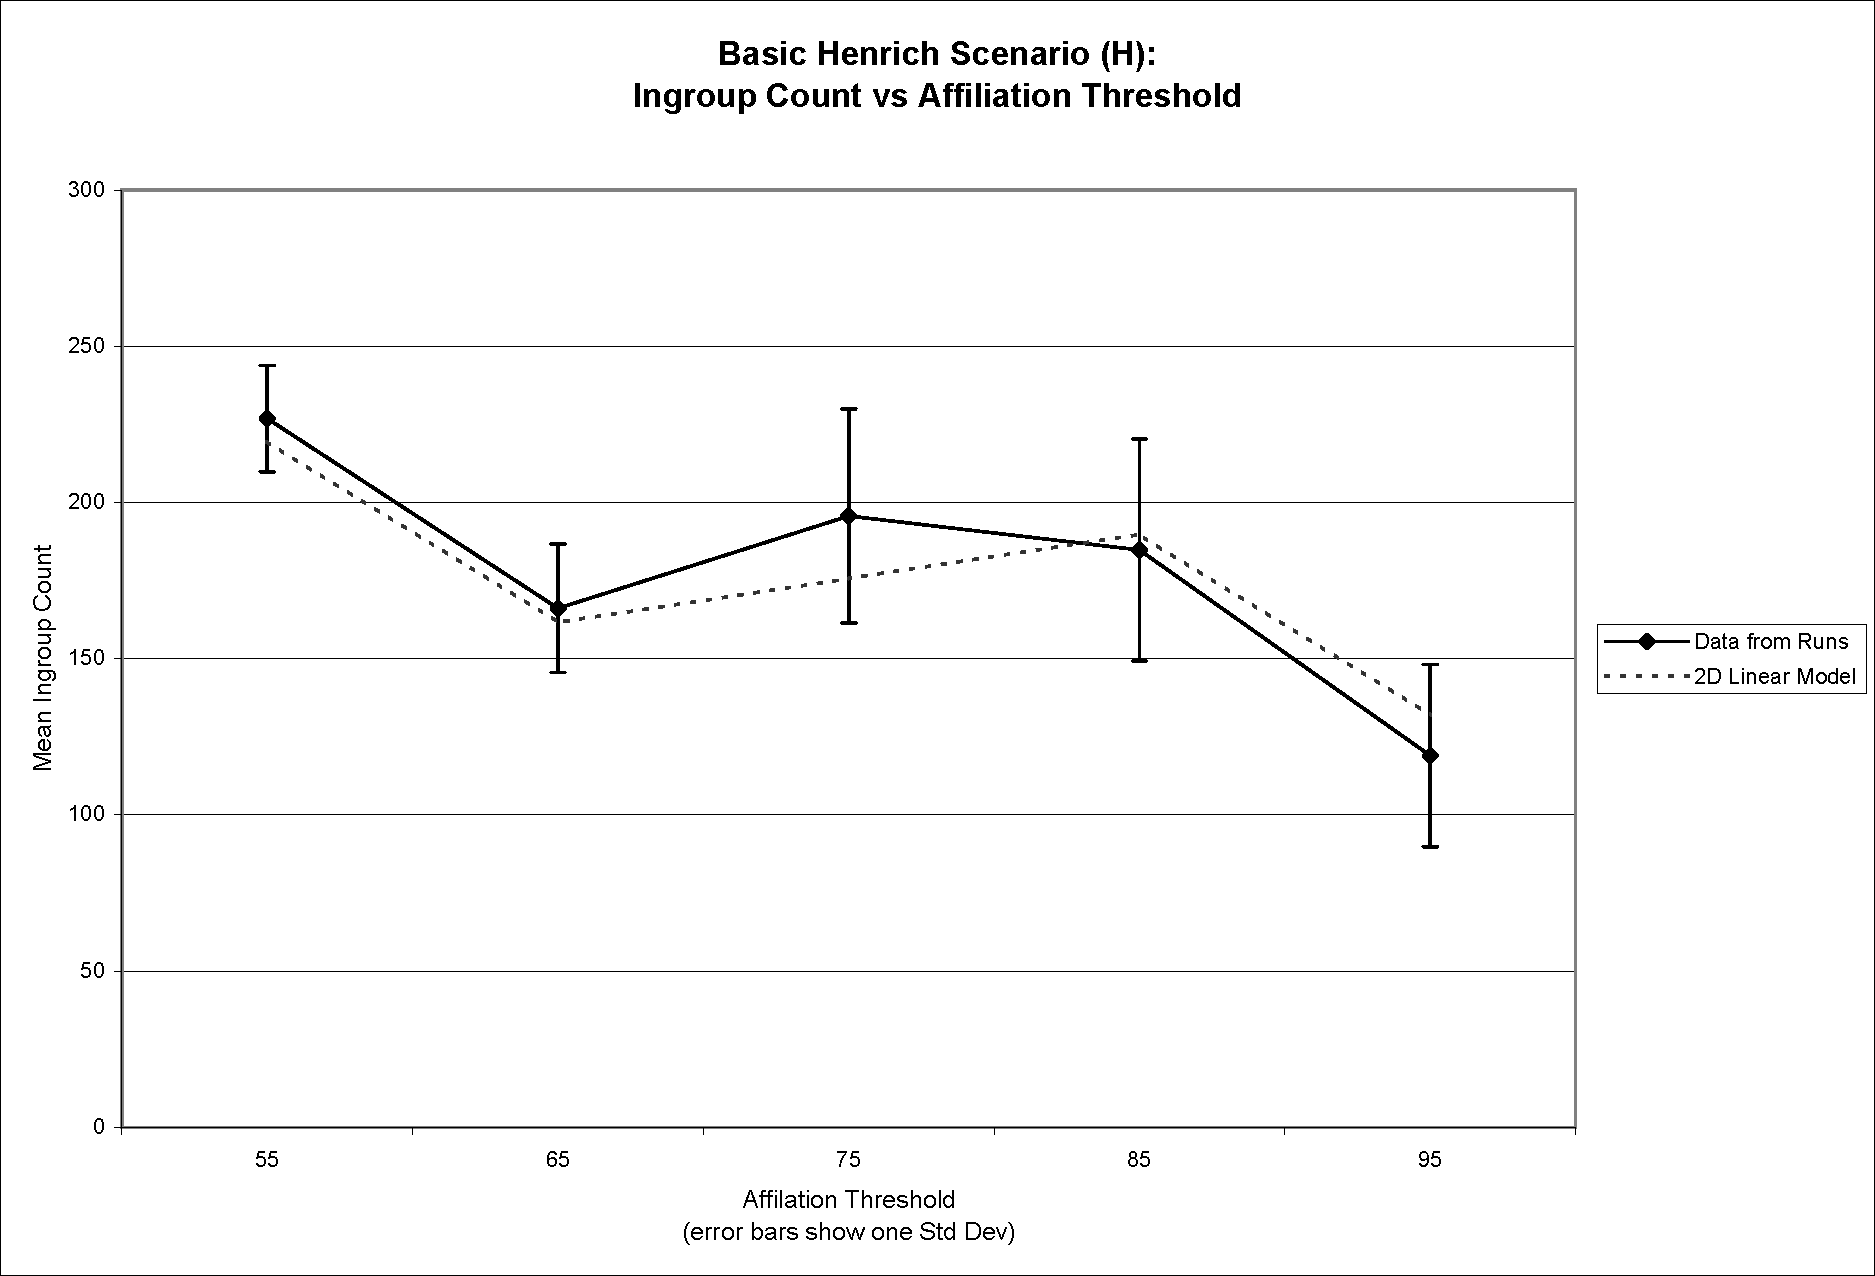
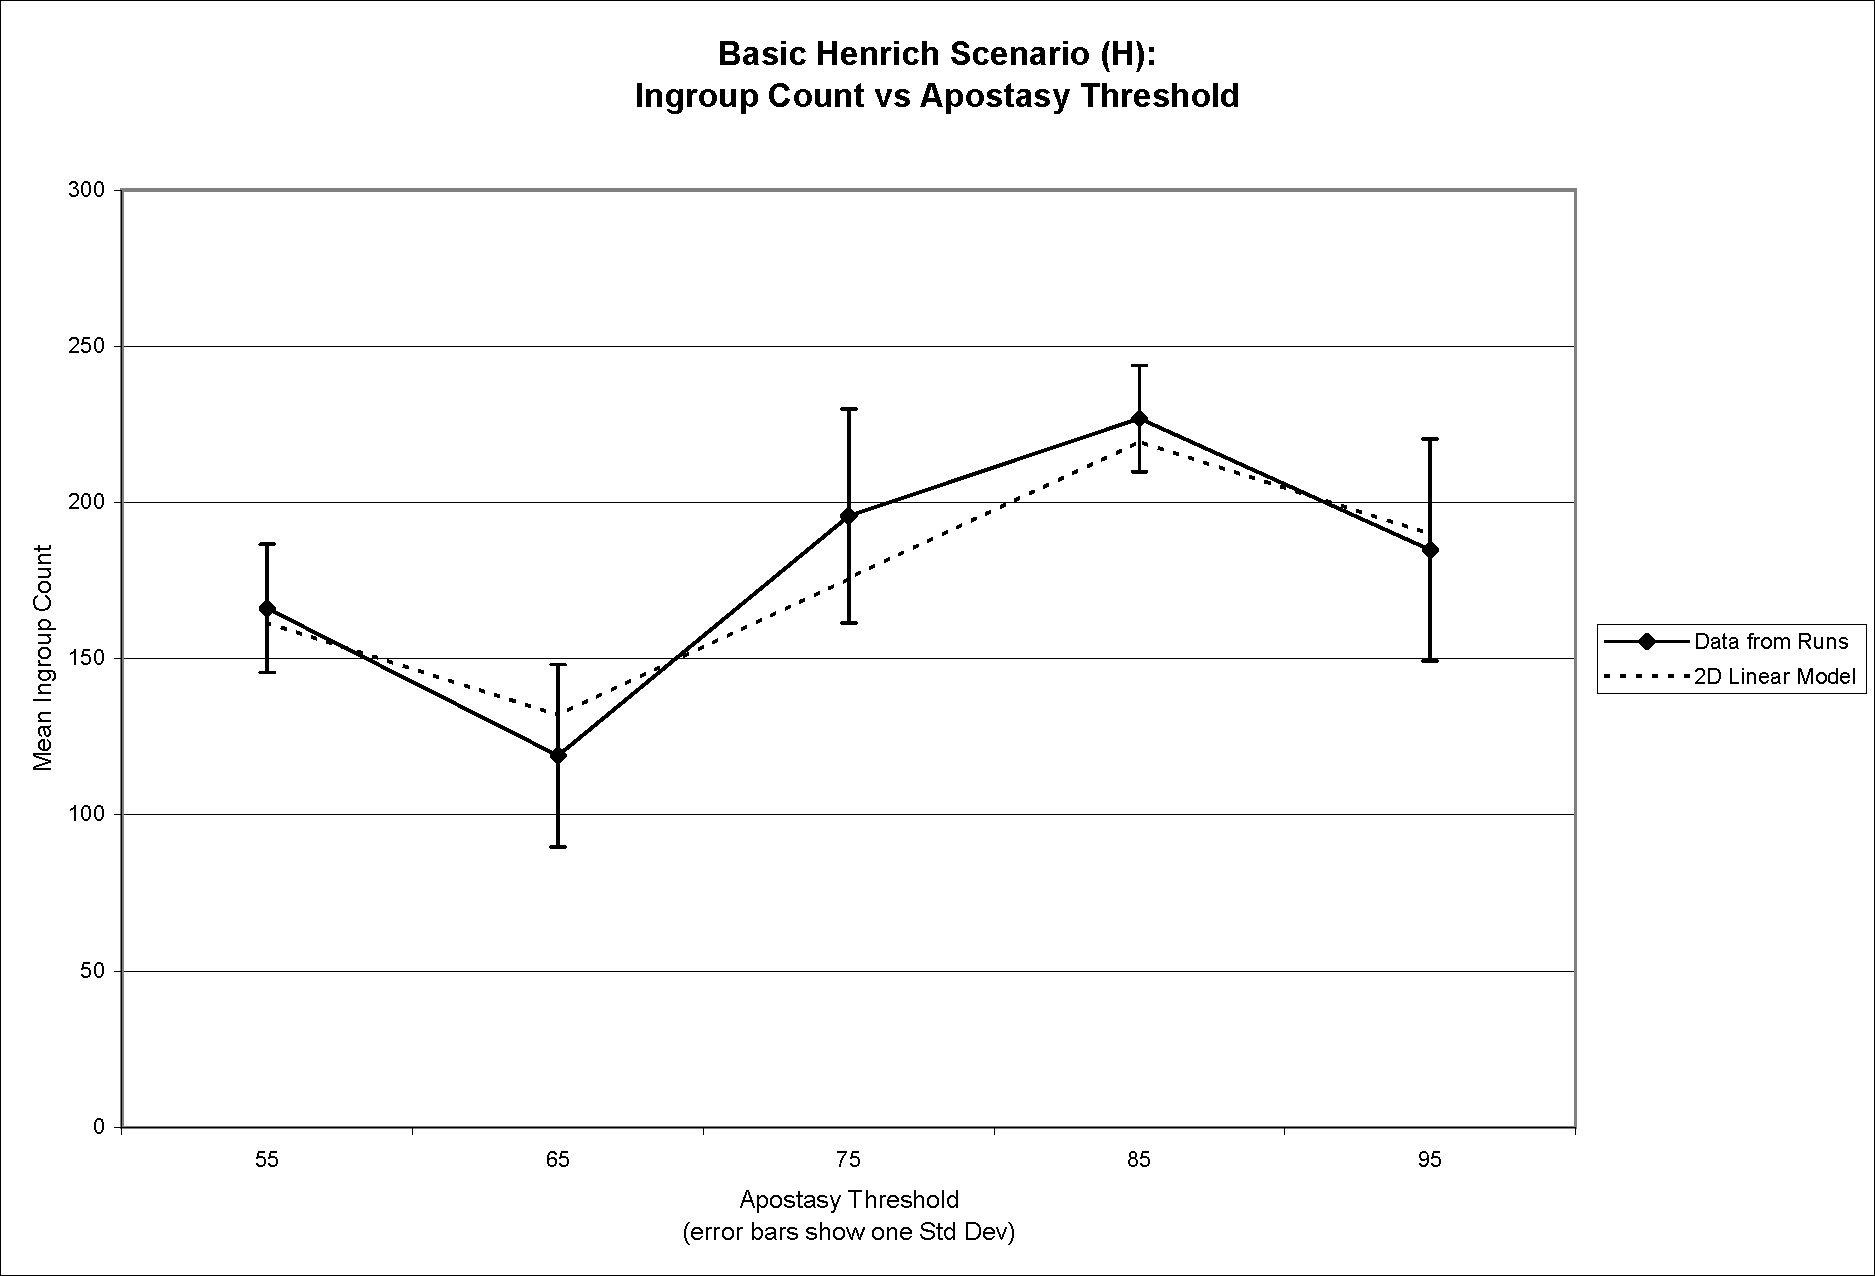
Figure 2a (top) and Figure 2b (bottom). Mean ingroup population versus affiliation threshold (2a) and apostasy threshold (2b), showing linear model overlaid on top of data from runs - 4.6
- Using the same approach, Figure 3a and Figure 3b display all four scenarios on the same pair of graphs, without overlaying the linear model. This pair of graphs shows the relative differences in mean ingroup population across the four scenarios.
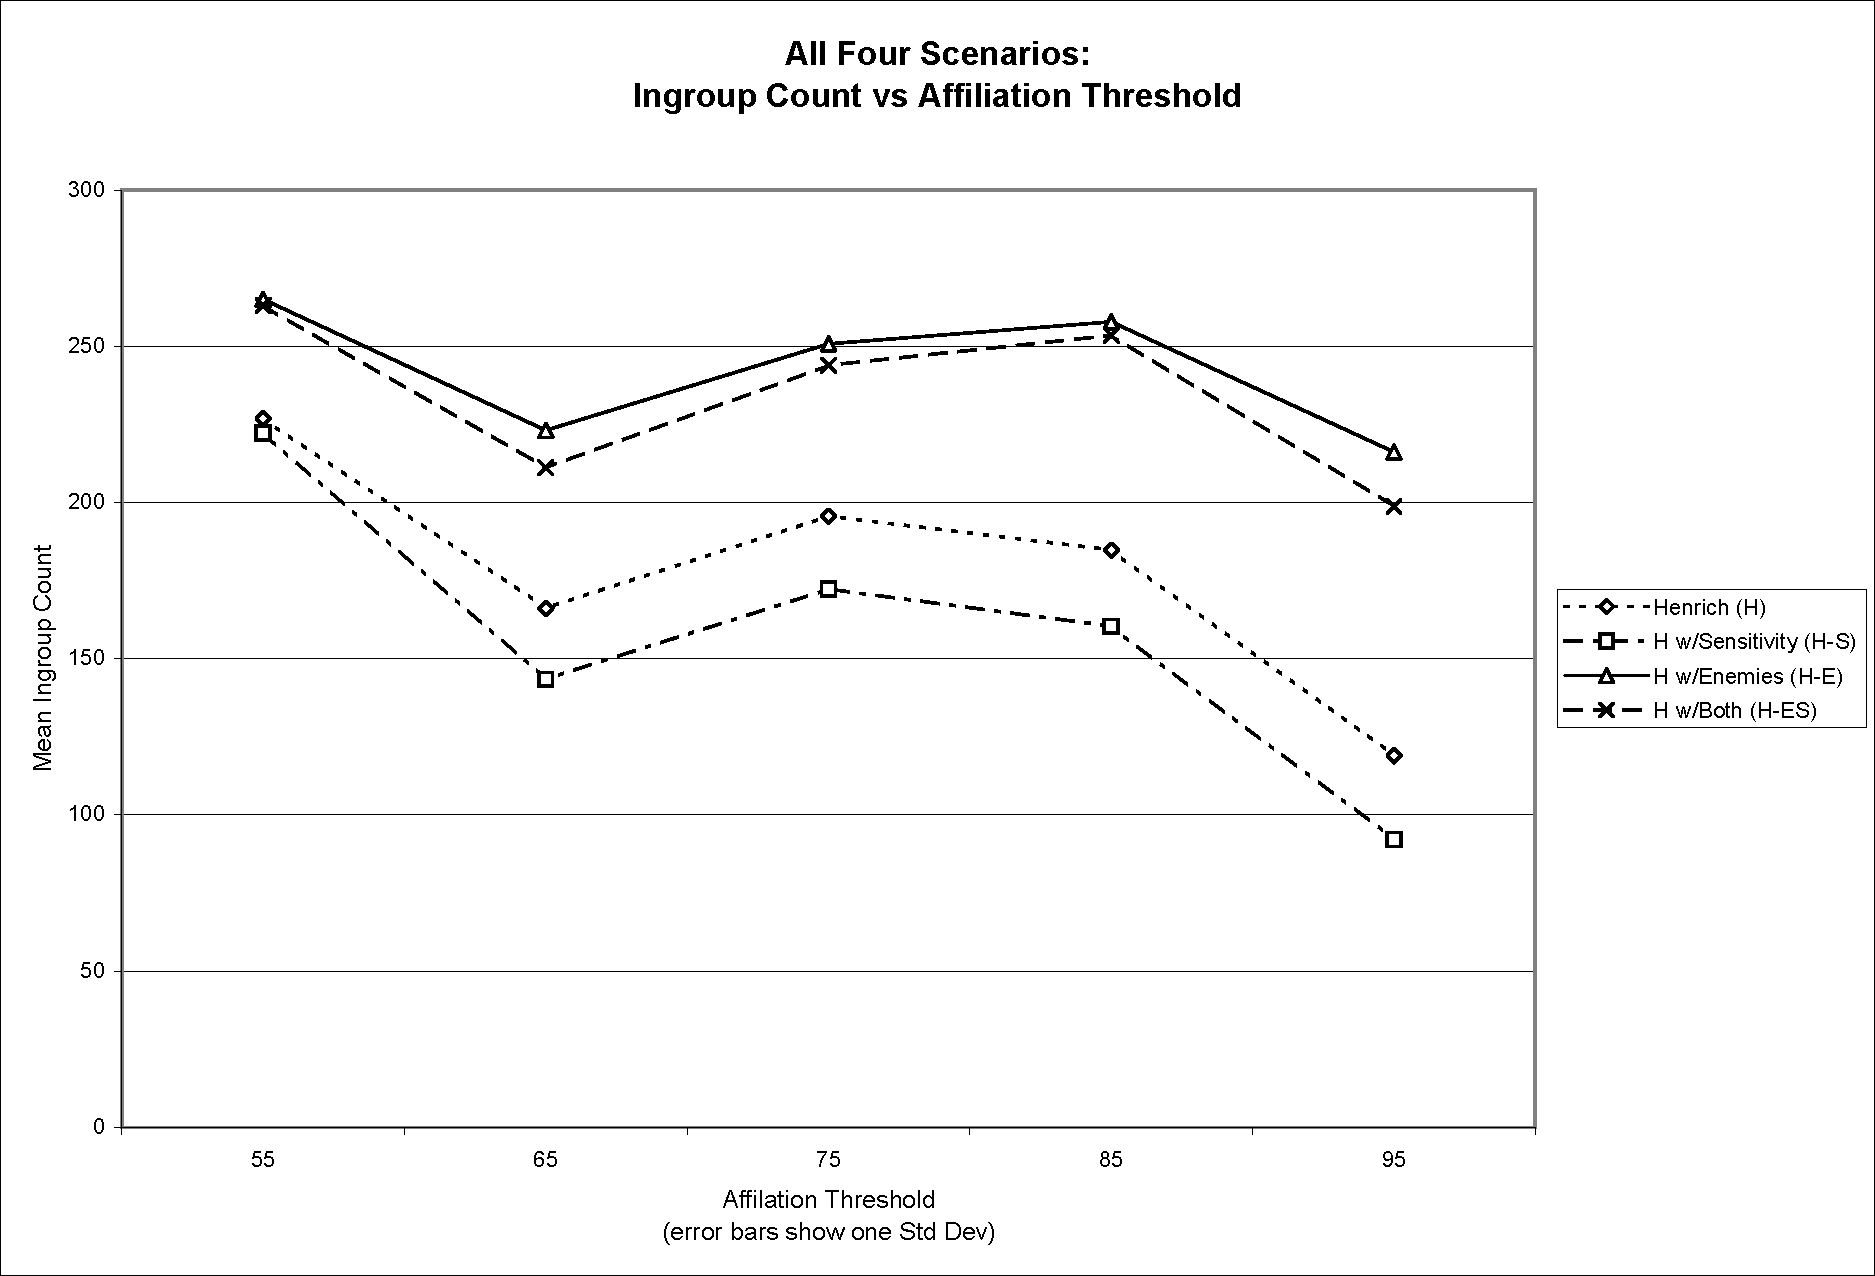
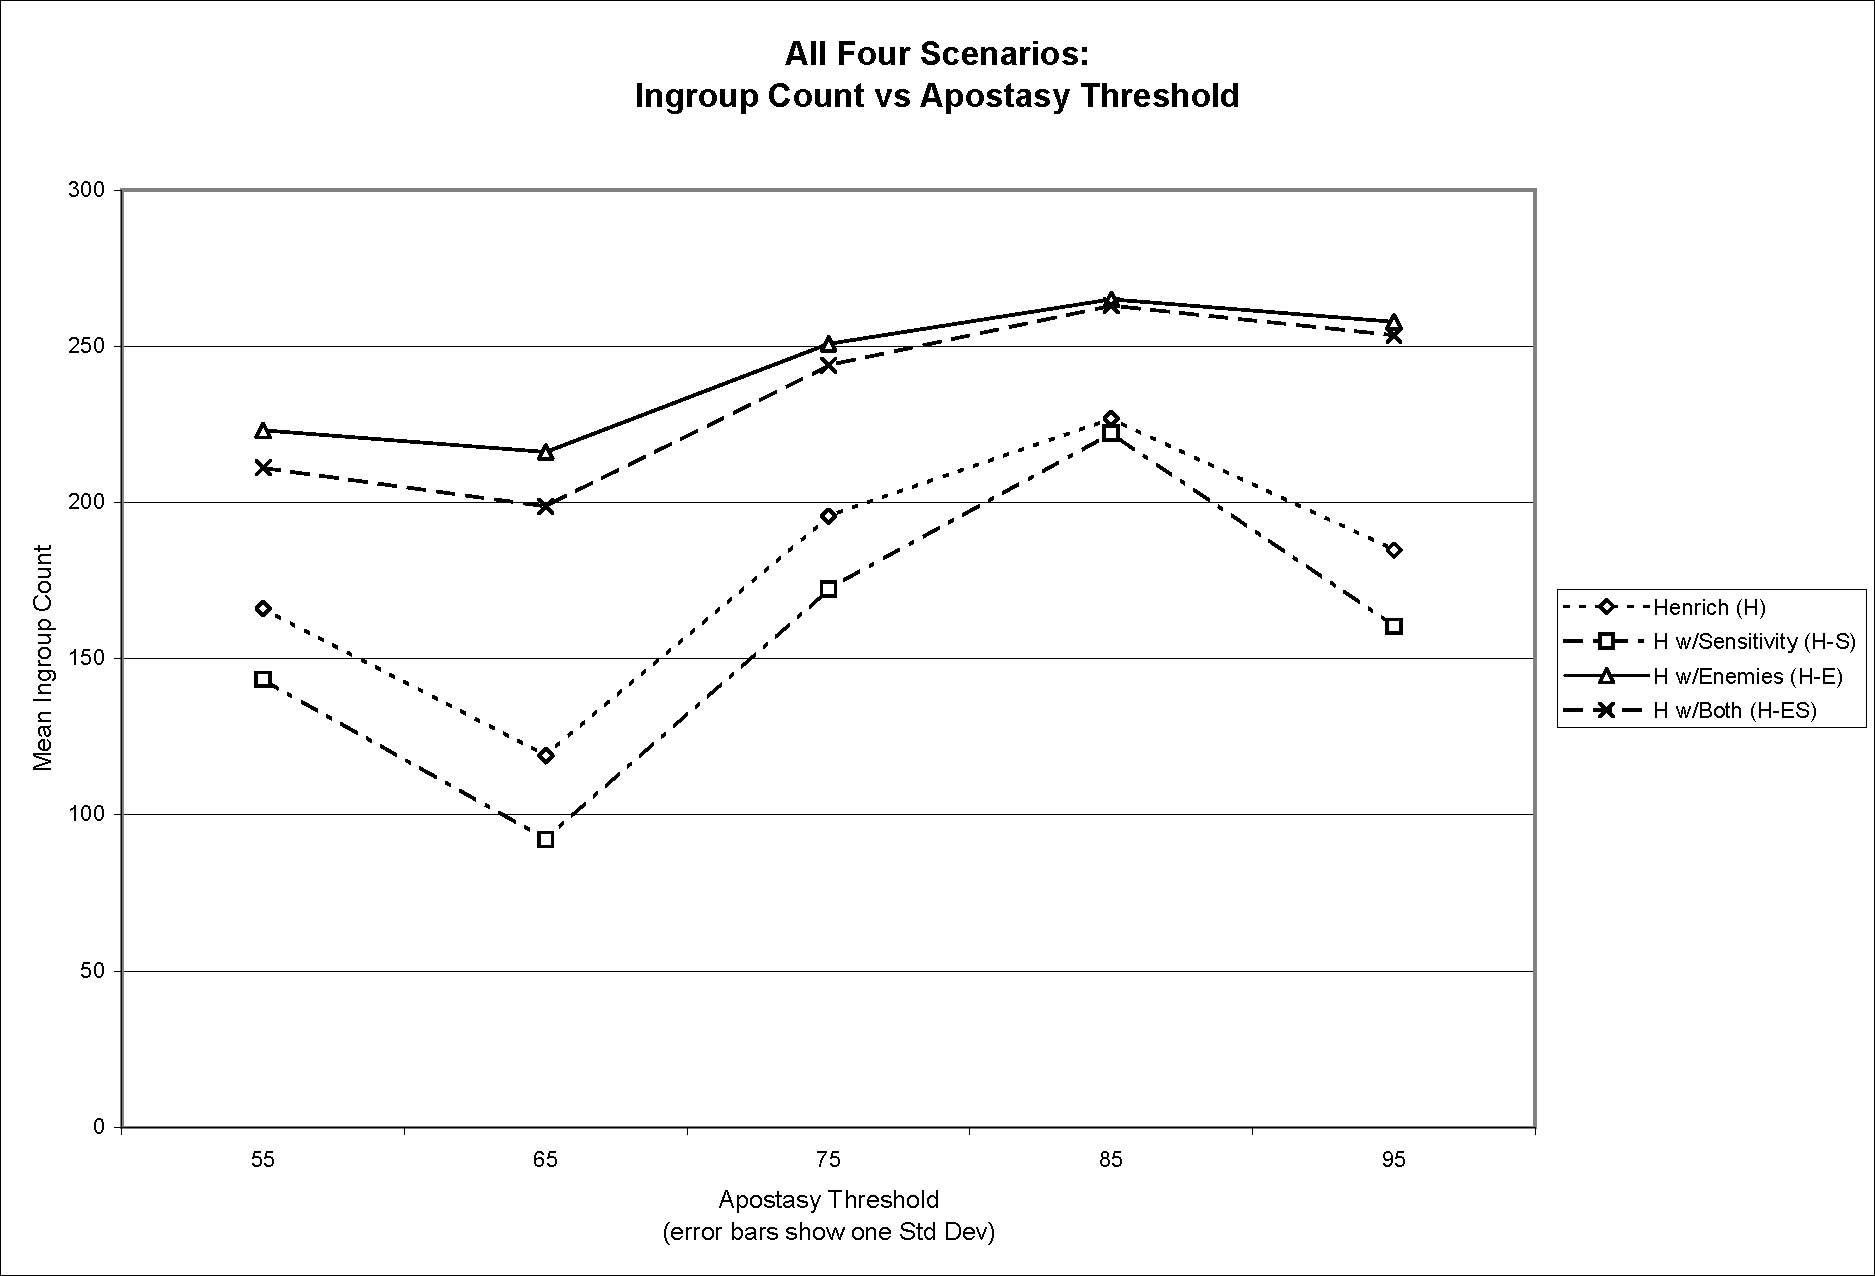
Figure 3a (top) and Figure 3b (bottom). Mean ingroup population versus affiliation threshold (3a) and apostasy threshold (3b) for all four scenarios - 4.7
- There are three striking features of these data.
- 4.8
- First, and most importantly, the plot of mean ingroup population counts in Figure 1 suggests a linear relationship in the way that the ingroup count varies with affiliation threshold and apostasy threshold, with a plane fitting reasonably closely at the top of the five stacks in any given scenario. This expresses the results of a multivariate linear analysis, with the scenario as factor, affiliation and apostasy thresholds as covariates, and ingroup population as the dependent variable. The resulting parameter estimates (in Table 6 below) indicate that the fit is exceptionally close. The right-most column in Table 5 presents the predictions for ingroup population averages supplied by the model with parameters in Table 6. The Omnibus Test comparing the fitted model against the intercept-only model produced a Likelihood Ratio Chi-Square of 42,561.49 (df=4, p<0.00001).
- 4.9
- Second, the ingroup population count is markedly higher (by an average of 48.1%) when enemies are involved in the scenario—this is expected given the way encounters with enemies affect affiliation tendency. More surprisingly, standard deviation of the ingroup population is significantly reduced (by an average of 47.4%) when enemies are present. Evidently, agent encounters with enemies lead to consistently (lower variance) larger (higher mean) ingroup populations.
- 4.10
- Third, including agent sensitivity in the model—so that some agents react more strongly to encounters than others—reduces the ingroup population a small amount (by an average of 8.2%) across the board. We do not have a good explanation for this emergent property of the model dynamics. Low-sensitivity individuals tend not to respond to encounters strongly enough either to pass the affiliation threshold and join a high-cost group, or to pass the apostasy threshold and leave a high-cost group. Whatever the explanation for this aspect of the emergent model dynamics, it appears that agent sensitivity is not a crucial factor, though it retains secondary strategic importance, as we discuss below.
Table 6: Multivariate Linear Analysis with the scenario as factor, affiliation and apostasy thresholds as covariates, and ingroup population as the dependent variable Parameter B Std Error 95% Wald CI Hypothesis Test Lower Upper Wald
Chi-Squaredf Sig. (Intercept) 177.93 1.72 174.56 181.31 10686.88 1 <0.00001 Enemies 70.01 0.45 69.14 70.89 24508.53 1 <0.00001 No Enemies* 0.00 Sensitivity -14.46 0.45 -15.34 -13.59 1045.93 1 <0.00001 No Sensitivity* 0.00 Affiliation Threshold -1.47 0.02 -1.51 -1.44 8691.53 1 <0.00001 Apostasy Threshold 1.44 0.02 1.41 1.47 8315.50 1 <0.00001 Dependent Variable: Mean Ingroup Population Model: (Intercept), Enemies, Sensitivity, Aff, Apo *Set to zero because this parameter is redundant. Stability of Ingroup Population
- 4.11
- The extraordinary multivariate prediction of ingroup population averages just described is the first and most persuasive indication of the stability of ingroup population. It is evidence of deep dynamics within the model that drive ingroup population levels to conform very closely to the settings of three key factors: whether enemies of the population are present, how hard it is to get into a high-cost group, and how difficult it is to leave a high-cost group.
- 4.12
- In addition to this fundamental stability result, we sought a straightforward quantitative measure of ingroup population stability. In settling on a method, we considered two issues. The first is how to quantify volatility in the form of variance of the ingroup population—this is particularly important because scenarios disallowing enemies display considerably higher variance of ingroup population than those that allow enemies. To measure this, we took a count of the ingroup population for each run after a fixed number of iterations, rather than averaging over a long interval of iterations (recall that averaging is used in Table 1, above). Ingroup population volatility is then preserved in the variance across the five runs for each combination of scenario, affiliation threshold, and apostasy threshold (Table 7 displays standard deviations at 4,000 iterations and again at 5,000 iterations).
- 4.13
- The second issue pertaining to evaluating stability of the ingroup population is how to quantify volatility in the form of ingroup population variation over iterations in a single run of the model. Qualitatively this type of volatility looks obvious, with the graph of the ingroup population for each run appearing to vary more and less dramatically around a mean that seems relatively consistent after about 500 iterations of the model. To capture this impression of stability quantitatively we recorded ingroup population counts after 4,000 iterations of the model and again after 5,000 iterations, for each of the 100 runs, predicting that we would get high correlations. To test this prediction, we performed a paired-samples correlation test, the results of which are presented in Table 7. The resulting high correlations suggest relative stability of ingroup/outgroup population counts.
Table 7: Stability Analysis Using Paired-Samples Correlation of Ingroup Population Counts after 4,000 and after 5,000 Iterations of the Model Scenarios Ingroup Population… Mean N SD Corr Sig All Scenarios Together After 4000 Iterations 206.29 100 61.59 0.87 <0.00001 (H, H-E, H-S, H-ES) After 5000 Iterations 216.82 100 58.69 Low Variance Scenarios After 4000 Iterations 239.68 50 32.17 0.84 <0.00001 (Enemies Not Allowed: H-E, H-ES) After 5000 Iterations 246.26 50 31.59 High Variance Scenarios After 4000 Iterations 172.90 50 65.97 0.86 <0.00001 (Enemies Allowed: H, H-S) After 5000 Iterations 187.38 50 64.75 - 4.14
- From both of these lines of analysis—the multivariate linear analysis and the quantitative correlations—we conclude that our model confirms Henrich's basic stability result and extends it from the situation of a stable high-cost equilibrium for an entire population to the situation of many groups with high-cost beliefs and practices. High-cost groups can survive within a broader population when group members use credibility enhancing displays to mitigate universal skepticism toward cheaply expressed beliefs.
Emergent Pathways to Costly Group Survival
- 4.15
- With this basic stability result in hand, we attempted to characterize the dynamics of the model in relation to the characteristics of its agents: leaders, followers, and regulars. What kinds of groups survived and what were their leaders like? Are there patterns in agent characteristics that help to explain why some groups survived and others perished? What we discovered is not one pathway toward group survival but a suite of emergent pathways, any one of which increases the likelihood of group survival.
- 4.16
- We took a snapshot of each run after 5,000 iterations, recording leader characteristics and averages for the characteristics of followers in groups that survived to that point. We recorded the same information at the moment of death for each group that did not survive the 5,000 iterations of a full run. We also recorded group cost. In this way, these data for each run naturally divided into two subsets based on whether the group was live or dead after 5,000 iterations. To compare dead versus live groups, we performed independent-samples t-tests for each recorded agent characteristic and group characteristic. The result was a group of t-tests for each of the 100 runs (4 scenarios by the 5 Latin-Square-derived settings of the Affiliation Threshold and Apostasy Threshold variables by 5 runs each).
- 4.17
- Significant diversity of leader and group characteristics was evident in the data, with some contrasts between live and dead groups being significant on some runs and not on others.This makes the multivariate prediction of ingroup population averages reported above that much more remarkable: those large scale linear dependencies persist through the noise of a variety of leader and group characteristics and internal model dynamics.
- 4.18
- Despite the diversity, drilling down into the contrasts between live and dead groups yielded several recurring patterns. These are emergent pathways to the survival of costly groups. There are not many, and one is dominant, but it is important to notice that there is more than merely one such recipe for survival. This fact complicates strategic decisions both for those attempting to preserve high-cost groups and those attempting to eliminate them. We discuss these strategic questions later. For now, we identify these emergent pathways to costly group survival using qualitative descriptions and indicating how widespread each pathway seems to be.
- 4.19
- First, in 94% of runs, Group Cost was higher for live groups than dead groups, with that contrast achieving significance at the 0.05 level in 60% of runs. In the formulas governing changes in the Affiliation Tendency and Apostasy Tendency variables, higher Group Cost increases the degree to which credibility enhancing displays mitigate universal skepticism toward cheaply expressed beliefs, thereby tending to make high-cost groups slightly more attractive than low-cost groups, providing the encounter with the group is in the person of a consistent group leader or a consistent group follower. So it is not surprising that live groups would tend to have higher group cost than dead groups. Moreover, in a sizeable minority (40%) of runs, significantly higher group cost was not required to achieve stability of the ingroup population; this fits the conclusions of other studies that some low-cost groups do seem to endure (Sosis and Bressler 2003; Sosis, Kress, and Boster 2007).
- 4.20
- Second, in 100% of runs, Leader Consistency was higher for live groups than dead groups, with that contrast achieving significance at the 0.05 level 87% of the time. Average Group Follower Consistency achieved a significant contrast in the same direction in 73% of runs. Consistency of the encountered agent determines the sign of the incremental changes in the Affiliation Tendency and Apostasy Tendency variables, so consistency is an important consideration in analyzing model dynamics.
- 4.21
- Third, in 65% of runs, Leader Charisma was higher for live groups than dead groups, with that contrast achieving significance at the 0.05 level in 8% of cases. Average Group Follower Charisma was also higher in most cases, with the contrast significant in 9% of the runs. We gave agents the personality characteristic of charisma in deference to sociological and psychological findings about the key role a charismatic leader plays in defining group identity and promoting group solidarity (House and Aditya 1997). In the formulas governing changes in the Affiliation Tendency and Apostasy Tendency variables, higher agent charisma amplifies the impact of encounters, both negatively and positively, depending on agent consistency. Even so, charisma turns out to be a far less important factor than consistency of leaders and group members.
- 4.22
- We combined these three emergent pathways to costly group survival into a "Group Power" variable, consisting of the product of Group Cost, Leader Charisma, and Leader Consistency. In all runs, the Group Power variable was higher for live groups than dead groups, with the contrast achieving significance at the 0.05 level over 90% of the time. This is an important finding for strategic considerations. But it is at least as important that there appears to be no sure-fire path to costly group success because, in a small minority of cases, even Group Power does not account for group survival, at least not after 5,000 iterations of the model.
- 4.23
- The final and least important pathway toward stability of the ingroup population involves the personality variables expressing appreciation for no-cost consistency and appreciation for high-cost consistency. Deriving from Henrich's original model, but treated here as normally distributed personality characteristics, these variables mitigate the universal skepticism due to the possibility of cheaply expressed beliefs. While these variables marked a significant distinction between live and dead groups in only 7% of runs, in most cases the average appreciation for consistency was higher for live groups than for dead groups (appreciation for low-cost consistency was higher in 60% of runs and for high-cost consistency in 55% of runs), indicating that these factors do play a minor role in determining whether a costly group survives.
Agent Sensitivity Dynamics
- 4.24
- The model allows us to track an individual throughout a run, observing each encounter and the associated change in affiliation tendency and apostasy tendency. The most dramatic difference in individual behavior is tied to the agent personality characteristic of sensitivity. By amplifying or muting the impact of encounters in scenarios where sensitivity is allowed, the sensitivity characteristic causes low-sensitivity agents to change affiliation slowly and rarely, while high-sensitivity agents flit in and out of groups rapidly.
- 4.25
- To express this phenomenon statistically, we performed a linear regression for all five runs of the H-S scenario (the basic Henrich scenario with the sensitivity variable enabled) using (Aff,Apo)=(75,75) to see how the count of an agent's group affiliations varied with agent sensitivity. We excluded leaders, whose sensitivity setting does not come into play unless and until their group dies. The results, which are much the same for other combinations of initial settings, indicate a pronounced linear relationship (the sensitivity coefficient is 0.0879 with significance < 0.0001 and the intercept is -0.3029 with significance 0.005). Figure 4 displays the regression in graphical form. This plot compactly expresses the relationship between agent sensitivity and the number of times an agent passes the Affiliation Threshold and joins a group (of course, the agent must also pass the Apostasy Threshold and deaffiliate before joining a new group). High-sensitivity individuals have volatile personal histories because it is relatively easy to influence their beliefs and behaviors. Presumably that influence can be exercised deliberately to some degree so as to control high-sensitivity individuals; we return to this when we discuss strategic considerations, below.
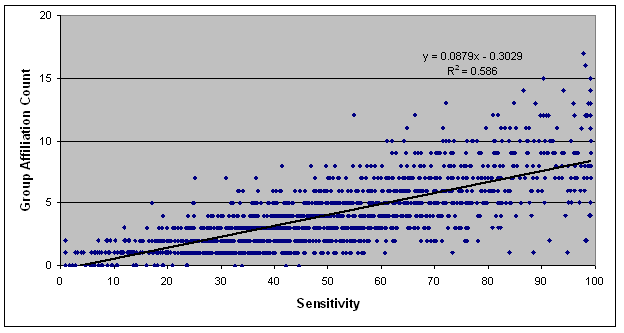
Figure 4. Linear Regression of Affiliation Count against Sensitivity in the H-S Scenario Online versus In-Person Encounters
- 4.26
- One of the elaborations of the model we explored was to allow both online and in-person encounters—an increasingly important consideration in understanding the communication and conversion dynamics surrounding certain types of costly groups. Social engagement via social networking sites has interesting implications for signaling systems because such mechanisms can establish the trust and reliability necessary for cooperative relationships to emerge (Donath 2007). The main result above does not involve online encounters but we ran several runs using a mixed in-person-and-online model and discovered that ingroup population counts are just as stable whether or not online encounters are allowed. We have not yet investigated differences in the functions of in-person and online contacts in the stability of high-cost groups.
Discussion
- 5.1
- We focused on making the agent-based model described in this paper a natural and minimalist extension of Henrich's model to the situation where there are costly groups within a larger population. We constructed the model's assumptions drawing on existing knowledge about actual populations containing groups with costly beliefs and practices. To the extent that the assumptions of this model plausibly reflect real-world social dynamics—and we have not undertaken the actual data modeling required to investigate this—it is possible to draw some strategic inferences from the model dynamics.
- 5.2
- On the one hand, from the point of view of a high-cost group leader who seeks to maintain a high-cost group within a larger population and in competition with other costly groups, several strategies are relevant. First, maximize Group Power-that is, make sure leader charisma, leader consistency, and group cost are optimally high. This can be achieved using techniques commonly observed among costly religious groups, including endorsing heavily cosmologized religious beliefs, closely regulating group member beliefs and behaviors, demonizing outsiders as impure and evil, and maintaining sincerity of conviction in the group leadership. Second, since high-sensitivity individuals are more mobile, a lot of them are likely to enter the group. In order to retain them, it is important to avoid driving up the apostasy tendency beyond the Apostasy Threshold. This can be achieved by increasing average follower consistency and high leader consistency within the group. But it is also important to avoid spending too much energy on high-sensitivity individuals, because they are likely to leave despite the leader's best efforts. Meanwhile, converting low-sensitivity individuals is more likely to guarantee long-term success because once in a group they are unlikely to leave. It follows, for example, that a high-cost group using suicide bombers to advance its mission will achieve higher stability by recruiting and training high-sensitivity individuals for that task, since those individuals are likely to seek to leave the group eventually anyway. Indeed, suicide bombers are typically recruited among impressionable adolescents (Victoroff 2005). Third, to compete effectively with other groups, there must be positive encounters with potential recruits, for which purpose large group size and high average follower consistency are the relevant assets. Fourth, because the presence of enemies drives up group size (and decreases volatility of membership), it will be helpful to identify an enemy with whom existing and potential group followers have periodic negative encounters and to control follower perceptions of that enemy so that even neutral encounters are perceived negatively. Fifth, use online networks to nurture positive ingroup encounters.
- 5.3
- On the other hand, from the point of view of those wanting to disrupt the activities of high-cost groups endorsing terror and violence, alternative strategies are relevant. The costs associated with violent groups appear to be critical in establishing reliable commitments when defection (e.g., failing to carry out a coordinated attack, thereby exposing a terrorist cell) can result in high costs for cooperators (Berman and Laitin 2008; Sosis and Alcorta 2008). Effective lines of resistance to such groups will interfere with the dynamics required to sustain high-cost beliefs and behaviors. First, monitor high-charisma and high-consistency leaders and attempt to prevent them from gaining leadership control of high-cost groups. Second, increase positive out-group contacts with high-sensitivity followers to induce them to leave the group before they commit a violent action, but do not invest too much energy in such volatile people because they are likely to defect and join another high-cost group quickly anyway. Ideally, induce low-sensitivity individuals to leave high-cost groups through sustained reeducation campaigns, because once they leave they are unlikely to rejoin. Third, foster the survival of preferred groups and the death of unwanted groups by encouraging large group size and high average follower consistency within the desired groups while attempting to interfere with such features in unwanted groups. This might involve propaganda to draw attention to behaviors that are actually, or may be perceived as, inconsistent with beliefs. Fourth, reduce the presence of enemies to decrease average group size and increase membership volatility, thereby exposing more groups to the possibility of extinction. Fifth, disrupt online networks that might nurture positive ingroup encounters.
Conclusion
- 6.1
- One measure of the value of any simulation model is how well it helps us understand the real world. Here we have extended Henrich's (2009) cultural evolutionary model of costly religious displays. Henrich's model shows that there can be a stable equilibrium for an entire population committed to costly displays. For a wide range of initial conditions, that high-cost stable equilibrium coexists with a no-cost stable equilibrium, and the entire population gravitates to one or the other based on initial conditions governing the starting frequency of credibility-enhancing displays in the population. Our model generalized Henrich's result to populations peppered with subgroups committed to high-cost beliefs and practices. Our model shows that high-cost groups achieve long-term stability within a larger population under a wide range of conditions. Leadership charisma and consistency, significant group costs, and the presence of enemies are the factors that most prominently influence group survival and success. These findings have strategic implications for how to influence the survival of high-cost groups, but more ethnographic fieldwork and experimental studies with high-cost groups are needed to assess the merit of these recommendations.
Appendix A: Supplementary Material
-
A.1. Realization of the Model
- 7.1
- The agent-based model described here was first developed in NetLogo version 4.04. Subsequently, to overcome limitations in NetLogo's development environment, to maintain more convenient tracking of parameter sets, and to achieve greater reporting power, the model was redeveloped in Visual Basic, within the Microsoft Access 2003 development environment. Both the NetLogo and the Visual Basic implementations yielded the same basic stability result. Statistical analysis and graphing of data from runs of the model were performed in Microsoft Excel 2003 and in SPSS version 16.0.1. Statistical analyses were performed on the fully realized Visual Basic implementation of the model.
- 7.2
- The following screen shots display the form specifying the model's parameters. Note that the dynamics tab (not displayed, and not used in the study described in this paper) allows for the implementation of formulas other than those derived from Henrich's original model.
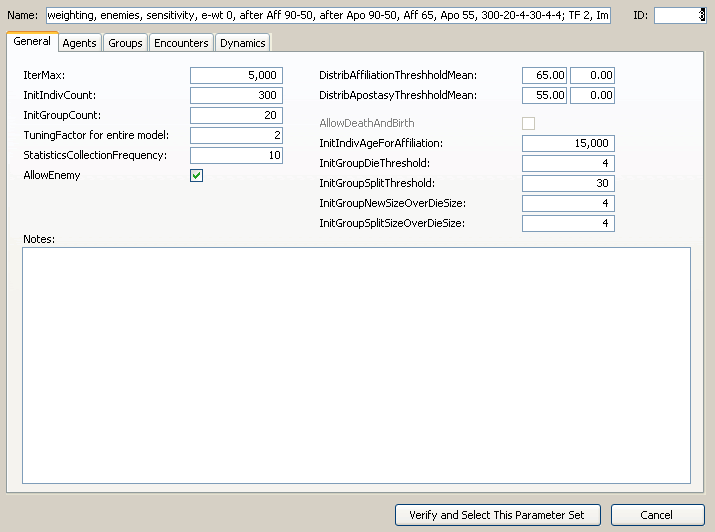
Figure A-1a. Model Settings, General Tab 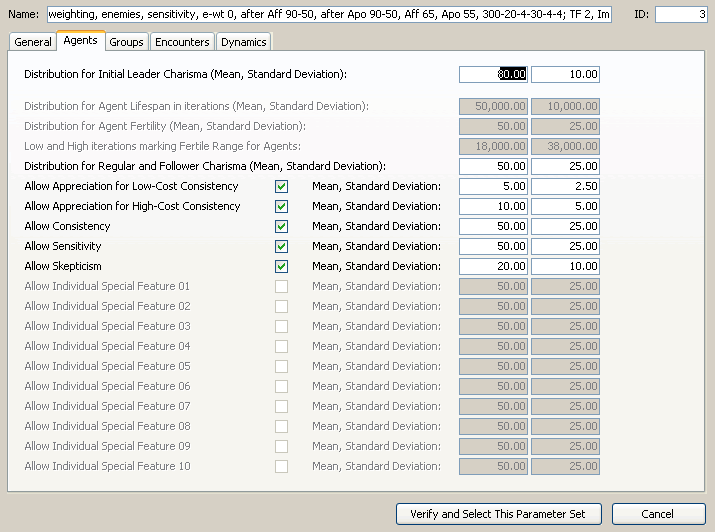
Figure A-1b. Model Settings, Agents Tab 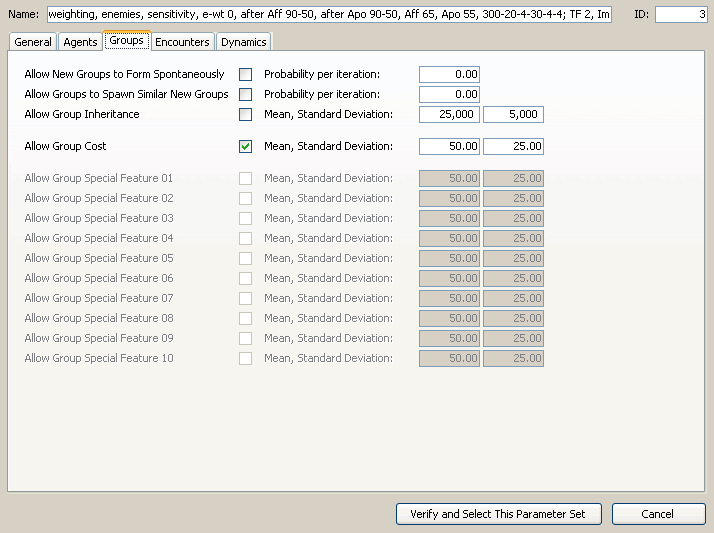
Figure A-1c. Model Settings, Groups Tab 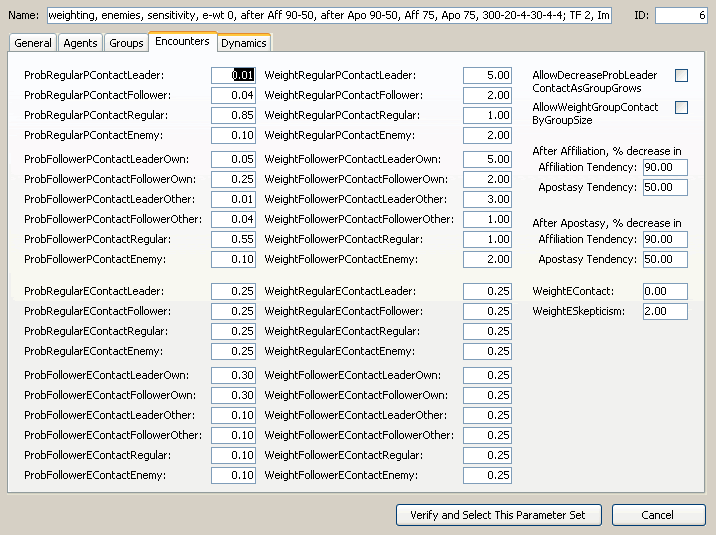
Figure A-1d. Model Settings, Encounters Tab - 7.3
- A screen shot of the form used to make runs of the model is below. This screen shot shows the tab that plots the history of the count of those in and out of groups.
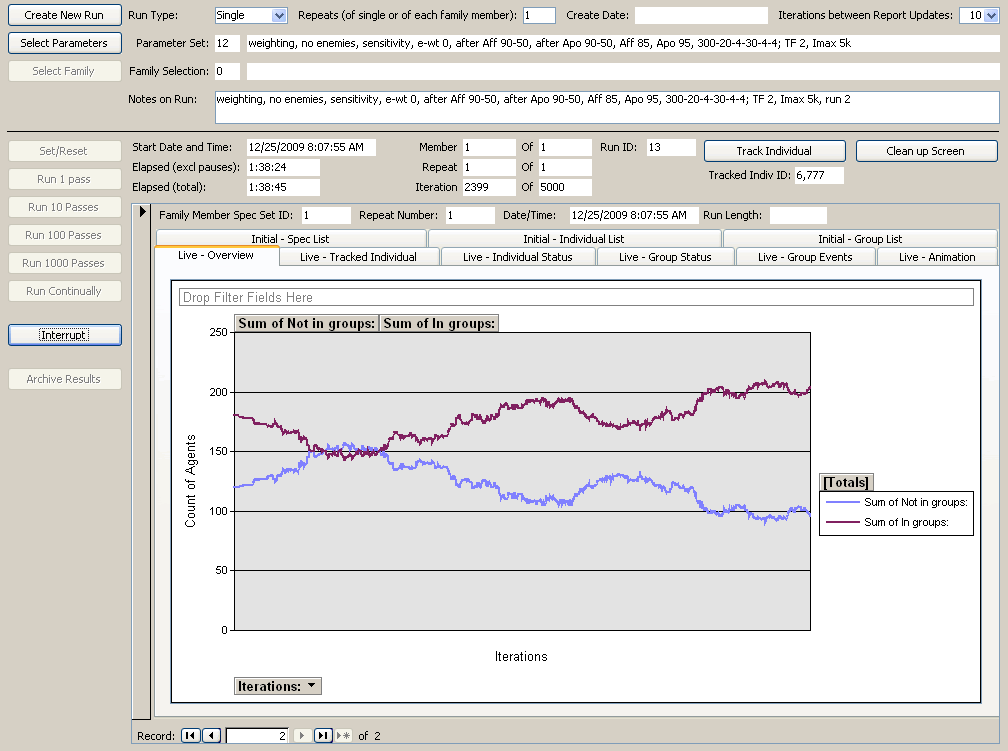
Figure A-2. Model Output, Overview Tab A.2. Limitations and Avenues for Further Research
- 7.4
- This research has a number of limitations and opens up an even larger number of avenues for further research. These include the following.
- 7.5
- First, a theoretical model of the sort presented in this paper is limited by not being tested against actual population data. The stability result is theoretically interesting but confidence in the model as a source of strategically relevant insights into actual cultural settings would be strengthened by such testing.
- 7.6
- Second, several limitations derive from our fundamental aim of extending Henrich's result while keeping the cognitive abilities and decision-making processes of agents as close as possible to those of Henrich's original (not agent-based) model. It would be interesting to see how the model performs when relaxing restrictions such as the following.
- While agent characteristics and encounters are probabilistically determined, agent success-weighting calculations involve no stochastic element. This need not be so.
- In both models, agents interact based on model-wide probabilities governing agent encounters that are supposed to reflect reasonable assumptions about proximity or sub-cultural affinity. These probabilities need not be model-wide but could vary by agent or group.
- Every interaction always yields a success-weighting calculation that increases or decreases affiliation tendency and apostasy tendency. This need not be so.
- 7.7
- Third, as the model stands, even without modification or extension, several lines of exploration suggest themselves, including the following.
- We could determine the relative importance of online versus in-person contacts under a variety of model-wide assumptions. For example, we might perform five runs of the model for each of five values for the Online Contact Probability variable (0, 0.25, 0.5, 0.75, and 1), with Affiliation Threshold and Apostasy Threshold held at (Aff,Apo)=(75,75), and in two scenarios, H and H-E.
- More fundamentally, we could investigate the model's pressure thresholds, where the emergent stability behavior breaks down; this would help evaluate the model's assumptions and yield a deeper understanding of the model's design space.
- We could also delve into the dependence of the stability result on model variables that we did not vary for the purpose of the current investigation, such as the amplification variable (β) that determines the relative perturbation size of affiliation tendency and apostasy tendency.
- 7.8
- Fourth, our model could be extended in a host of intriguing ways, including the following.
- The model takes no account of the costs of participating in the larger societal structures of any state, whether industrialized, secular, and pluralistic or of any other kind; such costs are treated as baseline realities for agents in our model—but need not be.
- The model allows agent history to figure in affiliation decisions—in the accumulation of incremental changes in affiliation tendency and apostasy tendency, and in the fact that after passing the affiliation threshold agents join the group with which they had the most recent positive encounter—but the personal memory of agents could be greatly extended, including by carrying experience-based variables for probabilities of different types of encounters rather than using model-wide settings for these probabilities.
- The death and split thresholds are model-wide initial conditions but could be made to vary from group to group based on the cost variable for the group (higher cost might require smaller split threshold) or in some other plausible way.
- We could introduce a perturbation mechanism to study spontaneous group formation rather than merely group formation via splitting from an existing group.
- We could investigate agent birth and death, and the associated inheritance dynamics.
- We could change enemies into dynamic agents who perform their own success weighting calculations and have variable interactions with other agents.
- We could introduce other agent characteristics that would impact success-weighting calculations (such as access to accurate information about world affairs) to evaluate their relevance in high-cost group stability.
Acknowledgements
- We are grateful to Joe Henrich for his help as we sought to confirm the mathematical calculations in his 2009 paper, whose central result this paper extends. We thank Don Braxton and two anonymous reviewers for their helpful comments on earlier drafts of this paper.
References
-
ARMSTRONG K (2000) The battle for God. New York: Random House.
ARON E and Aron A (1997) Sensory-processing sensitivity and its relation to introversion and emotionality. Journal of Personality and Social Psychology 73/2. pp. 345-368. [doi:10.1037/0022-3514.73.2.345]
ATRAN S (2002) In Gods we trust: The evolutionary landscape of religion. Oxford, Oxford University Press.
ATRAN S and Norenzayan A (2004) Religion's evolutionary landscape: Counterintuition, commitment, compassion. Communion, Behavioral and Brain Sciences 27. pp. 713-770. [doi:10.1017/s0140525x04000172]
BERGER PL (1967) The Sacred Canopy: Elements of a Sociological Theory of Religion. Garden City, NY: Doubleday.
BERGER PL and Luckmann T (1968) The Social Construction of Reality. Garden City, NY: Doubleday.
BERMAN E (2000) Sect, subsidy and sacrifice: An economist's view of Ultra-Orthodox Jews. Quarterly Journal of Economics 115. pp. 905-953. [doi:10.1162/003355300554944]
BERMAN E (2009) Radical, Religion, and Violent: The New Economics of Terrorism. Cambridge: MIT Press.
BERMAN E and Laitin DD (2008) Religion, terrorism and public goods: Testing the club model. Journal of Public Economics 92. pp. 1942-1967. [doi:10.1016/j.jpubeco.2008.03.007]
BOSTER JS (1987) Intracultural variation, special issue of the American Behavioral Scientist 31/2.
BRUCE S (2008) Fundamentalism. Cambridge, MA: Polity Press.
BULBULIA J (2004) Religious costs as adaptations that signal altruistic intention. Evolution and Cognition 10/1. pp. 19-38.
BUNT, GR (2000) Virtually Islamic: Computer-mediated communication and cyber Islamic environments. Cardiff: University of Wales Press.
CARR J and Landa J (1983) The economics of symbols, clan names and religion. Journal of Legal Studies 13. pp. 135-156. [doi:10.1086/467717]
CRONK L (1994) Evolutionary theories of morality and the manipulative use of signals. Zygon: Journal of Religion and Science 29. pp. 32-58. [doi:10.1111/j.1467-9744.1994.tb00651.x]
DONATH J (2007) Signals in social supernets. Journal of Computer-Mediated Communication 13/1 article 12 http://jcmc.indiana.edu/vol13/issue1/donath.html. [doi:10.1111/j.1083-6101.2007.00394.x]
DOW J (2008) Is Religion an Evolutionary Adaptation? Journal of Artificial Societies and Social Simulation 1/2 p. 2.
DURKHEIM E (1915 [1912]) The elementary forms of the religious life. London: G. Allen & Unwin; New York: Macmillan.
FINCHER CL and Thornhill R (2008) Assortative sociality, limited dispersal, infectious disease and the genesis of the global pattern of religion diversity. Proceedings of the Royal Society B275. pp. 2587-2594. [doi:10.1098/rspb.2008.0688]
GINTIS H, Smith EA, and Bowles S (2001) Cooperation and costly signaling. Journal of Theoretical Biology 213. pp. 103-19. [doi:10.1006/jtbi.2001.2406]
GRAFEN A (1990) Biological Signals as Handicaps. Journal of Theoretical Biology 144. pp. 517-546. [doi:10.1016/S0022-5193(05)80088-8]
GRIMM V, Berger U, DeAngelis DL, Polhill JG, Giske J, and Railsback SF (2010) The ODD protocol: A review and first update. Ecological Modelling 221. pp. 2760-2768. [doi:10.1016/j.ecolmodel.2010.08.019]
HENRICH J, Boyd R, Bowles S, Camerer C, Fehr E, and Gintis H (2004) Foundations of human sociality. Oxford: Oxford University Press. [doi:10.1093/0199262055.001.0001]
HENRICH J. (2009) The evolution of costly displays, cooperation and religion: credibility enhancing displays and their implications for cultural evolution. Evolution and Human Behavior 30. pp. 244-260. [doi:10.1016/j.evolhumbehav.2009.03.005]
HOCHBERG ME (2004) A theory of modern cultural shifts and meltdowns. Proceedings of the Royal Society B271. pp. S313-S316. [doi:10.1098/rsbl.2004.0172]
HOUSE RJ and Aditya RN (1997) The social scientific study of leadership: Quo vadis? Journal of Management 23. pp. 409-473. [doi:10.1177/014920639702300306]
IANNACCONE L (1992) Sacrifice and stigma: Reducing free-riding in cults, communes, and other collectives. Journal of Political Economy 100. pp. 271-291. [doi:10.1086/261818]
IANNACCONE L (1994) Why strict churches are strong. American Journal of Sociology 99. pp. 1180-1211. [doi:10.1086/230409]
IRONS W (2001) Religion as a hard-to-fake sign of commitment. In Nesse R (Ed.) Evolution and the capacity for commitment. New York, Russell Sage Foundation. pp. 292-309.
MARTY ME and Appleby RS (1995) The fundamentalism project. Chicago: Chicago University Press.
MAYNARD SMITH, J and Harper D (2003) Animal signals. New York: Oxford University Press, 2003.
NORENZAYAN A and Shariff AF (2008) The origin and evolution of religious prosociality. Science 322 pp. 58-62. [doi:10.1126/science.1158757]
RICHERSON PJ and Boyd R (2005) Not by genes alone: How culture transformed human evolution. Chicago, University of Chicago Press.
ROSSANO M (2010) Supernatural selection: How religion evolved. New York: Oxford University Press. [doi:10.1093/acprof:oso/9780195385816.001.0001]
SOSIS R (2003) Why aren't we all Hutterites? Costly signaling theory and religion. Human Nature 14. pp. 91-127. [doi:10.1007/s12110-003-1000-6]
SOSIS R (2009) Why are synagogue services so long? An evolutionary examination of Jewish ritual signals. In Goldberg R (Ed.) Judaism in biological perspective: Biblical lore and Judaic practices. Boulder: Paradigm Publishers. pp. 199-233.
SOSIS R and Alcorta C (2003) Signaling, solidarity and the sacred: the evolution of religious behavior. Evolutionary Anthropology 12. pp. 264-274. [doi:10.1002/evan.10120]
SOSIS R and Alcorta C (2008) Militants and martyrs: Evolutionary perspectives on religion and terrorism. In Sagarin R and Taylor T (Eds.) Natural security: A Darwinian approach to a dangerous world. Los Angeles: University of California Press. [doi:10.1525/california/9780520253476.003.0007]
SOSIS R and Bressler E (2003) Cooperation and commune longevity: a test of the costly signaling theory of religion. Cross-Cultural Research 37. pp. 211-239. [doi:10.1177/1069397103037002003]
SOSIS R and Ruffle B (2003) Religious ritual and cooperation: Testing for a relationship on Israeli religious and secular Kibbutzim. Current Anthropology 44. pp. 713-722. [doi:10.1086/379260]
SOSIS R, Kress H, and Boster J (2007) Scars for war: Evaluating alternative signaling explanations for cross-cultural variance in ritual costs. Evolution and Human Behavior 28. pp. 234-247. [doi:10.1016/j.evolhumbehav.2007.02.007]
SPENCE M (1973) Job market signaling. Quarterly Journal of Economics 87. pp. 355-374. [doi:10.2307/1882010]
VAN VUGT M (2006) Evolutionary origins of leadership and followership. Personality and Social Psychology Review 10. pp. 354-371. [doi:10.1207/s15327957pspr1004_5]
VAN VUGT M and De Cremer D (1999) Leadership in social dilemmas: The effects of group identification on collective actions to provide public goods. Journal of Personality and Social Psychology 76. pp. 587-599. [doi:10.1037/0022-3514.76.4.587]
VICTOROFF J (2005) The mind of the terrorist: a review and critique of psychological approaches. Journal of Conflict Resolution 49. pp. 3-42. [doi:10.1177/0022002704272040]
WEBER M (1947 [1922]). The theory of social and economic organization, edited with an introduction by Talcott Parsons, translated by Henderson AM and Parsons T from volume 1, part 1 of Wirtschaft und Gesellschaft (Tübingen: J.C.B. Mohr), New York: Free Press; London, Collier Macmillan.
WHITEHOUSE H (2004) Modes of religiosity: A cognitive theory of religious transmission. New York: Alta Mira Press.
WILSON CG (2008) Male genital mutilation: An adaptation to sexual conflict. Evolution and Human Behavior 29/3. pp. 149-164. [doi:10.1016/j.evolhumbehav.2007.11.008]
WINSTON H (2005) Unchosen: The hidden lives of Hasidic rebels. Boston: Beacon Press.
ZAHAVI A (1975) Mate selection-A selection for handicap. Journal of Theoretical Biology 53. pp. 205-214. [doi:10.1016/0022-5193(75)90111-3]