
 Abstract
- This article uses Polity IV data to probe system dynamics for studies of the global diffusion of democracy from 1800 to 2000. By analogy with the Bass model of diffusion of innovations, as translated into system dynamics by Sterman, the dynamic explanation proposed focuses on transitions to democracy, soft power, and communication rates on a global level. The analysis suggests that the transition from democratic experiences ('the soft power of democracy') can be estimated from the systems dynamics simulation of an extended Bass model. Soft power, fueled by the growth in communications worldwide, is today the major force behind the diffusion of democracy. Our findings indicate the applicability of system dynamics simulation tools for the analysis of political change over time in the world system of polities.
- Keywords:
- Democracy, Bass, Communication, System Dynamics, Power, Diffusion
In memory of Walter Goldberg; my mentor, with gratitude
The internet is showing people what life can be like. And when people who live in repressive countries see that, it makes them want it.
Salman Rushdie
A New Systems Approach in Political Studies
-
Applying System Dynamics in Political Science
- 1.1
- System dynamics simulations have previously been used in areas such as industrial dynamics and world energy system forecasting. Jay Forrester founded this approach and elaborated its applications in Industrial Dynamics (1961) and World Dynamics (1971). A considerable number of studies have since established the place of the system dynamics approach in other types of research, including business dynamics. The growing literature on system dynamics documents its employment throughout the social sciences (Davidssen 2000). John Sterman's Business Dynamics (2000) is a classic introduction to these techniques of systems thinking and simulations. However, applications in political science generally appear to be lacking, "Simulation" in the context of system dynamics means that a "target system, with its properties and dynamics, is described using a system of equations which derive the future state of the target system from its actual state" (Gilbert and Troitzsch 2005: 27). System dynamic simulation models are defined by stocks and flows, and by the variables and constants affecting these flows. (Mathematically, the stocks are integrals of the flows, and the derivatives of the stocks are the flows, which constitute change in the system.)
- 1.2
- We have here endeavored to apply system dynamics to an area that is of fundamental concern to political science, and perhaps constitutes a prerequisite for the emergence of its modern forms: the worldwide spread of democracy over the last two centuries. The application will be made primarily in order to discern why democracy (in global, systemic-dynamic terms) has been diffused. Expressed in system dynamics terminology, our question becomes: which flows, variables, and constants affected our focus variable, change in the stock of democratic polities in the world system of states between 1800 and 2000, and how?
- 1.3
- The yearly flows to and from the stock of democratic states is explained by analogy to the Bass model, as defined by Sterman (2000). Since this model has been developed for analyzing the diffusion of innovations, one important implication is that, in consequence of including changes from soft power as a variable, it can be a paradigm for understanding social change in any population of social units.
- 1.4
- In addition, the model can be used for analyzing forces behind and changes in soft power over time in the international system of states. Thus, it can also make more understandable to international organizations involved in providing aid programs for such purposes the dynamics and prerequisites for the diffusion of democracy.
Background to Social Science Simulation
- 1.5
- There are several types of simulation techniques used in social science, and different rationales for using them. For a general overview, see Gilbert and Troitzsch (2005). Also Clark and Cole eds. (1975) give valuable historical and comparative insights into global simulation modeling.
- 1.6
- Political scientist Karl Deutsch et al. (1977) presents a variety of world modeling studies produced by the Committee on Quantitative and Mathematical Approaches to Politics within the International Political Science Association (IPSA). Bremer, a contributor to Deutsch et al., also published a book on Simulated Worlds (1977) that is a model for national decision making in response to the international environment and national goals. Bremer also edited the reports from the GLOBUS project, a major attempt to simulate political and economic developments worldwide (Bremer 1987). Among other contributions to the field of social science simulations we find Cusack (1987) and Smith (1987) on international political processes. Deutsch expresses great optimism in his foreword, announcing the project as "GLOBUS-The rise of a new field of political science". But after these grand efforts, world modeling has failed to attain the prominent position in political science Deutsch had hoped for (Deutsch 1990).
- 1.7
- Nowadays, agent-based and game theory simulations are perhaps the best known examples of simulations in political and social science (seeAxelrod 1984, Cederman 1997, 2003, Cioffi-Revilla 2002). In the present study, however, the system dynamics simulation technique is used for the analysis of flows derived from empirical time series data. Both system dynamics and other simulation techniques continue to be employed for other purposes. Among them is the logical-systemic analysis of conceptual constructs, as in Cusack and Stoll's Exploring Realpolitik (1990), in which the assumptions and propositions of the realist tradition are probed by means of computer simulation.
Soft Power, Democratizations, and International versus National Political Systems
- 1.8
- In the case of such a significant example as the analysis of democratization, almost all efforts at explanation are made without reference to global changes. Instead, studies of democratization generally focus on factors at the national or comparative level, i.e., on national level explanatory variables in a number of states. For instance, in empirical political research on why democracy proliferates as a regime type on a world scale (such asLerner 1958, Lipset 1960, 1990, Almond & Verba 1963, Dahl 1971, 1989, 1998, Diamond 1992, Hadenius 1992, Diamond & Plattner eds. 1993, Vanhanen 1997, Inglehart 1997, Przeworski & Limongi 1997, Barro 1999, Boix & Stokes 2003, Welzel et al. 2003, Welzel & Inglehart 2005a, 2005b, Inglehart & Wenzel 2005, Hadenius & Teorell 2005,Teorell & Hadenius 2005), we mostly find interpretations in terms of requisites, correlates, and time-specific factors on the national level. Among these are economic wealth and development, industrialization, urbanization, communication, education, peaceful evolution of political competition, equality, control of the military and the police by elected officials, democratic beliefs and political culture, aspirations to liberty, market economy, literacy, trade, percentages of Protestants, prior regime types, relative distribution of power resources, political actors pursuing democracy, well-being, trust, and social structure. These are all factors working primarily on the national level. Some of them are commonly assessed in nations that are already democracies, rather than among countries that are potential adopters. Therefore, these factors may indicate what is typical for democracies, not the essential preconditions for non-democracies making a transition to democracy. In cases where international influences have already been emphasized in democratization studies, such as Uhlin (1993, 1995), seldom has the whole world system of states been under greater scrutiny. There are a few exceptions, such as Starr (1991), where the "diffusion hypothesis" has been tested empirically over a limited range of years and found valid on the basis of statistical tests. International and historic democracy diffusion is also studied in Huntington (1991), Jaggers and Gurr (1995), Ward et al. (1997), Kurzman (1998), O'Loughlin et al. (1998), Modelski & Perry (2002), Starr & Lindborg (2003), Diamond (2003), Wejnert (2005), Gleditsch & Ward (2006), Leeson and Dean (2009). Wejnert's multilevel regression of national (development) vs. international (diffusion) factors is one impressive exception that concludes:
In both the world and regional analysis, however, the importance of development faded with the inclusion of the diffusion variables due to the diffusion factors' remarkably stronger predictive power for democratic growth than the factors of development (2005: 73).
- 1.9
- Although non-linearity in the diffusion of democracy with regard to democratization pathways is emphasized in works by Rustow (1970), Linz & Stepan (1996), Lane (1996), Cheibub (1999), Rose & Shin (2001), and others, the grand non-linearity of world system dynamics is seldom explained.
- 1.10
- Samuel P. Huntington's The Third Wave (1991) is therefore provocative because the waves of democratization he portrays suggest a non-linearity in regime changes in the world system. Democratization, according to Huntington, is not diffused at a constant pace, but in an undulating pattern, implying larger and larger forward spurts, interrupted by periods of retrograde movements slipping from democracy back into non-democracy. Underlying the cumulative number of democracies in the world each year are undercurrents of entries and exits of democracies and non-democracies among emerging polities, as well as transitions from and to democracy by existing states. Such an understanding of international change is very close to the stock and flow approach in system dynamics referred to above. Huntington analyzes change at the level of the world system of states by means of dynamic, independent, global variables, i.e., those changing over long periods of time among (rather than within) nations.
- 1.11
- Huntington's explanation of the third wave of democratization is based on factors that may be considered global rather than national.[1] These are (1) the deepening legitimacy problems on a world scale among authoritarian systems, (2) global economic growth that has raised living standards, education, and broadened urbanization, (3) the transformation of national Catholic churches from defenders of the status quo to opponents of authoritarianism, (4) the promotion of human rights in the policies of external actors, and (5) snowballing or demonstration effects.
- 1.12
- The last factor, the demonstration effect, is of particular interest from a contingency and systems perspective. First of all, it clearly indicates a dynamic understanding of how most social systems work. Demonstration, imitation, and word-of-mouth effects typify diffusion processes in social systems, mainly because imitation is a means of reducing risk. Doing what others already have done, or are soon likely to do, carries with it the conviction of not losing more in making a new investment than one's rivals can lose. Instead, it is likely that quickly imitating them will lead to advantages and secure access to resources that are likely to diminish in the long run. From our political science perspective, forces of imitation, snowballing, word-of-mouth effect, and diffusion correspond to what Joseph Nye has called soft power. Such soft power, or "getting others to want what you want,"[2] is normally based on the principle of imitating a pioneer one admires. Our focus will be on the soft power of a political regime type, and how it is diffused by imitation.
- 1.13
- Imitation requires communication about what is being imitated. Books, newspapers, radio programs, and television broadcasts have historically enhanced knowledge about political conditions elsewhere, including those prevailing in democracies. Studies of the development of democracy since the 1960s have included communication as a factor in their analyses (Lerner 1958, Lipset 1960, Cutright 1963, Pye ed. 1963, McCrone & Cnudde 1967). The current availability of time series data on both the diffusion of democracy and means of mass communication makes it possible to relate the two in dynamic models. We are coming closer to achieving dynamic models of what were once merely theories of communication and projecting their long-term effect on society.
The Modelski and Perry Study
- 1.14
- The question Modelski & Perry address in their valuable study (2002) is whether the growth in the number of democracies in the world system follows a regular pattern; and, more specifically, whether that pattern is in accord with the Fischer-Pry substitution model of technological change. Modelski & Perry define democracy as a "fundamental social innovation, a new form of social organization, indeed a superior technology of cooperation in large-scale societies" (2002: 360). They argue that democracy evolves both by mechanisms of experimentation and through internal learning, and their investigation focuses on the quantitative diffusion of democratic communities in the world. They ask whether this diffusion describes a pattern of regularity in accordance with the Fischer-Pry equation, thus conforming to one of the models of innovation-diffusion. They answer in the affirmative. They go on to assume that the process of democratization in the world system proceeds as the diffusion of an innovation or a cluster of innovations. The same authors then ask whether democratization, i.e., the diffusion of democratic innovations, is in fact also a learning process. If so, they argue, it should be characterized by logistics (a curve representing a function involving an exponential, but also a limitation factor, shaped like the letter S). This is common to the diffusion of innovation in general, as described, for example, by Rogers (1995), and applied in the present article as well.
- 1.15
- Modelski and Perry continue to ask whether one specific model of diffusion and technological substitution, the Fischer-Pry model, is useful for understanding the shape of the curve of horizontal democratization on a world scale. The Fischer-Pry model is expressed as follows (seeModelski & Perry 2002):
F / (1- F) = exp [2α (t-t0)] where F represents the fraction of substitution (in this case the 'fraction democratic' or the percentage of world population [my emphasis] living in democracies), and 1 stands for the size of the 'market', i.e., the world population. The slope of the curve is 2α, with t standing for time, and t0 for the midpoint of the process, that is, when half of the world's population lives under democracy. A plot on the semi log (ln) scale of F / (1- F) as a function of time then allows for a linear regression.
- 1.16
- Modelski & Perry's results indicate that a 10% saturation of democracy in the world was reached in 1885; that the midpoint (or 50% flex point) occurred in 1999; and that 90% saturation will be achieved around the year 2113. The share of explained variance in ln F / (1- F), namely R2, is then as high as 0.95 in their analysis (2002).
- 1.17
- Modelski & Perry then argue that, since the cumulative world population living in democratic communities can be described in terms of such a logistic S-shaped distribution (which, in a semi-logarithmic scale, would appear as a straight line,) then the democratization of states in the world system can, in fact, be argued to be a social learning process that is identical to a process of democratic innovation and diffusion. Therefore, such social learning and diffusion models generally also produce the same type of distribution. However, looking at their data, the patterns of diffusion of democracy among fractions of populations in their analysis (and among democratic regimes in the present analysis) are very similar. The regression line produced by using frequencies of democratic regimes, rather than the fraction democratic of world populations, has an even better fit (an R2 = 0.93 rather than 'only' 0.91). Polities seem to follow a log-linear pattern somewhat closer to the learning assumption than does the fraction democratic of populations, even though the difference is miniscule. We may conclude that democratization may best be studied at the polity, rather than the population, level.[3] The comparison between population and polity level regression leads to the conclusion that diffusion of democracy on an aggregate international level is easier to predict than learning or diffusion of democracy at the national (as opposed to the population) level. It can also be argued that learning equals diffusion of knowledge-in this case, ways to institutionalize democracy.
Data and Method
-
The Use of Polity IV and IVd Data on "Institutionalized Democracy"
- 2.1
- Along with Modelski & Perry (2002), Polity IV data, as well as the specific Polity IVd data set (a condensed version with only those years included in which a regime variable changes), will be employed. Drawing on these unique data we can study the growth in the number of democracies and non-democracies, and see how the total number of polities have changed since 1800 (Figure 1).
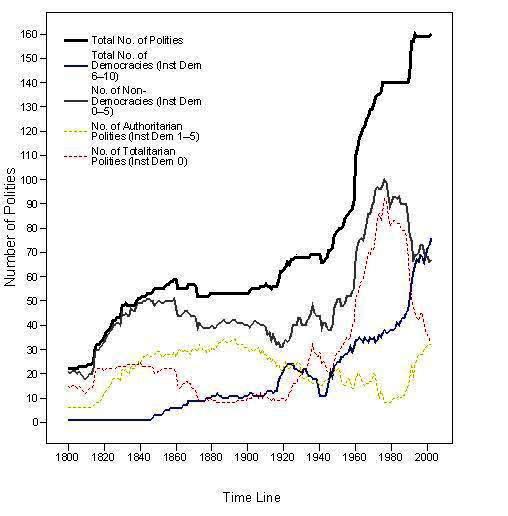
Figure 1. Polity Population Dynamics 1800-2000: Democratic, Authoritarian and Totalitarian States (Source: Polity IV data).
Note: Figures in parentheses indicate how polities are defined in terms of their value as an institutionalized democracy variable in the Polity IV data set: totalitarian states have a value of 0, authoritarian have 1-5, and non-democracies have 0-5, including totalitarian and authoritarian components. Values of democracies are 6-10. (See creation of the variable in Table 1 and comments in the text.) - 2.2
- Data show aggregate levels of three populations of polities (democracies, authoritarian, and totalitarian states) for each year from 1800 to 2000. The data used in this figure is based on the Polity IV regime panel data set in which, beginning in 1800, all countries with a population larger than 500,000 are coded annually according to an array of institutional variables (one of which is "institutionalized democracy"). This variable is expressed on an 11 point scale (0-10) where, following the Modelski & Perry study (2002), a score of 6 or more is defined as "democracy". Marshall & Jaggers (2002) define the Polity IV variable "institutionalized democracy" as consisting of three interdependent elements: (1) the presence of institutions and procedures through which citizens can express effective preferences about alternative policies and leaders, (2) the existence of institutionalized constraints on the exercise of power by the executive, and (3) the guarantee of civil liberties to all citizens in daily life and acts of political participation. Other aspects of pluralistic democracy, such as the rule of law, a system of checks and balances, and freedom of the press, among others, are considered means toward, or specific manifestations of, these general principles.
- 2.3
- The institutionalized democracy indicator is an additive scale derived from the weighted coding of four variables: (a) competitiveness of executive recruitment, (b) openness of executive recruitment, (c) constraints on the chief executive, and (d) competitiveness of political participation (Table 1).
Table 1: Polity IV Variables and Weights in Coding of Institutionalized Democracy (Source: Marshall and Jaggers, 2002, p. 14) Authority Coding Scale Weight
Competitiveness of Executive Recruitment:(3) Election +2 (2) Transitional +1
Openness of Executive Recruitment:(3) Dual/election +1 (4) Election +1
Constraints on Chief Executive:(7) Executive parity or subordination: +4 (6) Intermediate category +3 (5) Substantial limitations +2 (4) Intermediate category +1
Competitiveness of Political Participation:(5) Competitive +3 (4) Transitional +2 (3) Factional +1 - 2.4
- The highest value (10) is achieved on the scale (a) if "competitiveness of executive recruitment" is "election" (+2), "openness of executive recruitment" is "dual/election" or "election" (+1), "constraints on the chief executive" is "executive parity or subordination" (+4), and "competitiveness of political participation" is "competitive" (+3). If none of the levels listed are reached, the sum total is then zero (which in this study is defined as totalitarianism, since all the institutions of democracy are lacking). In addition to following Modelski & Perry (2002) in defining the minimum value of institutionalized democracy as 6, we will consider all polities with values from 1 to 5 as "authoritarian".
- 2.5
- The above definition of institutionalized democracy and the operationalization of democracy is open to criticism on various grounds. The reason it is employed here is primarily technical and comparative: (a) it is the only operational definition offered for the single dataset available, and (b) it is also the one used by Modelski & Perry (2002).[4] Space does not permit a comprehensive listing of all the institutional democracies in the world (see the listing in Appendix 1 and the country-by-country case description on the Polity Project home page[5]). Nevertheless, the aforementioned listing appears to support one of the major findings of this investigation: the tendency to imitate or adopt democratic institutions from other countries, i.e., the soft power of democracy as a regime type where information about these democracies is accessible.
Early Democratizers
- 2.6
- The institutionalized democracy indicator concludes that in 1800 there was one institutionalized democracy in the world system of polities, the USA, with the score of 7. The next institutionalized democracy to appear is Peru in 1828, with a score of 6 (reflecting the liberal constitution adopted in that year). The third institutionalized democracy using this indicator is the United Kingdom in 1837, with a score of 6 (probably in consequence of the transformation of the sovereign to a ceremonial role when Victoria ascended the throne). From 1847 to 1854, Liberia, France, Switzerland, and Belgium reach 6 or more on the institutionalized democracy scale. In Liberia's case, this reflects the adoption of a constitution emulating that of the United States by the oldest independent state in Africa. For France, male suffrage and political reform were the result of the uprising of 1848. The same year marks the inception of political stability in Switzerland, and by 1853 the Belgian regime is considered to be institutionally democratized. In 1854, under the so-called Bloemfontein Convention, local Boer settlers formed the independent Orange Free State. The political structure of this new state combined traditional Boer institutions with Dutch and American constitutional theory. After becoming a self-governed crown colony in 1857, New Zealand was considered an institutionalized democracy. In 1864, the liberal Venizélos in Greece, after a landslide victory in the elections, instituted a wide-ranging program of constitutional reform for political modernization. At a conference in Quebec, Canada, in 1864, an agreement was reached on a general federal union. This marks the inaugural year of democracy in Canada. In the same year, Mosquera, who had once ruled Columbia as a dictator, received another two-year term as president under that country's new liberal constitution. Other examples might be cited. These countries are the early pioneers of institutionalized democracy, as defined in Table 1 and listed in Appendix 1.
Waves of Democracy Diffusion
- 2.7
- It may be noted that what is generally considered the first wave in Figure 1 looks rather like two waves, with the second starting around 1915 and expanding until it reaches a peak at the beginning of the 1920s. The countries involved are primarily from Northern, Central, and Eastern Europe: Denmark (1915), Estonia, Finland, Sweden (1917), Czechoslovakia, Lithuania, Poland (1918), Germany (1919), and Austria and Latvia (1920). The wave from the mid-1940s to approximately the early 1970s includes a large number of former colonies, such as Guatemala (1944), Brazil, Burma (or Myanmar), Sri Lanka (1946), and India (1949), along with re-democratizing polities as well, such as Austria, France (1946), and Italy (1948). Dramatic increases in the number of democracies are also noted for the early 1990s. Not only have previously socialist and post-Soviet republics such as Armenia, Belarus, Estonia, Latvia, Lithuania, Macedonia, Poland, Slovenia, and Ukraine (1991) now democratized, but also Benin, Zambia (1991), Congo Brazzaville, Guyana, Madagascar, Mali, Niger, Paraguay, and Peru (1992). No wave is easily classified in geographic or historic terms (see Appendices 1 and 2.)
- 2.8
- Upon more closely examining the number of democracies, the dynamics of the world system of states becomes evident in the way totalitarian states (defined as 0 on the "institutionalized democracy" variable) relate to authoritarian ones (defined as scoring 1-5 on the same variable). We see totalitarianism making gains from the early 1900s until about 1980, then declining rapidly-primarily in consequence of the fall of the Soviet empire, together with most of its Eastern and Central European satellites. However, these states not only adopt democracy, but at a later point some also feed back into the stock of authoritarian states. More recent figures (2000-2003) show that we now have as many authoritarian as we do totalitarian states. In addition, we can see that the number of democracies is approximately the same as the sum total of authoritarian and totalitarian states combined. But which stocks of democracies and non-democracies are involved, and what flows there are between them, cannot be detected using these aggregate figures. Despite our interest in transitions to democracy over the last two centuries and the increased stock of democracies that have resulted, we still cannot grasp the underlying polity population dynamics. We somehow need to separate the flows, while at the same time analyzing them, so that we know exactly how many states transition from non-democracies to democracies each year and vice versa-and why.
- 2.9
- Separate flows in the system of states between the stocks of non-democracies and democracies are not easily grasped by means of statistics. Related time series data are difficult to model in their dynamic (i.e., time-varying) influence upon each other.[6] Therefore, the approach taken here is to use software capable of analyzing flows between stocks. The Polity IV regime panel data is coded into a system dynamics simulation or stock-and-flow model (in this case, using Powersim software[7]). Compared with most system dynamics simulations, the modeling in this study, in its original form, uses real regime panel data (Polity IVd). Only in a subsequent step is one of the flows of this real data model of the world's stocks of democracies and non-democracies simulated, along with the flows or transitions between them (i.e., the flow of transitions from non-democracy to democracy).
- 2.10
- The fact that we use a statically defined measurement for democracy, that is, a single standard for the whole period, will in no way contradict the dynamic and non-linear assessment and analysis of democracy proposed here. On the contrary, a dynamic analysis requires static scales to measure the dynamics. Even if we define democracy here in the simplest possible way (as ≥ 6 on the institutionalized democracy scale), the analysis may well be extended by studying the diffusion of other new forms and interactions of evolving democratic institutions.
- 2.11
- Finally, we will employ Banks Cross-National Time-Series Data on mass communication, specifically, the number of radios and television sets (per capita values of radios and television sets are national means) each year of the twentieth century, as a basis for estimating two major components of communicating experiences of democracy with non-democracies. Banks data are the most commonly used source for a diverse set of historic variables that include communication. We do realize, however, that unfortunately communication time series data is lacking for most other components of communications between the two types of polities during the period investigated here.
Using Real Data in a System Dynamics Simulation Approach
- 2.12
- The flows we are suggesting here consist of global streams of national democratizations, together with the underlying processes that affect net democratization figures worldwide. Thus, as noted above, emergences or entry events ("births") and exits or disappearance events ("deaths") of institutionalized non-democracies and democracies are included, as well as the flows of states into democracies and drifts back to non-democracies ("transitions" and "reversals").
- 2.13
- By including entries and exits of non-democracies and democracies, and the transitions in both directions between the two kinds of regimes, the basic Bass model, interpreted in a generalized way, defines the possible changes in the population system of global democratization. However, determination of the global system of states leaves no room for probabilities.
- 2.14
- Models of change should be applicable to change of any kind. Thus, the transitions between two states in a population of entities, such as the existence or non-existence of democracy or any other political institution (e.g., female suffrage, the rule of law, or a proportional election system) should also be capable of simulation and analysis. The model presented here can be applied for all social change between any dichotomous states A and B among n units.
- 2.15
- The methodology we propose is based on empirical data, although a simulation program is employed to process that data dynamically. First, a real-world replica of democratization over the last two centuries is formulated as a system dynamics model filled with regime panel data. Several flows can then be analyzed separately or simultaneously. These flows are the entries, exits, and transitions of non-democracies and democracies already mentioned. Data are extracted from Polity IVd data (see Appendices 1 and 2). Second, one element of this model (in this case the flow from non-democracies to democracies) is exchanged with an "empty" and as yet undefined flow determined by variables and constants, all of which reflect the known Bass with discards diffusion model. After having defined the proposed variables and constants, a simulation of this particular segment of the model (which is otherwise based on real data) will produce a behavior similar or identical to the previously-known actual behavior, thus indicating a dynamic explanation of why democracy is diffused on a world scale.
The Bass Model
-
The Analogy with the Bass Model with Discards
- 3.1
- One of the techniques that can help political scientists use systems analyses is the system dynamics approach. In its thinking and in the application of simulation tools from this perspective, innovation diffusion has been modeled in a variety of ways-perhaps most notably as 'Bass models' with their variations. The inventor of these models, Frank Bass (1926-2006), who was a marketing professor at the University of Texas at Dallas, originally published his model in Management Science in 1969. Some of the largest U.S. corporations have used the Bass model, and many business schools have applied it to diffusion studies of technical and social innovations, such as the diffusion of educational ideas, VCRs, color TV, PCs, answering machines, overhead projectors, and similar items (Rogers 1995 and the Frank M. Bass homepage). Extensions of the model have also been made into studies of successive generation technologies (Norton & Bass 1987). However, there is no indication that the diffusion of the Bass model (Bass 2004) has reached the realm of democratization analysis until now.
- 3.2
- What is, then, the Bass model in its system dynamics form (Sterman 2000)? It assumes that two fundamental forces or communication channels (marketing on the one hand and interpersonal word-of-mouth on the other) influence potential adopters of an innovation (see figure below). Individual adoption of new products as a result of marketing or advertising occurs continually throughout the diffusion process, but is concentrated in the relatively early stages of diffusion. Individuals adopting innovations as a result of interpersonal messages about the product (i.e., as an effect of its 'soft power') expand in number during the first half of the diffusion process and decline thereafter creating the typical logistic, S-shaped diffusion curve. One unique contribution of the Bass model is that it is predictive, providing a formula for estimating the rate of adoption in advance (Rogers 1995).
- 3.3
- In our analysis we use Sterman's Bass model with discards (2000), since it provides an analogy with democracy as innovation (as we will see in detail below), and includes discards as an analogy with reversals into non-democratic institutions, thus providing for potential adoptions of new versions of democracy.
- 3.4
- In system dynamics simulations, change is analyzed in terms of (a) flows between states or conditions, and (b) factors affecting those flows, whether they are variables or constants. In diagrams of models and their behavior, flows are depicted as pipes, and states and conditions as boxes. Flows are affected or regulated by means of 'valves' that are dynamically or statically determined by variables (circles) or constants (diamonds). The system dynamics models are totally determined mathematically and yield dynamics in numbers of units in a specific state at a given point in time. The model itself, however, remains unchanged during the simulation, in contrast to evolutionary and agent-based simulation models (see Gilbert & Troitzsch 2005).
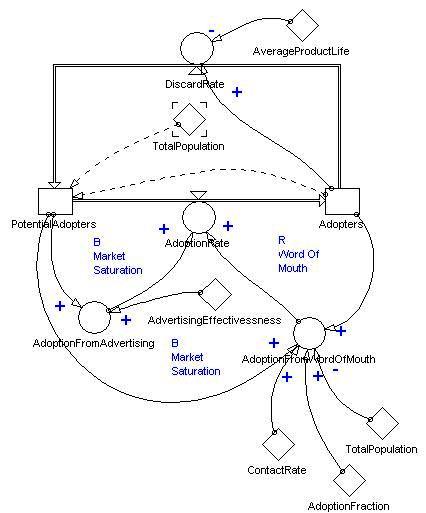
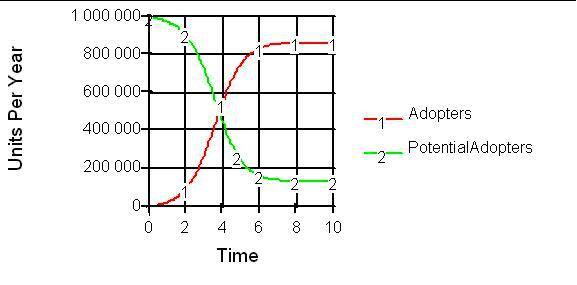
Figure 2. Bass Diffusion Model with Discards (Source:Sterman 2000) Note: Double arrows denote flows from and to stocks of adopters and potential adopters of product A. Boxes indicate stocks (volumes of adopters or potential adopters), while single arrows indicate influence exerted by variables (circles) and constants (angled squares) on other variables. As seen in attached diagrams, levels and variables can both be dynamically described. R indicates (1) reinforcing loops (the more adoption of A, the more adoption from word-of-mouth, the higher the adoption rate, the more adoption of A, etc.), and B (2) balancing loops (the more adoption from advertising, the higher the adoption rate, the fewer potential adopters, the lower adoption from advertising, the lower the adoption rate, etc.). Notice in the lower diagram the minor contribution of adoption from advertising in relation to adoption from word-of-mouth.
- 3.5
- The Bass model with discards (or 'BassDisc' model) in the figure above displays the analogy between diffusion of innovations and diffusion of democracy. In this model, there is a flow from potential adopters to actual adopters of an innovation (in our case, the regime innovation 'democracy' among potential adopter nations). This flow - our focus variable - is driven both by advertising (democratic propaganda) and word-of-mouth (communicated experiences of democracy). The BassDisc model has a reversal discard rate that, in this analogy, indicates the reversal of democracy among states back into non-democracy. Each of the flows and their determinants require detailed scrutiny as valid parts of an analogy with democracy diffusion in the world. However, this first model lacks the in- and out-flows of potential adopters (non-democracies) and actual adopters (democracies) and is simplified on the assumption of a constant number of actors in the system.
- 3.6
- Therefore, defined in the form of an equation, the adoption (of democracy) rate could simply be expressed as:
AdoptionRate = AdoptionFromAdvertising + AdoptionFromWord-of-Mouth The analogy: Each year, the number of polities reaching a value of at least 6 on the 'institutionalized democracy' variable in the Polity IV data set equals the number reaching this value as an effect of 'marketing' or 'advertising' of democratic ideas in non-democracies (such as by parties and politicians from both non-democracies and democracies), plus the number reaching this value as an effect of transition resulting from word-of-mouth reports about democracies, i.e., positive communicated experiences or 'the soft power' of democracy. The equation for the later analogical democracy diffusion model is:
TransitionToDemocracySim = TransitionFromDemocraticIdeas + TransitionFromSoftPowerOfDemocracy In this first equation, the sum of transitions to democracy as a rate of polities transformed per time unit equals the sum of transitions resulting from propaganda disseminated by political actors in non-democracies and democracies, plus those transitions resulting from the soft power of democracy.
- 3.7
- In the first place, there might appear to be fundamental differences between the BassDisc model and a democracy diffusion model: 'advertising' of a product for sale in a market is not a concept normally used in the analysis of the spread of democracy. However, looking closer at the mechanism from the perspective of the proposed analogy, it seems apparent that spokespersons of democratic parties 'advertise' democracy (or a particular type of democracy) in books, articles, speeches, party propaganda, statements, policies, and diplomacy. In recent decades, as mass media has become increasingly globalized, the ability of democratic governments to effectively pursue their policies is intrinsically linked to their ability to get across their message in mass media, notably TV channels such as CNN. The impact of this type of political campaigning may differ. Thus, in analogy with the BassDisc model:
AdoptionFromAdvertising = PotentialAdopters * AdvertisingEffectivessness The analogy: The yearly number of non-democracies adopting democracy attributable to the political 'advertising' of democratic ideas in non-democracies equals the product of the number of non-democracies and the effectiveness with which positive messages are communicated. The analogous equation may be formulated as:
TransFromDemIdeas = NondemocraciesSim * CommunicationEffectivessness - 3.8
- Thus, the rate of adoption of democracy as projected by this model is the result of political 'advertising' of democratic ideas and ideals by democracies themselves. This political 'advertising' in the global marketplace of democracies may be more or less effective, and in the BassDisc model above, the effectiveness is assumed to be constant (although this, too, can be modified in a democratization model). In the lower diagram of the figure above, one can see that adoption from advertising is important in the initial diffusion phase, while adoption from word-of-mouth subsequently grows very rapidly until the system's carrying capacity of potential adopters is reached.
- 3.9
- The adoption rate, on the other hand, is determined analytically by the sum of two other functions: the loops of 'word-of-mouth' and market saturation. In the market-driven Bass model, the adoption from word-of-mouth is the most important in the long run (see the figure's lower diagram, curve 1). At first, adoptions from word-of-mouth (due to the attractiveness or soft power of the innovation) are zero and thus lower than adoption from advertising. However, as the number of adopters grows, the adoption from word-of-mouth accelerates. The reason for this may be seen in the following equation:
AdoptionFromWord-of-Mouth = Adopters * PotentialAdopters * ContactRate * AdoptionFraction / TotalPopulation The Analogy: The number of adoptions of democracy each year among states in the world system equals the number of democracies times the number of non-democracies times the rate by which contacts are made between non-democracies and democracies (communicating positive experiences of democracy) and the fraction of those states that become democracies as a result of that contact, divided by the number of states in the world system that year. The equation becomes:
TransFromSoftPowerOfDem = DemocraciesSim * NondemocraciesSim * CommunicationRate * TransitionFraction / TotalNoOfStatesSim - 3.10
- Though this is not a definition of soft power, it is an equation that defines the factors that produce transitions to democracy from soft power. Soft power is driven by (a) the communication rate (communications per unit of time) between potential adopters and actual adopters, and (b) the fraction of times (percentages of the contacts) such interactions result in adoption per population unit. In the first model, these two factors are defined as constants; however, they will play important roles in the further elaboration of the model.
- 3.11
- The soft power or word-of-mouth effect is small if the number of democracies or non-democracies is small, but grows in importance as the number of adopters relative to the number of potential adopters is close, since the product of the two is largest when they are equal. When the number of potential and actual adopters are equal (i.e., when curves 1 and 2 cross each other in the upper diagram in the figure), the soft power or adoption from word-of-mouth is strong, as it is close to its peak. As soon as there are more adopters-thus less potential adopters-the product of the two decreases. This is why the loop reinforces itself at first, but flattens out towards the end: the more adopters of democracy, the more additional adoptions, but decreasingly so when democracy approaches the carrying capacity of the world system of states. Therefore, as will be noticed in the analysis below, the soft power of democracy is extremely strong around the time the number of democracies is close to or equals the number of non-democracies (something that occurred in the year 1991, since in 1992 the number of democracies was 78, which is 11 more than the non-democracies).
- 3.12
- Finally, the discard rate in the BassDisc model is determined by the average 'product lifetime', which in our case is the average lifetime of a type of democratic regime. It can be described as:
DiscardRate = Adopters / AverageProductLife The analogy: The number of democracies abandoning democracy each year equals the number of democracies at the time divided by the average lifetime of democracies for that year. The equation would appear in analogy as:
ReversalsFromDemRates = DemocraciesSim / AverageDemLife However, since the model is based on real data, the 'discard rate' would be here defined as the values of actual Polity IVd data on reversals from democracy to non-democracy each year (see Appendix 1 and 3).
- 3.13
- The equation above can be understood as the reversal rate from democracy to non-democracy. In this case it is described mathematically, rather than analytically. The equation does not actually explain the discard rate; it defines it. The discard or reversal from democracy rate is simply determined mathematically by two factors, namely, how many adopters of democracy there are divided by the average product lifetime each year (in this case, the longevity of democracy). The more democracies there are and the shorter their life spans, the higher the discard (reversal) rate. This flow will not be simulated in the present article, since the actual data on reversals can be extracted from the Polity IVd data set (see Appendix 1 and how it is incorporated in the equations in Appendix 3). It may be noted that the average lifetime will probably not increase in the younger democracies, due to the fact that the first democratizers were those with the most favorable conditions for democracy at the time of its adoption, while later democratizers may often lack the solid preconditions the pioneers had.
- 3.14
- It is also useful to note the analogy between the Bass model and the so-called SIR models in epidemiology. SIR is an acronym for Susceptible, Infected, and Recovered. 'Susceptible' signifies the potential adopters, 'infected' the adopters, and 'recovered' those who discard the innovation. We see that the global diffusion of democracy can be likened to a global 'epidemic' in which non-democracies are 'susceptible' to democracy, democracies are 'infected', and those countries that have abandoned democracy are 'recovered' (see Åberg & Sandberg 2003, chap. 1, on the theory of institutional evolution). The same mathematical calculations would apply. The reason epidemics and the diffusion of technological and social innovations exhibit similar patterns remains a challenge for the natural and social sciences to explain.
Using System Dynamics Simulation for the Empirical Analysis of Democracy Diffusion
- 3.15
- The Polity IVd data set, in contrast to the full Polity IV version, includes only those events in which the institutional set-up has changed, making it easier to extract events where polities changed from ≤5 to ≥6 on the institutionalized democracy variable (see Figure 1). Polity IV is only needed when comparing quantities of polities. Therefore, in the simulations below, the Polity IVd set has been used to extract those polities that emerge ("are born") and disappear ("die") as non-democratic or democratic polities, in addition to cases in which existing polities are democratizing or reverting to non-democracies (see Appendices 1 and 2). On the other hand, the variable "totalitarian percentage of non-democratic states", is derived from the full Polity IV set. It should be emphasized that the model may be elaborated by including additional transitions between values of the variable "institutionalized democracy". This would, however, also complicate the construction of the model and its interpretation.
- 3.16
- Although the method is based on system dynamics simulation techniques, the model is first filled with "real" (Polity IVd) data. The flow system defined using the simulation program appears in Figure 3.
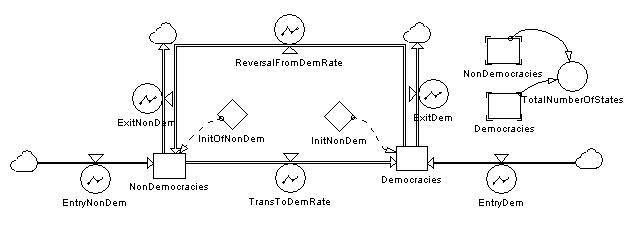
Figure 3. A Simple Stock and Flow Model of Diffusion of Institutionalized Democracy in the World System of States 1800-2000 Note: Structure of stock and flow diagram is analogous to the Bass model as defined by Sterman (2000). Stocks of non-democracies, democracies, and flows (rates) are defined in correspondence with data sets Polity IV and IVd. Init. of non-democracies (n = 21) and democracies (n = 1) are constants denoting initial number in 1800. See data in Appendices 1 and 2.
Democracies = + dt * EntryDem - dt * Exit_Dem - dt * ReversalFromDemRate + dt * ActualTransToDemRate
NonDemocracies = - dt * ExitNonDem + dt * EntryNonDem + dt * ReversalFromDemRate - dt * ActualTransToDemRate - 3.17
- The two boxes labeled "non-democracies" and "democracies" are defined in system dynamics terminology as "levels", i.e., volumes of each time unit, while the "pipes" to and from them are "flows" determined by "valves" consisting of rates of transition per year. There are two constants in the model, indicated by angled squares: the initial number of democracies in 1800 (one polity, i.e., the US), and the initial number of non-democracies in the same year (21 states, see Appendix 1). On the basis of a Polity IVd data set, the years for transitions to democracy and reversals to non-democracy are coded, along with the number of polities emerging or disappearing each year as democracies and non-democracies. Our focus variable, transitions to democracy in number of polities per year from 1800 to 2000, can then be described in graphic form (Figure 4).
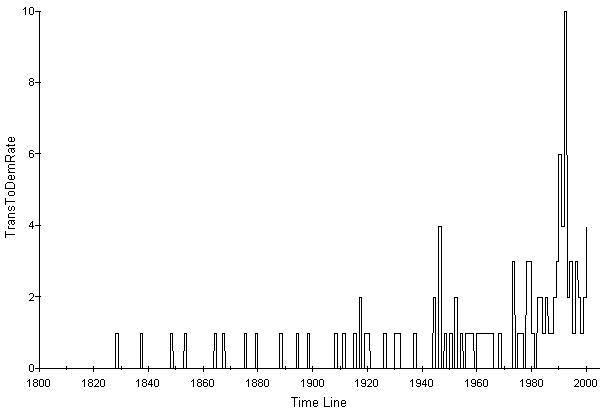
Figure 4. Transitions to Democracies 1800-2000 (Number of Polities per Year) (Source: Polity IVd)
Note: See Appendix 1 for details on polity transitions to democracy. - 3.18
- Figure 4 illustrates what is provided in table form in the last column of Appendix 1: the number of transitions from non-democracies to democracies each year. The next step in the analysis is to exploit the fact that inflows and outflows to and from non-democracies and democracies can now be separated analytically into (a) transitions and reversals, and (b) entries and exits of non-democracies and democracies. For instance, we can see that transitions to democracy (number of non-democratic polities becoming democratic per year) increased after World War I and again after World War II, and then accelerated at the end of the 1980s with the fall of the Berlin Wall.
- 3.19
- We thus arrive at the first major advantage of the real data simulation approach advocated here: our causal analysis can concentrate on the separate processes of transitions to and reversals from democracy without having to combine them in gross flows. Reversals into non-democracies are less frequent (as can be seen in Appendix 1). Entries and exits of non-democracies and democracies also reflect valuable state and nation-state building patterns, the treatment of which is beyond the scope of the present investigation (see their frequencies in Appendix 2). Therefore, the fact that regime entry ("birth"), regime exit ("death"), democratization, and what we may term "de-democratization" can be outcomes of wars, invasions, violence, and aid are not considered here. For our purposes, they only represent alternate ways in which regimes emerge or disappear, transform into democracies, or undergo reversals into non-democracies. Wars between sovereign states and invasions are also phenomena on an international, rather than global, system level. The system modeled with real data is then used as the point of departure for a replicated model in which transitions from non-democracies to democracies are simulated.
- 3.20
- The present article, in focusing on transitions to democracies, analyzes them by means of simulations apart from other transitions in the model. A duplicate of the model is thus created and modified in two steps. First, the real-data transition to democracy flow is replaced by employing an empty flow. Second, this flow is determined by the factors defined above (analogous to the Bass model with discards in Figure 3). (Copied variables are indicated by the suffix "copy".)
- 3.21
- At this point, we can analyze the extent to which transitions to democracy are actually determined by entries, exits of democracies and nondemocracies. The "advertising" of democracy by means of democratic ideas, in combination with transitions prompted by accounts of existing democracies, are given and defined by the Bass model. As discussed earlier, transitions attributed to democratic ideas are conditioned by the effectiveness of communications, while transitions due to the soft power of democracy are affected by the communication rate and the transition fraction (see Figure 5). In fact, the Bass model is largely analogous to the two-step hypothesis in classical communication theory (Katz & Lazarsfeld 1955), in which step one refers to direct influences (Bass's effects prompted by advertising) and step two to indirect influences from opinion leaders (Bass's effects prompted by word-of-mouth).
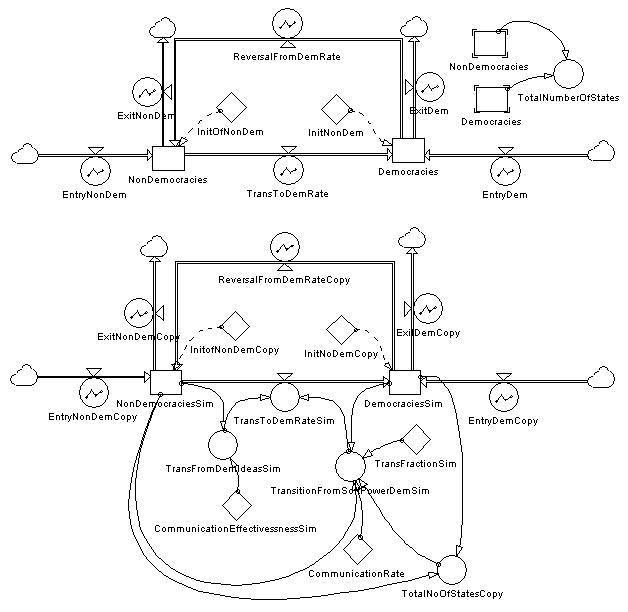
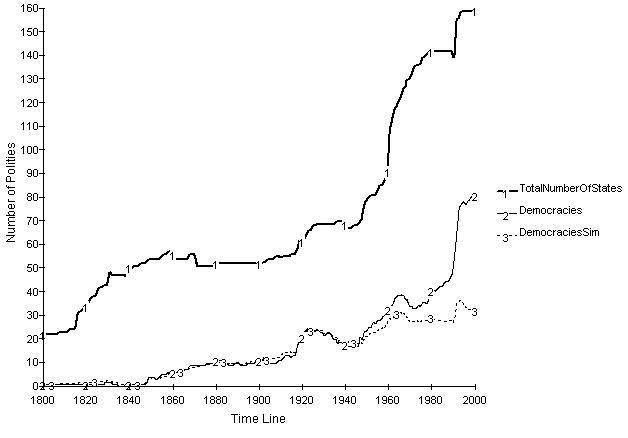
Figure 5. First Standard Bass (with Discards) Model of Democratization in the World System (Source: Polity IVd) - 3.22
- From this initial simulation of transition to democracy[8] (see Figure 5), we can see clearly that much of the raggedness in the true democracy diffusion curve is due simply to the entry and exit rates of non-democracies and democracies and the reversals from democracy rates. The simulated democracy diffusion curve is striking in its similarity to the real curve, but less exponential for the period beginning about 1950.
Assumptions and Implications of the first Standard Bass Model Simulation
- 3.23
- In this model that incorporates real data, the communication effectiveness of democratic "propaganda" in non-democracies is considered a constant. It must be set to a very small figure (0.0005) in order not to produce a curve that increases too much in the early 1800s: as noted before, it is in this initial diffusion phase that the "advertising" factor plays a role. The communication effectiveness has to increase drastically from 0.0005 for the period from 1800 to 1980 and reach approximately 0.4 by 2000, without changing other parameters, in order to produce the number of democracies we know to be correct. This explosion of communication effectiveness in non-democracies over the last twenty years of the twentieth century does not seem likely, although it may be a partial truth over the short run. Democratic forces in the former Soviet bloc probably found spreading propaganda easier because of glasnost and the relaxed control of the opposition under Gorbachev, which in turn may have caused a sudden increase in the effectiveness of communicating the virtues of democracy. This also implies that, given what we know from the real data diffusion curve, the communication effectiveness of democratic forces in non-democracies was very small, especially during the first years of democracy. Thus, it appears that democratic parties in non-democracies had little impact on democratization on a global scale. Were this not the case, we would have already had a much sharper increase in the numbers of democracies in the early 1800s. Therefore, transition rates caused by democratic ideas in non-democratic countries can be considered insignificant, as a quick glance at the diffusion curve will show. Causes of diffusion must be sought elsewhere. Taking a longer view of the two centuries from 1800 to 2000, a transition to democracy is most likely the result of the international communication of what it is like to experience democracy -what can be called the "soft power" of democracy, by analogy with the word-of-mouth effect in the Bass model.
- 3.24
- Thus, there must be another, much stronger force that has boosted the diffusion of democracy in the global system since the latter half of the nineteenth century. To speak in terms of the Bass model, this is the word-of-mouth effect-what Nye refers to as soft power in the case of early democracies or, to use Huntington's term, "snowballing". The strong influence on the transition rate produced by internationally communicated democratic experiences equalsthe product of the number of democracies, number of non-democracies, communication rate, and fraction of polities that transition into democracy as a result of such communication, divided by the number of states.
- 3.25
- In this first test of the Bass model, the communication rate and transition fraction must be set to small values (1.5 and 0.015). Theoretically, this would mean that the experience of democracy is communicated to all non-democracies on an average of 1.5 times a year, but that in only 1.5% of those instances do non-democracies actually become democracies. Thus, the experience of success in one country may in very few cases trigger democratization in another. The increase in soft power has its peak in influencing transitions to democracy when the numbers of non-democracies and democracies are equal (a point reached at some time in 1991).
- 3.26
- The rate of communication and the percentage of countries that became democratized as a result of these communications are two additional factors determining transitions attributable to democratic experience. In this first simulation model (Figure 5) the factors mentioned are all constants, having the same value each year from 1800 to 2000. The total number of states (TotalNoOfStatesSim = DemocraciesSim + NonDemocraciesSim) must also be simulated in order to include it each year as a variable in the equation. According to the new model we have two variables available to explain the pattern of the transitions to democracies due to democratic experience: the CommunicationRate and the TransitionFraction. The communication rate expresses how often active adopters of democracy communicate politically with potential adopters. The value of the communication rate for the initial mode simply means that each year, from 1800 to 2000, actors in every democratic polity communicated with a number of actors in non-democratic countries in a way that transmitted their experience of democracy. Such international communications may be facilitated by political philosophers, diplomats, journalists, or by such mass media as radio, TV, globalized broadcasting, cell phones, and the Internet. The fraction of communications that actually lead to democratization rates probably also vary over time. In our case, data from the Banks Time Series will be used to elaborate the estimate of communication rates.
The Elaborated Bass Model
-
Elaboration of the Model
- 4.1
- The model in Figure 5 produced a simulation of actual transitions to democracy. This simulation followed real data raggedness in the curve of transitions to democracy, but failed to boost transition figures over the last fifty years. As we noted, actual data suggest a pattern closer to an exponential function after about 1950. Following World War II, during the Cold War years, and after the fall of the Berlin Wall, there seem to have been other forces at work altering communication rates between nation states.
- 4.2
- One could assume an increase in communication rates as a logistic function, just as in any diffusion process (Bass 1969,Rogers 1995). However, the use of actual data to the greatest extent possible is preferable. Therefore, Banks Times series data on the number of radios and television sets across the globe have been employed as a proxy or indicator for overall communication about political, as well as everyday, life in democracies-specifically, the annual global averages of the national averages in per capita values in non-democracies, as defined by the Polity IV data set. However, since newspaper data from the nineteenth century are not very reliable, a base value has been introduced instead, to which the global national averages of radios and (later) television sets in non-democracies have been added (see Figures 6 and 7). The communication rate is estimated on the assumption that new technologies provide possibilities for that rate to increase non-linearly, both because innovations normally diffuse logistically, and because transitions into democracies affect the average per capital values of communication in the stock of non-democracies left after such transitions. As is seen in Figure 7, the resulting curves exhibit a reverse wave in the late 1970s as a consequence of transitions of countries with high per capita values of communication into democracies. One also notes that, contrary to what is traditional in democracy diffusion studies, communication in non-democracies (rather than democracies) is used as a time-series variable to model transitions to democracy.
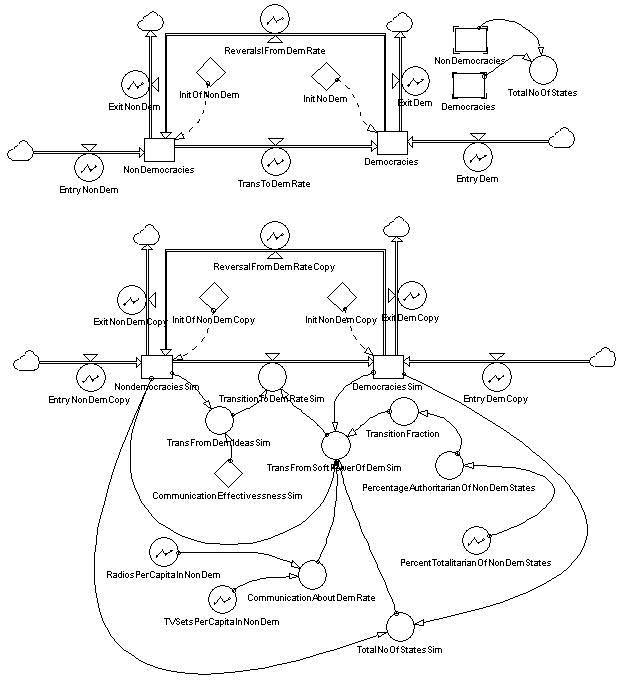
Figure 6. The Elaborated Bass Model of Democracy Diffusion 1800-2000 (Source: Polity IVd and Databanks International. Banks Cross-National Time-Series Data Archive) Note: Lower model is a copy of upper, except that actual transitions to democracy (TransToDemRate) are replaced by a simulated flow (TransitionToDemRateSim). This is determined by factors analogous to Bass with discards model, as further elaborated using data sources below (see text).
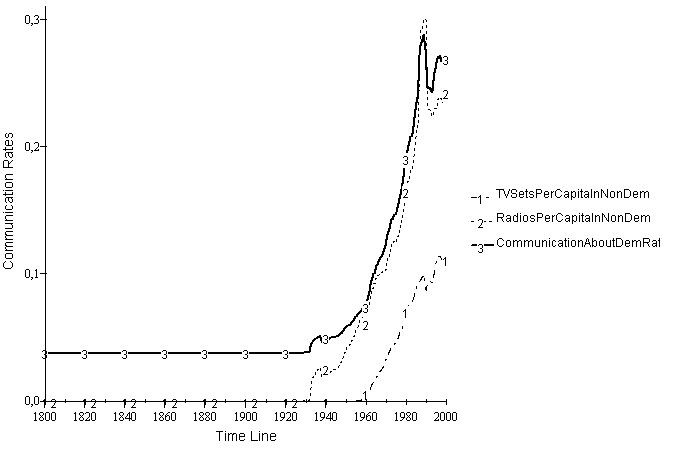
Figure 7. The Global Communication Rates About Democracy in Non-Democracies 1800-2000
Source: Databanks International. Banks Cross-National Time-Series Data Archive.
Per Capita values of radios and television sets are yearly means of national means in non-democracies as defined by the Polity IV data set (see definitions in Figure 1, Table 1, and list of countries in Appendix 1).CommunicationAboutDemRate equation defined as 0.0380 + (RadiosPerCapitaInNonDem / 2) + TVSetsPerCapitaInNonDem.
Thus, radios are considered as having half the effect of TV sets on communication rates. - 4.3
- The transition fraction is not constant over time, as in the case of the simple Bass models considered earlier. The transition fraction is defined as the number of times a communication event between an active and a potential adopter of democracy results in the adoption of democracy, and may change over time. Thus, transitions to democracy resulting from word-of-mouth, i.e., the soft power of democracy, not only depend on how many non-democracies and democracies there are, and how much they communicate, but also on the transition fraction or the fraction of communications that transforms the attractiveness of democracy into actual steps taken towards it by non-democracies. This transition fraction has undergone change over time as some regimes are more receptive to the soft power of democracy than others. Totalitarian regimes can be considered "immune" to it, since they are closed societies and lack any of the critical democratic institutions listed in Table 1.
Figure 8.
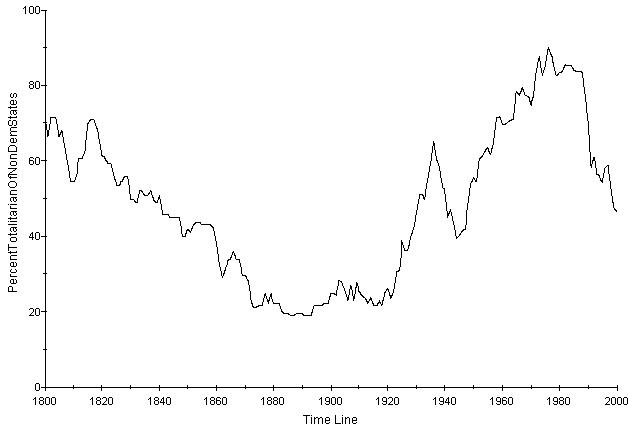
Figure 8. Percentage Totalitarian of Non-Democratic Polities 1800-2000 (Source: Polity IV) - 4.4
- Figure 8 shows how the totalitarian share of non-democracies rose from almost nothing in 1880 to 90% a century later. By 2000, however, the international situation returned to where some 50% or more of all non-democratic polities were totalitarian. Moreover, authoritarian regimes are likely to be more susceptible to the soft power of democracy than totalitarian states. (Nevertheless, it can be argued that sudden collapses of totalitarian states are also possible, although as "deaths" of non-democracies they are not simulated here.) Totalitarian states, on the other hand, are likely to have a dampening effect on the diffusion of democracy. Consequently, the share of authoritarian and totalitarian regimes among non-democratic nations is a critical factor for the advancement of democratization on the global level. Therefore, the transition fraction is defined here as the ratio of authoritarian states among those that are non-democratic (or 100% minus the percentage of totalitarian nations among non-democratic polities divided by 100).
TransitionFraction = (100 - PercentTotalitarianOfNonDemStates) / 100 Definition: The fraction of communications between non-democracies and democracies concerning democracy that will actually cause the non-democracies to take steps toward becoming democracies is defined as a (linear) function of the authoritarian percentage of non-democratic polities (or 100 minus the totalitarian percentage or "immune" polities divided by 100).
This definition completes the extended Bass model of transitions to democracy from 1800 to 2000 (Figure 6). To summarize, the extended version of the Bass model with discards takes into account the fact that some of the potential adopters of democracy are in reality not bona fide since, being closed or traditional, they are resistant to democratization. It is also true that technological innovations over the span of two centuries in the field of mass communications (newpapers, telephones, radio, TV, cell phones, the Internet) have drastically affected communication rates.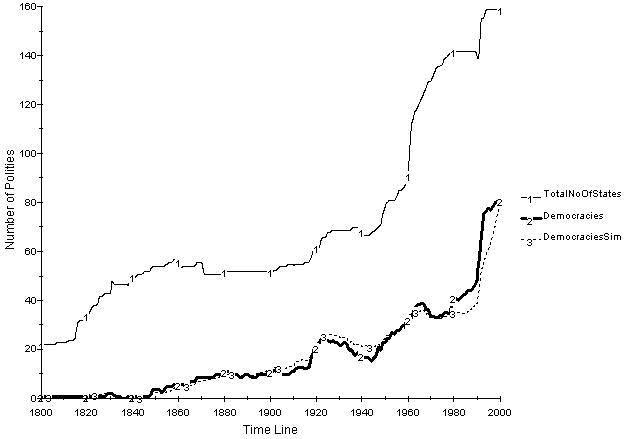
Figure 9. Diffusion of Democracy 1800-2000: Actual Total of States, Actual Total of Democracies, and Simulated Number of Democracies (using model in Fig. 6) (Source: Polity IVd, Polity IV data, Databanks International. Banks Cross-National Time-Series Data Archive) Init: DemocraciesSim = InitNoDemCopy, flow: DemocraciesSim = - dt * ReversalFromDemRateCopy - dt * ExitDemCopy + dt * EntryDemCopy + dt * TransToDemRateSim.
For complete equation of model, see Appendix 3 - 4.5
- As may be seen in Figure 9, the actual diffusion of democracy (heavy line numbered "2" in the diagram) is much more closely represented by the simulated spread of democracy (thin line numbered "3") than was the case in the initial model (Figure 5). The lack of exponential democracy diffusion in the first standard Bass model for the post-World War II period is compensated for by the dynamics of the communication rates and transition fractions in the elaborated model. In the initial model, only one third of the number of actual democracies in 2000 (28 polities) was reached in the simulation run. In the elaborated model (Figures 6 to 9), the simulation stops at 82 of the actual 81 democracies (101%), while the simulated form of the diffusion curve remains very close to the real figures, as shown in Figure 9. This implies that the elaborated model comes much closer to actual figures of transitions to democracy in the last two centuries than the first standard model. Still, there is room for improvement. While space does not permit us to explore this further in the present article, historical studies of the post-World War II transitions to democracy would make it possible to add new or improve statistics on the communication patterns in non-democracies, apart from the data included in the model presented here. Leaving this for future studies, we can instead summarize the dynamic interactions that will impact on transitions to democracy, according to the projections of the elaborated model (Figure 10).
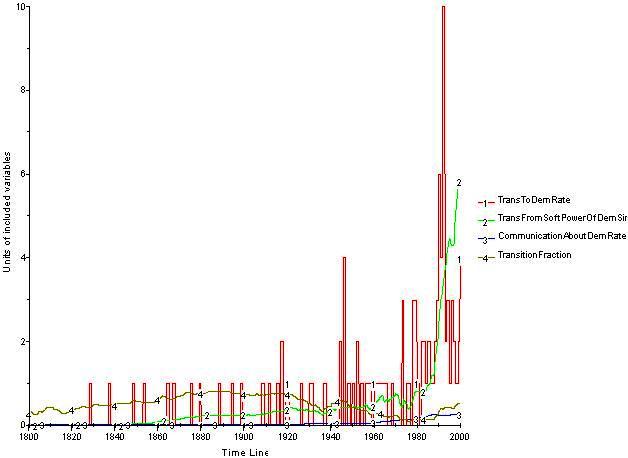
Figure 10. Actual Transitions to Democracy Rates, Simulated Transitions due to Soft Power of Democracy, Communication Rates, and Transition Fractions
Source: Polity IVd and Polity IV data, Databanks International. Banks Cross-National Time-Series Data Archive.
Per Capita values of radios and television sets are yearly means of national means in non-democracies as defined by Polity IV data set. See definitions in Table 1 and list of countries in Appendix 1. Units as in equations in Figure 6 and Appendix 3. - 4.6
- In Figure 10 we can see how the transitions to democracy presented earlier (curve 1) are driven primarily by the soft power of democracy (curve 2). These transitions are further boosted by the growth in communication rates (curve 3) resulting from the availability of mass communication technologies in non-democracies, which in turn helps explain transitions to democracy after 1950. The transition fraction (curve 4) based on the proportion of authoritarian states among non-democracies serves to improve the wave fit and smooth out the slight raggedness of the simulation curve. Without the transition fraction variable, the model of democracy diffusion would overshoot real figures dramatically for the closing forty years of the twentieth century. The rise of totalitarian vs. authoritarian states from about 1960 to 1980 (an increase from 40% to 90% in the fraction of totalitarian regimes among the non-democratic states) accounts for the trough in democracy diffusion that is seen between 1960 and 1970. Appendix 1 shows the considerable number of non-democracies that have arisen from previously existing states and newly-created decolonized nations. They may be the cause of the delay in global diffusion evident in the simulated curve and the reason employing the transition fraction is crucial for the performance of the model.
- 4.7
- The soft power of democracy (curve 2) peaks at the end of the twentieth century, driven by growth in the communication rate and the transaction fraction. However, in the long run this variable will decline and resemble the curve that the word-of-mouth effect showed in the lower diagram of the Bass model (see Figure 2). Since the soft power of democracy requires at least one non-democracy to have a defined value, it cannot totally vanish unless all states become democratic.
- 4.8
- It may easily be seen that the simulated diffusion of democracy does not precisely follow the course of actual events. For a closer approximation, the model would need to take into account transitions between totalitarian and authoritarian polities. In fact, steps 0 to 10 on the institutionalized democracy scale could be incorporated into the model, although doing so would be extremely complicated and only contribute marginally to understanding the diffusion process. Moreover, it would obscure that fact that the basic principle of innovation diffusion is very simple: it is an imitation effect, and imitation requires communication about what is being imitated.
- 4.9
- Given the explosion of new communication technologies, the rapid increase in communication rates, and the rising proportion of authoritarian to totalitarian states, the coming decades should see a great wave of democracy diffusion. The number of democracies estimated today at approximately 90, might climb to almost 110 by the year 2050. Such a projected increase would mean an average of one new democracy every second year for the coming four decades. However, considering that the current size of the stock of democracies has grown far above the estimated diffusion curve, we may expect a reverse wave before a new and even stronger tide swells. With the subsequent wave's new adaptations of democratic institutions, and further refinements in the institutions of older democracies, the standard method of national political decision making in the global system of states will most likely become democracy. The attractiveness of democracy (i.e., its soft power) will then paradoxically fade in consequence of its success, as citizens in most countries simply take it for granted. This will necessarily influence the decreasing number of totalitarian states as well, so it would appear that eventually most (if not all) nations will appropriate the more desirable regime type and become democracies.
Discussion
-
Some Implications of Results
- 5.1
- The analysis of the causes of democracy diffusion will appear provocative to major actors in world politics-primarily those in international and national aid agencies. It concludes that the global spread of democracy is best fostered by improved communication about what is going on inside the world's democracies, rather than by other measures, unless those other measures also contribute to improved communications.
- 5.2
- Most political science research concerning democratization has a statistical and national-comparative approach that does not and cannot produce long-term results on a global scale: the data it uses is restricted to the national level, and most often to adopters of democracy rather than potential ones. However, as mentioned earlier, analysis on the global level does not necessarily contradict unit (national) level analysis. For certain periods of time between 1800 and 2000, the correlates of democracy may still be valid for understanding its adoption in a national context, in which case one should preferably compare "immune", potential, and actual adopters in seeking the critical reasons for susceptibility. In the present paper we have tried to show that transitions to democracy primarily result from a systemic interaction among (a) improved communication on the global system level regarding the ways democracies handle political, economic, social, and cultural matters, (b) how attractive democratic countries therefore seem to potential adopters of democracy, but also (c) the ratio of totalitarian polities among non-democracies, which affects how improved communication impacts transition rates. According to our findings, the diffusion of democracy is primarily attributable to soft power and locally-adapted imitations of other well-functioning democratic institutions.
Conclusion
- 5.3
- This article applies a system dynamics simulation tool to the issue of democratization among polities in the world system between 1800 and 2000. Using Polity IV, Polity IVd, and Banks Times Series data, we hope to have shown how a Bass diffusion model with discards may help estimate soft power, thereby bringing together several levels of social analysis: the use of diffusion of innovation models in political analysis, and the employment of a system dynamics simulation tool in place of statistical analysis. We believe it represents a new approach to the study of soft power, attractiveness, or "snowballing" in any social system.
- 5.4
- Soft power, as defined by Nye (2003, 2004), is an inherent force driving such aggregate change. As such it can be modeled in relation to the diffusion of any change. The system dynamic simulation technique (or stock and flow analysis) is well-suited for modeling such aggregate dynamics.
- 5.5
- Conceptually, one needs to consider whether the global diffusion of democracy is actually driven by factors like democratic ideas-the experience of democracy as it is working elsewhere-and thus the soft power of democracy. It can be shown that the diffusion of democracy is remarkably analogous to the diffusion of dynamically driven technological innovations. Accepting this analogy, one can estimate the effect of soft power (i.e., the attractiveness of institutionalized democracy) and fully appreciate its historic role in political change.
- 5.6
- The major conclusion of our investigation is that the soft power of democracy and the allure of imitation both act as strong, dynamic forces behind democracy diffusion on a global scale, especially when communication technologies make it easy to access information about democracy. Most totalitarian countries showed that they were unable to resist the wave of democracy that swelled at the end of the twentieth century. The growing proportion of authoritarian regimes among non-democratic polities has already affected the rate of transitions to democracy. Our results suggest that that, given improved global and international communication, it has been soft power and reduced "immunity" to political change among totalitarian and authoritarian states that have been the major factors behind the historic spread of democratic institutions worldwide. Actual figures of democracy diffusion are convincingly explained by the proper systemic mix of these factors.
Appendix 1: The Polity IVd Data Set: Polities and Institutionalized Democracy
-
Note: Values for the year 1800 ("Init.") are initial values, not transitions, entries or exits that year.Table A1: The Polity IVd Data Set: Polities and Institutionalized Democracy (Source: Polity IV (Polity value 6-10 coded as 1, Polity value 0-5 coded as 0)) Year Number and
list of newly born
non-democraciesNumber and
list of polities reversed to
non-democracyNumber and
list of newly born democraciesNumber and list of polities reversed to
Democracy1800 (init.) 21 Polities: 1 Polity: Afghanistan United States Austria Bavaria China Denmark France Iran Japan Korea Morocco Nepal Oman Portugal Prussia Russia Spain Sweden Thailand Turkey United Kingdom Württemburg 1806 1 Polity: Saxony 1811 1 Polity: Paraguay 1814 1 Polity: Norway 1815 6 Polities: Modena Netherlands Papal States Parma Sardinia Tuscany 1816 1 Polity: The Two Sicilies 1818 1 Polity: Chile 1819 1 Polity: Baden 1820 1 Polity: Haiti 1821 2 Polities: Gran Colombia Peru 1822 1 Polity: Mexico 1824 2 Polities: Brazil United Provinces 1825 2 Polities: Argentina Bolivia 1827 1 Polity: Greece 1828 1 Polity: Peru 1830 5 Polities: Belgium Ecuador Serbia Uruguay Venezuela 1832 1 Polity: Colombia 1835 1 Polity: Peru 1837 1 Polity: United Kingdom 1838 2 Polities: Costa Rica Nicaragua 1839 2 Polities: Guatemala Honduras 1841 1 Polity: El Salvador 1844 1 Polity: Dominican Republic 1847 1 Polity: Liberia 1848 1 Polity: 1 Polity: Switzerland France 1852 1 Polity: France 1853 1 Polity: Belgium 1854 1 Polity: Orange Free State 1855 1 Polity: Ethiopia 1857 1 Polity: New Zealand 1859 1 Polity: Romania 1861 1 Polity: Italy 1864 1 Polity: Greece 1867 1 Polity: 1 Polity: 1 Polity: Hungary Canada Colombia 1871 1 Polity: Germany 1875 1 Polity: Costa Rica 1877 1 Polity: France 1879 1 Polity: 1 Polity: Bulgaria Spain 1884 1 Polity: Liberia 1886 1 Polity: Colombia 1888 1 Polity: Chile 1891 1 Polity: Chile 1894 1 Polity: Honduras 1898 1 Polity: Norway 1901 1 Polity: Australia 1902 1 Polity: Cuba 1903 1 Polity: Panama 1904 1 Polity: Honduras 1907 1 Polity: Bhutan 1908 1 Polity: Honduras 1910 1 Polity: South Africa 1911 1 Polity: Portugal 1914 1 Polity: Albania 1915 1 Polity: 1 Polity: Greece Denmark 1917 2 Polities: 2 Polities: Estonia Netherlands Finland Sweden 1918 1Polity: 3 Polities: Yemen, North Czechoslovakia Lithuania Poland 1919 1 Polity: Germany 1920 1 Polity: 1 Polity: Latvia Austria 1921 1 Polity: I Polity: Yugoslavia Ireland 1922 1 Polity: 1 Polity: USSR Egypt 1923 1 Polity: Spain 1924 2 Polities Iraq Mongolia 1926 1 Polity: 1 Polity: 1 Polity: Saudi Arabia Poland Greece 1928 1 Polity: Lithuania 1930 2 Polities: 1 Polity: Egypt Colombia Portugal 1931 1 Polity: Spain 1933 1 Polity: Germany 1934 2 Polities: Austria Latvia 1935 1 Polity: Philippines 1936 3 Polities: Estonia Greece Honduras 1937 1 Polity: Argentina 1939 1 Polity: Spain 1940 1 Polity: France 1943 1 Polity: 1 Polity: Lebanon Argentina 1944 1Polity: 1 Polity: 2 Polities: Syria Philippines Greece Guatemala 1945 1 Polity Indonesia 1946 1 Polity: 4 Polities: Jordan Austria Brazil France Turkey 1947 1 Polity: Pakistan 1948 2 Polities: 2 Polities: 3 Polities: 1 Polity: Korea, North Colombia Israel Italy Korea, South Czechoslovakia Myanmar (Burma) Sri Lanka 1949 2 Polities: 1 Polity: Germany, East Germany, West Taiwan 1950 1 Polity: 1 Polity: 1 Polity: Guatemala India Philippines 1951 1 Polity: Libya 1952 2 Polity: Japan Uruguay 1954 1 Polity: 1 Polity: 1 Polity: 1 Polity: Vietnam, North Turkey Sudan Syria 1955 2 Polities: Cambodia Vietnam, South 1956 1 Polity: Pakistan 1957 1 Polity: 1 Polity: Malaysia Colombia 1958 1 Polity: 2 Polities: 1Polity: 1 Polity: Guinea Pakistan Laos Venezuela Sudan 1959 1 Polity: 2 Polities: Tunisia Jamaica Singapore 1960 15 Polities: 1 Polity: 3 Polities: 1 Polity: Benin Laos Cyprus Korea, South Burkina Faso Nigeria Cameroon Somalia Central African Republic Chad Congo Brazzaville Gabon Ghana Ivory Coast Madagascar Mali Mauritania Niger Senegal Togo 1961 2 Polities: 3 Polities: 1 Polity: 1 Polity: Rwanda Brazil Sierra Leone Turkey Tanzania Korea, South Syria 1962 2 Polities: 1 Polity: 2 Polities: 1 Polity: Algeria Myanmar (Burma) Trinidad Dominican Republic Burundi Uganda 1963 2 Polities: 1 Polity: Kenya Peru Kuwait 1964 2 Polities: 1 Polity: Malawi Chile Zambia 1965 1 Polity: 1 Polity: 1 Polity: 1 Polity: Congo (Kinshasa) Singapore Gambia Sudan 1966 1 Polity: 2 Polities: 2 Polities: Guyana Dominican Republic Botswana Nigeria Lesotho 1967 1 Polity: 3 Polities: Yemen, South Greece Sierra Leone Uganda 1968 2 Polities: 1 Polity: 1 Polity: 1 Polity: Equatorial Guinea Peru Mauritius Ecuador Swaziland 1969 3 Polities: Malaysia Philippines Somalia 1970 2 Polities: 2 Polities: Ecuador Fiji Lesotho Zimbabwe 1971 3 Polities: 2 Polities: Bahrain Sudan Qatar Turkey United Arab Emirates 1972 1 Polity: Bangladesh 1973 2 Polities: 3 Polities: Chile Argentina Uruguay Pakistan Turkey 1974 1 Polity: 1 Polity: Guinea-Bissau Bangladesh 1975 3 Polities: 1 Polity: 1 Polity: Angola Papua New Guinea Greece Comoros Mozambique 1976 1 Polity: 1 Polity: 1 Polity: Vietnam Argentina Portugal 1977 1 Polity: 1 Polity: Djibouti Pakistan 1978 1 Polity: 3 Polities: Solomon Islands Burkina Faso Dominican Republic Spain 1979 3 Polities: Ecuador Ghana Nigeria 1980 2 Polities: 1 Polity: Burkina Faso Peru Turkey 1982 1 Polity: 2 Polities: Ghana Bolivia Honduras 1983 1 Polity: 2 Polities: Zimbabwe Argentina Turkey 1984 1 Polity: 1 Polity: Nigeria El Salvador 1985 1 Polity: 2 Polities: Honduras Brazil Uruguay 1986 1 Polity Sudan 1987 1 Polity: 1 Polity: Fiji Philippines 1988 2 Polities: Korea, South Pakistan 1989 1 Polity: 3 Polities: Sudan Chile Honduras Panama 1990 2 Polities: 6 Polities: Germany Bulgaria Namibia Czechoslovakia Fiji Haiti Hungary Nicaragua 1991 9 Polities: 1 Polity: 8 Polities: 4 Polities: Azerbaijan Haiti Armenia Bangladesh Croatia Belarus Benin Georgia Estonia Poland Kazakhstan Latvia Zambia Kyrgyzstan Lithuania Moldova Macedonia Tajikistan Slovenia Turkmenistan Ukraine Uzbekistan 1992 1 Polity: 1 Polity: 10 Polities: Peru Congo Brazzaville Albania Guyana Madagascar Mali Mongolia Niger Paraguay Russia Taiwan Thailand 1993 2 Polities: 1 Polity: 2 Polities: 2 Polities: Eritrea Russia Czech Republic Lesotho Yemen Slovak Republic Moldova 1994 2 Polities: 3 Polities: Dominican Republic Haiti Gambia Malawi Mozambique 1995 2 Polities: 1 Polity: Armenia Georgia Belarus 1996 2 Polities: 3 Polities: Albania Dominican Republic Niger Guatemala Romania 1997 1 Polity: 2 Polities: Congo Brazzaville Albania Mexico 1998 1 Polity: Armenia 1999 1 Polity: 2 Polities: Pakistan Indonesia Nepal 2000 2 Polities: 4 Polities: Georgia Croatia Haiti Russia Senegal Yugoslavia 2001 2 Polities: Ghana Peru 2002 1 Polity: 1 Polity: 1 Polity: Nepal East Timor Kenya 2003 1 Polity: 1 Polity: Armenia Serbia and Montenegro
Appendix 2: Exits of Non-Democracies and Democracies 1800-2003
-
Table A2: Exits of Non-Democracies and Democracies 1800-2003 (Source: Polity IVd. For coding, see Appendix 1. Listed by order of age as polity) Year Number and
list of non-democracy exitsNumber and list of democracy exits 1832 1 Polity: Gran Colombia 1838 1 Polity: United Provinces 1860 4 Polities: Modena Parma Tuscany The Two Sicilies 1861 1 Polity: Sardinia 1870 1 Polity: Papal States 1871 5 Polities Bavaria Prussia Wûrttemberg Saxony Baden 1902 1 Polity: Orange Free State 1910 1 Polity: Korea 1920 1 Polity: Serbia 1940 3 Polities: Lithuania Latvia Estonia 1945 1 Polity: Germany 1975 1 Polity: Vietnam, South 1976 1 Polity: Vietnam, North 1990 3 Polities: 1 Polity Yemen, North Germany, West Germany, East Yemen, South 1991 1 Polity: USSR 1992 1 Polity: Czechoslovakia
Appendix 3: Model code
- A *.sim file created with the Powersim simulation software, downloadable from http://www.Powersim.com, with the full elaborated Bass model of Figures 6-10, may be downloaded as a ZIP archive from here. Using the model, test runs as well as further modifications of the model can be made, such as including subsequent years or changing model parameters.
Acknowledgements
- I would like to express my appreciation to Frank Bass, Pål Davidsen, Nicklas Håkansson, Samuel P. Huntington, Achim Hurrelman, Christina Lindborg, Joseph Nye, Maria Poutilova, Karl Stranne, Jan Teorell, Anders Uhlin, scholars at the Centre for the Study of Cultural Evolution, Stockholm University, and anonymous referees for their comments on earlier versions of this article. The project was supported by Halmstad University and partially by the Swedish Research Council.
Notes
-
1 Diamond supports this analysis in an insightful study (2003).
2 This appears in Nye's classic work (2003) as follows:
A country may achieve its preferred outcomes in world politics because other countries want to emulate it or have agreed to a system that produces such effects. In this sense, it is just as important to set the agenda and structure situations in world politics, as it is to get others to change in particular situations. This aspect of power-that is, getting others to want what you want—might be called attractive, or soft power behavior.
One may say that while hard power may lead the horse to water, soft power makes the horse drink. In Soft Power (2004: 7), Nye argues that this power, or the “ability to shape what others want”, can rest on the attractiveness of one's culture and values or the ability to manipulate the agenda of political choices in a manner that makes others fail to express certain preferences because they seem too unrealistic. Power-hard or soft-is notoriously difficult to measure and analyze in quantitative terms (Dahl 1957, Bachrach & Baratz 1962, 1963, Lukes 1974, Nye 2003, 2004). In the present study, however, the problem of power (soft power in particular) is addressed through a system dynamics model of diffusion of innovation created by Bass (1969). It should be emphasized that world system approaches to democracy diffusion are not inimical to national level comparative studies. Just as epidemiology does not contradict immunology, global diffusion studies do not contradict comparative political studies. The former focuses on why an epidemic is successful, while the question for the later is what factors make a country particularly susceptible to the epidemic. In this sense, world systems analyses, including those of Wallerstein (2004) and others such as Chase Dunn & Hall (1997) and Turchin (2003) detect different phenomena at different levels of analysis, just as this study is focused on aggregate or world systemic behavior.3 As mentioned above this line based on the fraction democratic of the world's population has a fit reaching R2 = .91. Modelski & Perry state that the value of R2 = .952, but this is actually the R value itself, giving us 'only' R2 = .9077 (i.e., .91). All other factors and equations are correct in their presentation.
4 For a discussion of democracy theories and measurement, see Åberg & Sandberg (2003).
5 The present homepage of the Polity Project is: http://www.systemicpeace.org/polity/polity4.htm
6 This is certainly so if collinear variables are involved. Let us say that the number of democracies in the world were included in a vector autoregression analysis, together with explanatory factors like the number of non-democracies, the number of newly-emerging democracies and non-democracies, as well as disappearing democracies and non-democracies, and the total number of states in the world. In that case the multicolliary would be 1. This would be the same as explaining the individuals in a community on the basis of numbers of births, deaths, emigrants, and immigrants. Mathematically, fully-determined stock and flow systems cannot be analysed using statistical techniques because full determination leaves no room for probabilities. Thus, the present article is a test of the scientific validity of constructing such a deterministic model-a simplified, artificial system.
7 Vensim and I-think are two other system dynamics simulation tools, the latter designed for Mac.
8 The mathematical definition of the simulation of number of democracies is therefore (see Appendix 3):
init	Democracies = InitNoDem
flow	Democracies =  + dt * EntryDem - dt * ExitDem - dt * ReveralslFromDemRate
	+ dt * TransToDemRate
The initial value (init) of the simulated number of democracies (DemocraciesSim) equals 1 (namely, the US), and the number equals the differential of births of democracies, minus the differential of deaths of democracies, minus the differential of reversals from democracies, plus the differential of transitions to democracies.
References
-
ÅBERG, Martin and Mikael Sandberg (2003) Social Capital and Democratisation. Roots of Trust in Post-Communist Poland and Ukraine. Aldershot: Ashgate.
ALMOND, Gabriel A. and Sidney Verba ([1963] 1989) The Civic Culture. Political Attitudes and Democracy in Five Nations. Newbury Park, CA: SAGE.
AXELROD, Robert (1984), The Evolution of Co-operation. New York: Penguin
BACHRACH, Peter and Morton S. Baratz (1962) Two Faces of Power. American Political Science Review, Vol. 56, pp. 947-952. [doi:10.2307/1952796]
BACHRACH, Peter and Morton S. Baratz (1963) Decisions and Non-decision: An Analytical Framework. American Political Science Review Vol. 62, pp. 632-642. [doi:10.2307/1952568]
BARRO, Robert J. (1999) Determinants of Democracy. Journal of Political Economy, Vol. 107, pp. 158-183. [doi:10.1086/250107]
BASS, Frank M. (2004) Comments on 'A New Product Growth for Model Consumer Durables.' Management Science, Vol. 50, No. 12 Supplement: pp. 1833-1840.
BASS, Frank M. (1969) A New Product Growth for Model Consumer Durables. Management Science, Vol. 15, No. 5, pp. 215-227. [doi:10.1287/mnsc.15.5.215]
BOIX, Carles and Susan Stokes. (2003) Endogenous Democratization. World Politics, Vol. 55, pp. 815-849. [doi:10.1353/wp.2003.0019]
BREMER, Stuart A. (1977) Simulated Worlds. Princeton, NJ: Princeton University Press.
BREMER, Stuart A. (1987) Demographic Processes. In Stuart A. Bremer (ed.), The GLOBUS Model: Computer Simulation of Worldwide Political and Economic Developments. Boulder, CO: Westview, pp. 283-324
BREMER, Stuart A., ed. (1987) The GLOBUS model: Computer Simulation of Worldwide Political and Economic Developments. Boulder, CO: Westview.
CEDERMAN, Lars-Erik (1997) Emergent Actors in World Politics: How States and Nations Develop and Dissolve. Princeton, NJ: Princeton University Press.
CEDERMAN, Lars-Erik (2003) Modeling the Size of Wars: From Billiard Balls to Sandpiles. American Political Science Review, Vol. 97, No. 1, pp. 135-150. [doi:10.1017/S0003055403000571]
CHASE-DUNN, Christopher K. and Thomas D. Hall (1997) Rise and Demise: Comparing World Systems. Boulder, CO: Westview Press.
CHEIBUB, José Antonio (1999) Divided Government, Deadlock, and the Survival of Presidents and Presidential Regimes. Paper presented at conference on Constitutional Design 2000, Center for Continuing Education, University of Notre Dame, Notre Dame, IN, December 9-11, 1999.
CIOFFI-REVILLA, Claudio (2002) Invariance and Universality in Social Agent-Based Simulations. Proceedings of National Academy of Science USA. Vol. 99 (Supplement 3), No. 14, pp. 7314-7316 [doi:10.1073/pnas.082081499]
CLARK, John and Sam Cole, eds. (1975) Global Simulation Models: A Comparative Study. New York: Wiley.
CUSACK, Thomas R (1987) Government Budget Processes, in Stuart A. Bremer (ed.), The GLOBUS Model: Computer Simulation of Worldwide Political and Economic Developments. Boulder, CO: Westview, pp. 325-458.
CUSACK, Thomas R. and Richard J. Stoll (1990) Exploring Realpolitik: Probing International Relations Theory With Computer Simulations. Boulder, CO: Lynne Rienner.
CUTRIGHT, Phillips (1963) National Political Development, in Nelson Polsby, et al. (eds.), Politics and Social Life. Boston, MA: Houghton Mifflin, pp. 569-582.
DAHL, Robert A. (1957) The Concept of Power. Behavioral Science, Vol. 2, pp. 201-215. [doi:10.1002/bs.3830020303]
DAHL, Robert A. (1971) Polyarchy. Participation and Opposition. New Haven, CT: Yale University Press.
DAHL, Robert A. (1989) Democracy and its Critics. New Haven, CT: Yale University Press.
DAHL, Robert A. (1998) On Democracy. New Haven, CT: Yale University Press.
DAVIDSSEN, Pål (2000) Issues in the Design and Use of System Dynamics Based Interactive Learning Environments. Simulation & Gaming: An Interdisciplinary Journal of Theory, Practice and Research, Vol. 31, No. 1, pp. 170-177. [doi:10.1177/104687810003100204]
DEUTSCH, Karl W. (1990) Global Models: Some Uses and Possible Developments. International Political Science Review, Vol. 11, No. 2, pp. 165-176. [doi:10.1177/019251219001100202]
DEUTSCH, Karl W., Bruno Fritsch, Helio Jaguaribe, and Andrei S. Markovits, eds. (1977) Problems of World Modeling: Political and Social Implications. Cambridge, MA: Ballinger.
DIAMOND, Larry (1992) Economic Development and Democracy Reconsidered. In Gary Marks and Larry Diamond (eds.), Reexamining Democracy. Essays in Honour of Seymour Martin Lipset. Newbury Park, CA: Sage, pp. 93-139. [doi:10.1177/0002764292035004007]
DIAMOND, Larry (2003) Can The Whole World Become Democratic? Democracy, Development and International Policies. University of California, Irvine: Center for The Study of Democracy.
DIAMOND, Larry and Marc Plattner eds. (1993) The Global Resurgence of Democracy. Baltimore, MD: Johns Hopkins University Press.
FORRESTER, Jay Wright (1961) Industrial Dynamics. Cambridge, MA: MIT Press.
FORRESTER, Jay Wright (1971) World Dynamics. Waltham, MA: Pegasus.
GILBERT, Nigel, and Klaus G. Troitzsch (2005) Simulation for the Social Scientist, 2nd ed. Buckingham: Open University Press.
GLEDITSCH, Kristian S. and Michael D. Ward. (2006) Diffusion and the International Context of Democratization. International Organization 60(4): 911-933. [doi:10.1017/s0020818306060309]
HADENIUS, Axel (1992) Democracy and Development. Cambridge: Cambridge University Press.
HADENIUS, Axel and Jan Teorell (2005) Cultural and Economic Prerequisites of Democracy: Reassessing Recent Evidence. Studies in Comparative International Development, Vol. 39, No. 4, pp. 87-106. [doi:10.1007/BF02686166]
HUNTINGTON, Samuel P. (1991) The Third Wave: Democratization in the Late Twentieth Century. Norman, OK: University of Oklahoma Press.
INGLEHART, Ronald (1997) Modernization and Postmodernization. Cultural, Economic, and Political Change in 43 Societies. Princeton, NJ: Princeton University Press.
INGLEHART, Ronald, and Christian Welzel (2005) Modernization, Cultural Change, and Democracy. The Human Development Sequence. Cambridge: Cambridge University Press.
JAGGERS, Keith and Ted Robert Gurr. 1995. "Transitions to Democracy: Tracking Democracy's Third Wave with the Polity III Data."ÊJournal of Peace ResearchÊ32 (November):469-82.
KATZ, Elihu., & Lazarsfeld, Paul F. (1955). Personal influence: The part played by people in the flow of mass communication. Glencoe, IL: Free Press
KURZMAN, Charles (1998) Waves of Democratization. Studies in Comparative International Development, Vol. 33, No. 1, pp. 42-64. [doi:10.1007/BF02788194]
LANE, Jan-Erik (1996) Constitutions and Political Theory. Manchester: Manchester University Press.
LEESON, Peter T., and Andrea M. Dean. (2009) The Democratic Domino Theory: An Empirical Investigation. American Journal of Political Science 53(3): 533-551. [doi:10.1111/j.1540-5907.2009.00385.x]
LERNER, Daniel (1958) The Passing of Traditional Society. Glencoe, IL: Free Press.
LINZ, Juan J. and Alfred Stepan (1996) Problems of Democratic Transition and Consolidation. Southern Europe, South America, and Post-Communist Europe. Baltimore, MD: Johns Hopkins University Press.
LIPSET, Seymour Martin (1960) Political Man. The Social Basis of Politics. London: Heinemann.
LIPSET, Seymour Martin (1990) The Centrality of Political Culture. Journal of Democracy, Vol. 1, No. 4, pp. 80-83. [doi:10.1353/jod.1990.0063]
LUKES, Steven. (1974) Power. A Radical View. London: MacMillan
MARSHALL, Monty G and JAGGERS, Keith (2002) Polity IV Project, Political Regime Characteristics and Transitions, 1800-2002. Dataset Users' Manual. University of Maryland.
MCCRONE, Donald J. and Charles F. Cnudde (1967) Toward a Communications Theory of Democratic Political Development: A Causal Model. The American Political Science Review, Vol. 61, No. 1, pp. 72-79. [doi:10.2307/1953876]
MODELSKI, George and Gardner Perry III (2002) 'Democratization in Long Perspective' Revisited. Technological Forecasting and Social Change, Vol. 69, pp. 359-376. [doi:10.1016/S0040-1625(01)00152-4]
NORTON, John A, and Frank M. Bass (1987) A Diffusion Theory Model of Adoption and Substitution for Successive Generations of High-Technology Products. Management Science, Vol. 33, No. 9, pp. 1069-1086. [doi:10.1287/mnsc.33.9.1069]
NYE, Joseph S. (2003) Understanding International Conflicts. An Introduction to Theory and History, 4th ed. New York: Pearson.
NYE, Joseph S. (2004) Soft Power. The Means to Success in World Politics. New York: Public Affairs.
O'LOUGHLIN, John, Michael Ward, Corey Lofdahl, Jordin Cohen, David Brown, David Reilly, et al. (1998) The Diffusion of Democracy, 1946-1994. Annals of the Association of American Geographers, Vol. 88, No. 4, pp. 545-574. [doi:10.1111/0004-5608.00112]
PRZEWORSKI, Adam and Fernando Limongi (1997) Modernization: Theories and Facts. World Politics, Vol. 49, No. 2, pp. 155-183. [doi:10.1353/wp.1997.0004]
PYE, Lucian W., ed. (1963) Communication and Political Development. Princeton, NJ: Princeton University Press.
ROGERS, Everett M. (1995) Diffusion of Innovations. New York: The Free Press.
ROSE, Richard and Doh Chull Shin (2001) Democratization Backwards: The Problem of Third Wave Democracies. British Journal of Political Science, Vol. 31, No. 2, pp. 331-354. [doi:10.1017/s0007123401000138]
RUSTOW, Dankwart A. ([1970] 1999) Transitions to Democracy: Toward a Dynamic Model. In Lisa Anderson, ed., Transitions to Democracy. New York: Columbia University Press, pp. 14-41.
SMITH, Dale L. (1987) International Political Processes. Stuart A. Bremer (ed.), The GLOBUS Model: Computer Simulation of Worldwide Political and Economic Developments. Boulder, CO: Westview, pp. 569-721.
STARR, Harvey. (1991), Democratic Dominoes: Diffusion Approaches to the Spread of Democracy in the International System. Journal of Conflict Resolution, Vol. 35, No. 2, pp. 356-381. [doi:10.1177/0022002791035002010]
STARR, Harvey and Christina Lindborg (2003) Democratic Dominoes Revisited: The Hazards of Governmental Transition. Journal of Conflict Resolution, Vol. 47, No. 4, pp. 490-519. [doi:10.1177/0022002703252373]
STERMAN, John D. (2000) Business Dynamics. Systems Thinking and Modeling for a Complex World. Boston, MA: Irwin McGraw-Hill.
TEORELL, Jan, and Axel Hadenius (2005) Determinants of Democratization: Taking Stock of the Large-N Evidence, mimeo. Uppsala: Department of Government, Uppsala University.
TURCHIN, Peter (2003) Historical Dynamics. Why States Rise and Fall. Princeton, NJ: Princeton University Press.
UHLIN, Anders (1993) Transnational Democratic Diffusion and Indonesian Democracy Discourses. Third World Quarterly, Vol. 14, No. 3, pp. 513-540 [doi:10.1080/01436599308420340]
UHLIN, Anders (1995) Democracy and Diffusion. Transnational Lesson-Drawing among Indonesian Pro-Democracy Actors, Lund: Lund Political Studies 87.
VANHANEN, Tatu (1997) Prospects of Democracy. A Study of 172 Countries, London: Routledge.
WALLERSTEIN, Immanuel (2004) World-System Analysis: An Introduction. Durham, NC: Duke University Press.
WARD, Michael, John O'Loughlin, Michael Shin, Corey L. Lofdahl, Kristian S. Gleditsch, and Jordin S. Cohen (1997) The Spatial and Temporal Diffusion of Democracy 1946-1994, mimeo. Boulder, CO: University of Colorado, Institute of Behavioral Science. Available online at: http://www.colorado.edu/ibs/GAD/Manuscripts/isa1996.pdf
WEJNERT, Barbara (2005) Diffusion, Development, and Democracy. American Sociological Review, Vol. 70, No. 1, pp. 53-81. [doi:10.1177/000312240507000104]
WELZEL, Christian and Ronald Inglehart (2005a) Democratization as the Growth of Freedom: The Human Development Perspective. Japanese Journal of Political Science, Vol. 6, No. 3, pp. 1-31.
WELZEL, Christian and Ronald Inglehart (2005b) Liberalism, Postmaterialism, and the Growth of Freedom. International Review of Sociology, Vol. 15, No. 1, pp. 81-108. [doi:10.1080/03906700500038579]
WELZEL, Christian, Ronald Inglehart, and Hans-Dieter Klingemann (2003) The Theory of Human Development: A Cross-Cultural Analysis. European Journal of Political Research, Vol. 42, pp. 341-379. [doi:10.1111/1475-6765.00086]
Data Sets
Polity IV and Polity IVd
Databanks International. Banks Cross-National Time-Series Data Archive. Available from Trinity College http://library.trincoll.edu/timeseries/index.cfm (accessed March 27, 2008).