
 Abstract
- Recent formulation of the Zaller model of mass opinion is generalized to include the interaction between agents. The mechanism of interaction is close to the bounded confidence model. The outcome of the simulation is the probability distribution of opinions on a given issue as dependent on the mental capacity of agents. Former result was that a small capacity leads to a strong belief. Here we show that an intensive interaction between agents also leads to a consensus, accepted without doubts.
- Keywords:
- Mass Opinion; Computer Simulations; Social Networks;
Introduction
- 1.1
- Mathematical modeling of the dynamics of public opinion (Stauffer 2005; Castellano 2009) becomes an autonomous area in computational social sciences (Epstein 1996; Epstein 2006; Miller 2007). Most established (Castellano 2009) are the voter model (Clifford 1973), the Galam model (Galam 2002), the social impact model (Nowak 1990), the Sznajd model (Sznajd-Weron 2000), the Deffuant model (Deffuant 2000) and the Krause-Hegselman model (Hegselmann 2002). In these models, opinions are represented by numbers, either integer (Clifford 1973; Galam 2002; Nowak 1990; Sznajd-Weron 2000) or real (Deffuant 2000; Hegselmann 2002). Recently a new perspective was proposed under the name 'CODA model' by Martins (2008): an agent is represented by a continuous distribution of opinions, and his binary decisions are formulated on the basis of this internal information. Basically, the issue of the modeling is a consensus between agents, and their decisions are taken on the basis on the information available in the system at the beginning. In all models constructed on the basis of statistical physics (Castellano 2009), opinions are exchanged between agents. However, in real situations the decisions are influenced by information flowing continuously from mass media, and the way how the informations are produced, selected and shaped largely determines the way the audience understand the world (Lippmann 1922; McLuhan 1964; Aronson 1972; Herman 1988; Zaller 1992; Lister 2003). This role of mass media cannot be overestimated; the term "global village" was coined by Marshall McLuhan as early as in 60's, and today it is even more appropriate. On the contrary to models inspired by physics, in social sciences theory of the public opinion is concentrated on media. Such is also the Zaller model, known also as the Receipt-Accept-Sample (RAS) model (Zaller 1992); this is perhaps the most influential mathematical model of the public opinion.
- 1.2
- The Zaller model is an attempt to describe the processes of receipt of messages from media by the audience, of accepting these messages or not, and to use them as a basis to formulate binary (Yes or No) decisions. In its original formulation (Zaller 1992) the model is a parameterization; based on poll results, a set of phenomenological coefficients can be assigned to each issue. More general knowledge could be attained by observing some regularities in these coefficients.
- 1.3
- As a mathematical project, the program demands a large scale investigation of statistical data, but it offers little insight for a sociophysical research, which is oriented towards mechanisms. Still, in its descriptive content the Zaller model is an invaluable starting point to advance our understanding of the processes listed above. The approach is rightly termed as the Receipt-Accept-Sample (RAS) model.
- 1.4
- Recently the model was reformulated to a more geometrical form (Kułakowski 2009), which applied the effect of bounded confidence (Deffuant 2000) to the stream of messages coming from media (Zaller 1992). In this new formulation, information accumulated by agents is encoded in the form of a probability distribution; this is similar to the approach by Martins (2008). The motivation was to free the construction from tens of parameters, which in the original formulation (Zaller 1992) are to be obtained by fitting the model curves to poll data. This target was reached by introducing a plane of issues, where particular opinions and messages were represented by points on the plane. The distance between points A and B on the plane was a measure of the difficulty of receipt an opinion A for an agent with an opinion B. This construction was adopted from the Deffuant (2000) model and it is known as the bounded confidence: if the distance between two agents is larger than some threshold value, these agents ignore each other. That is why here we use the term "Zaller-Deffuant model". In both formulations (Zaller 1992; Kułakowski 2009), the contact between agents is substituted by a stream of messages, provided by media. Still, the interaction between agents—the mechanism so basic for all sociophysical models—is absent in both formulations (Zaller 1992; Kułakowski 2009).
- 1.5
- The aim of this paper is to generalize the model (Kułakowski 2009) by adding an interaction between agents. This is built-in, retaining the bounded confidence effect. As in Kułakowski (2009), here the outcome of the calculation is the probability distribution of the external decision, Yes or No. The only parameter is the mental capacity μ of agents, which is a measure of a maximal distance from messages received previously to a newly received message. Its detailed definition is given in the next section. In the Deffuant (2000) model, the similarly defined parameter is the threshold.
- 1.6
- In the next section we describe the geometrical form (Kułakowski 2009) of the model. The interaction between agents is introduced in two alternative versions: i) the interaction happens with some probability and the message is directed to all agents, ii) agents are distributed in nodes of a homogeneous random network and the interaction is directed only to neigbours. Section 3 is devoted to numerical results of both versions of the model. Discussion of the results closes the text.
The model
- 2.1
- Messages are represented as points on a plane. This means that a message is characterized by its relation to two issues, say economic and moral. The probability density function of positions of incoming messages is constant within a given area, say a square 2×2 and it is zero outside the square. Now consider a new message appears. Each agent has to decide: to receive the message or not. Once the position of the new message is too far to what the agent received in the past, the message is simply ignored. The critical distance between messages is the agent's mental capacity μ; small value of this parameter means that the agent will be able to receive only messages found in the direct neighborhood of the messages received by him in the past. To express μ mathematically, let us consider an agent i who received a series of ni messages before time t. Let us denote the coordinates of these messages on the plane of issues as(xi (t'),yi (t')), where t' < t. Analogously, the coordinates of the new message are (x(t),y(t)). Then, the capacity μ is defined by the following relation: i -th agent receives the new message if and only if t''< t exists such that
(xi (t'') – x(t))2 + (yi (t'') – y(t))2 < μ2. (1) - 2.2
- In this way, at each time t each agent i is represented by the spatial distribution of messages ρi which he received till t: ρi (x,y;1) = const > 0 if the distance from (x,y) to at least one message received previously by i is smaller than μ. A numerical example of messages received by an agent is shown in Fig. 1. Time t is conveniently equivalent to the number M of incoming messages, not necessarily received.
- 2.3
- One of immediate consequences of this geometrical representation is that the probability of receipt of a new message increases with the number of those already received. This is due to the fact that a new message is received if it is not too far from the area occupied by the messages previously received. As it is seen in Fig. 1, this area increases with the number of received messages. On the other hand, the effect is in accordance with the second postulate of the Zaller theory: "…people are able to react critically to the arguments they encounter only to the extent that they are knowledgeable about political affairs" (Zaller 1992). They are knowledgeable—it means that they did receive some messages already in the past.
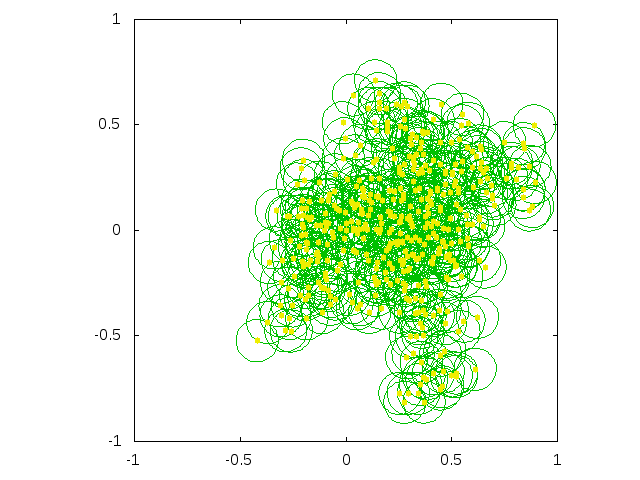
Figure 1. The square 2×2 on the plane of issues. Set of messages received by a model agent with μ = 0.1 till a given time t. With the simulation continued, the square will be sooner or later fulfilled; sooner for agents with larger μ. - 2.4
- The idea to represent messages by points on a plane is not new and it was evoked at different occasions (Sznajd-Weron 2005; http://www.politicalcompass.org/; Huet 2008; Prager n.d.). Consider an issue, about which the agent is asked by a pollster to construct an opinion. To do this, he makes a projection of the new issue to the two issues salient for him, which span his personal plane. This is equivalent to a new axis on the plane. All messages accepted by the agent can be projected on this new axis, and their projected density gives the probability of the answer Yes or No. In particular, if the new axis is chosen to be just the vertical one (OY), the normalized probability pi of answer Yes obtained from agent i is equal to
pi = [Σj xj ( i) Θ ( xj ( i))] / [Σj | xj ( i)|], (2) where xj (i) is the x-th coordinate of the j-th message received by i-th agent, and Θ(x) is the step function defined as follows: Θ(x) = 1 for x > 0, otherwise Θ(x) = 0.
- 2.5
- In this model, the messages received in the past are retained in the agent's memory in the form of her/his known area. Over the course of time, this area increases and sooner (large μ) or later (small μ) it covers the whole square under considerations (Kułakowski 2009). New messages which appear in the known area of agent i do not change it, they only modify the probability pi, defined above.
- 2.6
- Our numerical experiment is to expose all agents to a homogeneous stream of messages, covering the area with equal density. In the average, there is no more arguments for one option than for another. With this kind of information, a reasonable agent should stay undecided, what is equivalent to the decision Yes or No with the same probability. Let us consider an agent with capacity μ as large that the circle with radius μ covers the whole square where new messages appear, either from other agents or from media. Such an agent receives all messages; then after a short time t he is represented by a function ρ equally distributed on the square. Indeed, the probability p of his/her Yes is close to 0.5. Now let us consider another agent with small μ . The number of messages received by him increases only slowly, and so does the probability that he will receive a new message, measured by an area where his/her ρi > 0. The spatial distribution of his ρ remains nonhomogeneous for a long time. Once a new axis of an issue is set, the projection of the received messages on this axis remains either mostly at positive or mostly at negative side. In combinatorics, the problem is known as the first arcsine law (Feller 1961). As a result, either the answer Yes will be given with large probability and the answer No—with small probability, or the opposite. In other words, opinions of the agent with small μ are well established or extreme, what is not justified by the content of incoming messages. This is the result obtained numerically in Kułakowski (2009). The stage of opinion formation corresponds to the stages Accept-Sample in the RAS model (Zaller 1992).
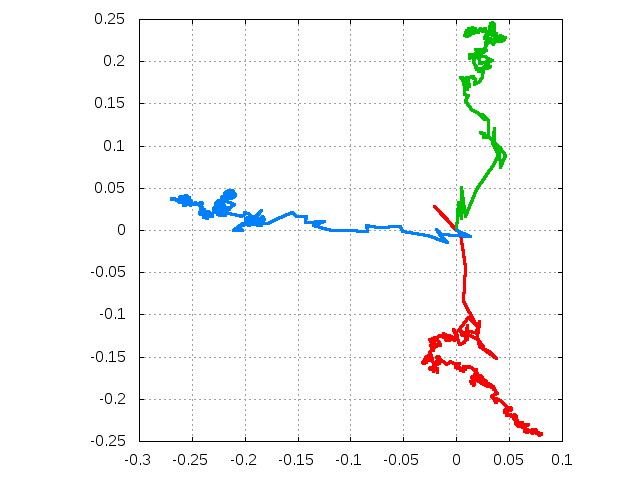
Figure 2. Three examples of paths of mean opinions of agents with μ = 0.1, who strongly believe into a model issue; most of received messages are concentrated on the same side of the horizontal axis (OX) or the vertical axis (OY). - 2.7
- Here we expand the model by adding the interaction between agents. This is done in two ways. In first version, after incoming of each message from media each agent sends his own message to everybody with probability r. The position of this message in a plane is equal to the average position of the informations received by the sender. The rule to receive this message by other agents or not is the same as before. In Fig. 2 we show three examples of how these average positions depend on the number of received messages, if the capacity μ is small. The message is handled by all other agents in the same way as the messages from media. In the second version, agents are placed at nodes of an Erdös-Rényi network (Bollobás 2001). After incoming each external message, every agent sends the information on his average opinion as before, with probability r = 1. The difference is that these messages can be received only by the sender's neighbours. In both versions, initial positions of the agents are randomly distributed, what reflects the commonly known spread of opinions. This is also an advantage with respect to our previous approach (Kułakowski 2009), where each agent started from the centre of the square. We note that it is only the messages received by an agent that are calculated as his/her average. The agent's internal information is constructed as a gradually growing cloud of messages, in the same way as in the case without interaction.
- 2.8
- In the Appendix A the algorithm of our calculations is given in the form of pseudocode. In the Appendix B the source code for the probabilistic variant of the calculation is presented. The source codes of all variants of the calculations are available at http://www.zis.agh.edu.pl/zaller/.
Results
- 3.1
- In Fig. 3 the set of received messages as points at the plane is shown for two values of μ (0.1 and 0.5) and three values of M (103, 5×10³ and 104). As we see, for smaller μ the density of messages remains heterogeneous for long time, i.e. after 5×10³ messages sent from media. The same picture for the case with interaction (Fig. 4) reveals strong heterogeneities. For small M, these heterogeneities are of the form of dense clouds of dots, as seen in first row of Fig. 4. For larger M and small μ, we see lines which describe sets of messages send by agents who gradually shift their mean positions to a common centre. A similar centre, but much weaker, is observed also for larger μ. At this centre, the opinions of the majority of agents is gathered, and this gathering is responsible for the extreme positions, according to Eq. (2). These results are shown for very long time series, to visualize the asymptotic behaviour of the system. As we are interested rather in transient effects than in the asymptotic behaviour, our main results are obtained for much shorter series of messages.
- 3.2
- In Figs. 5 and 6 we show the results obtained for the probabilistic variant, where agents express their opinions with probability r. The number of agents is 103, the number of external messages is 100, and the results are averaged over 103 simulations. The value r = 10-2 is set to assure that about ten agents provide their messages per each message from the media.
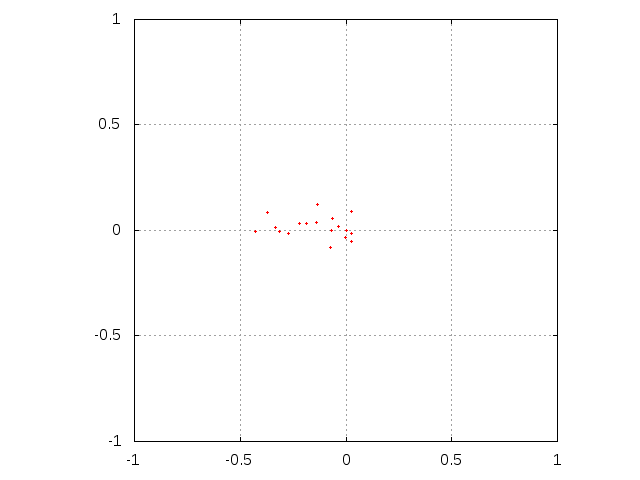
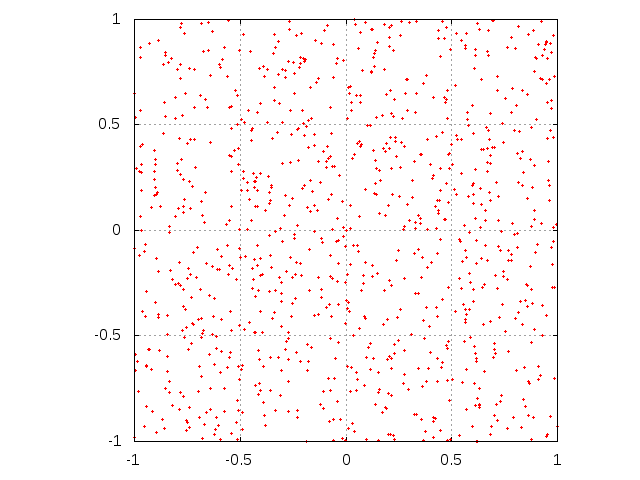
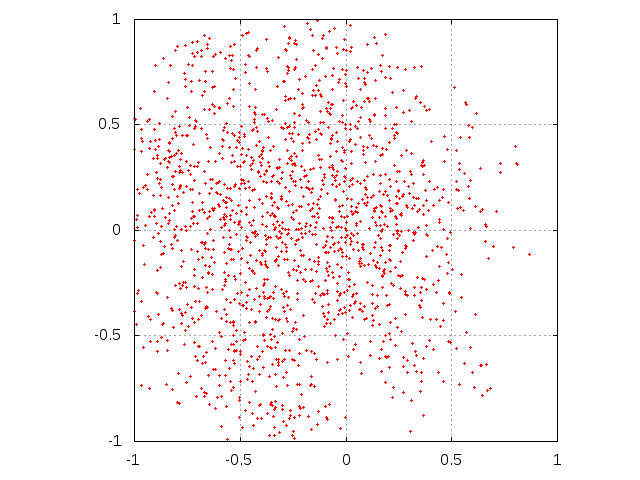
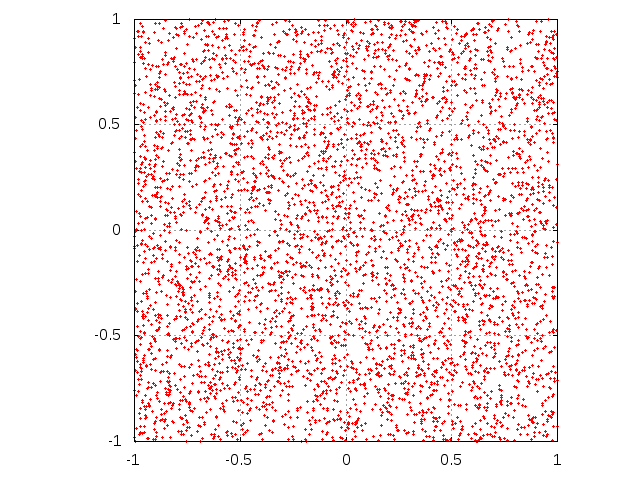
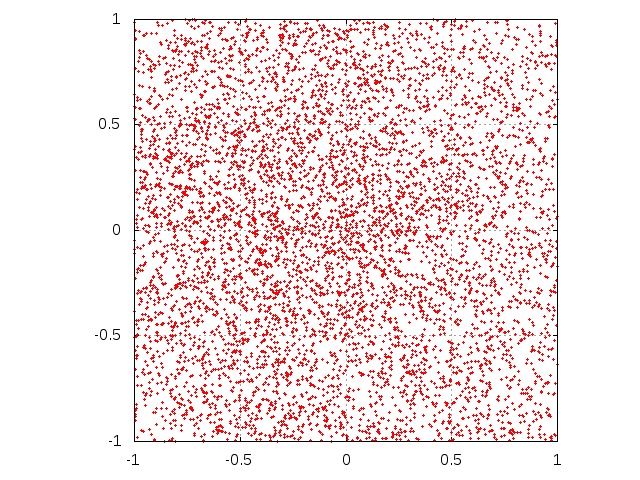
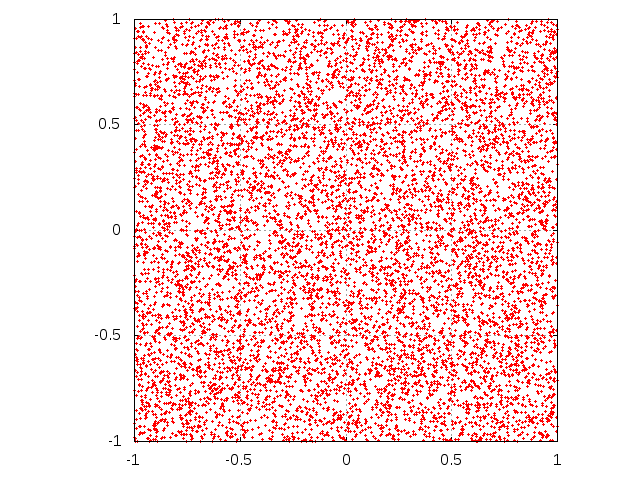
Figure 3. Evolution of single agent knowledge without interaction. Initially, agent is situated at the center of the square. Subsequent rows correspond to sending M = 103, 5000 and 104 messages. Left column corresponds to μ = 0.1 while right one is for parameter μ equal to 0.5. 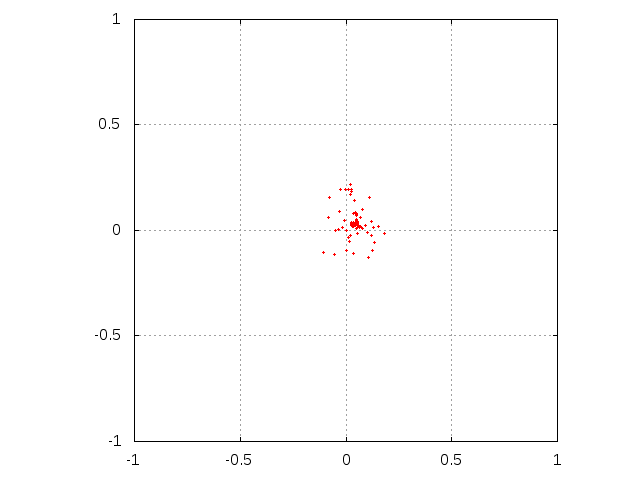
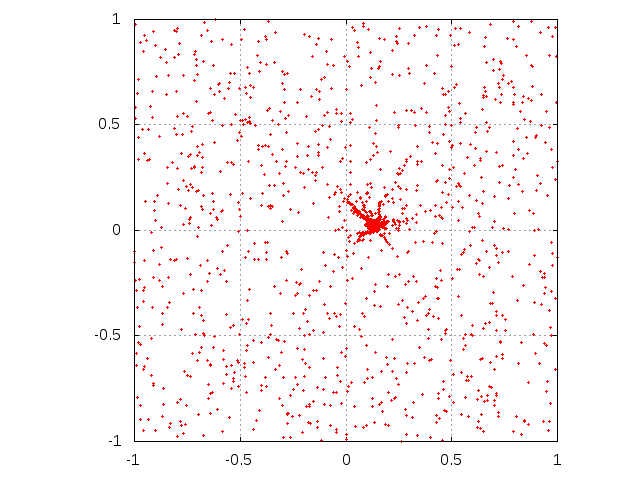
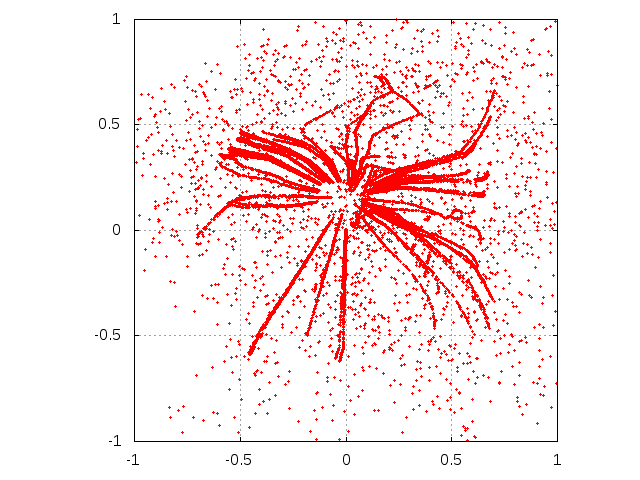
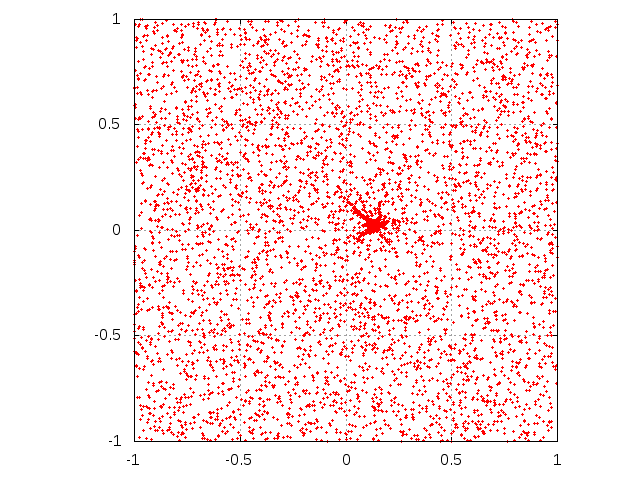
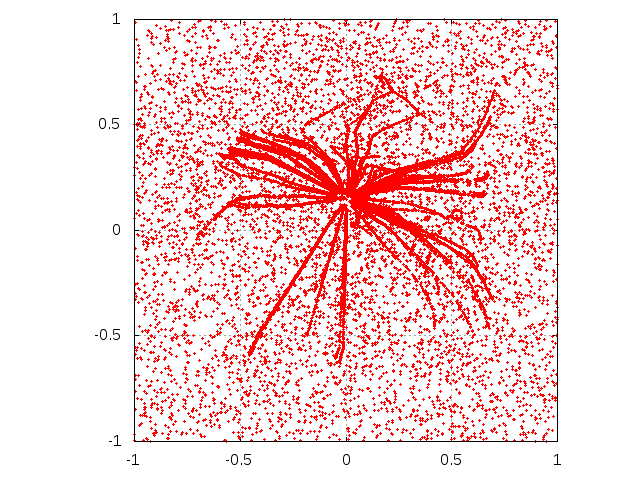
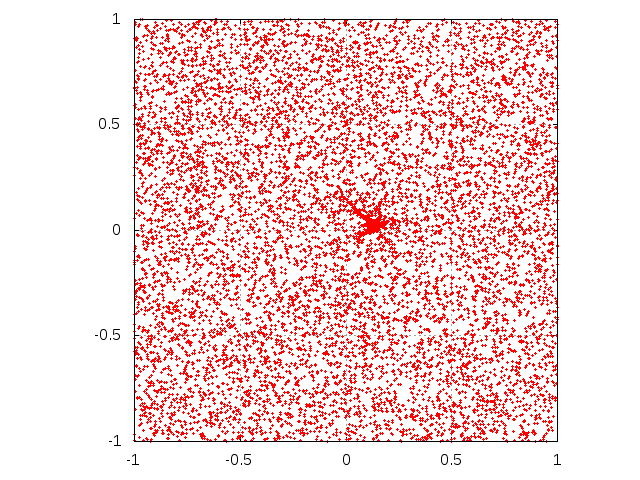
Figure 4. Evolution of single agent knowledge with interaction among agents. Initially, agent is situated at the center of the square. Subsequent rows correspond to sending M = 103, 5000 and 104 messages. Left column corresponds to μ = 0.1 while right one is for parameter μ equal to 0.5. The agent interacts with 99 other agents. The "trajectories" correspond to agents, driven by random streams of messages aside from the coordinate center to well-established opinions. 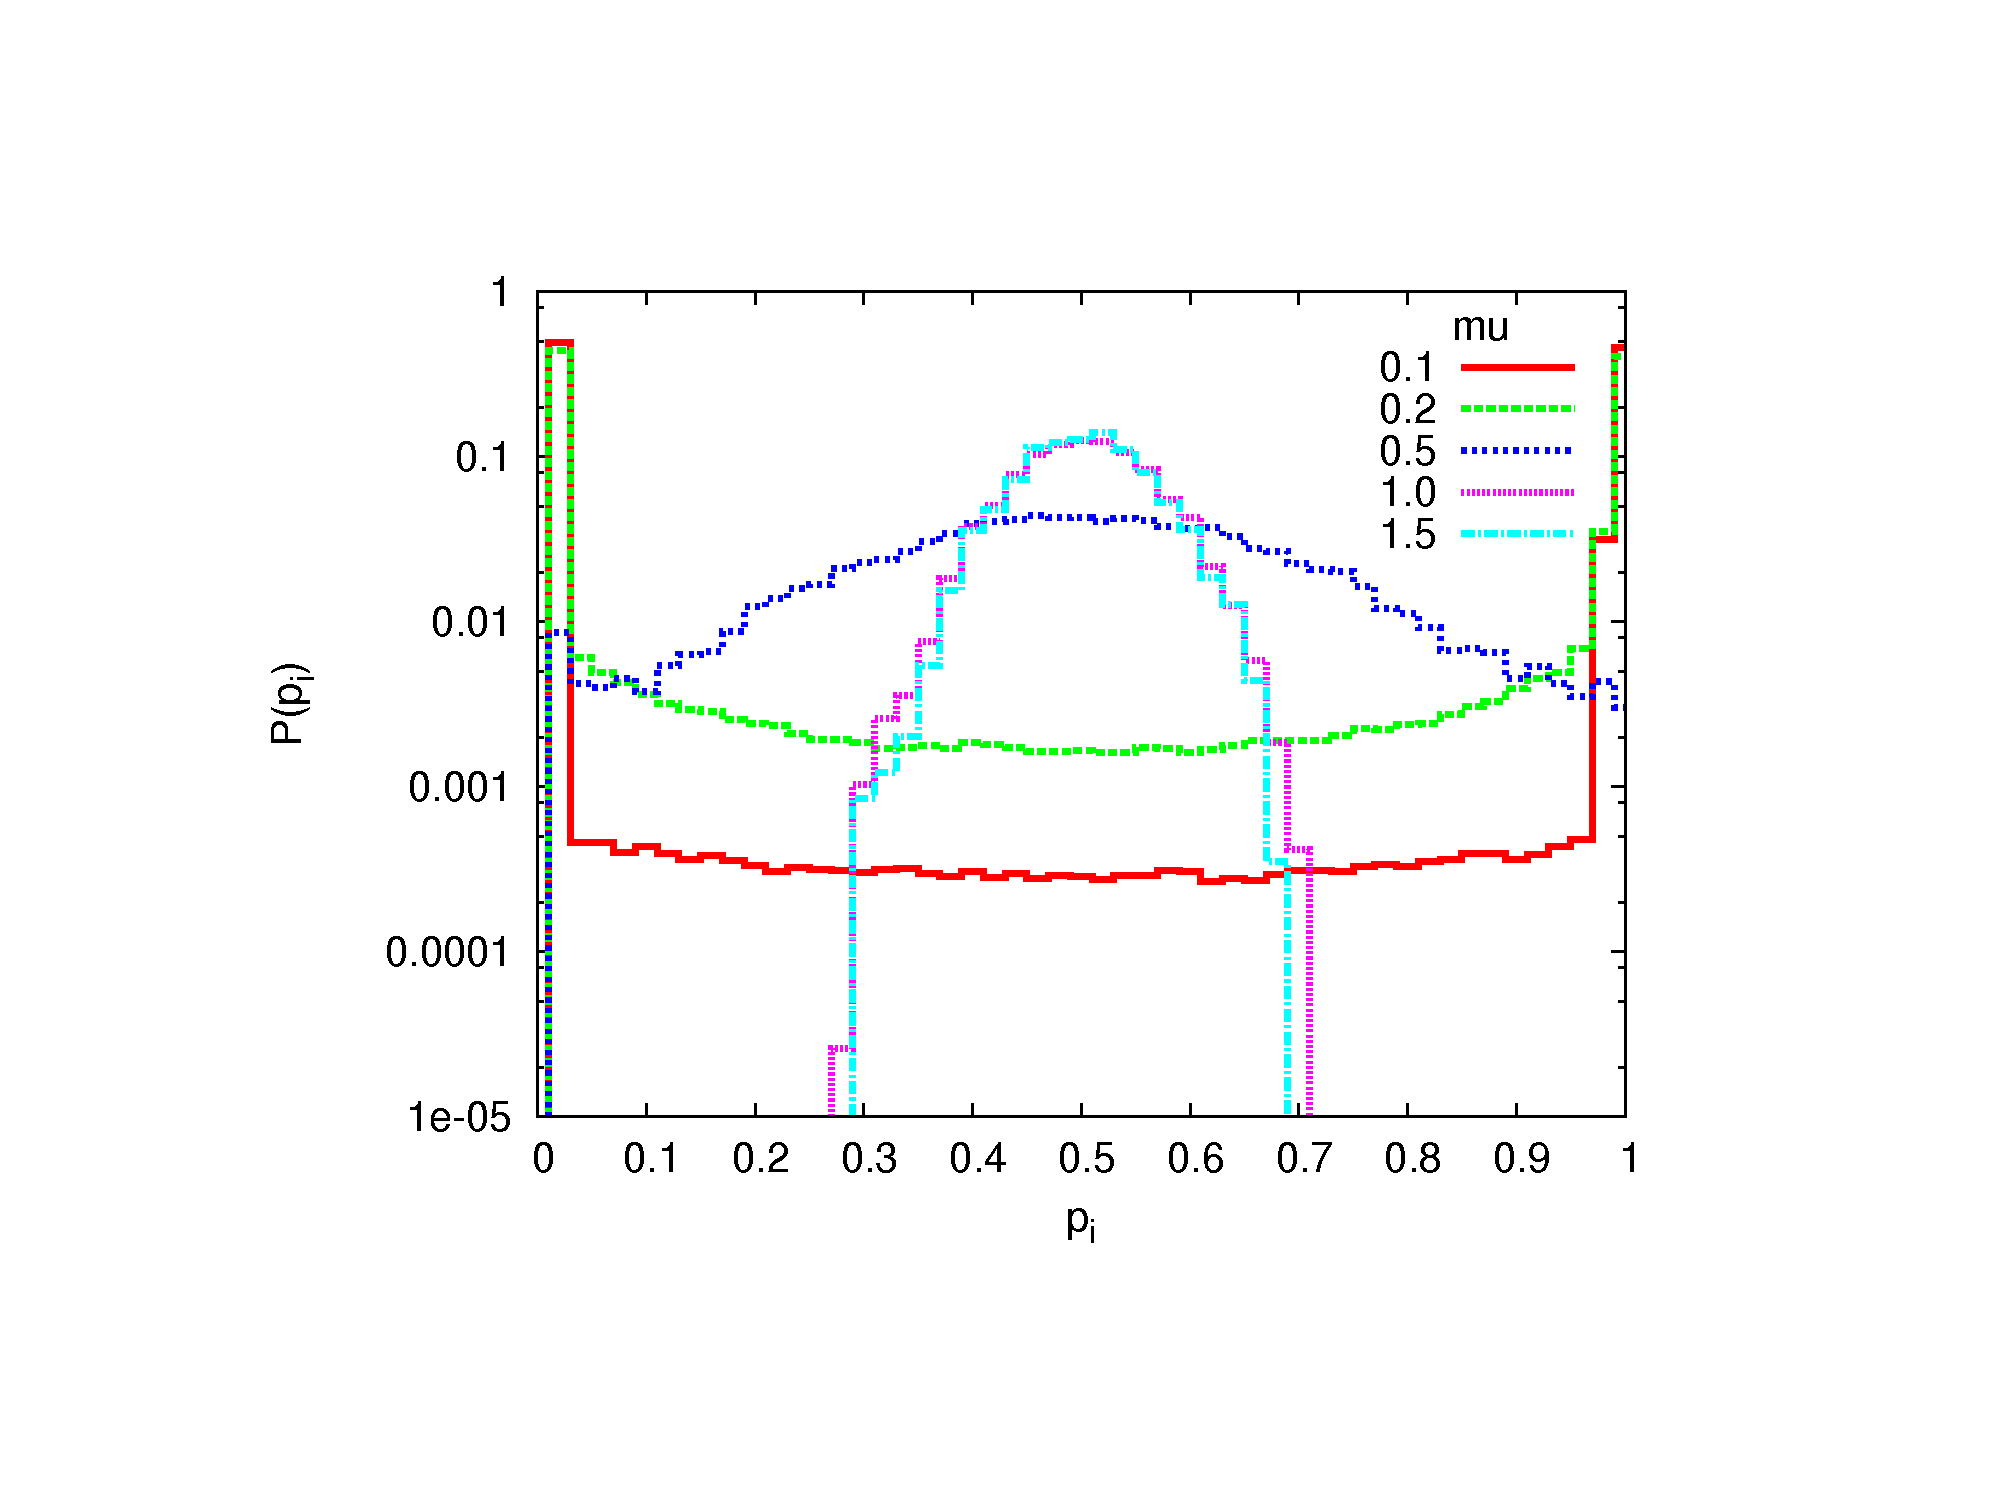
Figure 5. The histogram of pi for various capacities μ without interactions between agents, for the probabilistic variant of the calculation. 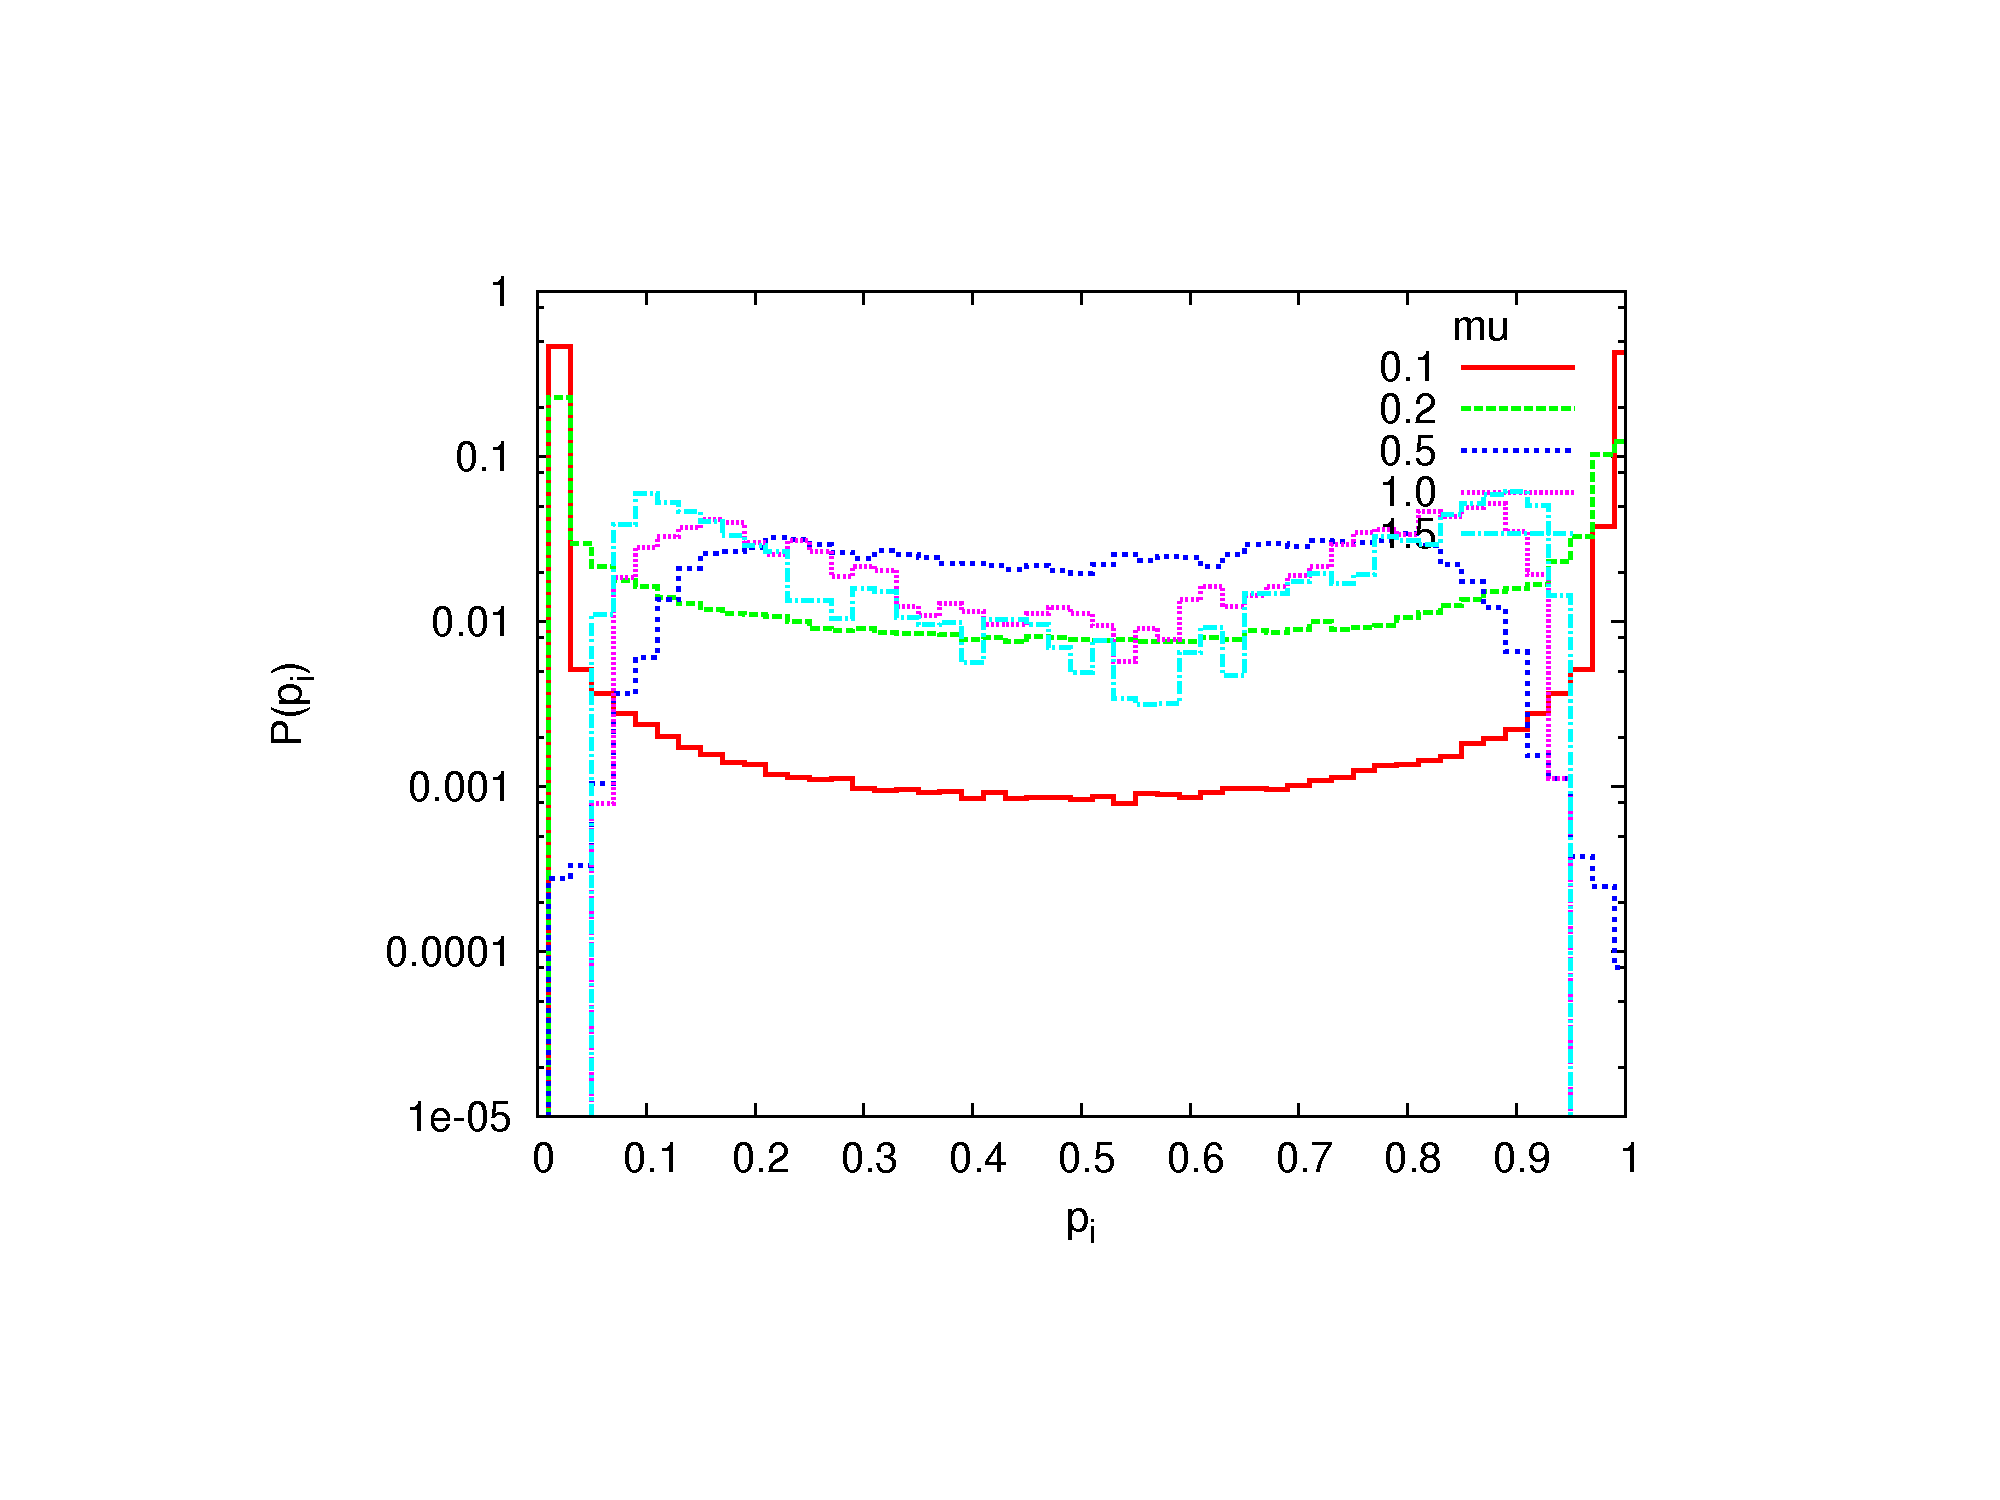
Figure 6. The histogram of pi for various capacities μ with interactions between agents, for the probabilistic variant of the calculation. 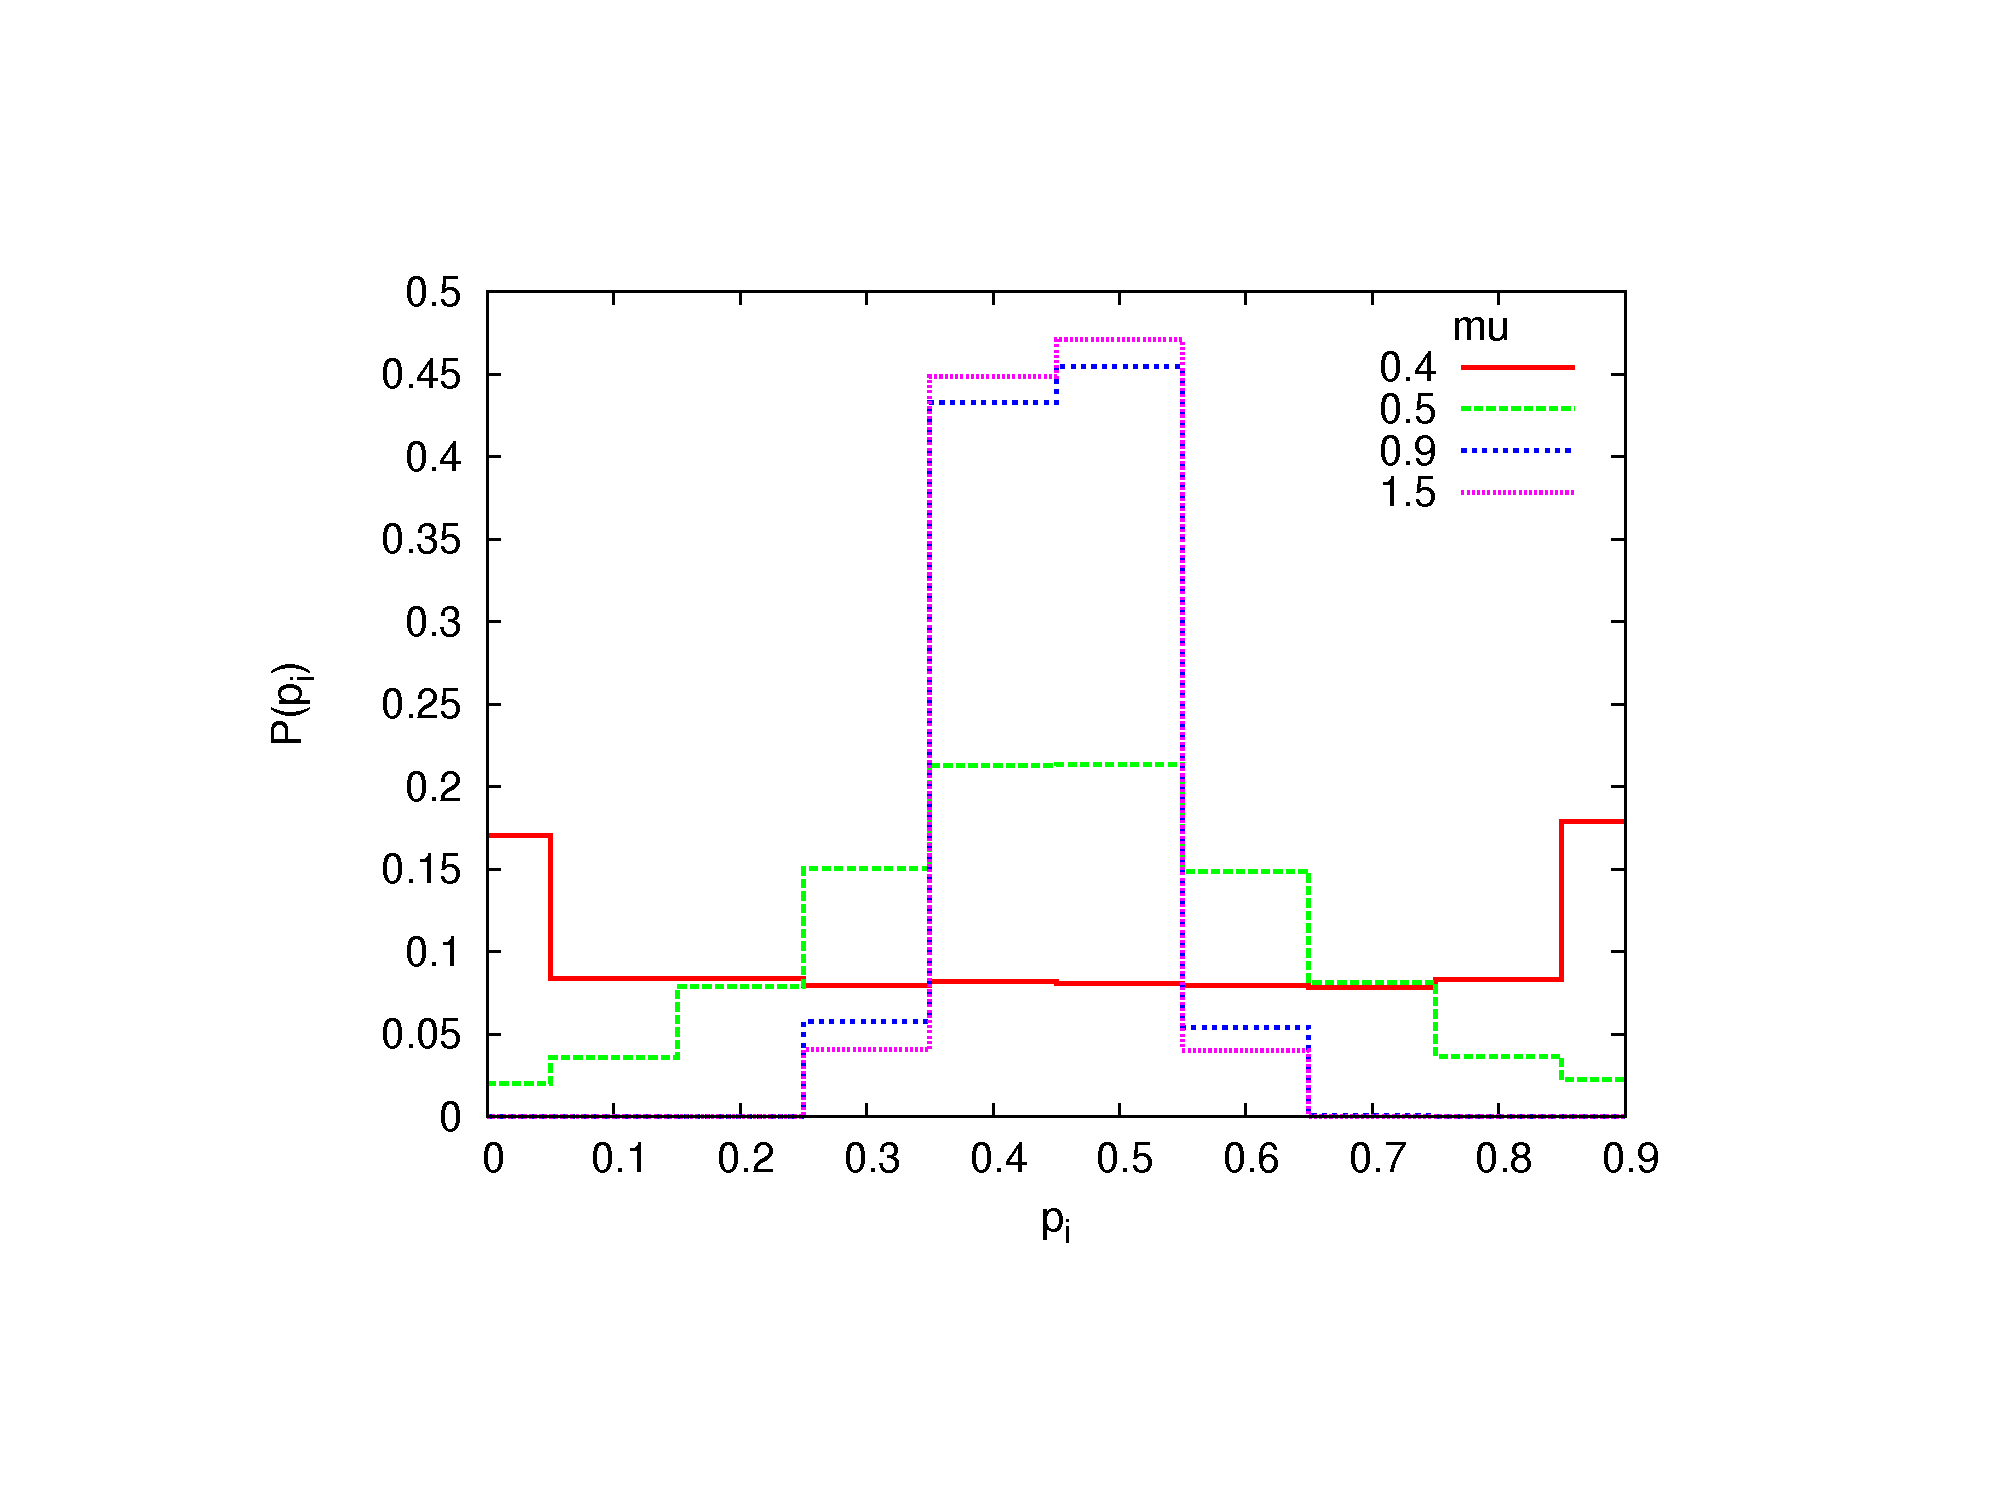
Figure 7. The probability distribution of pi for various capacities μ without interaction between agents, distributed in a random network. 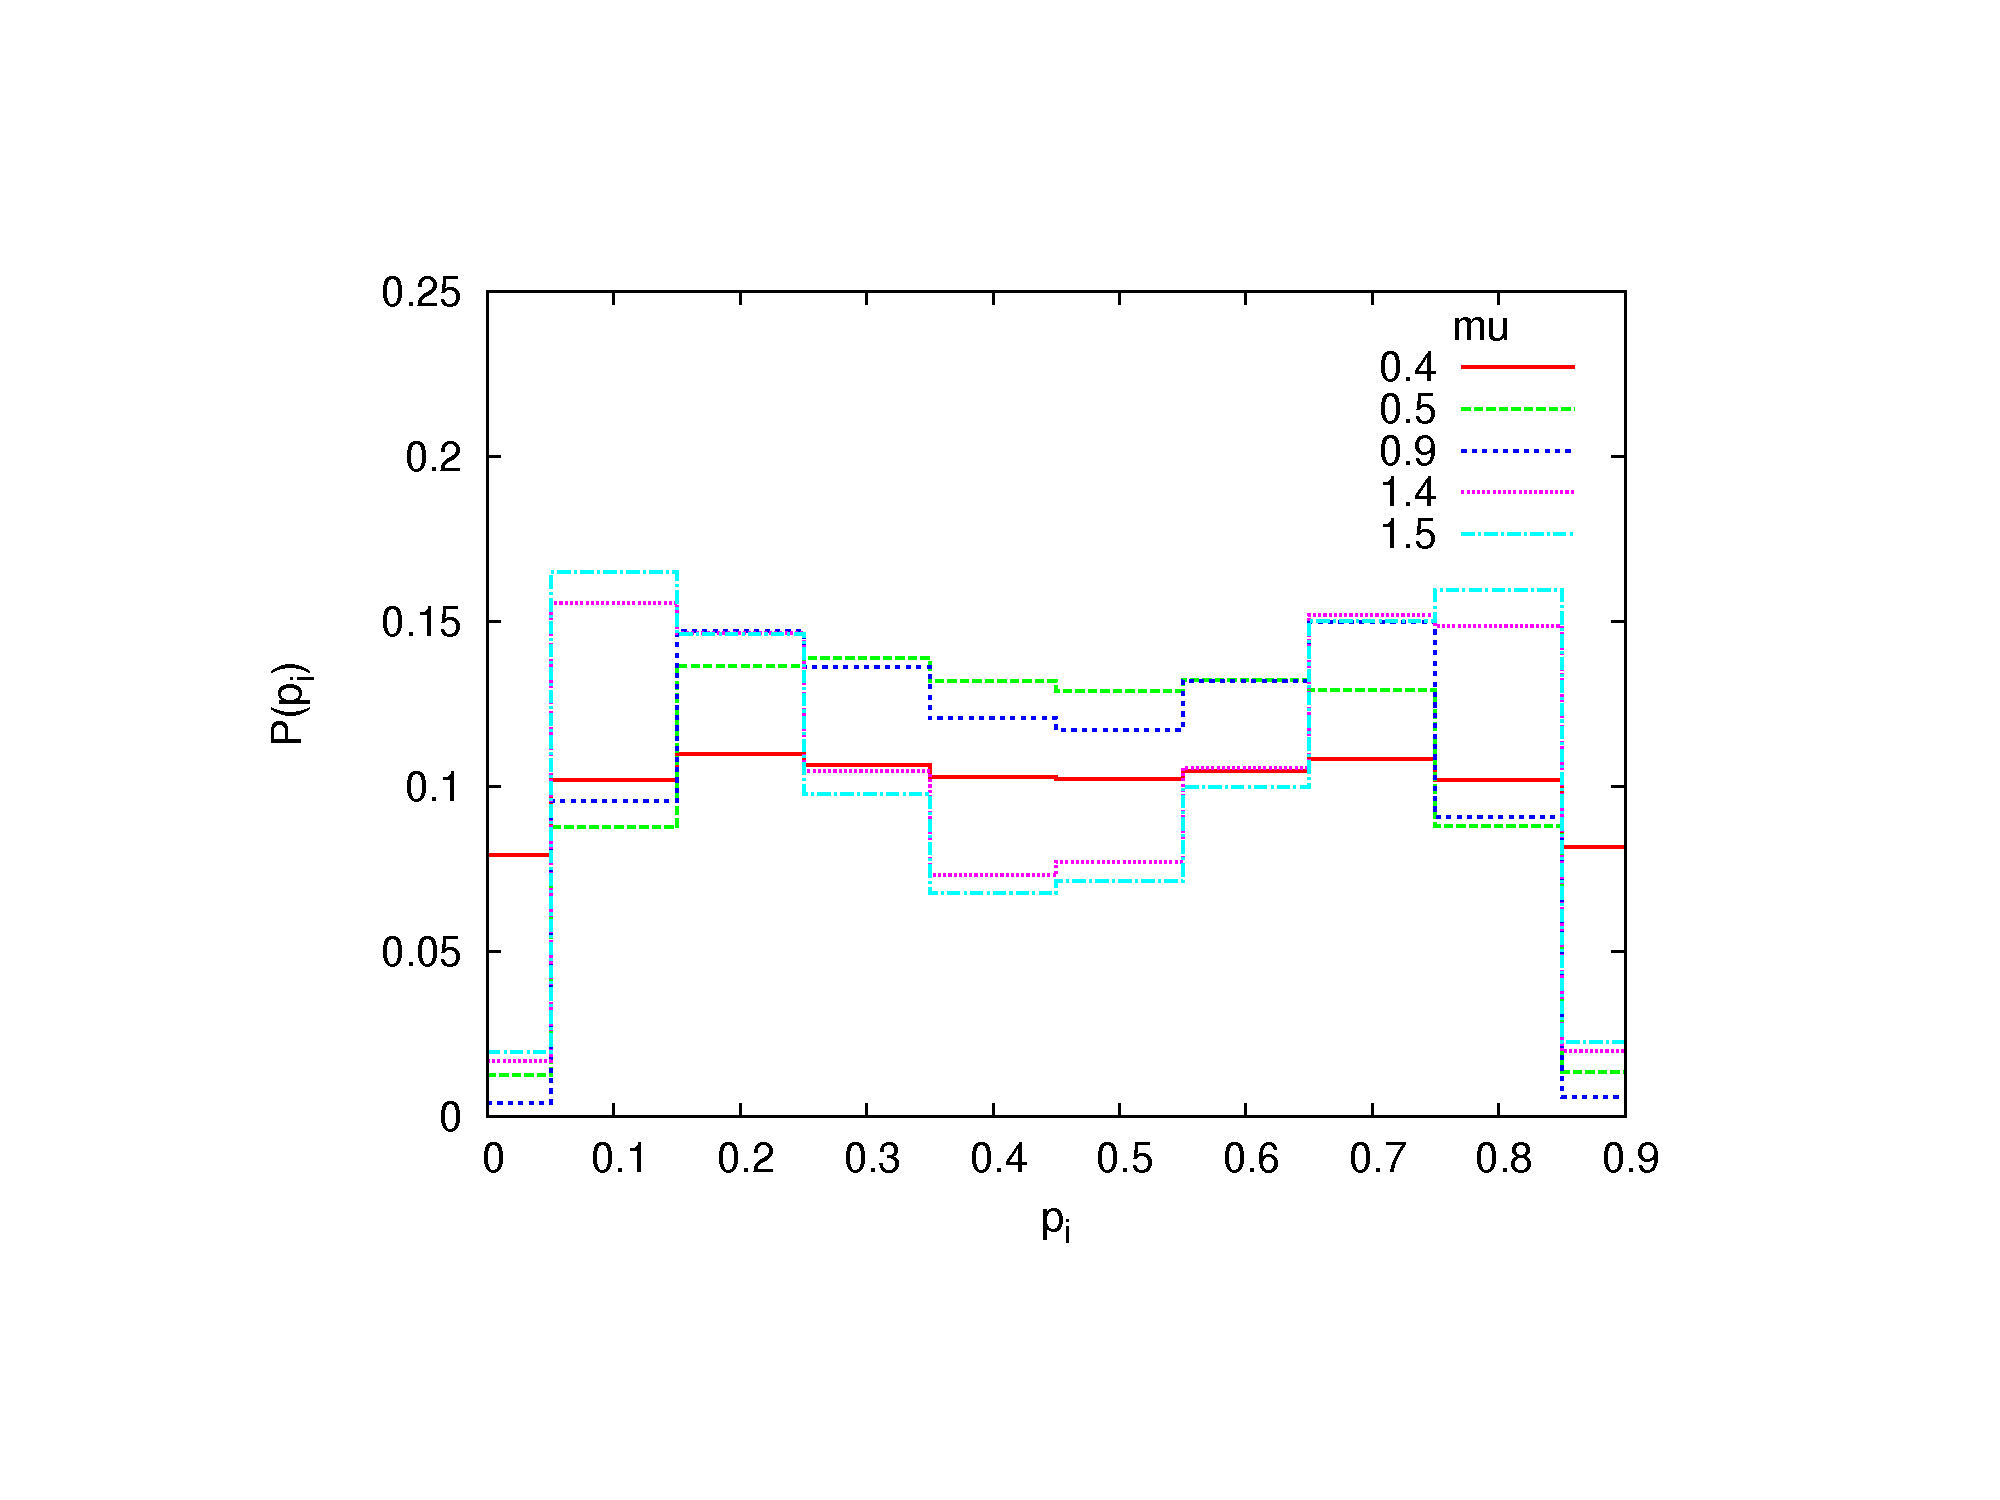
Figure 8. The probability distribution of pi for various capacities μ with interaction between agents, distributed in a random network. - 3.3
- We see that for small μ the interaction has no visible effect; in both cases the histograms show strong maxima for pi ≅ 0 and pi ≅ 1. This means, that for small capacity, the messages produced by the agents are too far to be received. As a consequence, the opinions remain extreme: no doubts, Yes or No with absolute certainty. For large capacity μ the cases without and with the interaction are remarkably different. In the former case, a large maximum is visible at pi ≅ 0.5 for μ = 1.0 and μ = 1.5 (Fig. 5). In the latter case (Fig. 6), this maximum disappears. This result indicates, that in the case of an intensive interaction even the large capacity μ does not prevent opinions from being well established; they are just less extreme, than for small μ.
- 3.4
- For the second variant of the calculations, i.e. agents at nodes of a random network, the mean degree of the network is set to be λ = 5. The results are obtained for 103 agents. As before, the number of messages sent by media is 100. The results are shown in Figs. 7 and 8. As we see, these results are similar to those from the probabilistic variant. We see that in the case of interaction (Figs. 6 and 8) and the largest capacity μ, the opinions close to pi = 0.5 are even less probable than for moderate capacity. This effect is partially due to correlations, what is commented below, and partially—to the lower number of messages from other agents, what causes that fluctuations are damped slower.
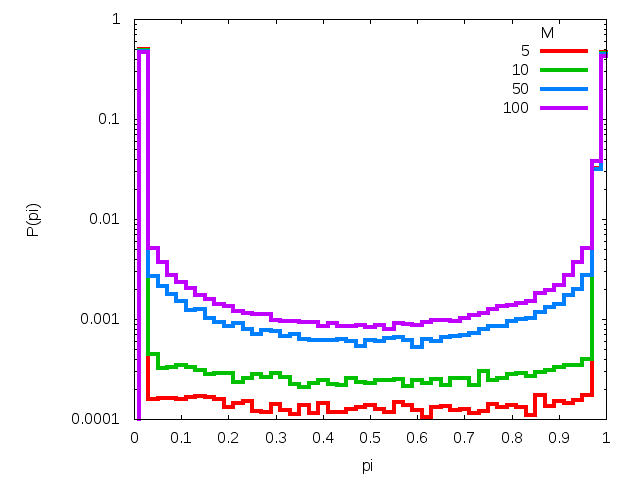
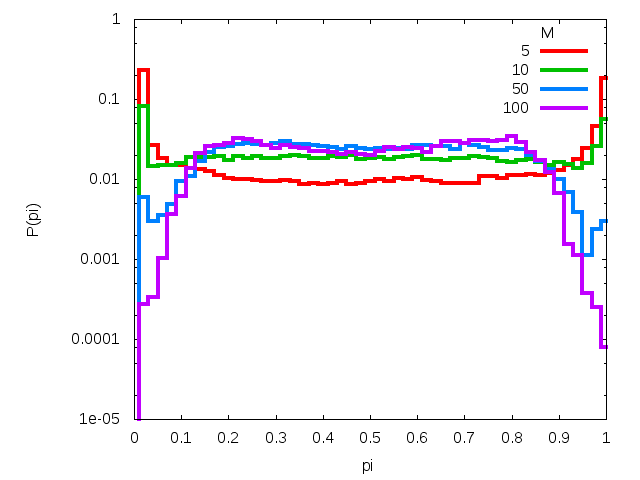
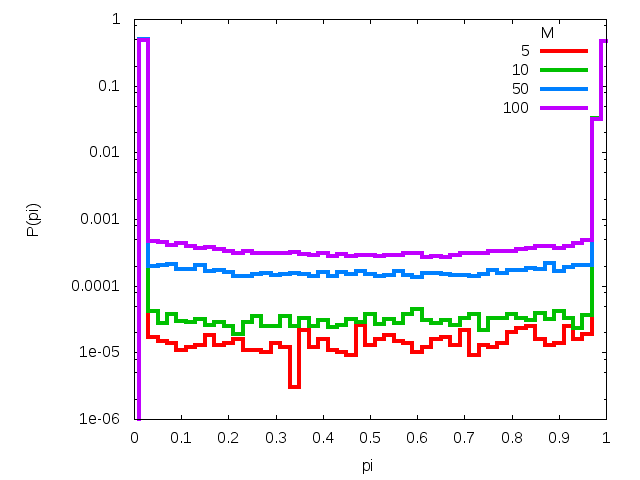
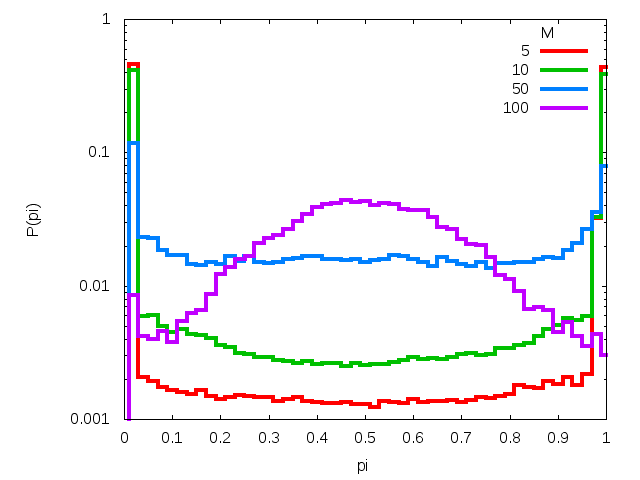
Figure 9. The time evolution of the probability distribution P(pi) for various number of messages M sent to N = 103 agents. Subsequent rows correspond to model with and without interaction among agents. Left column corresponds to μ = 0.1 while right one is for parameter μ equal to 0.5. - 3.5
- In Fig. 9 we show the evolution of the distributions P(pi) with the number M of messages, obtained within the probabilistic variant of calculations. In all cases (μ = 0.1 and 0.5, with and without interaction) shown in the plots we see that as a rule, the initial distribution is composed of two peaks at pi equal zero and one. As M increases, the peaks decrease; however this process leads to one central peak only in the case without interaction where μ = 0.5. Without interaction, the process is too slow to be observed for small M. With interaction, the process is majorized by the tendency to gather all opinions close to a common maximum, which—by fluctuations—is shifted from the plane center. As a consequence of this tendency, the variance of the spatial distribution of messages is small for each agent.
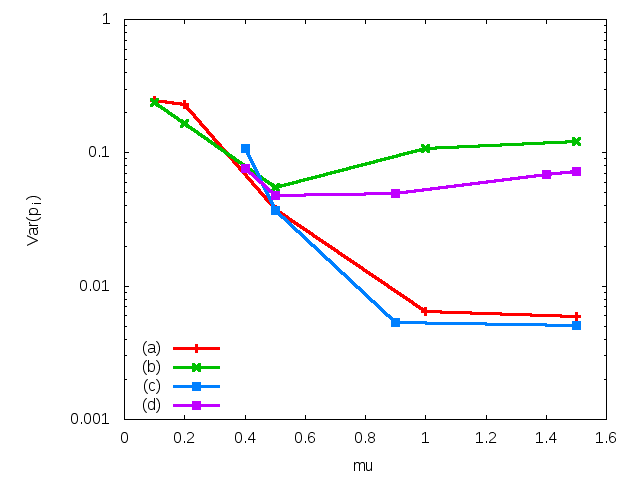
Figure 10. The variance of the probability distribution P(pi) for all variants of the calculations, as dependent on the capacity μ. The data correspond to the probabilistic variant of the calculations (a, b) and agents distributed in a random network (c, d) with (b, d) and without (a, c) interactions between agents. - 3.6
- In Fig. 10 we show the variance of the distribution P(pi) for the probabilistic scheme and for the network, without interactions or with interactions between agents. As all obtained curves P(pi) are close to symmetric with the mean close to 0.5, a small value of variance means that extreme opinions are absent. As we see, this is achieved for large μ without interactions. In the case with interactions, the decrease of the variance with μ is stopped for μ close to 0.5. This means, that the interactions prevent the agents from taking advantage of their large capacity μ. The plots for the probabilistic case and for the network are quantitatively the same. In the latter case, the plots start from μ = 0.4, because the system on a network evolves very slowly when μ is small.
Discussion
- 4.1
- The model presented here deals with the problem formulated by Zaller (1992): how the information provided by media is proceeded in our minds? Although our formulation (Kułakowski 2009) is far from the original version (Zaller 1992), the subject is not changed. From the Zaller's approach, we adopt the picture of agents exposed to a stream of messages. We adopt also the condition of the receipt of a message, formulated in the spirit of Deffuant's (2000) model, i.e. with the criterion of bounded confidence. The action of this criterion depends in the model on the actual state of consciousness of a given agent, encoded by the received messages. We have then the memory effect in the sense that the agents' previous experience influences their behaviour. Further, akin to the approach of Martins (2008) and in accordance with Zaller (1992), the agent's ability to receive new messages increases with his previous experience. Finally, we adopted the Zaller's postulate that opinions are constructed using the ideas most salient for a given agent. Summarizing, the model captures the time evolution of the social system, driven to large extent by the information from media, but also able to display some internal dynamics due to the interaction between agents.
- 4.2
- The most important result of Kułakowski (2009) was, that agents with small mental capacity are more prone to extreme opinions. This result is reproduced here.
- 4.3
- The main aim of this paper is to reveal the role of exchange of information between agents. We have shown that this interaction is not meaningful if the agents have small capacity, as they are in most cases unable to receive the messages. However, if their capacity is larger, the exchange of information between agents leads to the unification of their opinions. As a consequence, their opinions on the considered issues are well established: individual values of pi calculated from Eq. (2) are close to 0.5 only rarely.
- 4.4
- Some aspects of this computational result are natural, but some other are counter-intuitive. It is not a surprise that exchange of information leads to a unification of opinions. The same final state was obtained in the Sznajd model (Sznajd-Weron 2000) and in the Deffuant model (Deffuant 2000); in the latter case, the condition of consensus was that the threshold should be large enough. In our model with the interaction the consensus appears always, if the number of messages is sufficiently large; just the distribution of pi 's gets more and more narrow. This means that the lack of consensus is a transient effect. What is counter-intuitive is that the mean value of pi , equal to 0.5 by symmetry in the absence of interaction, is different from 0.5 when the interaction is present.
- 4.5
- In the model presented here we evade the discussion of infinitely long time, infinite number of agents and infinite number of messages, what is a commonly desired target in statistical mechanics. Instead, we concentrate on transient effects; indeed, society never attains equilibrium. In accordance to this attitude, our simulations on the distribution of pi were performed for rather short number of external messages. We discussed two limit cases: the case when the exchange information between agents is absent, and another case when it is so dense that each agent gets five or ten times more messages from other agents, than from outside. In the second case, the stream of informations obtained by each agent is dominated by the messages from other agents. On the contrary to the first case, these messages are correlated; the correlation is stronger in the case of the network, as only small number (λ = 5 in the average) of agents send messages to each agent. From the mathematical point of view, the origin of the extreme opinions is the random walk of agents in the space of issues. In the case with interaction, the wide spatial distribution of random walkers in the space of issues is replaced by a narrow cloud of a common opinions, imposed by the stream of messages exchanged between agents. For finite time series, the position of this average opinion happens to be out of the coordination center, because of the overall randomness of the system. On the other hand, the messages from agents force the distribution of pi to be very narrow; hence the observed unanimity. The goal of the model is the comparison of two realities, the sociological and the mathematical one. Our thesis is that being exposed to a stream of accidental messages has some similarities to performing a random walk. Then, the first reality can be better understood by discussing the second one.
- 4.6
- If this is true, two conclusions are justified, both dealing with translations of mathematical facts to social reality. First mathematical fact is that the path of correlated random walk (small μ, no interaction) ends more far from the initial position, than when there is no correlation (large μ, no interaction). This, translated to the problem of opinions, means that slow understanding leads to more extreme opinions and less doubts. Second mathematical fact is that an attraction between trajectories of random walkers (large μ, interaction) makes their spatial distribution very narrow, with the mean of this distribution still at random position. This, translated to the problem of opinions, means that strong consensus about some issue in a finite community is always biased with respect to the accessible information on this issue.
- 4.7
- A class of obvious and important facts remain out of scope of our model. More than often, accessible informations are so sophisticated that they remain ignored even by best experts. We have no criterion to evaluate the amount of this kind of information. Further, information from media is never complete and always biased. Again, we have no criterion to measure this bias. Actually the information from media is largely what the audience want to read; the media act then as a generalized demagogue, and the system "media + audience" gets an autonomy as a whole. Media, however, can hardly be described with any kind of statistics. The problem with the bias of media could be cured if the coordination center is chosen arbitrarily, as absolute true. Such a decision needs an opinion about values. Second class contains facts which are not considered in the model, but it is possible to include them. One example is the probability distribution of the capacity μ in a given population. Further, more endowed agents could have more or less opportunities to send messages, or this opportunity could be conditioned by some bias of the message content. More generally, the idea of bounded confidence can be applied to sociological problems of communication, where the message receipt depends on the social status of the sender and of the receiver and on the state of the social bond between them (Scheff 1990). Finally—and this is third class of facts—the model allows to predict some of them. In our opinion, the result that minds more sharp are less prone to extreme opinions does belong to this category. We note also a recent critique of the Zaller model (Dobrzynska 2005), where the original version of the model (Zaller 1992) was confronted with the results of the 1988 Canadian elections. The authors point out that according to the statistical data, the most aware persons do not form their opinions on the basis of their predispositions. This conclusion of Dobrzynska (2005) directly agrees with our main result: most aware persons have no predispositions, if only the mutual exchange of opinions does not repress their mental independence. This indicates, that the criticisms of Dobrzynska (2005) do not apply to our formulation of the Zaller model.
Appendix A
-
Algorithm
REPEAT Nrun times
  {

// initial messages
FOR EACH agent a = 1,Na
    {
    SET RANDOM initial position (x(a,0),y(a,0)) in message space
    SET number of accepted messages n_a = 1
    }

// m  =  message ID, a  =  agent ID, n_a  =  current number of accepted messages by a
// time evolution, gathering new messages
  FOR EACH message m = 1,Nm
    {
    SET RANDOM message position Rm

    FOR EACH agent a = 1,Na
      {
      FOR EACH so far accepted messages j = 1,n_a
        {
        IF(known message j and new message Rm are closer than μ)
          {
          INCREMENT number of accepted messages n_a
          SET message Rm as accepted by agent:
&                 (x(a,n_a),y(a,n_a))  =  Rm
          }
        }
      }
    }

// for model with interaction among agents
IF(interaction beetwen agents)
    {
    FOR EACH agent a = 1,Na
      {
// evaluate `average message' for each agent
EVALUATE average message for the agent a
      xm(a) =  AVERAGE(x(a))
      ym(a) =  AVERAGE(y(a))
      }

// a sends his/her average message to b with probability p
FOR EACH agent a = 1,Na
      {
      WITH probability p
        {
        FOR EACH other agent b = 1,Na
          {
          FOR EACH so far accepted messages j = 1,n_b
            {
            IF(known message j for agent b and average message
&              known to agent a are closer than μ)
              {
              INCREMENT number of accepted messages n_b
              SET message (xm(a),ym(a)) as accepted by agent b:
&                         (x(a,n_b),y(a,n_b))  =  (xm(a),ym(a))
              }
            }
          }
        }
      }
    }

// prepare a histogram
FOR EACH agent a = 1,Na
   {
   FOR EACH accepted by agent message j = 1,n_a
     {
     IF(x(a,j) > 0)
       {
       SET nomin(a) = nomin(a)+x(a,j)
       SET denom(a) = denom(a)+|x(a,j)|
       }
     }
   }

// print histogram
FOR EACH agent a = 1,Na
    {
    INCREMENT histogram(nomin(a)/denom(a))
    }
  }
Appendix B
-
Source code for a probabilistic model of calculations
      program zaller_deffuant

      implicit none
      integer i,j,k,it,n,ibm,nnn,ihist,irun,
     +   NMAX,TMAX,NRUN,NHIST,NSIZE
      real x,y,r1,r2,a,rr,ppp,xm,ym,nomin,denom,ran0
      logical CON
      parameter(CON = .true.,NMAX = 1e3,TMAX = 1000,NRUN = 1,NHIST = 50,
     +   a = 0.1,ppp = 10.0/(1.0*NMAX),NSIZE = NMAX*(TMAX+1))
      dimension x(NMAX,NSIZE),y(NMAX,NSIZE),n(NMAX),xm(NMAX),ym(NMAX),
     +   nomin(NMAX),denom(NMAX),ihist(NHIST)
      data ibm,ihist/1,NHIST*0/

      if(CON) then
         print *,'# with interation among agents, p = ',ppp
      else
         print *,'# without interaction among agents'
      endif

      print *,'# NMAX  TMAX  NRUN  mu'
      print *,'#',NMAX,TMAX,NRUN,a
      print *,'# p             N(p)'
      print *,'#################################################'

      do 999 irun = 1,NRUN

      do i = 1,NMAX
        nomin(i) = 0.0
        denom(i) = 0.0
      enddo

C initial message
      do 001 i = 1,NMAX
        x(i,1) = 2.0*ran0(ibm)-1.0
        y(i,1) = 2.0*ran0(ibm)-1.0
        n(i) = 1
c       print *,x(i,1),y(i,1)
 001  enddo

C it  =  message ID, i  =  agent Id, n(i)  =  current number of accepted messages by i
C - 002 - time evolution, gathering new messages
      do 002 it = 2,TMAX

        r1 = 2.0*ran0(ibm)-1.0
        r2 = 2.0*ran0(ibm)-1.0

        do 003 i = 1,NMAX
          nnn = n(i)
          do 004 j = 1,nnn
            rr = ((r1-x(i,j))**2)+((r2-y(i,j))**2)
            if(rr.le.a*a) then
              n(i) = n(i)+1
              x(i,n(i)) = r1
              y(i,n(i)) = r2
              goto 005
            endif
 004      enddo
 005      continue
 003    enddo

C for model with interaction among agents
      if(CON) then
C evaluate `average message' for each agent
        do i = 1,NMAX
          xm(i) = 0.0
          ym(i) = 0.0
          do j = 1,n(i)
            xm(i) = xm(i)+x(i,j)/(1.0*n(i))
            ym(i) = ym(i)+y(i,j)/(1.0*n(i))
          enddo
        enddo

C `i' sends his/her average message to `j' with probability ppp
        do 303 i = 1,NMAX
          if(ran0(ibm).le.ppp) then
            do 304 j = 1,NMAX
              if(.not.(i.eq.j)) then
                nnn = n(j)
                do 305 k = 1,nnn
                  rr = ((xm(i)-x(j,k))**2)+((ym(i)-y(j,k))**2)
                  if(rr.le.a*a) then
                    n(j) = n(j)+1
                    x(j,n(j)) = xm(i)
                    y(j,n(j)) = ym(i)
                    goto 306
                  endif
 305            enddo
              endif
 306        continue
 304        enddo
          endif
 303    enddo
      endif

 002  enddo

C prepare a histogram
      do i = 1,NMAX
        do j = 1,n(i)
          if(x(i,j).gt.0.0) nomin(i) = nomin(i)+x(i,j)
          denom(i) = denom(i)+abs(x(i,j))
        enddo
      enddo

      do i = 1,NMAX
        j = 1+(NHIST-1)*nomin(i)/denom(i)
        ihist(j) = ihist(j)+1
      enddo

 999  enddo

      do i = 1,NHIST
        print *,(1.0*i)/(1.0*NHIST),ihist(i)
      enddo

      end
Acknowledgements
- This work was partially supported from the AGH-UST project 11.11.220.01 and the FP7 project SOCIONICAL, No. 231288.
References
-
ARONSON E. (1972), The Social Animal, Viking, NY.
BOLLOBÁS B. (2001), Random Graphs, Cambridge UP, Cambridge. [doi:10.1017/CBO9780511814068]
CASTELLANO C., Fortunato S. and Loreto V. (2009), Statistical physics of social dynamics, Rev. Mod. Phys. 81, 591. [doi:10.1103/RevModPhys.81.591]
CLIFFORD P. and Sudbury A. (1973), A model for spatial conflict, Biometrika 60, 581. [doi:10.1093/biomet/60.3.581]
DEFFUANT G., Neau D., Amblard F. and Weisbuch G. (2000), Mixing beliefs among interacting agents, Adv. Compl. Sys. 3, 87. [doi:10.1142/S0219525900000078]
DOBRZYNSKA A. and Blais A. (2005), The RAS model: a simple test, Paper presented at the annual meeting of the American Political Science Association, Marriott Wardman Park, Omni Shoreham, Washington Hilton, Washington, DC, Sep 01, 2005.
EPSTEIN J. M. and Axtell R. (1996), Growing Artificial Societies. Social Science from the Bottom Up, The Brookings Institution, Washington.
EPSTEIN J. M. (2006), Generative Social Science. Studies in Agent-Based Computational Modeling, Princeton UP, Princeton.
FELLER W. (1961), An Introduction to Probability Theory and Its Applications, vol. I, J. Wiley and Sons, NY.
HEGSELMANN R. and Krause U. (2002), Opinion dynamics and bounded confidence: Models, analysis, and simulation, JASSS 5 (3) 2 , https://www.jasss.org/5/3/2.html.
HERMAN E. and Chomsky N. (1988), Manufacturing Consent: The Political Economy of the Mass Media, Pantheon, NY.
HUET S., Deffuant G. and Jager W. (2008), A rejection mechanism in 2D bounded confidence provides more conformity, Adv. Compl. Sys. 11, 529. [doi:10.1142/S0219525908001799]
GALAM S. (2002), Minority opinion spreading in random geometry, Eur. Phys. J. B 25, 403. [doi:10.1140/epjb/e20020045]
KUŁAKOWSKI K. (2009), Opinion polarization in the Receipt-Accept-Sample model, Physica A 388, 469. [doi:10.1016/j.physa.2008.10.037]
LIPPMANN W. (1922), Public Opinion, Harcourt, Brace and Co., New York.
LISTER M., Dovey J., Giddins S., Grant I. and Kelly K. (2003), New Media: A Critical Introduction, Routledge, London.
MARTINS A. C. R. (2008), Continuous opinions and discrete actions in opinion dynamics problems, Int. J. Mod. Phys. C 19, 617. [doi:10.1142/S0129183108012339]
MILLER J. H. and Page S. E. (2007), Complex Adaptive Systems. An Introduction to Computational Models in Social Life, Princeton UP, Princeton.
MCLUHAN M. (1964), Understanding Media: The Extensions of Man, McGraw Hill, NY.
NOWAK A., Szamrej J. and Latane B. (1990), From private attitude to public opinion: A dynamic theory of social impact, Psychol. Rev. 97, 362. [doi:10.1037/0033-295x.97.3.362]
PRAGER D., (no date) http://thinkexist.com/quotations/), Conservatives divide the world in terms of good and evil while liberals do it in terms of the rich and poor.
SCHEFF Th. J. (1990), Microsociology. Discourse, Emotion and Social Structure, The University of Chicago Press, London.
STAUFFER D. (2005), Sociophysics simulations II: opinion dynamics, in Modelling Cooperative Behavior in the Social Sciences, AIP Conf. Proc. 779, 56. [doi:10.1063/1.2008591]
SZNAJD-WERON K. and Sznajd J. (2000), Opinion evolution in closed community, Int. J. Mod. Phys. C 11, 1157. [doi:10.1142/S0129183100000936]
SZNAJD-WERON K. and Sznajd J. (2005), Who is left, who is right?, Physica A 351, 593. [doi:10.1016/j.physa.2004.12.038]
ZALLER J. R. (1992), The Nature and Origins of Mass Opinion, Cambridge UP, Cambridge. [doi:10.1017/CBO9780511818691]