
 Abstract
- Governments have come under increasing pressure to promote horizontal flows of information across agencies, but investment in cross-agency interoperable and standard systems have been minimally made since it seems to require government agencies to give up the autonomies in managing own systems and its outcomes may be subject to many external and interaction risks. By producing an agent-based model using 'Blanche' software, this study provides policy-makers with a simulation-based demonstration illustrating how government agencies can autonomously and interactively build, standardize, and operate interoperable IT systems in a decentralized environment. This simulation designs an illustrative body of 20 federal agencies and their missions. A multiplicative production function is adopted to model the interdependent effects of heterogeneous systems on joint mission capabilities, and six social network drivers (similarity, reciprocity, centrality, mission priority, interdependencies, and transitivity) are assumed to jointly determine inter-agency system utilization. This exercise simulates five policy alternatives derived from joint implementation of three policy levers (IT investment portfolio, standardization, and inter-agency operation). The simulation results show that modest investments in standard systems improve interoperability remarkably, but that a wide range of untargeted interoperability with lagging operational capabilities improves mission capability less remarkably. Nonetheless, exploratory modeling against the varying parameters for technology, interdependency, and social capital demonstrates that the wide range of untargeted interoperability responds better to uncertain future states and hence reduces the variances of joint mission capabilities. In sum, decentralized and adaptive investments in interoperable and standard systems can enhance joint mission capabilities substantially and robustly without requiring radical changes toward centralized IT management.
- Keywords:
- Public IT Investment, Interoperability, Standardization, Social Network, Agent-Based Modeling, Exploratory Modeling
Introduction
- 1.1
- The dominant structural forms in all the governments have been stovepipe organizational units, so information systems have been optimized to form agency-centric vertically integrated systems. As many contemporary policy challenges span multiple policy domains, public organizations have come under increasing pressure to promote horizontal flows of information, work and decision-making across functional boundaries (Agranoff 2003; Kohtamaki et al. 2008). However, studies of networking across jurisdictional boundaries found little to support any illusion that government could be instantly or easily transformed (Fountain 2001; Goldsmith and Eggers 2004; Lazer and Binz-Scharf 2004). Networking governments requires two steps of transformational efforts: 1) efforts to identify complementary systems across agencies and improve their interoperability or reusability, and 2) inter-organizational operation of the interoperable systems to achieve missions effectively.
- 1.2
- Information systems can become interoperable by coupling them either bilaterally (i.e. point-to-point) or multi-laterally (i.e. through a standard middleware). Compared with point-to-point couplings, integration through standard systems can achieve a wide range of interoperability. Centralized management of government-wide information systems can promote cross-agency consolidation of potentially redundant systems into shared services and improve the interoperability of information systems through standard middleware. However, centralized management is disadvantageous to decentralized management (i.e. local control of information systems) in regards to encouraging field offices to understand their unique information needs and allocate scarce resources responsibly, and facilitating user adaptation and innovation (Libicki 2000). In addition, although standardization can achieve a wide range of interoperability, the short-term return on investment may be smaller (i.e. less cost-effective) than that of targeted point-to-point couplings that can achieve performance gains immediately (Kaye 2003).
- 1.3
- After systems become made interoperable, it takes time for potential users to appreciate the complementary values of interoperable systems of other agencies and utilize these systems. Fountain (2002) claims that objective technology and enacted technology need to be distinguished since many intergovernmental information systems have not been productively utilized by government workers. If investment in technological interoperability is not matched with inter-organizational operational capability, interoperable system capacities will be left under-utilized. Although system integration may be managed from a top-down perspective, inter-agency system operations are steered only by a variety of incentives and sanctions because they are carried out by self-governing agencies. Overall, the value gained from investment in standard systems is subject to internal uncertainties (with regards to system integration), external uncertainties (with regards to social demands and technology changes), and particularly interaction risk (with regards to network effects, evolving inter-agency collaborative capability and underlying social networks).
- 1.4
- We have identified two obstacles to cross-agency standardization. First, standardization seems to require individual agencies to give up the autonomies in managing their own systems to allow a central commander to manage them on behalf of them. Second, many uncertain factors affect the values of standard systems, making investment in standard systems a highly risky business. Due to these two barriers, investments in cross-agency standard systems and efforts to build collaborative operational capabilities have been minimally made in most nations.
- 1.5
- To reduce the dilemma between empowering the central managers to assure the cross-agency interoperability and empowering the local managers to responsibly accomplish their unique missions, it is necessary to standardize common systems and interfaces, and to let individual agencies build specialized applications tailored to their own missions on top of these standard systems. Malone (2004) notes that "Rigid standards in the right parts of a system can enable much more flexibility and decentralization in other parts of the system". Only those parts that are identified as involving important economies of scale without undermining the qualities of services need to be standardized, and everything else can be decentralized to suit unique service needs.
- 1.6
- The risks associated with investment in standard systems can be also mitigated by selective and adaptive standardization. The National Task Force on Interoperability (2003) emphasizes the importance of strategic experimentation and adaptive implementation.
Improving interoperability is a complex endeavor. There are no "one size fits all" solutions. It may require agencies and jurisdictions to develop new and improved working relationships and could involve substantial changes in how individual agencies operate in terms of communication. Expect to make progress, but allow adequate time for the progress to be substantial. Sometimes the most progress is made through small steps that test strategies and approaches. (National Task Force on Interoperability 2003)
- 1.7
- This research attempts to test two hypotheses.
- Hypothesis 1:
- Decentralized investments in interoperable and standard systems by autonomous agencies can substantially improve joint mission capabilities.
- Hypothesis 2:
- Although the values of standard systems are subject to various uncertainties, the variances of outcomes generated from standard systems will not increase significantly if investment in standard systems are made modestly and adaptively.
- 1.8
- In sum, decentralized and adaptive IT investments along with modest standardization—without requiring radical changes toward centralized IT management—can improve joint mission capabilities substantially and robustly.
- 1.9
- Kaplan and Norton (2001) list the difficulties of estimating the contribution of information systems to value creation: 1) Improvement in information systems does not directly affect final outcomes but only through chains of cause-and-effect involving two or three intermediate stages. 2) Information systems have only potential value (i.e. system development cost is a poor approximation of any realizable value), and organization process are required to transform this potential value to realized value. 3) The value of a system is interdependent with that of the systems with which it is networked. These difficulties are especially evident with standard systems that indirectly affect a wide range of systems and inter-organizational processes. Despite many manuals for IT investment, investments in improving interoperability and building standard systems have rarely benefited from the simulation of adaptive policy implementation.
- 1.10
- This research attempts to validate the long-term dynamic effects of decentralized and adaptive investments in interoperable and standard systems, using an agent-based modeling methodology that simulates the uncontrolled dynamics that independent actors in a network may interactively create. As shown in Table 1, the ultimate outcome of IT investment is 'joint mission capability', but not interoperable system capacity that is just intermediate output. Although a production function for joint mission capabilities is given as an exogenously imposed system of equations, each agency is designed to autonomously and interactively determine its own IT portfolio, standardization policy, and system operation (no central commander controls information systems of individual agencies). The productivity of interoperable systems will be explicitly modeled as an endogenous social network function instead of being left as exogenously given parameters. Exploratory modeling—by varying the highly uncertain parameters for technology progress, interdependencies, and inter-agency system utilization—will test the robustness of each policy alternative in terms of the variances of outcomes.
Table 1: Strategic Hypotheses of Key Measures, Policy Levers and Underlying Uncertainty Ultimate Outcomes Intermediate Outputs Long-term Drivers Measures
Joint
Mission capabilitiesInteroperable capacities (information capital)
Productivities
(social capital)Standard capacities
System utilization ratesExogenous Uncertainty Citizens' priorities of mission capabilities Interdependencies among systems for missions Technology advance,
Social network densityRelationships Production function,
System utilization functionTechnology diffusion,
Social network driversPolicy Levers IT investment portfolio Standardization,
Organizational incentives
 Assumptions for Network Economics
-
Overview and Relationships
- 2.1
- This study implements an agent-based computational simulation using 'Blanche' software (version 4.6.5)[1]. The objects that make up a model are nodes, attributes, and relations. A node represents a government agency, and an attribute is a numerical value that defines a property of a node. Each node has heterogeneous attributes. A relation is a set of numerical values that define interactions among N nodes using an N by N matrix. Each relation has an equation that describes how its interactions with other autonomous agents mutually and endogenously change over time. For instance, agencies often do not sufficiently invest in coupling complementary but highly disparate systems of other agencies due to limited awareness and difficulty in integrating incongruent systems. Even after systems of other agencies become technically interoperable, the limited understanding about how data are created and used may still constrain their utilization. Hence, the degree of similarity between agencies can affect not only the investment in improving interoperability but also the readiness to utilize interoperable systems across agencies.
- 2.2
- By referring to the Business Reference Model of the U.S. Federal Enterprise Architecture (OMB 2005), this modeling exercise defines 20 agencies as an illustrative body of the federal government. Each of 20 agencies builds its own system to serve its distinct mission[2]. The system of the i-th agency will be hereafter called the i-th system, and the mission of the j-th agency will be hereafter called the j-th mission ({i ∈ N : 1 ≤ i ≤ 20} and {j∈N : 1 ≤ j ≤ 20}).
- 2.3
- This study will model heterogeneous relations (including network benefits and coupling costs) among systems that have heterogeneous service attributes and levels. Network benefits and coupling costs among 20 systems will be unevenly and asymmetrically distributed, and described using discrete and non-parametric 20 by 20 matrices.

Figure 1. Matrix of Interdependencies among Systems and Missions of 20 Agencies
(The Department of Interior has identified complex interdependencies among multiple agencies and multiple missions as the matrix of binary values. By referring to this matrix, the contributions of complementary systems to missions are scored between 0 and 5, and the contributions of the own systems (diagonal cells) are scored as 20. Then, these scores are normalized to the relative contribution of the i-th system to the j-th mission (wi.j).) - 2.4
- Figure 1 illustrates the matrix of interdependent network benefits—i.e. the relative contributions of the i-th system to the j-th mission (denoted as wi.j). Coupling costs are derived from disparity between systems (denoted as di.q). The sophistication levels for the i-th system (denoted as Pi.q) are assessed along 11 service attributes (e.g. citizen services, e-Business, multimedia data, and technology level), and disparities between the i-th and the j-th system are calculated as: dij = Σq=111(Max(Pi.q—Pj.q , 0)).
Network Values: Production Function of Mission Capabilities
- 2.5
- We now introduce the concept of a core system which is defined as the unique system of an agency to serve its own principal mission. The service level of the core system will be called 'core (system) capacity', and the core system capacity of the i-th agency will be denoted as xi. A core system can also generate complementary values to other agencies serving different missions. However, heterogeneous core systems are incompatible with each other, so middleware or interfaces are needed to make a core system interoperable with another core system. 'Interoperable capacity' of the i-th system for the j-th mission (denoted as xi,j i ≠ j) is a portion of the core system capacity of the i-th agency that is interoperable with the core system of the j-th agency (i ≠ j) and hence contributable to the j-th mission (see Figure 3).
- 2.6
- The mission capability (Uj) in this exercise is jointly produced from a core system and nineteen interoperable systems that are operated through inter-agency interactions. A multiplicative (as opposed to additive) functional form is adopted to model the interdependent effects among heterogeneous systems. The relative contributions of the i-th system to the j-th mission (denoted as wi.j) are assumed to be exogenously given. This production function is assumed to exhibit constant returns to scale (i.e. Σ i=120 wij = 1). The mission capability equation for the j-th mission, denoted as Uj, is given by:
Uj = Aj x1.j w1.j x2.j w2.j x3.j w3.j … x20.jw20.j (1) - 2.7
- Aj represents the total factor productivity, that is, the joint productivity of the twenty interdependent systems. To define the total factor productivity, the concept of an 'enacted (or activated) interoperable capacity' (denoted as exi,j) is introduced. Technically interoperable capacity (xij.t) can be transformed to enacted interoperable capacity through organizational efforts to utilize interoperable systems across agencies. That is, the gap between the current technically interoperable capacity (xij.t) and the previous enacted interoperable capacity (exij.(t-1)) is filled by adding the utilization rate (denoted as φij ; 0 ≤ φij ≤ 1) times the gap at each time step. As a dynamic model, time step is indexed using subscript "t".
exij.t = φij.t (xij.t - exij.(t-1)) + exij.(t-1) = φij.t xij.t + (1 - φij.t) exij.(t-1) (2) - 2.8
- This utilization rate will be defined using social network parameters as shown in equation (10). Productivity of a given agency will be higher when the agency is more innovative (measured by technology level) and more actively utilizing interoperable capacities. Hence, this exercise defines productivity as a function of technology levels and enacted interoperable capacities. The productivity equation for the j-th mission is given by (0 ≤ Aj ≤ 1):
Aj = w1.j (ex1.j / x1.j ) + … + wj.j (Techj / Techmax) + … + w20.j (ex20.j / x20.j ) (3) Cost Functions for Investment Alternatives
- 2.9
- A total federal IT budget (denoted as Mt) is allocated to core system capacities (Mi.t), interoperable capacities (Mi.j.t i ≠ j), mission-centric standard capacities (Mall.j.t) and government-wide standard capacities (Mall.all.t). A cost function converts budgets (money) into system capacities. This exercise assumes that system capacities incrementally expand as sequential modules over time (i.e. xi.j.t = C-1(Mi.j.t) + xi.j.t-1).
- 2.10
- This exercise assumes that the cost of developing core system capacity is a convex function with an inverse of evolving technology level (which will be defined in equation 11).

(4) - 2.11
- Core systems of other agencies can be reused via bilateral point-to-point interfaces. Developing an interface to couple and reuse an existing system is assumed to be scale-independent, so the coupling cost is defined as a linear function of interoperable capacity and distance with an inverse of evolving technology level.

(5) - 2.12
- In order to fully couple 20 systems with bilateral point-to-point interfaces, 380 (=20 × 19) interfaces are needed. Alternatively, mission-centric or government-wide standard systems may be built. The cost of developing a standard system is assumed to be proportional to the needed scope to cover the given heterogeneity. The needed standard scope for a mission-centric interoperability, Sj, is defined as the sum of the distances between the j-th agency and all other agencies. The needed standard scope for a government-wide common standard, Sall, is the sum of distances between the maximum (Pmax.q) and the minimum (Pmin.q) across 11 service categories.

(6) (δ : the rate of cost saving due to standardization (0<δ<1)[3] )

(7) - 2.13
- While building a standard system is at least Si or Sall times as costly as building non-standardized incompatible systems, doing so saves additional investments in numerous point-to-point interfaces since it is designed to be interoperable with all other systems. The mission-centric standard capacity is added to all of 19 interoperable capacities for a given mission (xi,all i ≠ j), and the government-wide standard capacity is added to all of 380 interoperable capacities (xall,all i ≠ j).
- 2.14
- In sum, core system capacity and interoperable capacity build up over time as follows:

(8) 
(9)
Agent-based Modeling of Network Dynamics
- 3.1
- Network-centric public services are realized through investment in and operation of cross-agency interoperable capacities. Using an agent-based modeling framework that combines network economics and social network analysis, this exercise will simulate not only the effects of inter-agency IT investment policy levers but also the effects of inter-agency system operation policy levers to better understand the co-evolution between technology and organization. Particularly, social network analysis methodology will be applied to model inter-agency collaborative operation, i.e. the uncontrolled dynamics that independent actors in a network may interactively create.
Social Network Drivers
- 3.2
- Because the organizational mechanism of intergovernmental operations is complex and many factors influence it, this exercises adopts the multi-theoretical, multi-level social network modeling approach (Monge and Noshir 2003). Various social network theories have attended to a wide range of variables such as social influence, power, diffusion, economic exchange, social cohesion, knowledge management and social capital (Katz and Lazer 2002). Multiple theories can jointly improve an explanation of network evolution. Multiple levels of analysis are also needed because network properties exist at the individual, dyad, triad, and global network levels (e.g. reciprocity at the dyad level and transitivity at the triad level).
- 3.3
- In the absence of empirical data on inter-organizational operation of a standard system, this exercise will simulate the hypothetical effects of six social network drivers (similarity, reciprocity, centrality, mission priority, interdependencies, and transitivity) to illustrate how autonomous agents operate them in a decentralized environment over time.
- 3.4
- In the case of the first characteristic, social networks can be biased toward similarity (e.g. technical and semantic similarity) since similarity may ease communication and increase the predictability of behavior. In the case of the second, reciprocity often plays an important role in building trust in non-hierarchical relationships. In the case of the third, centrality in relations is important. Barabasi and Bonabeau (2003) assert that preferential attachment (or the "rich get richer" process) explains the growth of hubs. That is, new nodes tend to connect to popular nodes, so the hubs acquire even more links over time than the less connected nodes. In the case of the fourth, agencies may tend to build more social links with other agencies in charge of more socially demanded missions. In the case of the fifth, an agency may build more social links with other agencies that operate highly complementary systems. Finally, an agency may develop relationships with another agency through other (intermediary) agencies that have close ties with that agency. This indirect relationship is called 'transitivity', and this may help extend social networks with other agencies.
- 3.5
- This exercise defines the utilization rate (denoted as φij) of the interoperable capacity xi,j as a function of these six social network drivers between the i-th agency and the j-th agency:
φij = (φ1.ijκ1 φ2.ijκ2 φ3.ijκ3 φ4.ijκ4 φ5.ijκ5 φ6.ijκ6 )τ(0 ≤ φij ≤ 1) (10) (τ: scale factor; κk: weight of the k-th factor)
- 3.6
- These six factors are powered by weights (denoted as κ1~κ6) and multiplied together to construct the inter-agency system utilization rate function. Inter-agency system operation policy is assumed to affect these weights to six factors. The multiplied value of the six factors is between 0 and 1, so when the scale factor (denoted as τ) in the exponent is less than one, the utilization ratio becomes magnified.
Technology Innovations and Diffusions
- 3.7
- The technology equation consists of an innovation equation and an imitation equation in a continuous scale. Technology level for the i-th agency (Techi.t) is defined as:
Techi.t = TechInovi.t-1 × Techgri + Σj=120((exji / Σ exji) × φij × Max(Techj(t-1) -TechInovi.t , 0)) (11) - 3.8
- The technology innovation equation (denoted as TechInovi.t) assumes that agencies build up technology level with heterogeneous technology growth rates (denoted as Techgri ; 1.05 ≤ Techgri ≤ 1.105). While agencies with higher technology growth rates build up their technology levels on their own, other agencies catch up with them through imitation. Social network plays an important role in technology diffusion, so the technology imitation equation includes the utilization rate φij . The technology imitation function is the weighted average of the technology gaps multiplied by the utilization rates (weighted by exji / Σ j=120exji). While different innovation capacities widen technological distance over time, technology imitations reduce technological distance.
Defining Policy Alternatives
- 4.1
- This modeling exercise aims to simulate the joint effects of three policy levers (IT investment portfolio, standardization, and inter-agency operation). For IT investment portfolio lever and inter-agency operation policy lever, this study will compare 'agency-centric (or supplier-centric)' and 'mission-centric (or citizen-centric)' approaches.
- Agency-centric vs. Mission-centric IT investment portfolio: Individual agencies allocate a given budget to the development of not only their own systems but also interfaces and middleware that couple complementary systems of other agencies. The investment portfolio is often biased toward their own systems and linkages with similar systems, and this study will call such a biased portfolio 'agency-centric'. When the investment portfolio is aligned with the optimal interdependencies without bias, such portfolio will be called 'mission-centric'.
- Agency-centric vs. Mission-centric operation of interoperable systems: This study assumes that six social network drivers jointly determine inter-agency system operation. When similarity and reciprocity are dominant drivers, this study will call such operations 'agency-centric'. When cross-agency interdependencies and transitivity are dominant drivers, such operations will be called 'mission-centric'.
- Bilateral coupling vs. Multi-lateral standardization: With bilateral coupling alternatives, complementary systems are integrated via point-to-point interfaces. Standardization can be made for specific missions (e.g. public safety, and healthcare) or for government-wide shared services and protocols (e.g. next-generation Internet protocol, authentication, and information security). Standardizing government-wide shared services requires a high level of cross-agency coordination.
- 4.2
- This exercise derives five alternatives (Alt0 - Alt4) as joint implementation of three policy levers. Alt0 is a business-as-usual ('do-nothing') policy that maintains 'agency-centric IT investment portfolio with no investment in standard system and agency-centric operation of interoperable systems'. Since it provides a baseline for evaluation of the joint effects of three policy levers, it will be called 'baseline policy'. Alt1, Alt2 and Alt3 are 'do-something' alternatives that implement one or two policy levers. Alt4 is a comprehensive ('do-everything') policy that implements mission-centric IT portfolio and operation with modest investment in not only mission-centric standard systems but also government-wide standard systems.
- 4.3
- All the five policy alternatives are implemented using the same amount of federal IT budget (Mt), and the federal budget is allocated to the j-th agency according to its mission weight (i.e. Mj.t = wj.t Mt)[4]. Decision variables for each agency to implement three policy levers are: 1) Mi.j.t, 2) Mall.j.t, Mall.t and 3) κ1~κ6 in φij.
- 4.4
- The baseline policy (Alt0) allocates the budgets proportionally to each system's contribution weights and the inverse of distance (Mi.j.t ∝ wi.j.t / dijt). On the other hand, the other alternatives implement the mission-centric IT portfolio policy by allocating the budgets proportionally to the system's contribution weights (Mi.j.t ∝ wi.j.t)[5]. On top of the mission-centric IT portfolio policy lever, four alternatives (Alt1-4) are generated as the combinations of the two longer-term drivers: standardization policy and inter-agency operational policy (see Table 2).
Table 2: Characteristics of Four Alternative Mission-centric IT Investment Portfolio Policies Operation Integration Within Boundary
(reinforcing fragmentation)Across Boundary
(promoting cross-agency collaboration)No Standardization Alternative 1 :
• No standard system
• Inflexible budget reallocation
• Homophily, Reciprocity, Inequality in relationsAlternative 3 :
• No standard system
• Flexible budget reallocation
• Promoting social network and demand-driven system operationModest Standardization (reallocates modest portion of budgets to the development of standard systems) Alternative 2 :
• Mission-centric standard systems
• Inflexible budget reallocation
• Homophily, Reciprocity, Inequality in relationsAlternative 4 :
• Government-wide standard systems
• Flexible budget reallocation
• Promoting social network and demand-driven system operation - 4.5
- Standardization policies (Alt2 and Alt4) allocate a small portion (five percent[6]) of IT budgets to the development of standard systems. While Alt2 (agency-centric operation) builds only decentralized mission-centric standard systems (Mall.j.t=.05 Mj.t), Alt4 (mission-centric operation) is assumed to build coordinated government-wide standard systems (Mall.t=.02 Mt) as well as decentralized mission-centric standard systems (Mall.j.t=.03 Mj.t).
- 4.6
- The inter-agency operational policy lever is simulated using two sets of weights assigned to the six social network drivers in the system utilization equation (κ1~κ6 in φij) as shown in Table 3.
* Degree centrality measures the number of incoming and/or outgoing connections with others.Table 3: Social Network Drivers and their Contribution Weights to Utilization Rates Social Network Drivers κ1~κ6 in φij Agency-centric system operation
(Alt0,1&2)Mission-centric system operation
(Alt3&4)Relative Distance between the i-th and j-th agency (=dmin/dij) 0.3 0.1 Relative Reciprocity in relations with j-th agency (=exji/exmax) 0.2 0.1 Relative Degree Centrality* of j-th agency (=centj/centmax) 0.2 0.2 Relative Priority of the j-th mission (=wj/wmax) 0.1 0.1 Relative Contribution of the i-th system xij (=wij/wmax) 0.1 0.3 Relative Transitivity in relations (i-k-j)** 0.1 0.2
** The transitive relations of the i-th agency with j-th agency via all other (intermediary k-th) nodes are computed as trij = .05 Σk=120 (exik + exkj)/2. They are averaged across k (weighted by the value of links with intermediary node k). Relative transitive relations are computed as (trij / exij).
Results of Agent-based Modeling of Network Dynamics
- 5.1
- This exercise adopts a cost-effectiveness analysis framework that searches for the maximum effectiveness subject to a given budget. The key measure of effectiveness is joint mission capability at the final period. Each mission capability (Uj) is defined as an independent building-block, and the joint value of mission capabilities is defined as the weighted average: Σ j20 wjUj. The mission weights (i.e. the relative importance of mission j; denoted as wj) are assumed to be exogenous[7] and normalized ( Σ j20 wj = 1).
Each time step represents one year, and this exercise runs for 20 time steps to simulate long-term effects. Figure 2 shows the evolution of the average system capacities, productivities, and mission capabilities generated from this simulation. The mission-centric IT portfolio with mission-centric standards (Alt2) builds much larger interoperable capacities than bilateral coupling policies (Alt0,1&3), and the mission-centric IT portfolio including both mission-centric and government-wide standards (Alt4) achieves by far the largest interoperable capacities. Productivities rapidly drop with the upsurge of interoperable capacities generated from standardization (Alt2&4) in the early periods, but productivity soon rebounds with the mission-centric operation policy (Alt4).
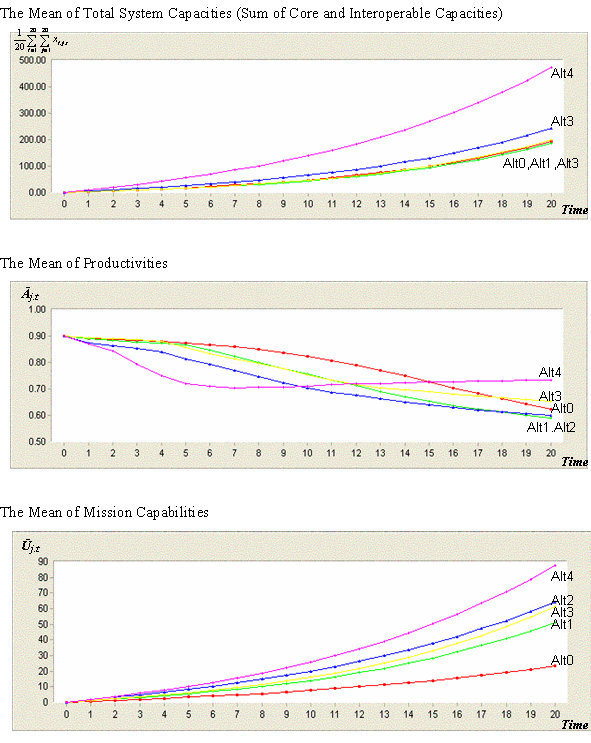
Figure 2. Evolution of System Capacity, Productivity, and Mission Capability - 5.2
- A remarkable enhancement of the joint mission capabilities beyond the baseline level (Alt0) comes from the adoption of mission-centric IT portfolio policy (Alt1) through its better alignment with the optimally diversified system portfolio. Once the mission-centric IT investment portfolio policy is implemented, either standardization (Alt2) or mission-centric operation (Alt3) increases the mission capability further. When investment in standard systems and mission-centric operation are simultaneously implemented (Alt4), their joint effects on joint mission capabilities are substantially improved through positive feedback loops between interoperable capacities and productivities over time. The gain of alternative 2 over alternative 1 is 26%, the gain of alternative 3 over alternative 1 is 20%, and the gain of alternative 4 over alternative 1 is 71% (far exceeding the sum of the gains from alternative 2 and 3). Nonetheless, this gain of mission capabilities (71%) is not as dramatic as the gain of interoperable system capacities (152%) due to the untargeted expansion of interoperable capacities by standardization.
- 5.3
- The graphs and matrices in Figure 3 present the technically interoperable capacities (xi,j) and enacted (activated) interoperable capacities (exi,j) generated from the simulation exercise. While the sum of activated interoperable capacities (1340) by the DOD with all other agencies is just four times its core system capacity (381), the sum of activated interoperable capacities (484) by the GSA far exceeds ten times its core system capacity (36). This shows that agencies in charge of government-wide common management and support functions can create more values from expanding and activating inter-agency interoperable systems rather than from building its own core system capacities.
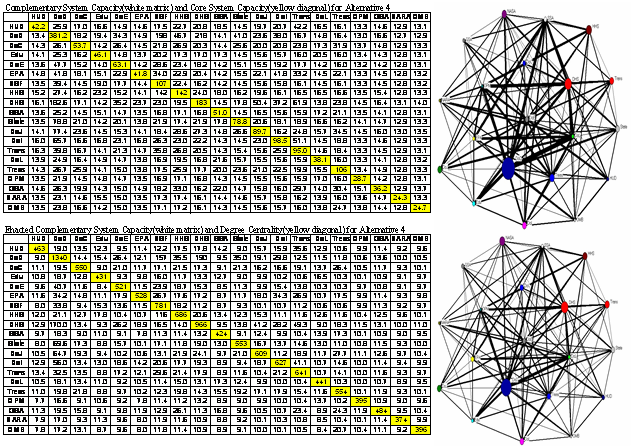
Figure 3. Interoperable System Network and Activated System Network (Alternative 4 at time=20; presented using the UCINET software)
In the above matrix and graph, the diagonal cells and the node sizes represent the core system capacities, and the non-diagonal cells and the thicknesses of arcs represent the interoperable capacities. Likewise, in the below matrix and graph, the diagonal cells and the node sizes represent the degree centrality (i.e. the sum of all the links) of each agency, and the non-diagonal cells and the thicknesses of arcs represent the activated(enacted) interoperable capacities.
Exploratory Modeling for Assessing the Robustness
-
Identifying Critical Uncertainties and Generating Scenarios
- 6.1
- Some of parameter values adopted in the previous simulation exercise are in fact highly uncertain. The priorities citizens assign to various missions may change as economic and social environments evolve. Technology progress is hard to predict precisely. The interdependencies among complementary systems for mission capabilities also continue to change. The inter-governmental relations such as technology diffusion and social networking among federal agencies are very complex. All these uncertain parameters jointly affect the robustness of final outcomes.
- 6.2
- Since policy-makers and citizens are often risk-averse, reducing the sensitivity of outcomes against varying parameters are as important as increasing the levels of the most likely outcomes for each alternative. This exercise hypothesizes that technology development, mission priority, system-mission interdependency, and system utilization rate are the most uncertain factors.
- 6.3
- The baseline parameters values used in the previous section are: the scale factor (τ) in the utilization rate equation = 1, the average technology growth rate = 7.5%, and the increasing weights to complementary systems (wi,j i ≠ j) [8]. By taking advantage of both parametric and probabilistic exploratory modeling in a complementary way (as shown in Table 4), this study will test the robustness of policy alternatives. Parametric exploratory analysis will generate 18 scenarios as the combination of multiple values for three uncertain parameters. Probabilistic exploratory analysis will generate 100 simulations as the combination of parameter values randomly drawn from the probabilistic distribution functions.
* Given the lock-in effects arising from network standards, information technologies are more likely disruptively leaping than incrementally improving. Hence, the probabilistic modeling of technology innovation equation will adopt a Poisson distribution function.Table 4: Values for Uncertain Parameters Parametric modeling Probabilistic modeling Weights of the i-th systems for the j-th mission (wi,j i ≠ j) Constant, and
Increasing (1% annual growth)N(1.01, 0.03): normal distribution Technology growth (Techgri) 4%, 7.5% and 11% on average Poisson distribution*
(μ = σ =7.5%)The scale factor (τ) of the utilization rate function** 0.5, 1, and 1.5 N(1, 0.05) Weights of missions (wj) N(1, 0.03)
** Since the utilization rate lies between 0 and 1, a higher exponent means a lower utilization scenario. High scale factor of the utilization rate function may mean that social capital across agencies is high.Parametric Exploratory Modeling
- 6.4
- Figure 4 shows the weighed average of mission capabilities. The robustness of each alternative can be measured in terms of the coefficients of variation (= standard deviation / mean). The coefficients of variation across 18 scenarios for five alternatives are : 28.3% (Alt0), 33.6% (Alt1), 29.9% (Alt2), 30.7% (Alt3), and 25.6% (Alt4). The outcomes of most mission-centric IT investment portfolio alternatives (Alt1-Alt3) turn out to be more sensitive to various uncertainty factors than the baseline scenario. However, the comprehensive policy including modest investment in government-wide standard systems (Alt4) minimizes the coefficient of variation while maximizing the expected values.
Probabilistic Exploratory Modeling
- 6.5
- The probabilistic exploratory modeling has generated stochastically-evolving mission priority weights (wj) and system's relative contribution weights (wi.j) over time. To respond to changing mission weights over time, budget allocation has been adaptively made proportional to the magnitude of gaps between the desirable portfolio and the current portfolio.
- 6.6
- Standardization policies (Alt2&4) mitigate the coefficients of variation of the interoperable capacities, and the mission-centric operation policies (Alt3&4) mitigate the coefficients of variation of the productivities. Again, as shown in Figure 5, the comprehensive policy including modest investment in government-wide standard systems (Alt4) minimizes the coefficient of variation of the mission capabilities while maximizing their expected outcome.
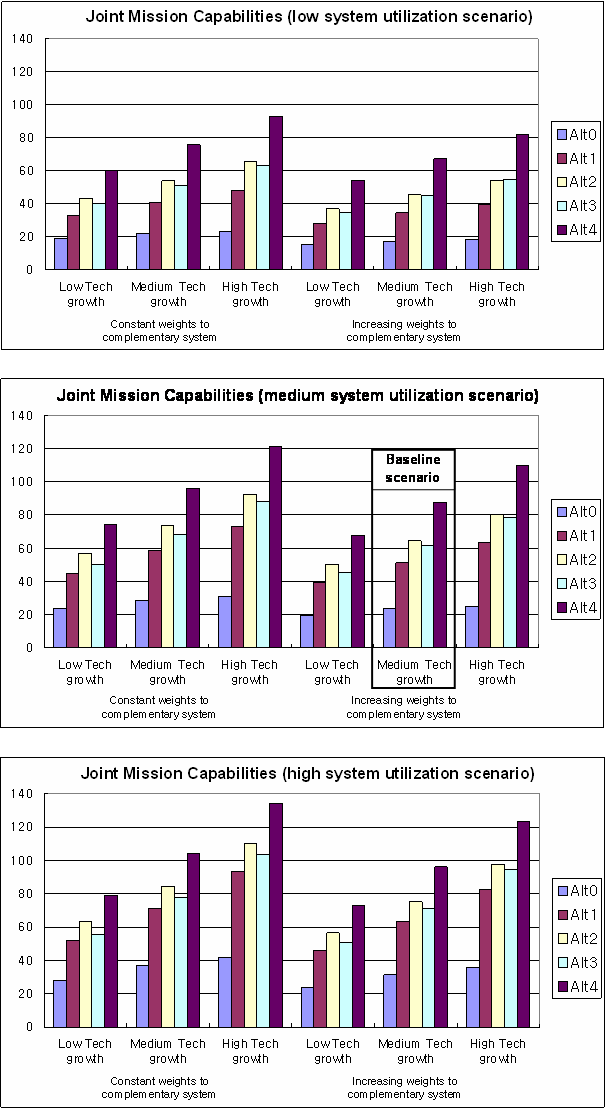
Figure 4. Joint Mission Capabilities from the Parametric Exploratory Modeling 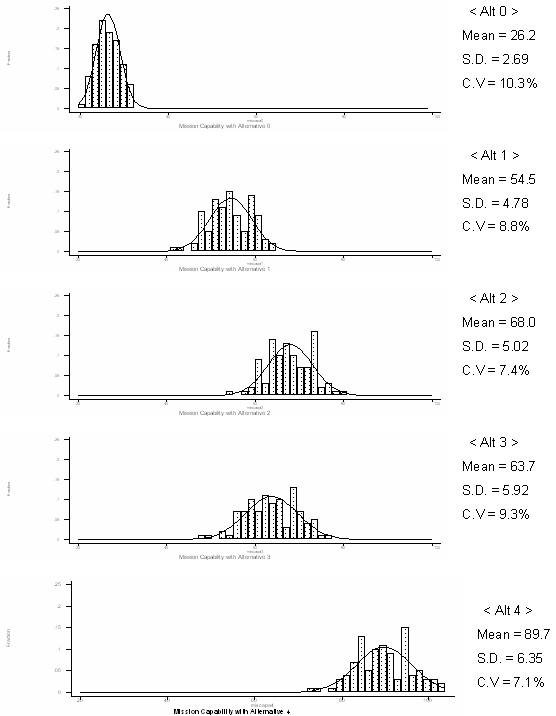
Figure 5. Joint Mission Capabilities Generated from Probabilistic Exploratory Modeling
Summary of Modeling and Policy Implications
- 7.1
- While these modeling exercises are highly abstract, speculative and merely suggestive, the results demonstrate that when autonomous agencies build more mission-centric (rather than agency-centric) IT portfolios, invest in standard systems modestly, and build more mission-centric (rather than agency-centric) relationships with other agencies, an encouraging evolutionary trajectory can be produced without any central commander.
- 7.2
- Standardization improves interoperability among a broad range of systems while point-to-point interfaces selectively couple only highly complementary systems. Building operational capabilities that activate a wide range of interoperable capacities takes time. Hence, small investments in standard systems improve a wide range of interoperability remarkably (by 152%), but such untargeted interoperable capacities with lagging operational capabilities improve joint mission capability less remarkably (by 71%). Nonetheless, such untargeted interoperable capacities may improve the robustness of mission capabilities faced with highly uncertain future states. Both the parametric and the probabilistic exploratory modeling confirm that modest investment in standard systems jointly with mission-centric operation not only enhances the expected outcome but also reduces the variances of outcomes against varying parameters for technology progress, interdependency, and inter-agency operation.
- 7.3
- These findings confirm our two hypotheses, demonstrating that decentralized and adaptive investments in interoperable and standard systems—as long as individual agencies adopt mission-centric IT investment and operation approaches—can improve joint mission capabilities substantially and robustly without requiring radical changes toward centralized IT management.
- 7.4
- Identifying appropriate scale or scope of standard system remains to be a difficult task for further research. This simulation exercise illustrates that a number of cross-agency social network drivers can significantly and substantially affect inter-agency operational readiness, and consequently the added values of standard systems. Empirical research on inter-agency social network mechanisms can help better estimate the productivities of cross-agency interoperable and standard systems, and hence provide useful information for deciding appropriate scale and scope of cross-agency standard systems.
Notes
-
1Blanche is a program designed to evaluate a hypothesis by simulating computational models of evolutionary network dynamics. Blanche is developed under the direction of N. Contractor at the University of Illinois at Urbana-Champaign.
2The twenty distinct missions include 16 citizen service missions (Community and social services, Defense, Economic development, Education, Energy, Environmental management, General science, Health, Homeland security, Income security, International affairs, Law enforcement, Natural resources, Transportation, Workforce management, and Revenue collection and Finance) and four management functions (HR management, Public asset management, Public records management, and Budget planning).
3In this simulation, δ is assumed to be 0.3.
4The initial value of the total IT budget (M0) and mission weights (wj) are derived from the actual U.S. IT budget in FY2003. This simulation assumes 7 percent annual growth of the federal IT budget (Mt=1.07t-1 M0).
5If the budget for a point-to-point interface is allocated more than needed to exploit the full capacity of the original system, the agency is assumed to either expend the surplus budget within its organizational boundary through building its own non-core system redundantly (the agency-centric system operation policies: Alt0,1&2) or transfer the surplus budgets to the agency in charge of the original system to consolidate the system development (the mission-centric system operation policies: Alt3&4).
6The 'e-Government fund' authorized during the Bush administration to support the Presidential e-Government initiatives is an example of investment in standard systems. The E-Gov fund ($345 million over four years) is less than 0.2 percent of the federal IT budget. Five percent seems to be an ambitious yet realistic target.
7The initial mission weights (at t=0) are assumed to be proportional to the actual federal IT budgets in FY 2003. 8The weights to the complementary systems grow by 1 percent each time step (wi,j.t = 1.01 wi,j.t-1 ; i ≠ j ), and then all the weights are normalized.
Consequently, the average weight to own core systems (wi.i.t) gradually diminishes from 0.484 at time=1 to 0.435 at t=20.
References
-
AGRANOFF R (2003) Leveraging Networks: A Guide for Public Managers Working across Organizations. IBM Endowment for the Business of Government.
BARABASI A and Bonabeau E (2003) Scale-free Networks. Scientific American, May, pp. 60-69. [doi:10.1038/scientificamerican0503-60]
FOUNTAIN J E (2001) Building the Virtual State: Information Technology and Institutional Challenge. Washington, D.C.: Brookings Institution Press.
FOUNTAIN J E (2002) Information, Institution and Governance. National Center for Digital Government, JFK School of Government.
GOLDSMITH S and Eggers W D (2004) Governing by Network: The New Shape of the Public Sector. Washington D.C.: Brookings Institution Press.
KAPLAN R S and Norton D P (2001) The Strategy-Focused Organization: How Balanced Scorecard Companies Thrive in the New Business Environment. Harvard Business School Press.
KATZ N and Lazer D (2002) Building effective intra-organizational networks: The role of teams. http://www.ksg.harvard.edu/teamwork/
KAYE D (2003) Loosely Coupled: The Missing Pieces of Web Services. California: RDS Press.
KOHTAMAKI M, Vuorinen T, Varamaki E, and Vesalainen J (2008) Analysing partnerships and strategic network governance. International. Journal of Networking and Virtual Organisations, 5 (2) pp. 135—154. [doi:10.1504/IJNVO.2008.017007]
LAZER D and Binz-Scharf M C (2004) Information Sharing in E-Government Projects: Managing Novelty and Cross-Agency Cooperation. Report for IBM Endowment for the Business of Government.
LIBICKI M (2000) Who Runs What in the Global Information Grid. RAND MR-1247-AE.
MALONE T W (2004) The Future of Work. Boston: Harvard Business School Press.
MONGE P R and Noshir S C (2003) Theories of Communication Networks. New York: Oxford University Press.
NATIONAL TASK FORCE ON INTEROPERABILITY (2003) Why Can't We Talk?: Working Together to Bridge the Communication Gap to Save Lives.
OMB (Office of Management and Budget) (2005) FY07 Budget Formulation FEA Consolidated Reference Model Document.