© Copyright JASSS

  JASSS logo ----

Peter Tucker and Isobel Fletcher (2000)

Simulating Household Waste Management Behaviours Part 2: Home Composting

Journal of Artificial Societies and Social Simulation vol. 3, no. 3,
<https://www.jasss.org/3/3/2.html>

To cite articles published in the Journal of Artificial Societies and Social Simulation, please reference the above information and include paragraph numbers if necessary

Received: 9-Apr-00      Accepted: 13-Jun-00      Published: 30-Jun-00


* Abstract

This paper describes a simulation model of community home composting behaviour based on distributions of individual households, each actively managing the organic fraction of their own domestic waste. The model predicts overall participation levels and the individual and collective flows and compositions of the materials diverted into the compost bin. The take up of home composting by new composters and the drop-out of existing composters are modelled through invoking staged or random discrete events which perturb the model attitudes, and other attributes held by individual householders. An attitude-behaviour model then determines whether these attitude changes result in behavioural change. Post-event evaluations of the compost produced are simulated by integrating an empirical, technical model of the composting process into the behavioural model. This was accomplished by matching the input/output requirements of the two models via a common vector of material flow, and by feeding back the technical process quality monitoring data into the social model, as instances of discrete events. The simulation results are compared with survey data, and simulation results are presented to predict the longer-term sustainability of home composting within the community.

Keywords:
Behavioural change, Composting, Intervention, Material Diversion, Process modelling, Social interaction, Stochastic modelling, Sustainable development, Waste management

* Introduction

1.1
The implementation of the newly developed UK national waste management strategies at the regional and local level will provide complex and challenging decisions for waste management professionals. Meeting national targets demands careful consideration of the local factors that might determine the success, or otherwise, of any adopted strategy. Not least of these local factors are the individual households whose combined voluntary behaviours will be crucial to achieving the necessary diversions of materials out of the domestic waste stream. Home composting can play an important part in this. Home composting, however, needs to be considered in the overall context of integrated household waste management, from its social and practical desirability to the individual household up to its aggregated effects on the community and regional waste management performances, including the environmental performances.

1.2
Tucker and Smith (1999) have recently developed an integrated model of household waste management behaviour that simulates cause-effect links between individual household attitudes, perceptions and behaviours and the scheme-wide waste management performance indicators that are of concern to the waste management professionals. The model simultaneously considers all waste management activities within an integrated system, from source reduction activities, through home composting to kerbside and drop-off recycling. The model was developed to provide decision support to the waste management professional, to assist in making the necessary planning and management decisions, and to allow these decisions to be made more objectively and with less risk, implicitly building the 'people factor' more into the decision making process.

1.3
This paper follows on from the paper of Tucker and Smith (1999). The first paper presented the overall methodology behind the model, and provided some case study simulations relating to newspaper recycling behaviours. Whilst the paper also mentioned the model's applicability to home composting, and that a social model of composting actions might be linked to an engineering model of compost production to simulate composting outcomes, the model mechanisms for this were not discussed. The current paper now develops these mechanisms, and shows how technical predictions of compost quality can feed back into the behavioural model as stimulants for learning and behavioural change.

1.4
In the model, the waste management simulation is effected through the development of artificial societies of households. Each society comprises an assemblage of individual households, of given demographics, who are allowed to behave individually, or respond coherently to stimuli such as management interventions (Tucker and Smith 1999, ¶2.20), or to interact with each other through normative influences (Tucker and Smith 1999, ¶2.17). The basic premises of the modelling methodology are outlined below. Full details can be found in Tucker and Smith (1999).

Basic Premises

1.5
Household waste is described as a flux vector of individual materials flowing through the household (Tucker and Smith 1999, ¶XX)2.1. Household choices on how to manage each material component of that flux are represented by a series of models, representing source reduction, reuse, composting and recycling respectively. Each model acts to partition specific materials from the main flux stream into an appropriate receptacle: the compost bin, recycling container or other outlet as appropriate (Tucker and Smith 1999, ¶2.2). The partition rules that govern the actions of the householders are based on the premises that:
  1. Each action is the result of one or more antecedent or causal factors. These factors can be formulated as constructs of the fundamental attitudes, perceptions or beliefs held by the household (Tucker and Smith 1999, ¶2.11).
  2. Each antecedent factor takes the form of a distributed variable over the population as a whole, for which a generic distributional form can be identified.
  3. The distribution means can be correlated with identified demographic characteristics.
  4. Whilst it is not practical to determine the actual individual attitudes held by individual (real) households, the individual (model) household attitudes can be set through a random, or Monte-Carlo sampling, of the relevant generic distribution.

1.6
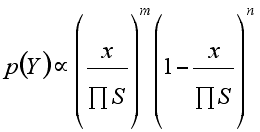
In mathematical terms, each antecedent distribution, p(Y) is given by:

Equation 1

where S are the socio-demographic descriptors and x represents the scale unit (Kg. or strength of attitude etc.). m and n are fixed model parameters, estimated from observational or survey data or set through empirical adjustment. The beta function is assumed throughout. The major socio-demographic descriptors used in the model are housing type, stage in family life cycle, household size and car ownership (Tucker and Smith 1999, ¶2.9).

1.7
Three classes of decision rules are included within the basic model:
  1. Rules which govern whether or not a household engages in a particular waste diversion activity (Tucker and Smith 1999, ¶2.27).
  2. Rules which govern how much of the available material is diverted through that activity, how much contrary material is diverted as well, and how frequently these materials are diverted (Tucker and Smith 1999, ¶2.33).
  3. Rules which govern how behaviours might change with time (Tucker and Smith 1999, ¶2.16).

1.8
Home composting, however, differs from other household waste management behaviours in that the activity not only encompasses the normal generation, segregation and diversion of waste, but also involves the in-house reprocessing of that waste back into a usable product. Simulation of home composting, therefore, is intrinsically more complex than simulation of (say) recycling. It implicitly involves the simulation of the household management of the compost bin as well as simulating the initial diversion of material into that bin. The individual householder is individually responsible for managing the composting process. The management decisions taken can affect the quality of the product produced. This will in turn impact on the householders' evaluations of the value of the composting activity, and ultimately could influence their decisions on whether to sustain their participation in that activity.

Compost Production Models

1.9
A fully informative simulation of home composting may thus demand an integration of physical process models of compost production with the more social and behavioural models of participation. Fletcher et al. (2000) recently carried out a critical review of process engineering models of composting. The developed models dealt almost exclusively with large scale composting of industrial or municipal wastes, often as a continuous process and usually employing forced aeration. However, the authors considered that many of the models could potentially be adapted to simulate small-scale, batch-fed, naturally ventilated home composting operations. As far as the authors of the paper were aware, this had never been done. The published models of composting were generally based on developing heat and mass balances, biomass growth, substrate biodegradation and airflow models over the compost pile. Often the pile was divided into layers to effect the calculations (e.g. Stombaugh and Nokes, 1996; Das and Keener, 1997). Solution of these process reactions and their interactions, usually formulated as differential equations, tend to be computationally demanding. Such models are unlikely to be practical for simulating a multi-household composting scenario where many thousands of bins need to be calculated individually and simultaneously. A very much simpler model needed to be developed for the application considered here. Other possible limitations of the previous models is that they have tended to be largely deterministic in nature, and there is an implicit assumption that in industrial composting, the pile is managed relatively proficiently and professionally. Home composting, in contrast, is undertaken mainly by amateurs who may have widely disparate levels of expertise and composting abilities. An effective model of home composting must take this spread of abilities into account when predicting all possible outcomes. Taking the human factor into account would appear to favour a more stochastic modelling approach.

Structure of this Paper

1.10
The current paper reports the initial development of an integrated model of the entire home composting process:
  1. the decisions to participate,
  2. waste segregation and diversion behaviours,
  3. the loading and management of the compost bin,
  4. the physical processes of compost production, and
  5. the post-production evaluation of the finished product.

1.11
A schematic of the integrated model, showing the internal and external factors involved, is presented in Figure 1.

Figure 1
Figure 1. Compost Model Schematic

1.12
The paper firstly describes the rules that are used to model each of the sub-processes. Secondly, a number of alternative scenarios are simulated, in particular to investigate some of the factors that may affect the take up of composting by new composters, and the factors that may cause existing composters to drop out from composting. The model predictions are compared with case study data from real societies. The paper concludes with a discussion on the value and limitations of the developed methodology.

* Modelling Participation

2.1
The rules for participation have been based on the Theory of Planned Behaviour (TPB) (Azjen, 1985). Whilst other models of behaviour could have been utilised, it was considered a priori that composting was very much a pre-meditated action, planned in advance. Variants of TPB have been applied with success to predicting recycling participation (e.g. Jones, 1990; Boldero, 1995; Goldenhar and Connell, 1993; Taylor and Todd, 1995; Tucker and Smith, 1999) and appear to be good predictors of composting participation as well (Taylor and Todd, 1995). In the current application, the participation model has been formulated, like the ABC model of Guagnano et al. (1995), as an inequality that describes the balance between the pro-composting and the anti-composting antecedents:

If Have_bin = true then
If CA + cN > CB + L then
if W > W0 then Intention = true
Have_bin is the facilitating condition of having a compost bin or other home composting facility, such as a heap or box. CA is the set of general pro-composting attitudes which includes gardening attitudes proxied by garden size, L represents specific barriers arising from lifestyle irregularities (holidays, illness, adverse weather etc.), W is the available weight of compostable materials generated, W0 is a threshold weight above which composting is perceived worthwhile, and CB encompasses all the other perceived barriers that might prevent composting, including lack of self-belief. Social pressures to compost are described in terms of the local behavioural norm, N, and the individual's susceptibility c to comply with that norm. Intention expresses the pre-meditated intention to behave (i.e. add materials to the compost heap) during a given week. Intention is converted into behaviour if the facilitating conditions L allow. In developing this rule base, it has been assumed that each of the antecedent factors can be expressed on a common metric (see Tucker and Smith, 1999 (Tucker and Smith 1999, ¶2.28)).

2.2
It has proved unnecessary to detail explicitly the individual components within antecedents CA and CB, though clearly many pro-composting reasons have been identified in past and recent surveys of composters. Likewise many different barriers have been found to apply (e.g. DETR, 1998; Tucker et al., forthcoming). Previous research into recycling attitudes and barriers (Tucker, 1999a) has shown that the effects are not normally additive, and that it is the strongest attitude or barrier that often dominates any decision to participate. The specific barrier relating to perceived minimum weight must however be drawn out separately. Almost all published surveys of recycling or composting find that minimum weight perceptions are amongst the commonest voiced reasons for non-participation (see e.g. Waste Watch, 1998; DETR, 1998; Tucker et al., forthcoming).

2.3
The facilitating condition Have_bin is central to the participation model. Here a distinction needs to be made between existing composters, often of long standing and experience, and those who are taking up the activity for the first time. Like all household attributes in the simulation, Have_bin is proxied by the socio-demographic characteristics of the household. Major surveys of composters (e.g. DETR, 1998; Tucker et al., forthcoming) concur that housing type is the major determinant, according to the hieracrchy: detached houses, semi-detached, terraced and flats (apartments). Flat-dwellers are not totally excluded from being composters. Some have access to shared gardens and others might be allotment holders. Other identified determinants include tenure (with those renting being less likely to compost than home owners), and the age of residents (composting activity appearing more common amongst the more mature residents). Another important determinant may be garden size (Tucker et al., forthcoming). The study found that those with larger gardens are more likely to compost compared to those with smaller gardens.

2.4
In the model, prior values for the variable Have_bin are allocated to the top-ranking households according to an individual numerical score given by:

Score = o1 x( CA - CB ) + o2 x Wgarden + rnd

Wgarden is the mean weight arisings of garden waste, assumed to be a function of garden size (which is a distributed variable estimated from housing type and housing density). o1 and o2 are scaling constants and rnd is a random increment. The attitudes and barriers CA and CB are drawn randomly from their assumed 'generic' distributions, and scaled according to housing type and the stage in family lifecycle of the residents.

2.5
New take-up is triggered through flipping the value of the Have_bin attribute from 0 (no bin) to 1 (have bin). It is assumed that this change does not happen spontaneously but may occur if a suitable triggering event takes place. The model of Tucker and Smith (1999) identifies various triggering mechanisms that might stimulate behavioural change. These include:
  1. planned management interventions (which may prompt a coherent change of behaviour amongst whole groups of individuals), (Tucker and Smith 1999, ¶2.20),
  2. discrete events, such as perceived catastrophies, that might flip individual behaviours, (Tucker and Smith 1999, ¶2.16),
  3. ongoing background stimuli such as those provided through general waste awareness campaigns,
  4. moving house, and
  5. social dialogue amongst residents, (Tucker and Smith 1999, ¶2.18).

2.6
Home composting promotion schemes, especially those involving the distribution of free or subsidised compost bins, can act directly on the Have_bin attribute, thereby encouraging take-up:
If Have_bin = 0 and CA> CB then:
If I_Susc x I_Strength + rnd > trigger value, then Have_bin = 1

I_Susc is the individual's susceptibility to external stimuli and I_Strength is the strength of the intevention.

2.7
Without such direct stimuli to acquire a compost bin, those who might be favourably disposed to acquiring one can also respond to more indirect stimuli. In these cases the triggering event is assumed to be an induced positive step change in the resident's pro-composting attitude. Such changes can be triggered in the model through 'background' stimuli or, for those susceptible, through social contact with their neighbours, (Tucker and Smith 1999, ¶2.18).

If DCA > 0 and CA - CB > 0 then
if ( CA - C) x DCA + rnd > trigger then Have_bin = 1
DCA is a positive increment in pro-composting attitude, triggered by background events or through social contact. Such triggering events are programmed to occur randomly around a given frequency of occurrence. DCA is scaled according to the susceptibility of the individual to external influence I_Susc or by the susceptibility to normative influence c, whichever is appropriate.

2.8
The effects of household mobility can be: (i) a drop-out of the household from composting, (ii) recruitment to composting, or (iii) a preservation of the status quo depending on the respective balances of attitudes of the old and new occupiers. Moving in of new residents is modelled by resetting the household attributes for the property through random sampling of the respective generic attribute distributions appropriate to that property, (Tucker and Smith 1999, ¶2.18)). However, garden waste arisings are assumed to remain fixed to the house and are not reset in the move. It is also assumed that all of the existing composting facilities are left at the property (Have_bin remains unchanged), though the new residents may choose not to use those facilities if their new CB > CA. It should be noted, however, that the rule does provide an implicit bias towards composting activities continuing at a household. In the model, former owners with larger gardens were more likely to have acquired a bin. With the move, the garden size component of the new CA remains invariant, giving statistically higher pro-composting attitudes to the new owners of larger-gardened properties, where compost bins are more likely to be found.

2.9
Residents moving to a household without composting facilities are subjected to a contemporaneous extra background triggering event, to model a start up or a restart of their composting at their new premises. It is noted that many potential composters will not respond immediately (modelled through the random component in the triggering rule). Composting may not be a priority to them at that time. Previous composters moving to (say) a flat would, of course, acquire a new high barrier strength CB pertaining to flatted properties, and a new low garden size component to their CA rather than retaining values pertaining to their previous property. This models the drop-out associated with moving to a property where composting may not be appropriate.

* Material Diversion Rules

3.1
Here, the major controlling attitudes are assumed to be ignorance, forgetfulness or accident and 'reasoned choice' (Tucker and Smith 1999, ¶2.33). Ignorance acts either to stop a household diverting any material of a given 'wanted' material classification to composting (e.g. their kitchen waste), or acts to allow contrary materials to be deliberately introduced (e.g. unshredded branches, or meat and fish scraps). Forgetfulness stops some wanted materials from being diverted, whilst accident allows some contrary material to be introduced. Forgetfulness and accident are modelled as random events. The rules are structured as follows (Tucker and Smith 1999, ¶2.34, Tucker and Smith 1999, ¶2.35):

If I + E > Itrigger then Ignorant = true
Loss through forgetfulness = F x f x rnd
The threshold value Itrigger and the scaling factor f are material specific. I is a the general household ignorance level, E is their composting proficiency, and F is their propensity to forget.

3.2
Reasoned choice allows additionally for a controlled decision to be made on how much of each acceptable material category to divert (e.g. how much paper to add to the compost or whether to add all items of uncooked kitchen waste). Paper is quite acceptable as a material that will compost, though an excess of paper can inhibit the rate at which the overall degradation occurs. Similarly 'woody' material can take longer to break down than soft green waste. It is considered that there is an optimum balance between the amount of high-carbon woody materials and paper and the softer, more nitrogen-rich material that should be added. The experienced and proficient composter is more likely to get this balance right than the novice, though the novice could quite easily hit on the right recipe by chance. If E < Etrigger and Ignorant = false, random levels of paper addition are invoked. If E >= Etrigger then controlled weights of paper W(p) are added, but only if the compost needs it. The need is determined from the carbon to nitrogen balance of the totality of materials being added. If the computed C:N ratio is below optimum, paper is added to bring it up to the optimum level CNoptimum.

W(p) = [ W x CNoptimum - Si ( W(i) x CN(i)) ] / CN(p)
where the summation is made over all organic waste categories (i) and CN(i) are the carbon to nitrogen ratios for each individual category i.

3.3
At the other extreme, if there is an excess of high carbon material in the potential feedstock, the experienced composter is assumed either to correct it through additions of supplementary sources of nitrogen (possibly compost activators) or through stock-piling the excess woody material outside the compost bin until its addition becomes more timely.

3.4
Reasoned judgements for not adding all available kitchen and garden wastes may be that "it would upset the balance of contents of the compost heap" or that some items are deemed "unpleasant to handle".

* Compost Production and Assessment Model Rules

Composting Progress

4.1
The transformation of the waste input to the compost bin into a finished compost is modelled in terms of a progress parameter P, which describes the degree of progress towards becoming a stable and mature compost, together with a quality indicator Q, which logs any potential compost quality problems that may arise during the composting. In the model, the rate of progress DP / Dt is assumed to be governed by the following parameters:
  1. Temperature, T.

    T is assumed to vary sinusoidally with time of year, between an average weekly minimum temperature Tmin and an average weekly maximum temperature Tmax according to locality.

  2. Mass, m, of compost in each reaction stage.

    It takes a certain critical mass to stimulate the faster exothermic reactions which are important in reducing pathogen levels and in reducing the survival rate of any weed seeds or diseases that might be contained in the input material.

  3. The air content and the water content.

    Sufficient oxygen and sufficient but not excessive moisture are both important to progressing the aerobic composting process. Insufficient air, often coupled with excessive moisture, can turn the reaction anaerobic, which is a slower stabilisation process, likely to produce a 'slimy' product and an odour nuisance as well. At the other extreme, insufficient moisture can also inhibit compost degradation. The prototype model does not distinguish separately between air and water requirements, but utilises a combined air/water factor, A. The factor is configured on the arbitrary scale ranging from 0 (no air), through 125 (optimum conditions), to 250 (completely dry).

  4. The initial carbon to nitrogen ratio CN0 .

  5. The proficiency or expertise, E, of the composter in filling and managing the compost bin.

4.2
Compost progress is modelled by the empirical rule:
DP / Dt = ( Pf - P ) x ( a1 m + a2 exp [- a3 T b ] ) x fn.( A ) x fn.( CN0 ) x fn.( E )
where a1 , a2 , a3 , b are empirical coefficients, and Pf is the progress level relating to fully stable compost. It is implicit in this formulation that the rate of progress decreases with increasing progress, i.e. the later stages of compost maturation will take place much more slowly than the initial stages of degradation.

4.3
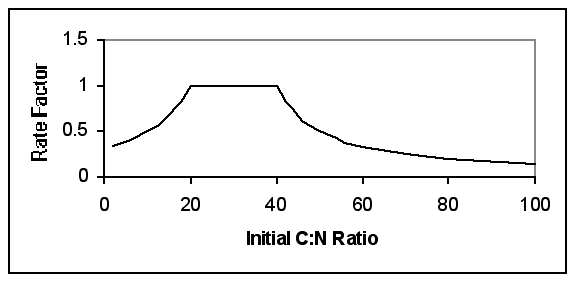
The air/ water rate rate factor fn.( A ) and the initial carbon rate rate factor fn.( CN0 ) are assumed to be stable over a reasonable range of 'average' conditions, only becoming lowered for more extreme conditions. These rate reductions have been assumed to drop off as 1 / D outside the stable range, where D is the deviation outside the stable range (Figure 2).

Figure 2a
Figure 2b
Figure 2. Assumed Empirical Model Rate Functions

4.4
The expertise rate function is determined from a base function of individual proficiency, which increases linearly with proficiency, together with a random factor. A proficient composter will generally get the conditions right in loading the bin. A novice would be less likely to do so, but could do so by luck. The proficiency factor is given by:
h = E / Etrigger + rnd

fn.( E ) = 1, if h > 1, else fn.( E ) = h
Etrigger is the threshold level of proficiency, above which a composter is considered to be proficient.

4.5
As the composting progresses, the mass of material in the compost bin reduces, as the matter is degraded, and carbon dioxide is evolved. The compost volume can decrease markedly through both degradation and consolidation processes. Each of these processes can lead to a depletion of the available oxygen, although concurrent water losses will tend to mitigate this effect. Whilst commercial composting processes often include forced aeration to maintain oxygen levels, home composting units are unaerated and inward diffusion of air can be very slow. Professionals usually recommend a periodic 'turning' of the compost heap to help replenish the oxygen.

4.6
Mass reduction and oxygen depletion are both modelled as linear functions of progress:
m = m0 x ( 1 - f P / Pf)
where m0 is the total weight initially input into the reaction stage and f is the expected mass ratio of finished compost to its raw materials, typically around 0.5 on a wet weight basis (White et al., 1996).
A = A0 - j P / Pf + rnd
where A0 is the initial air content and j is a fixed constant. A small random term, which can be either negative or positive is also introduced to provide for unexplained variations. The amplitude of the random term is scaled according to proficiency, becoming larger for the less proficient.
Bin Loading

4.7
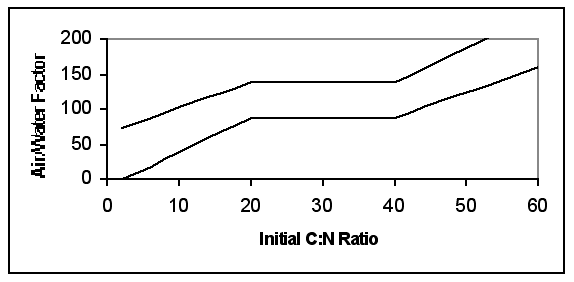
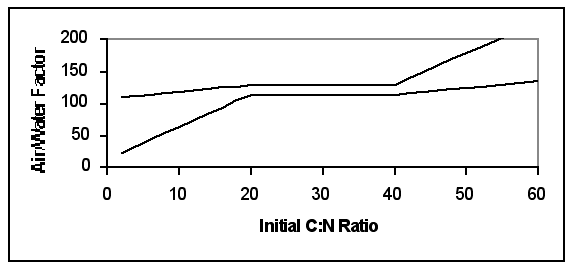
The initial air/ moisture content A0 will vary amongst individual composters and with the specific materials being composted. The air/ water content often correlates with the initial carbon to nitrogen ratio. More woody material (higher C:N ratio) generally tends towards a lower packing density on loading than does wetter and softer green waste. The less proficient composter may also be more likely to set up their compost bin or heap away from the optimum conditions. Their set up may be too moist or too compacted, or might alternatively be too dry. In the model, a proficient composter is considered to have set the compost bin to an optimum C:N ratio by balancing the types of materials put in on each occasion (see material diversion rules). A proficient composter is also considered to have packed the bin and made all necessary adjustments to ensure that the initial air and moisture contents are also optimal. The initial air/ moisture contents for less proficient composters are set randomly within tolerance limits depending on their proficiency and the initial C:N ratio of their materials diverted (Figure 3).

Figure 3a
Figure 3b
Figure 3. Assumed Upper and Lower Tolerance Limits for Initial Air/ Water factor Settings (Moderately proficient and Novice Composters respectively)

4.8
The model adopts a time increment of one week for each loading of the bin. The contents of the bin are modelled as three discrete and independent reaction layers: the top layer which receives the new additions, a middle layer, and a basal layer from which the 'finished' compost is withdrawn. Every four weeks, the layers are dropped one level, that is the top layer becomes the new middle layer leaving an empty top layer, whilst the old middle layer is compounded into the basal layer. The masses accumulate and the new compound progress and air/ water factors are determined from the weighted averages of the combining layers.

Evaluation of Contents

4.9
Each week, each layer is tested. If the air/ water factor has fallen below a critical value, then the heap is deemed to have turned anaerobic and an anaerobic problem flag is set within the quality indicator array Q. Conversely, if the weekly rate of progress has exceeded a given threshold rate and the mass contained within the layer exceeds a critical mass threshold, the heap is deemed to have become exothermic, or thermophilic, and a thermophilic flag is set inside Q. Other quality flags are set if the weekly quantities of 'non-compostable' organics, non-organic contraries or non-fruit and vegetable kitchen wastes exceed given thresholds.

4.10
The management and evaluation of the compost in the bin is modelled to occur at discrete intervals, either four-weekly or in multiples of four weeks. Three significant events are modelled:

  1. The turning and mixing of the bin contents.

    The mean frequency of the turning event is linked to composting proficiency, from once every eight weeks (on average) for a proficient composter and at progressively longer intervals with decreasing proficiency.

    If E / Etrigger + 2 x rnd > 2 when E < Etrigger

    or 2 x rnd > 1 when E >= Etrigger


    then the bin contents are turned.

    rnd is a random number in the range 0 to 1.

    In the model, turning the bin acts to homogenise the three layers, with the whole of the new mixture taking on the weighted mean progress of all the three former layers. The turning of the compost provides aeration. The air/ moisture factor for the mixed compost is set back to the optimum starting value.

  2. Reaction to running problems.

    The model allows the approximate incidence of problems to be set through a control parameter, Zest, the percentage of households per week that are affected. On each household inspection event, the initial estimate of F is modified to take account of the potential problems flagged in the quality index Q:

    Z = ( a1 x a2 / a3 ) x b Zest + ( 1 - b ) Zest x (Family life cycle stage) / 3
    The multipliers a are set to 1 if no there are no flagged entries in the quality log Q, but are set to a value higher than 1 if specific problems are flagged. a1 refers to the incidence of relatively high quantities of non-fruit and vegetable kitchen waste, which might increase the possibility of attracting vermin. a2 refers to significant levels of 'non-compostable' garden waste which may increase the incidence of disease or give obvious signs of recalcitrant breakdown. a3 reduces the incidence of problems if the compost has passed through a thermophilic phase. The residual components of F refer to the possibility of other (unspecified) problems such as excessive weed growth, fly infestations etc. The partition coefficient b is used to isolate any problems that may be caused through the onset of composters' health problems, as distinct to compost quality problems. Health problems are highlighted in the DETR (1998) survey as a major cause of drop-out. The probability of health-related problems is assumed to increase with age.
    If Z > rnd then the recognition of a real problem, of genuine concern, is assumed.
    On experiencing a problem, the composting household is modelled as taking one of three actions:
    1. ignoring the problem and continuing to compost as before,
    2. seeking help to address the problem, or
    3. sustaining an adverse reaction to home composting per se.
    The specific action taken by any given household is simulated according to the following rules:
    If R' x CA x I_Susc x H > s1 x rnd then help is sought and taken,
    else if R > Rtrigger composting behaviour continues unchanged,
    else the perceived barriers to composting CB are incremented by a factor: s2x R' x rnd
    where R' = Rtrigger - R when R < Rtrigger or R' = 1 when R >= Rtrigger

    R is the resilience of the household to set-backs. CA is the pro-composting attitude, I_Susc is the susceptibility to external influence, and H is the accessibility to good help. s1 and s2 are scaling factors. The adverse reaction is considered to weaken the resolve to continue home composting. The consequence may be (but will not necessarily be) that the participant discontinues their composting activity. Continuation of participation will be determined by the subsequent computation of the participation rule (If CA < CB then participation is false). The likelihood of this inequality being satisfied will increase each time CB is incremented, that is with a cumulation of experienced problems. Help is considered most likely to be taken where the combination of pro-composting attitudes, resilience, and susceptibility to external influence are high, and if help is easily accessible, e.g. through an official telephone help-line, or professional centre. Reliance on self-help through books and magazines is assumed to be weaker. If help is taken, the model triggers an increase in proficiency and assumes that the current problem is alleviated, by resetting the relevant flags in the quality index Q. Proficiency is also increased by a random increment following the acceptance of the help and advice.

  3. Assessment of the Compost

    An inspection event is triggered for every composter at random intervals around an average of once per three months. If the progress indicator for the basal layer of compost is above a critical threshold, then the compost is deemed ready for extraction. The model extraction involves the removal of the whole basal layer. If the progress indicator has not yet reached the critical threshold level, the compost is deemed to be not yet ready. Two consequences arise: If R < Rtrigger and E < Etrigger then a random chance is invoked that the individual will perceive slowness to be a problem. If so, the perceived barrier to composting CB is then incremented by a small random amount. This simulates impatience. Repeated findings, by a non-proficient and non-resilient individual, that their compost is not ready could eventually shift their attitude/ barrier balance and lead to their drop-out. If, however, the above inequality is false, the individual is considered to continue composting as before, and the compost is re-inspected at a later date. The quality indicator Q provides a basis for an indicative quality assessment of any extracted compost. The main discriminators available for this assessment are whether the compost passed through a thermophilic stage and whether it turned anaerobic. The quality of the latter is judged to be 'possibly problematic', whilst the quality of the 'thermophilic' compost is judged to be good. If neither problem was flagged, the quality is judged to be 'acceptable'. Whilst these hard and fast boundaries are retained in the current model, extended experience with the model may show that distinctions may need to be made more fuzzy through an addition of a small random element. It is also assumed that if the production of compost that is at least satisfactory, it will generate experiential learning. The composter would remember (at least roughly) what they did this time, and should do it at least as well in the future, unless of course adverse random events stack up less favourably next time. This 'experiential learning' is modelled by adding a small random increment to the proficiency E if acceptable compost is produced, and by adding a larger random increment if good-quality compost is produced. If, however, the quality of the extracted compost is judged to be problematic then, like experiencing running problems, the composter may seek help, continue as before, or sustain an adverse reaction. These consequences are modelled similarly to the consequences of the running problems, as described above.

* Organic Waste Flux

5.1
In the UK, the prime waste classification has been based on 11 major categories: paper, glass, dense plastic, plastic film, ferrous metal, non-ferrous metal, textiles, putrescibles, non-combustibles, combustibles and 'fines' (a catch-all term for a mixed classification of small-sized material). (e.g. DoE, 1994). A more-detailed 33 category sub-classification has also been developed, although this extended classification only splits putrescibles into two daughter components: kitchen waste and garden waste. In the current work, it has proved essential to introduce a more detailed sub-classification of the organic waste (Table 1), to provide for the necessary discrimination between the fractions needed by the model. Further advantages could be gained by even finer-scale categorisations, say by splitting fruit and vegetables, or grass from other green leafy material, branches from diseased material, etc., though the resultant fluxes would be more difficult to estimate reliably, and more computing resources would be consumed with their inclusion. The model classification adopted was a trade-off between resolution, and reliability and resources.

5.2
The garden arisings are modelled according to season. In the prototype, a sinusoidal variation has been assumed peaking in July for soft green waste and in September for more woody waste. Smaller seasonal variations can be introduced for kitchen waste, and for wastes of both types, random week-by-week fluctuations can also be introduced. The waste arisings attribute is scaled according to the demographic profile of the generating household, (Tucker and Smith 1999, ¶2.7).

Table 1: Organic Flux Classification

UK Prime Organic
Category
UK 33-Category ClassificationModel Classification


PutresciblesKitchen putrescibles1. Uncooked Veg & Fruit


2. Cooked food, meat & fish

Garden putrescibles3. Soft green waste


4. More woody waste


5. Non-compostable material*

* e.g. larger branches or diseased material

* Model Calibration

6.1
For the model to become a pragmatically useful tool for waste management prediction, it is first necessary to demonstrate that model calibrations can be found that provide a reasonable representation of reality. The calibration data used here was obtained through a parallel experimental research programme. In this research, questionnaire surveys of home composters were carried out on four sample groups based in the communities of Fylde in north west England, Inverclyde and South Lanarkshire in Scotland, and amongst staff of the University of Paisley, Scotland. Each sample comprised two groups: (i) those identified a priori as obtaining a compost bin through a promotional campaign, and (ii) a control sample not taking up the promotional offer, drawn from the same neighbourhoods as the takers. The full results of these surveys will be published elsewhere in due course (Tucker et al., forthcoming), though some key data are reproduced here to provide the necessary validations for the model calibrations. In addition to the questionnaires, some volunteers also provided logged information on the weights and compositions of materials that they added to their compost, and these data were used in further comparisons with the model.

6.2
A survey of 470 residents representing 21 out of the 22 electoral wards in Fylde Borough provided a base data set containing 21 separate demographic profiles. The model was fitted to these data, calibrated on small area census statistics, and using national estimates of average green waste generation. The garden size estimates used in the model were estimated from the housing densities in each of the wards and the number of model composters was set to that found in the survey. The fit of the model to the survey data is shown in Figure 4. Whilst there is considerable scatter, the model is providing a reasonable description of the major trends between composting behaviour, demographics and garden size, though there are one or two significant outliers. It should be borne in mind, however, that the survey results were based on a relatively small data set with as few as ten observations in some wards.

Figure 4
Figure 4. Model fit to Survey data by Electoral Ward

6.3
The estimated green waste arisings were then adjusted through calibration to fit the weights of materials diverted to those actually logged by Fylde composters (Figure 5). Model predicted compositions can be compared to the logged compositions obtained from volunteer housholds (Figure 6).

Figure 5
Figure 5. Weights diverted into the Compost Bin

Figure 6
Figure 6. Composition of Materials Composted

Figure 7
Figure 7. Cumulative Frequency Distribution of the Proportions of Uncooked Kitchen Fruit and vegetable Waste Added

6.4
The 'best' model fit to the weight recovery of specific compostable components was obtained through empirical adjustment of the material-activity specific trigger values. The attitude distributions for forgetfulness, distaste and ignorance were those obtained previously for the newspaper recycling behaviour of Fylde residents (Tucker and Smith 1999, ¶3.3). Whilst the general trend of the survey results was reproduced by the model, it is noted that the model fit here significantly underestimated the number of residents composting only half their waste or less (Figure 7). The recovery rules were originally designed to discriminate between the 'full recovery', 'no recovery' or 'small random leakage', seen in recycling schemes and would appear to be less good predictors when it comes to composting diversions.

6.5
The dominant model control rule responsible for leakages of 10% or more in the model diversions is compared with the surveyed responses for leakage in Table 2. Whilst the mapping between the two is not perfect, it is seen that there is quite a reasonable general correspondence between the modelled and experimental results, bearing in mind the simpler determinant structure used in the model.

Table 2: Reasons for Non-Diversion of Part or All Uncooked Kitchen Fruit and Vegetable Waste

Model
Survey
Dominant Control Rule%Reason%


Forgetfulness
46Forget31
Not enough waste
23Not enough waste15
Lifestyle irregularity on a given week14Inconvenient17
Ignorance
11Unsure it can be composted11
Reasoned judgement
6Unhygenic or unpleasant
Fed to pets
Will upset balance of compost
4
1
1


Too much bother

13


Other
7

6.6
The model frequencies of the occurrence of the discrete 'catastrophic' events, household moves, and the propensity to take help were empirically adjusted to provide drop-out rates comparable to those found in the surveys, and to the number of real composters admitting to taking help. Here, simulations were run for a model period of 3 years, and assumed a promotional intervention during March of year 1 (Figure 8). The promotional intervention provides the step change in participation seen in the figure at week 10. Again it was not possible to exactly match like for like when comparing the modelled and surveyed drop-out statistics. However, they have been mapped as closely as possible in the results presented here (Table 3). The main discrepancy between the statistical bases relates to the uncertainty of time periods within the survey data. The times of drop-out were not asked. The model drop-out rate was formed from a combination of the short term drop-outs from promotional takers plus the drop-outs of some previously established composters. The best fitting model calibration (established through sensitivity analyses) determined average levels for tenure of around 6 years on average, and of experiencing discrete adverse events once per two years on average, both of which seem entirely plausible. The frequency of social dialogue averaged around once per 6 months per household. The survey results of Tucker et al. (forthcoming) found that 53% of composters admitted to talking occasionally to their neighbours about composting whilst only 5% did so frequently. Overall, the model calibration achieved quite a reasonable fit to the survey data on behavioural change (Table 3).

6.7
In taking new recruits into account (triggered in the model by the twin background stimuli of 'unspecified triggering events' and neighbourhood social contacts) in addition to the drop-outs, the model composting population appeared to remain fairly stable over the three year period, and predicted only a marginal decrease in the numbers composting over that period (Figure 8). The two troughs seen in the figure correspond to the winter months when some model composters (and real composters also) temporarily cease composting because of low seasonal weights of garden waste arisings.

6.8
The relative frequencies at which the rules causing drop-out were fired are given in Table 4, where again they are mapped as closely as possible to the expressed reasons for drop-out in the survey data. Again the model has been shown to be capable of simulating the same general picture as that found amongst the real composters.

Table 3: Frequencies of Occurrence of Behavioural Events

Model
Survey
Behaviour Time period%BehaviourTime period%


Drop out3 yrs10Lapsed
(promotional takers)
1 - 3 yrs 6


Never composted
(promotional takers)
1 - 3 yrs 4


Lapsed
(non takers)
unknown19


New recruits
(outside promotion)
3 yrs 7Started in last 3 yrs
(non takers)
3 yrs 7


Help taken3 yrs16Help taken1 - 3 yrs15

Figure 8
Figure 8. Simulated Net Behavioural Change over Three Years.


Table 4: Reasons for Drop-out from Home Composting

Model
Survey
Activating Rule%Reason%


Household mobility34Moved house30
Problematic finished compost
Anaerobic running problem
Process to slow
19
9
3
Unsuccessful/inefficient/smells25
Unspecified reason39Other 29
Excess non fruit/vegetable kitchen waste 6Vermin 2


Insufficient waste 8


Insufficient time 6

Discussion

6.9
In summary, the model calibrations have provided (simultaneous) fits to all of the multiple composting performance indicators observed amongst communities of home composters. The model has provided indications of the levels of community participation in home composting, and the demographic dependencies of these levels. It has also simulated how much and what material is put into the compost bins (and what is not put into the compost bins), and of the seasonal variations in the weights added. The reasons and rates of take up and drop-out have also matched those found from survey data. Whilst household mobility was found to be the major reason for drop out, unsuccessful attempts at producing compost and inefficient (too slow) composting and, to a lesser extent, vermin, are all highlighted as other reasons why some may drop out. These 'technical' events were simulated by integrating a technical model of the compost production process with the social behavioural models. The technical model simulates how long the compost will take to mature and logs a number of performance indicators for the compost quality. When a possible problem is flagged in this way, the behavioural model takes over and simulates the composter's reaction and response to that problem.

6.10
It is recognised, however, that the model was based on number of fundamental assumptions, and that its implementation involves the specification of quite a large number of parameters. As with any model based on a multiplicity of parameters, the identification of reliable and representative parameter values become crucial to ensuring that the model predictions provide a valid representation of reality (or of a possible future reality). Overall, the developed calibration procedures were aimed at reducing the possible ambiguities in parameter determination. It nevertheless still remains possible that other parameter sets could be found to give reasonable alternative fits to the observed data, and given the uncertainties involved in specifying some of the predictor variables, the model solution should always be regarded as one solution out of a suite of possible solutions.

6.11
Only a small sub-set of the model parameters were actually set through the calibrations. The remaining parameters were treated essentially as fixed constants in the first instance. Those parameters set in the calibrations were each set separately against independent data sets. The parameters that were treated as fixed coefficients comprise: (a) parameters determined from prior measurement to be reasonably consistent amongst different communities, and (b) parameters which simply established the reference points upon which the case-specific calibrations were undertaken. A typical illustration is provided by the calibration of composting proficiency attribute (Figure 9). A generic 'shape' for the proficiency distribution was established through surveying composters across four communities. These data were then used to fix the two indices of the beta distribution. The proficiency threshold parameter, Etrigger, was then fixed as a reference point. The scaling parameter, x, was retained as the sole calibration parameter for composting proficiency. This simplification holds because x and Etrigger, are defined on the same arbitrary scale. In the illustration, the value of x is adjusted to calibrate the ratio of the areas under the curve to the left and right of the trigger to the proportion of 'proficient' composters within the population.

Figure 9
Figure 9. Relationship between Model Parameters in Model Calibration

6.12
In applying similar considerations for each of the other model attributes, the number of calibration parameters was reduced a priori to:
  1. a set of scaling parameters controlling: ignorance, forgetfulness, distaste, resilience, susceptibility to normative influence, susceptibility to intervention, composting proficiency, minimum volume perceptions, and perceived barrier strength.
  2. a set of parameters governing the event frequencies (and where appropriate the strengths) of personal difficulties, absences from home, visitation of 'catastrophies', household mobility, social contacts, and general background stimuli.

6.13
The importance of each parameter to the calibration is determined by the mapping between that parameter and the measurable indicators, the ease and accuracy to which those indicators can be measured, and the sensitivity of those indicators to changes in the parameter value.

6.14
Sensitivity analyses, as illustrated in Figure 10, reveal that the model can be relatively insensitive to minor, or even moderate, changes in (or mis-specifications of) many of the calibration parameters, in particular the weight loss and frequency parameters. This is exemplified in the what-if analyses (presented later) which explore the effects of changing the frequency and strength of parameters that control take-up and drop-out. Many of those parameters are actually quite difficult to measure, except by a large-scale research survey. Because of their relatively low sensitivities, taking typical default values for them may prove to be sufficient for most calibrations undertaken in practice. It should also be borne in mind that even if the necessary calibration data can be obtained, as it was for the calibrations presented in this paper, the calibrations can also suffer from poor precision due to the stochastic nature of the model itself. Figure 10 shows that in three repeat runs of the sensitivity analyses, the random variability between run can be high relative to the systematic changes with changing parameter values. To calibrate these parameters effectively, it is important to average over multiple runs. The case shown in Figure 10, however, presents the 'worst case' scenario for the between-run variability. In that illustration, the weight recovery data was computed as a spot determination for one single week's composting outcome.. Time averaging the weight recovery data over [say] a year, significantly reduces the between-run variability.

Figure 10
Figure 10. Sensitivity Analysis of the Forgetfulness Scaling Factor on Weight Recovery (Each data point refers to a different model run).

6.15
The key calibration parameters in the model are those which control the participation rules. The model can be quite sensitive to changes in these parameters. Figure 11 shows the sensitivity of the participation rate indicator to the 'perceived barrier-strength' scaling factor. This is also a spot measurement of participation, but here, the random variability between runs is relatively small. If actual participations can be measured, these model calibrations can be effected quite precisely.

Figure 11
Figure 11. Sensitivity Analysis of the Perceived Barrier Strength Scaling Factor on Participation Rates. (Each data point refers to a different model run).

6.16
Sensitivity analyses applied to fine-tuning parameter values against multiple indicators are discussed further by Tucker et al. (2000) for a recycling application. The implications of random model variations if fitting measured data are also discussed in more detail elsewhere (Tucker, 1997-98), again for a recycling appliction.

6.17
In summary, although it has not been possible to validate some aspects of the technical model (e.g. the composting rates), or of the modelled social responses (e.g. 'experiential learning'), the theories implemented in the model do match the 'coarser' outcomes seen in reality, subject to the provisos discussed above. As such, the calibration outcomes provide a measure of confidence that the model might usefully simulate some detailed scenarios of relevance to the development of strategic waste management plans, and their implementation and management within the community. The following section details some of the preliminary simulations that have been undertaken. Validation studies will be undertaken, during the forthcoming composting season, through surveying composters of one year standing about their perceptions of the outcomes of their first year's experience.

* What-if Simulations

7.1
The development of the home composting simulation was aimed at providing practical advice to waste management planners on optimising the promotion and sustainability of community waste diversion activities. Home composting must form a key component in their plans as it, together with centralised municipal composting, will be essential to meeting the obligations of the EU Landfill Directive to divert 65% of organic waste (from 1995 baseline levels) away from landfill by the year 2020. With municipal waste arisings at an estimated 27 million tonnes in 1995 (DETR,1999a) and with an estimated 62.5% of this waste being biodegradable (DETR, 1999b), at least 6 million tonnes of biodegradable material must be diverted from landfill in order to comply with the directive. With municipal waste arisings increasing by an estimated 3% per annum, the diversion required could be as much as 33 million tonnes (DETR, 1999a). The national target that 40% of households with gardens should carry out composting by the year 2000 has probably not been met, though no confirmatory statistics are published as yet. It is still necessary to increase home composting levels from an estimated 29% in 1998 (DETR, 1998), and to increase these levels beyond 40%, and to sustain these increased levels over the longer term.

7.2
A number of simulations were performed with the calibrated simulation model to provide some indications of the potential for increased participation and its longer-term sustainability. Figure 12 shows the predicted effects of enhanced positive stimuli through more frequent social contacts, better help provision and increased background stimuli respectively. Of these help provision would appear to be the weakest in effect as it can only mitigate drop-out and not stimulate new recruits. And in any case, not all of those experiencing problems will seek advice. Indeed survey results (Tucker et al., forthcoming) showed that only 16% of those recognising that they had problems had sought advice (Table 5). Nearly the same percentage of those admitting to having no current problems also sought advice. It would appear that for these people the advice was successful.

Table 5: Help needed/available/ taken


ProblemsNo problems


Not needed36134
Not available/ not sought32 10
Help taken13 22


% taking advice16 13

7.3
The strongest effects predicted by the model, however, were through an increase in the general background stimuli, either by an intensification of the message or with more frequent exposure to the message. The absolute changes in participation, however, are predicted to be quite low (< 4% over a 3 year period for all interventions). Parallels can be drawn with the 1999 'slim your bin' campaign mounted in the Anglian region where public response was weak despite quite intensive promotional campaigns including TV advertising (ENDS, 2000). Parallels can also be drawn with the seat belt campaign of the 1980s where results were finally achieved from frequent reinforcement of the message.

Figure 12
Figure 12. Sustainability of Participation: Model Effects of Increased Positive Stimuli

7.4
It follows that a weakening of the current ambient stimuli could lead to an increased drop-out rate. This is also predicted by the model (Figure 13), with the background stimuli again appearing to be the dominant factor. The model predictions clearly show that drop-out is inevitable through many adverse events, many of which (e.g. the onset of infirmity and possibly moving house) are not correctable through help or support. To sustain activity it is then essential to recruit new participants. A positive ongoing background message would appear to be important in achieving this aim.

Figure 13
Figure 13. Effects of a Weakening of Pro-composting Stimuli

7.5
Pro-composting interventions, such as promotional 'get a bin' campaigns are also important in stimulating home composting activity, and the intensity of such campaigns in terms of their contact area and strength of promotional message are crucial to stimulating new take-up. In Blackwood, a personal doorstep promotion offering a free compost bin resulted in over 40% of those approached taking a promotional bin. In Inverclyde where bins were offered at a reduced price and in Fylde where the contact area was lower, take-up was very much lower. The effects of differing intensities of promotion were simulated (Figure 14). Whilst the results showed a convergence towards a possible 'stable' level of participation in the longer term, the effects were weak and would appear to act over a very long time scale. Stronger promotions will still result in sustainable benefits in the short to medium time scale.

7.6
The effects of a given level of promotional activity will produce diminishing returns with respect to new recruitment the higher the numbers of existing composters (Figure 15). Again the model predicts a slow, though very long term convergence towards a 'natural' level. The model also indicates that home composting rates above 50% may not be intrinsically sustainable.

Figure 14
Figure 14. Long-term Effects of Different Intensities of Promotion

Figure 15
Figure 15. The Effect of a Promotional Campaign in Communities with Different Levels of Prior Participation

7.7
Stimulating new participations will not however increase the weight of organic material diverted pro-rata with the increase in participants (Figure 16). It is likely that those with high organic weight arisings may already be composting. Promotions may mainly serve to stimulate those with lesser amounts of organic waste to take up composting, so there may be a drop in weight per participant as participation increases. The model again predicts that there is likely to be diminishing returns with increased promotion and participation.

Figure 16
Figure 16. Total Weight of Material Composted per Participant per Week

Figure 17
Figure 17. Weights of Paper contributed per Participant per Week

7.8
However, the model predicts that there will be an increase in the amount of paper products composted over time (Figure 17). This results from two factors. Firstly, as proficiency (through taking help, successful experiences and social dialogue), more people will realise that paper is compostable, and secondly more will realise that paper can be a beneficial ingredient in times when there is an excess of soft green wastes. Paper additions are predicted to peak in spring coinciding with the [presumed] onset of high grass cutting loadings. However, the absolute levels of paper additions are predicted to be quite low at less than 8 broadsheet pages of newspaper (or their equivalent) per household per week at their peak.

7.9
The predicted increase in proficiency with time is predicted to lead to a general improvement in compost quality (Figures 18 and 19). These simulations were based on different levels of 'help' being available when quality problems were flagged. Figure 18 shows the proportion of 'poor quality' compost produced by the community week by week. In the current model 'poor quality' refers specifically to a product that had turned anaerobic during its production. The smoothed yearly averages of these data are given in Figure 19.

Figure 18
Figure 18. Weekly Production of Poor Quality Compost as a Function of Levels of Available Help

Figure 19
Figure 19. Yearly Averages of Poor Quality Compost as a Function of Levels of Available Help

7.10
The results predict that high availability and high quality of help are both important in the two years following the promotion, though the quality of the advice appears to become less important thereafter. There is however a predicted quality improvement even without significant explicit help being provided. This is mainly explained through a combination of model proficiency improvements through social dialogue and the selective drop out of some initial poor producers.

* Discussion

Waste Management

8.1
The simulations have demonstrated that there might be an inherent stability of behaviours amongst the home composters. The turnover of composters within the community is predicted to be fairly low, and might be kept quite stable if frequent 'background' messages are conveyed to the population, perhaps as part of a general waste awareness campaign. Such stimuli should encourage sufficient new recruits to counterbalance any natural drop out resulting from uncorrectable events, such as the onset of infirmity or moving to a property that is not conducive to composting. The simulations have also illustrated how successful participation in home composting might serve to strengthen an individual's proficiency in the composting activity and help to sustain that activity into the future. Several other researchers (e.g Pieters, 1989; and Boldero, 1995) have reached similar conclusions that individual waste management behaviours often tend to be quite stably maintained, and psychological investigations have also demonstrated that prolonged experience in waste management schemes can strengthen the participant's intentions and correct any misconceptions (Bagozzi et al., 1992; Dahab et al., 1995), and strengthen their pro-activity attitudes as well (Werner et al., 1995).

8.2
The simulation studies have also indicated that promotional campaigns to encourage home composting, through the distribution of composting bins, may achieve increases in home composting activity that are sustainable at least into the medium term. This contrasts with many other waste management interventions where results were found to decay back to pre-intervention levels once the management intervention was withdrawn (Schultz et al., 1995; Porter et al., 1995). The simulations predict that there may be many latent composters, who might potentially respond positively to interventions to start them composting.

Simulation Methodology

8.3
The simulations developed here were based on the further development of the model structures for simulating household waste management behaviour, described by Tucker and Smith (1999). The current paper highlights two important components of the model that were introduced but not tested in the previous publication. The first of these is the simulation of behavioural changes that are triggered by external events, whilst the second relates to the integration of technical models into the behavioural model (Tucker and Smith 1999, ¶2.2).

8.4
In developing the model, it was theorised that core household waste management behaviours may be intrinsically stable, and that these behaviours can be determined by the relative strengths of the antecedent attitudes held by the household, or through other specifically identified attributes pertaining to the household. Any given household behaviour is modelled a pre-programmed response to the local facilitating conditions provided by the waste management scheme operator. Random fluctuations are introduced to simulate local spatial and short-term temporal variations in those responses. This core model can simulate many of the 'natural' variabilities seen in real communities (Tucker, 1997-98), but cannot account for behavioural change.

8.5
Behavioural changes are modelled through a perturbation of one or more underlying household attributes as a result of triggering events. The attribute changes are allowed to affect households individually or act coherently across larger segments of the population, and can be irreversible or reversible depending on the nature of the triggering event. A key feature is that the extent of attitude change will be determined not only by the magnitude of the stimulus but also by the individual actor's susceptibility to that stimulus (modelled by the susceptibility and resilience attributes of the actor). A second key feature of the model is the inclusion of distinct thresholds at which behavioural changes are assumed to occur. Behavioural changes will only be triggered when the induced attribute changes cross these thresholds. The resultant changes shift the affected actors into a different, but still stable, behavioural state. The new behaviours are still determined by the same set of model rules, but now applying these rules using the updated set of predictor variables. This obviates the need to provide individual model actors with a memory. This mechanism also provides a simple model for simulating 'learning' amongst the actors either through increasing their knowledge (through decreasing their ignorance attribute) or improving their ability to perform a task (through increasing their task proficiency attribute). It also provides a mechanism to account for why, in some cases, prolonged or repeated experiences may be necessary before behavioural changes are triggered (see Werner et al., 1995).

8.6
It can be inferred from the observed long-term behavioural stabilities, that triggering events affecting any given actor may actually be relatively infrequent under normal circumstances. It is also evident from empirical evidence that most actors may not interact frequently with other actors (at least within the waste management domain). Diffusion of waste management behaviours through normative influences may be fairly weak. Tucker (1999b) provided additional evidence that normative enhancement of behaviours amongst recycling populations can be weak and difficult to distinguish from the 'natural noise' of the system. The scale of the phenomenon allows it to be simulated adequately by relatively simple models. The development of more sophisticated 'behavioural diffusion' models may not be necessary in this particular domain. In the simple model, interactions are always assumed to lead towards the convergence of attitudes of the interacting actors (Tucker and Smith 1999, ¶2.18). The simulation supported the empirical evidence that the effects of social encounters may be small and infrequent.

8.7
It is acknowledged that there can be many other triggers of behavioural change, amongst home composters, apart from social interaction. General waste awareness campaigns could be one. Televised gardening programmes might also contribute. In the model all such possible factors are treated as a single 'lumped' background stimulus. In developing the model, it was chosen to apply this stimulus in the form of discrete random events affecting the relevant pro-activity attitude. This implementation was adopted: firstly to provide conformity with the model mechanisms already developed to handle discrete adverse events, and secondly to provide a suitable model mechanism for simulating a more 'spontaneous' purchase of a compost bin.

8.8
In home composting, the householders not only have the social responsibilities for segregating their waste but also must assume the technical responsibilities for manufacturing the compost. Perceptions of the outcome of that manufacturing process can feed back into the householders' decision making process on whether to sustain their composting activities. In order to simulate the post-event judgements of the householders, it is first necessary to simulate their individual manufacturing process to provide the output criteria upon which their judgements will be made. A seamless integration of a technical composting model into the social simulation has been enabled: (i) through matching the input/output requirements of the two models via a common vector of material flow, (ii) by utilising household attributes, primarily the proficiency attribute, as a process control variable within the technical model, and (iii) by feeding back the process monitoring data to the social model as instances of discrete events, which are then handled like any other discrete event in the social simulation.

8.9
The technical simulation of the manufacturing process has been kept quite simple, utilising simple [empirical] kinetics to approximate the process reactions, based on a limited physical parameterisation of the technical system. The methodology used was to develop simple model functions that could adequately emulate the key outcomes of the more sophisticated and more theoretically based compost engineering models described by Fletcher et al. (2000). The functions within the model will be refined following the development and application of an updated home compost engineering model which is currently under construction by the authors.

8.10
A key feature of the process model control variables is the inclusion of randomness: (i) in setting the initial physical state of the system, and (ii) in the timing of control actions (such as turning the heap). Experienced and proficient composters tend to get these conditions right (usually by heuristics rather than science-based reasoning). Novice composters may be less likely to get them right. The model handles this variability (i) by setting conditions to the optimum for those classified as proficient, and (ii) allowing a progressively wider spread of possible conditions for composters of lower proficiency.

8.11
The development and refinement of the discrete event simulations, the development of the technical model and its interface with the social simulation have all been guided by the stringent user requirement that the simulation must run on a PC in a reasonable computational time. The requirements were that the model community should allow for up to 30,000 households, and allow the simulations to be run, typically, for 3 years of simulated time. With a calculation step of 1 week, these requirements entail over 4.5 million separate household simulations to be made in each model run. It is also borne in mind that each household simulation involves the separate and interactive modelling of source reduction activities, drop-off and kerbside recycling, and dustbin management as well as participation in home composting. To keep the overall solution tractable, model development has focused on seeking computational simplicity by selecting the simplest possible model structures that are 'adequate for purpose'.

8.12
The current implementation was written in Visual Basic 6. A typical simulation of 52 weeks home composting in a community of 5000 households takes approximately two and a half minutes to run on a PC with Pentium II processor running at 233 MHz. The general model outcomes have been tested extensively against results obtained from a parallel experimental research programme on both recycling (Tucker 1997-98, Tucker 1999a, Tucker 1999b; Tucker et al. 1997, Tucker et al 1998a, Tucker et al 1998b, Tucker et al 1998c, Tucker et al 1998d, Tucker et al 2000; Tucker and Smith, 1999) and composting (Tucker et al. forthcoming, Fletcher et al., forthcoming). The program code is not yet available publicly, though there are plans to release a demonstration version before the end of the year 2001.

* Acknowledgement

The research was funded by the UK Economic and Social Research Council (ESRC) under the ROPA award scheme, award number R022250140.

* References

AZJEN, I. (1985), From Intentions to Actions: A Theory of Planned Behaviour. In Action Control: From Cognition to Behaviour, (Kuhl and Beckmann, eds.), Springer Verlag: New York.

BAGOZZI, R.P., Baumgartner, H., Youjai, Y. (1992), State versus Action Orientation and the Theory of Reasoned Action: An Application to Coupon Usage. J. Consumer Research, 1992, 18, pp. 505-508.

BOLDERO, J. (1995), The Prediction of Household Recycling of Newspapers: The Role of Attitudes, Intentions and Situational Factors. Journal of Applied Social Psychology, 25(5), pp. 440-462.

DAHAB, D.J., Gentry, J.W., Su, W. (1995), New Ways to Reach Non-recyclers: An Extension of the Model of Reasoned Action to Recycling Behaviourss. Adv Consumer Res., 1995, 22, pp. 251-256.

DAS, K. & Keener, H.M., (1997), Numerical Model for the Dynamic Simulation of a Large Scale Composting System. Transactions American Society of Agricultural Engineers, Vol.40(4), pp 1179 - 1189.

DETR, 1998, Home Composting in England and Wales. October, 1998.

DETR,1999a, A Way with Waste. A Draft Waste Strategy for England and Wales. Part One. June 1999.

DETR, 1999b, Limiting Landfill: A Consultation paper on limiting landfill to meet the EC Landfill Directive's targets for the landfill of biodegradable municipal waste. October 1999.

DOE. 1994, National Household Waste Analysis Programme, Phase 2, Vol 1. Report No. CWM O82/94. Department of the Environment: London, 1994.

ENDS, 2000, Waste Management, "Slim your bin" campaign yet to change consumer behaviour. The ENDS Report No. 301, February 2000.

FLETCHER, I., Durrant, A.P., Tucker, P. (2000), COMPOST MODELLING - A Literature Review of Existing Models and Their Applicability to Domestic Composting. Progress in Environmental Science, 2(2) in press.

FLETCHER, S.I., Speirs, D., Durrant, A.P., Tucker,P. (forthcoming) Recovery and Composition of Kitchen and Paper Wastes in Home Composting. Environmental & Waste Management (submitted).

GOLDENHAR, L.M. and Connell, C.M. (1993), Understanding and Predicting Recycling Behavior: An Application of the Theory of Reasoned Action. Journal of Environmental Systems, 1993, 22(1), pp. 9-103.

GUAGNANO, G.A., Stern, P.C., Dietz, T. (1995), Influences on Attitude-Behavior Relationships. A Natural Experiment with Curbside Recycling. Environment and Behaviour, 1995, 27(5), pp. 699-718.

JONES, R.E. (1990), Understanding Paper Recycling in an Institutionally Supportive Setting: An Application of the Theory of Reasoned Action. Journal of Environmental Systems, 1990, 19(4), pp. 307-321.

PIETERS, R.G.M. (1989), Attitudes and Behavior in a Source Separation Program. A Garbology Approach, Eurobon: Delft, The Netherlands.

PORTER, B.E., Leeming, F.C., Dwyer, W.O. (1995), Solid Waste Recovery: A Review of Behavioural Programs to Increase Recycling. Environment and Behavior, 1995, 2, pp.122-152.

SCHULTZ, P.W., Oskamp, S. Mainieri, T. (1995), Who Recycles and When? A Review of Personal and Situational Factors. Journal of Environmental Psychology, 1995, 15, pp. 105-121.

STOMBAUGH, D.P. & Nokes, S.E., 1996, 'Development of a Biologically Based Aerobic Composting Simulation Model', Transactions American Society of Agricultural Engineers, 1996, Vol.39(1), pp 239 - 250.

TAYLOR, S. and Todd, P. (1995), An Integrated Model of Waste Management Behavior: A Test of Household Recycling and Composting Intentions. Environment and Behaviour, 1995, 27(5), pp. 603-30.

TUCKER, P., (1997-98), Accounting for spatial and temporal variabilities in household waste recycling schemes: a simulation approach. Journal of Environmental Systems, 1997-98, 26(4).

TUCKER, P. (1999a), A Survey of Attitudes and Barriers to Kerbside Recycling. Environmental and Waste Management, 1999, 2(1), pp. 55-63.

TUCKER, P. (1999b), Normative Influences in Household Waste Recycling. Journal of Environmental Planning & Management, 1999, 42(1), pp. 63-82.

TUCKER, P., Smith, D. (1999), Simulating Household Waste Management Behaviour. Journal of Artificial Societies and Social Simulation, 1999, vol. 2, no. 3, https://www.jasss.org/2/3/3.html

TUCKER, P., Murney, G., Lamont, J. (1997), Participation in Recycling: A Comparative Study of Four Kerbside Collection Schemes. J. Waste Management and Resource Recovery, 4(1), pp 11-26.

TUCKER, P., Murney, G., Lamont, J. (1998a), Predicting Recycling Scheme Performance: A Process Simulation Approach. J. Environmental Management, 52, pp 31-48.

TUCKER, P. Murney, G., Lamont, J. (1998b), A Decision Support Model for the Management of Recycling Schemes. J. Environmental Planning and Management, 41(4), pp 445-462.

TUCKER, P., Murney, G., Lamont, J. (1998c), What Newspaper Recyclers Recycle and What they do not Recycle. Environmental and Waste Management, 1(1), pp 33-56.

TUCKER, P., Lamont, J., Murney, G., Smith, D. (1998d), Material Capture Rates in Household Waste Recycling Schemes. Environmental and Waste Management, 1(3), pp 169-181.

TUCKER, P., Speirs, D. & Smith, D. (2000), The Impact of a Change in Collection Frequency on Kerbside Recycling Behaviours. J. Environmental Planning and Management, 43(3), pp 335-350.

TUCKER, P., Speirs, D., Fletcher, D. (forthcoming), Factors Affecting Take-Up and Drop-Out From Home Composting Schemes. Sustainable Development (submitted).

WASTE WATCH. (1998). What People think about Waste. Waste Watch: London.

WERNER, C.M., Turner, J., Shipman, K., Twitchell, S., Dickson, B.R., Brushke, G.V., Von Bismarck, W.B. (1995), Commitment, Behavior and Attitude Change: An Analysis of Voluntary Recycling. J. Env. Psychology, 1995, 15, 197-208.

WHITE, P.R., Franke, M., Hindle, P. (1996). Integrated Solid Waste Management. A Lifecycle Inventory. Blackie Academic & Professional: Bishopbriggs, Glasgow.

----

ButtonReturn to Contents of this issue

© Copyright Journal of Artificial Societies and Social Simulation, 1999