©Copyright JASSS

JASSS logo ----

Anne Dray, Pascal Perez, Natalie Jones, Christophe Le Page, Patrick D'Aquino, Ian White and Titeem Auatabu (2006)

The AtollGame Experience: from Knowledge Engineering to a Computer-Assisted Role Playing Game

Journal of Artificial Societies and Social Simulation vol. 9, no. 1
<https://www.jasss.org/9/1/6.html>

For information about citing this article, click here

Received: 30-May-2005    Accepted: 18-Nov-2005    Published: 31-Jan-2006

PDF version


* Abstract

This paper presents the methodology developed to collect, understand and merge viewpoints coming from different stakeholders in order to build a shared and formal representation of the studied system dealing with groundwater management in the low-lying atoll of Tarawa (Republic of Kiribati). The methodology relies on three successive stages. First, a Global Targeted Appraisal focuses on social group leaders in order to collect different standpoints and their articulated mental models. These collective models are partly validated through Individual Activities Surveys focusing on behavioural patterns of individual islanders. Then, these models are merged into a single conceptual one using qualitative analysis software. This conceptual model is further simplified in order to create a computer-assisted role-playing game.

Keywords:
Knowledge Elicitation, Associative Network, Ontology, Water Management, Pacific, Tarawa

* Introduction

1.1
Low coral islands are heavily dependent on groundwater for freshwater supplies. The availability, quality, and management of groundwater are central to sustainable development and poverty alleviation in many developing small island nations. Increasing populations, growing per capita demand and restricted land areas limit water availability and generate conflicts (Falkland and Brunel 1993).

1.2
This study is carried out in the Republic of Kiribati, on the low-lying atoll of Tarawa (see Fig.1). The water resources are predominantly located in freshwater lenses, recharged through rainwater infiltration, on the largest islands of the atoll. The water table is typically 0.8 to 1.6m below ground surface. South Tarawa is the capital and main population centre of the country. The water supply for the urban area of South Tarawa is pumped from horizontal infiltration galleries in groundwater-protected zones called "water reserves" on Bonriki and Buota islands. They currently supply around 1300 m3/day, equivalent to about 30L/capita/day of freshwater, representing 60% of the needs of South Tarawa's communities. Rainwater tanks and local private wells complement the offer (White et al. 2002).

Figure 1
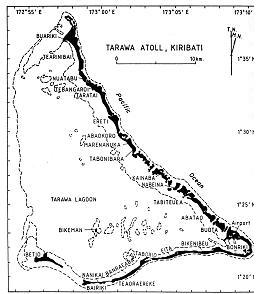
Figure 1. Map of the atoll of Tarawa. Bonriki and Buota islands located on the lower right side of the map

1.3
The declaration by the Government of water reserves over private land has lead to conflicts, illegal settlements and vandalism of public assets. Moreover, the water consumption per capita tends to increase towards western-like standards, threatening the sustainability of the actual exploitation system. Finally, pollution generated by the 45 000 habitants of South Tarawa has already contaminated all the freshwater lenses, with the exception of Buota and Bonriki reserves (White et al. 1999). The Government is now conducting intensive groundwater investigations on neighbouring islands of Abatao and Tabiteuea in order to estimate potential sustainable water yields from these islands. Depending on the results of the investigations and community response, these groundwater resources could be used to supplement the actual water supply to South Tarawa. However, already available information underlines the necessity to take into account the social impact of such implementation, in order to avoid the problems encountered on Bonriki and Buota.

1.4
Our project aims at providing the relevant information to the local actors, including institutional and local community representatives, to facilitate dialogue and devise together sustainable and equitable water management practices. A Companion Modelling approach — coupling a Role-Playing Game and an Agent-Based Model - is implemented to fulfil this aim. This approach has already demonstrated its capacity for promoting discussion amongst stakeholders with contrasted and eventually conflicting viewpoints (Bousquet et. al. 2002; D'Aquino et. al. 2003). As a matter of fact, its success is inherently correlated with the ability of the players to identify their own mental constructs with the game's features. Thus, it appears essential to format the game according to stakeholders' standpoints. Becu et. al. (2003) showed that using knowledge elicitation techniques to infer formal ontologies is anything but trivial.

1.5
This paper focuses on the methodology developed to collect, understand and merge viewpoints coming from different stakeholders in order to build a shared representation of the system through a conceptual model using Unified Modeling Language (UML). Our aim is to develop a semi-automatic process using qualitative analysis software to convert narratives that provide individual and partial descriptions of the system into a shared but simplified UML-based representation. This common platform is then used to build the essential elements of the computer-assisted Role Playing Game, whilst conflicting issues are incorporated into the flexible design of the playing sessions. The implementation of the Role Playing Game itself is described in a companion paper (Dray et. al. 2005). The sequence of knowledge acquisition and knowledge processing steps is summarized in the flow chart below. It provides a quick glance at the tools, aims and labour involved at each stage and described in further details in the following sections of the paper.

Figure 2
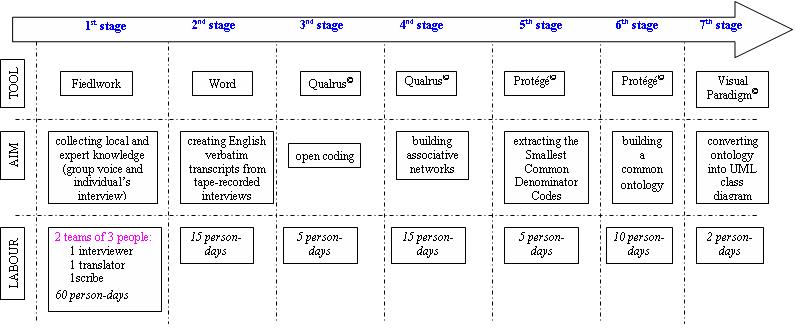
Figure 2. Sequence of knowledge acquisition

* Eliciting Local Knowledge

Theoretical assumptions

2.1
We recognize the epistemic construction of knowledge and believe that the nature of individual representations is socially constructed through people's interactions with their physical and social environment (Smith 1993; Descola 1996). We agree on the fact that these adaptive mental models can be partly elicited through Knowledge Engineering-based techniques and translated into conceptual models (Becu et al. 2003). Along with Benford and Snow (2000), we assume that social groups carry collective representations (collective frames) of their environment and that these mental models can be partly elicited from wisely selected representatives (Group Voices). We argue that individuals belonging to the same group share the same representation, but their behaviour is driven by personal motivations and tacit knowledge. Thus, they can temporarily dismiss part of the shared representation. Our methodology includes two sets of interviews. The first one, called Global Targeted Appraisal (GTA), is meant for eliciting Group Voice's representations of the key components and processes at stake. The second one, called Individual Activities Survey (IAS), is conducted with individuals selected randomly among the different groups. It is used to validate and eventually quantify the interactions that unfold during the GTA interviews.

Global Targeted Appraisal

2.2
Prior to the interviews, a short survey assisted in selecting relevant spatial and social groups. The survey was meant to gain an insight into hierarchical links and thus helped identifying 26 Group Voices who were leaders or active members belonging to different religious (Catholic or Protestant), cultural (elders committee), administrative (council), educational (head teacher, Sport group) or gender (Women association) groups. Those selected were then interviewed individually at their place through semi-structured interviews in order to highlight their understanding of the main interactions between local people and water resources. The interview was divided into three exercises. Exercise 1 was based on photo interpretation and dealt with Tarawa overall features. Exercise 2 consisted in a cognitive mapping focusing on the interviewee's home island. Exercise 3 consisted in a card game focusing on water cycle and human use.

2.3
For the first exercise, four successive groups of photos referring to different aspects of Tarawa's environment and activities were given to the interviewee. For each group, the interviewer gave at first the general topic of discussion and asked the interviewee to describe important elements in the photos related with the topic. In order to structure the discussion and to avoid missing elements, additional prompting questions were available if necessary. The "How?" and "Why?" questions were eventually used to refine the interviewee's view. According to the laddering technique (Reynolds and Gutman 1984), "How?" provides more in-depth information about the process described and "Why?" provides more global reasons concerning the process described. The topics discussed with the interviewee were: population, landuse and landownership; social and economic activities; climate and environment; water resources and water use; environmental pollution and water quality.

Figure 3
Figure 3. Elder man in Abatao commenting photos on economic activities

2.4
The first exercise of the GTA was meant to establish confidence with the interviewees and to let them browse general topics without focusing immediately on sensitive local issues. Thus, we started from demographic evolution and constraints and ended with global problems of pollution on south Tarawa. From a psychological viewpoint we wanted to confirm the ability of the interviewees to develop dynamic rationales from static material (i.e. photos). A second objective was to test our ability to elicit their mental constructs.

2.5
For the second exercise, the interviewee was provided with a sheet of paper and asked to draw successively the location or the spatial distribution of the island's key features. Key features were grouped according to topics largely overlapping the ones described for South Tarawa. The interviewer interacted directly on the map with the interviewee. When one group of key features had been displayed on the map, prompting questions used during the first step were reused in order to cross check information consistency and to outline the island's specificities. 3.5

2.6
The second exercise of the GTA was meant to focus on specific issues related to the interviewee's island. Most of the time, it was mainly an update of the general considerations expressed during the first exercise and the discussion often concentrated on the specific features of the island's society and environment. From a psychological viewpoint, our objective was to confirm the interviewees' ability to represent spatial entities, to manipulate these entities on the map and to describe dynamic processes directly on the map. These were essential elements to validate the use of a Role-Playing Game later on. 3.6

2.7
The third exercise, involving a card game between the interviewer and interviewee, focused on the way the interviewee understood and represented water management processes. The notion of water management encompassed the natural water cycle along with human activities (consumption, pollution, protection). The interviewer had 60 cards in his hands, representing "elements" that seemed important for water management processes. At first, the cards "Coconut ", "Rainfall" and "Groundwater" were dispatched on a board and the interviewee was asked to provide other elements to complete the natural water cycle. The interviewee was also asked to draw links between cards ('action', 'relation', 'impact') and to describe them in a few words. The second set of cards displayed was: "Household", "Pig" and "Vegetable Crop". The topic was about direct water management from local settlers. The last set of cards included "Government", "PUB" (the local water agency) and "South Tarawa Residents". This part focused more on water management at the institutional level.

Figure 4
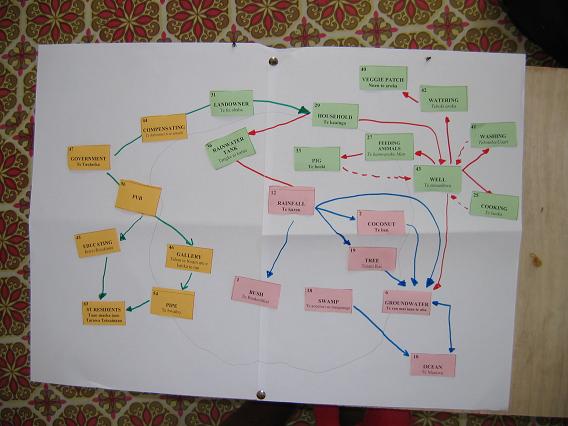
Figure 4. Example of Card Game's flowchart. Including: natural water cycle elements (pink), human activity elements (green), and institutional elements (orange)

2.8
The last exercise was directly meant to elicit individual knowledge of water management processes. The card game was designed to disaggregate these representations into unit elements and causal links (Figure 4). As mentioned previously, some of the elements had been discussed during the first exercise (in a broader context) and it was interesting to observe whether these elements might reappear during the card game. From a psychological viewpoint, beyond the ability of the interviewees to disaggregate their mental constructs into basic elements, we were interested in verifying their acceptance to play the game by the rules and their capability to justify a given choice. Again, these hints were valuable in the perspective of a Role-Playing Game implementation.

Individual Activities Survey

2.9
The objectives of this second field survey were to partly validate the models elicited during the Global Targeted Appraisal and to quantify some relationships already described by the Group Voices. In order to achieve these objectives, 24 persons were selected amongst the 4 islands and submitted to specific individual interviews. This time, the interview relied upon a more structured questionnaire, focusing on local facts and personal activities and behaviour. Interviews were generally held in the central house or shelter with viewing distance to the well and other domestic facilities. Questions were grouped within five topics similar to the ones used in the GTA: demography and landownership; activities and landuse; water resource and water use; improving water-use and sanitation; water reserve.

* Processing Elicited Knowledge

From Narratives to Associative Networks

3.1
Prior to analysis, the first stage consisted in translating the tape-recorded interviews into proper verbatim transcripts in English. Pronouns and generic terms such as People, He/She, Island, etc...were avoided or substituted, whenever possible, by accurate terminology without biasing the overall meaning. 5.2

3.2
The next stage aimed at building associative networks using Qualrus© (Idea Works Inc. 2002), a qualitative analysis software. Qualrus© uses intelligent computational strategies, namely case-based reasoning, natural language generation, semantic networks, and production rules, to assist researchers in coding and analysing texts. It is well suited for extracting and organising concepts or knowledge objects from text and to represent knowledge through semantic or associative networks. (Quillian 1968; Brent and Slusarz 2003). They are labelled, directed graphs in which the nodes are concepts or objects — referred to in Qualrus© as codes — and the arcs or links connecting nodes represent different relationship or associations between those concepts or objects. 5.3

3.3
Adapting techniques coming from transcript analysis (Newell 1982; Shadbolt and Milton 1999), codes are first extracted by identifying social/institutional elements, spatial/geographical elements and passive/biological elements. Substantives referring to processes such as pollution or infiltration are not converted into codes but rather kept aside for the linking stage. This stage, referred to as open coding by Strauss and Corbin (1990), occurs at a fairly low level of abstraction, codes being derived from the natural language of the interviewees. We initiate the analysis by appraising the narratives on screen, and assigning codes, sentence by sentence (Figure 5). As the coding progresses, Qualrus© facilitates the search for eligible candidates by suggesting already available codes. Hence the coding process can thereafter be achieved either automatically or still at the user's discretion. Concepts with similar meanings are clustered under the same alias. Statistical analysis is then applied to discard "minor" codes (codes appearing only once or twice throughout one interview). On average, 40 codes are used per interview. By comparison, the global list, obtained by blending all individual lists and discarding duplicates, contains 81 codes.

3.4
Then we instantiate relational or structural links between codes. Following Clancey (1989), we acknowledge the fact that the system is limited by the user's understanding of the meaning of the links in an associative network. In our case, we use associative networks as an intermediate tool in order to structure narratives for the following stage. Hence, codes and links provide the backbone for designing ontologies thereafter (Figure 5).

Figure 5
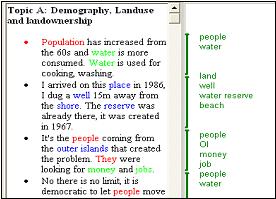
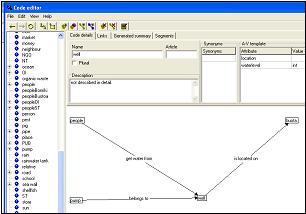
Figure 5. Qualrus© coding view with narrative (left) and codes (right)

3.5
Then, we overlap the 26 individual lists of codes, in order to extract a sub-list called the Smallest Common Denominator Codes (SCDC). As a rule of thumb, a code belongs to the SCDC if it appears in at least 20 interviews out of 26. A list of 23 "major" codes is thus established. We only retain links associating 2 codes belonging to the SCDC; all the others are discarded. Hence, the SCDC and associated links portray a simplified but common representation of the system.

Figure 6
Figure 6. Partial view over an Associative network. Codes and links are individually labelled

3.6
Several results could already be derived from these intermediate associative networks. All interviewees were fully aware of the population increase on South Tarawa and its impact on society and environment, the main issue being land pressure. Related codes belonging to the SCDC are: people from South Tarawa, people from Outer Islands, South Tarawa, child, land and landowner.

3.7
Cash activities were mainly linked to Government jobs available on South Tarawa, while subsistence economy, based on fishing and cropping, still prevailed on Abatao and Tabiteuea islands. Related codes belonging to the SCDC are: Government, money, fish, crop and goods.

3.8
However, fewer interviewees had stressed the fact that climate pattern and weather features had changed over time, as rain and climate do not belong to the SCDC. Concerns about coastal erosion and sea level rise were not yet largely shared amongst the interviewees (ocean and seawall are not included into the SCDC). Interestingly, groundwater does not appear in the SCDC despite various attempts to describe water infiltration processes. 5.9

3.9
Illegal taping into the PUB pipes and illegal settlements on the water reserves were issues openly discussed by several interviewees, but not quoted enough times to be incorporated in the shared representation. With regards to pollution, most interviewees mentioned organic and inorganic wastes, both part of the SCDC. However, the impact of pigs on the environment, especially on groundwater contamination, is not mentioned enough to be included. As a matter of fact, pig is not part of the SCDC.

From Associative Networks to a UML-based Common Ontology

3.10
Results from the 3rd exercise are then used to refine the SCDC. As aforementioned, groundwater, rain and pig were not included in the SCDC. By giving interviewees these specific cards during the exercise, we were forcing them to associate their mental constructs with these elements. The list of 60 playable cards was first established by testing the game with Australian and I-Kiribati experts directly involved in, or at least aware of, issues related to groundwater management in Tarawa. It appears that only 4 codes out of the 23 encompassing the SCDC had not been created as playable cards, namely: child, fence, fish and goods.

3.11
A first analysis consisted of counting the number of cards displayed and noting the elements cited. Overall, the interviewees took an average of 28 cards out of 60 and most of them were much more comfortable with the second theme. The reference to their daily life obviously helped to build useful analogies, whereas the level of abstraction required with themes 1 and 3 was more challenging.

3.12
An interesting outcome was the fact that, unlike during the first exercise, a large majority of people were able to describe an infiltration-like process linking the rainfall input with the groundwater recharge. The freshwater lens itself was seldom perceived as a specific entity, but rather as an attribute of the soil itself ("water in the soil"), which confirms the results from the first exercise (groundwater not being included in the SCDC). The sanitation elements were often skipped from the representation as if they were not part of the water cycle. Although organic and inorganic wastes are part of the SCDC, we were probably forcing, during the first exercise, mental constructs of interviewees by including in the set of photos snapshots of obviously polluted areas of South Tarawa. Finally, the interaction with South Tarawa was described during the card game through engineering elements and links, namely "pipe", "PUB tap". But the institutional and legal aspects were merely represented through negotiation between landowners and Government (Compensation card).

3.13
Different table breakdowns give more details about specific socio-cultural sub-groups (Figure 7). First, higher educated people had a better understanding of complex processes (Evaporation, Taxation) and a greater awareness of modern technologies (Pump, Gallery). This group hardly overlap with a precise age group. If the young/middle age group mentioned "Evaporation" more often then their elders, this group was mainly characterized by a strong focus on financial negotiations with the government about the water reserves (Landowner and Compensation elements). We were also interested in checking whether the Government Expert and Council Member groups would display specific features. So far, the latter didn't show any specificity compared with the overall results. But the first group clearly demonstrated its (partial) belonging to the high education one (Evaporation and Taxation elements). Beyond this common characteristic, the experts are almost the only ones to mention the pollution and sanitation elements in the water cycle (Pollution).

Figure 7
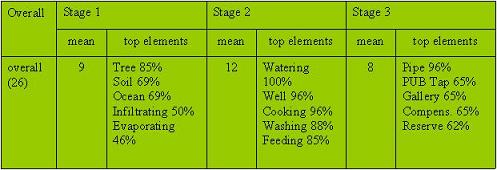
Figure 7. Overall table ranking most quoted elements during the card game

3.14
A critical question was whether people shared equivalent representations of the hydro-geological processes. The card game successfully demonstrated that almost everybody was able to describe an infiltration process leading to the recharge of an island-wide freshwater lens. This was of prime importance in order to give us some legitimacy to incorporate biophysical elements to the shared representation, namely groundwater and rain.

3.15
After extracting major codes and associated links, it is necessary to formally explicit the concepts behind the codes, and the way these concepts interact with each other. In other words, we need to build a common ontology according to Gruber's definition: a specification of conceptualizations, used to help programs and humans to share knowledge (Gruber 1993). We used Protégé© (Noy and McGuiness 2001), an ontology building software, in order to define classes in the ontology, then to arrange classes in a taxonomic hierarchy, and finally to describe allowed values for their instances. Hence, codes from the SCDC are converted into classes within Protégé©. Links expressing characteristics are converted into attributes with corresponding allowed values when they are available. Links describing behaviour are directly translated into methods. Associations, generalization and aggregations are finally incorporated in the UML-based Class Diagram representation (see Fig. 7).

Figure 8
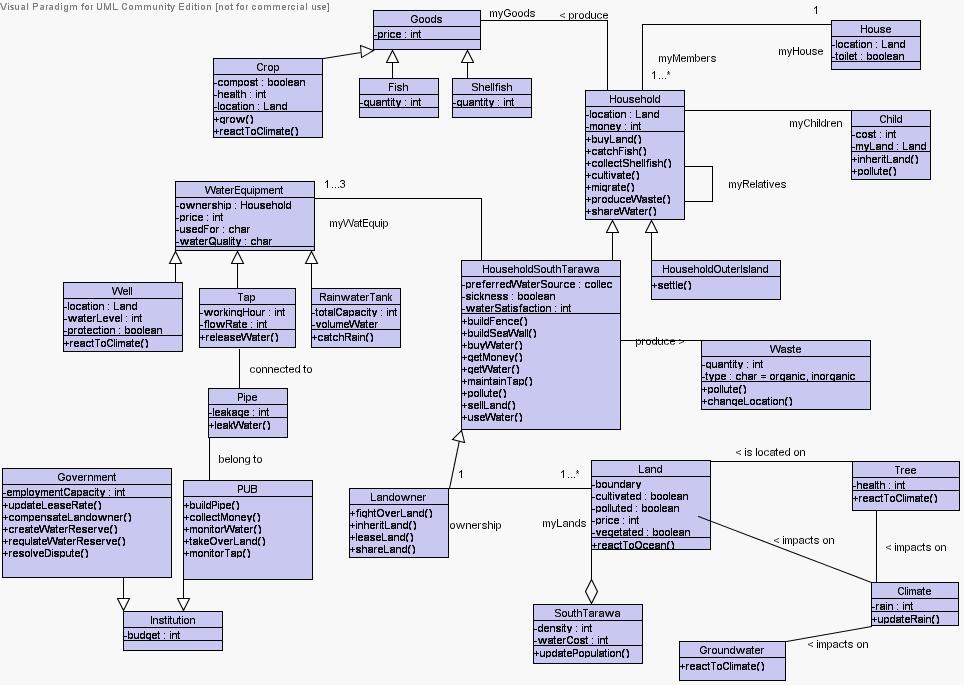
Figure 8. UML-based Class Diagram representation of the common ontology

Validating the Conceptual Model with the IAS

3.16
As aforementioned, the IAS was meant to partly validate the models elicited during the Global Targeted Appraisal. Quantitative results from the survey were used to supplement attribute values in the Class Diagram.

3.17
Family size ranged from 3 to 18 people with an average of 8 members. We considered here the close family living in the same compound and sharing some facilities. The average size of a block of land was 2.5 acres, the maximum size being approximately 6 acres. Generally, these blocks were collectively owned by different family members (2 to 10). According to the extended family concept, the landowners had often and regularly to accommodate incoming relatives on their block. On average, three other families were living on the same block as the interviewee. This average value, however, hardly expressed the diversity of the cases (between 0 and 10).

3.18
In terms of water use, each interviewee, except one, had access to a personal well. But alternative sources of water delineated again a large difference between Tabiteua/Abatao islands (only one person collecting rainwater into drums) and Buota/Bonriki islands where the range of equipments was more diversified (drums, PUB water, and rainwater tanks). On average, families used 460 l of water daily. Given an average family size of 8 people, the consequent 58 l/person/day represented a rather high estimate of the usual figures quoted in the literature (between 30 and 50 l/person/day). One has to remember that most of the interviewees didn't face any problem of water availability, and that most of them enjoyed very good water quality. Hence, a free access resource didn't limit the consumption. Furthermore, most interviewees confessed that everyone in the family, including children, were obtaining water from the well on an instant demand basis. Consumption from families regularly watering their vegetable plots jumped to an average 100 l/person/day.

3.19
Nearly 95% of the interviewees considered their water as safe and didn't recall any health incident linked with water quality. Nobody on Tabiteua/Abatao islands considered that their island faced pollution problems, whereas 45% on Buota/Bonriki islands complained about an increasing threat. It was an interesting statement as 95% recognized throwing away grey waters in their courtyard; 25% recognized discarding solid wastes on the beach; 30% recognized discarding solid wastes in the bush (into pits or natural holes). Only few interviewees mentioned watering the garden with grey waters or composting the domestic wastes. Nevertheless, 29% admitted to regularly burning solid wastes. These results highlighted the fact that sanitation issues were largely disconnected from the water management consideration for most of the interviewees. Hence, we confirmed that the gap in the mental constructs elicited during the GTA largely overlapped with the behavioural models displayed during the IAS.

3.20
Regarding the Water Reserve issues, questions were slightly different for Tabiteua/Abatao islands (forecasted reserves) and Buota/Bonriki islands (existing reserves). On Buota/Bonriki islands, nearly 50% of the interviewees were not satisfied with the Water Reserves management by the Government. In order to agree upon the actual pumping, 31% mentioned higher financial compensation, 19% claimed free access to PUB's water, and 19% requested the recognition of their ownership rights. Nearly 44% emitted strong doubts about the Government's ability to properly manage the water pumping and distribution. On Tabiteua/Abatao islands 63% of the interviewees disagreed with the implementation process as they felt forced into it. While 50% would like to enter financial negotiations with the Government, 38% remained strongly opposed to any move towards a Water Reserve on their island. This opposition was not blindfolded as a mere 50% had no opinion about the Government's ability to conduct a proper implementation and the remaining 50% equally divided into pros and cons.

3.21
The range of contrasted viewpoints confirms the need for an effective consultation, and engagement of the local population in the design of future water management schemes in order to warrant the long-term sustainability of the system. Clear evidence of the inherent duality between land and water use rights on one hand, and between water exploitation and distribution on the other hand, provides essential features to frame the computer-assisted Role Playing Game.

* Designing the Computer-assisted Role Playing Game

4.1
The validated conceptual model is then used to design a computer-assisted Role Playing Game, called AtollGame. The assistance of a computer is needed as far as interactions between groundwater dynamics and surface water balance involve complex spatial and time-dependent interactions (Perez et al. 2003). The use of Agent-Based Modelling (ABM) enables us to take full advantage of the UML structure of the conceptual model. The AtollGame simulator is created with the CORMAS© platform developed by Bousquet et al. (1998). The Atollgame code, the detailed UML diagrams and the role-playing game description are available from the CORMAS© website). Figure 9 provides a glimpse at the final UML class-diagram designed at the conceptual stage of the ABM simulator.

Figure 9
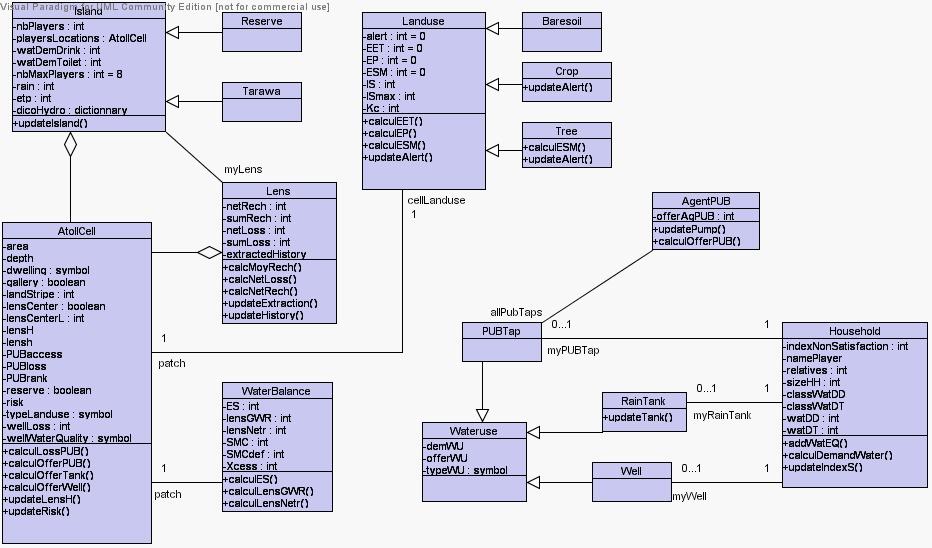
Figure 9. UML Class Diagram of the ABM simulator, built with Visual Paradigm©

The model contains one elementary spatial entity — the AtollCell — that encapsulates some of the characteristics of the groundwater lens (ie. depth, quality) at the unit level. The Lens aggregate, built from the AtollCells, depicts more larger-scale properties such as groundwater loss and recharge. The Island entity (specialised into Tarawa and Reserve), also based on aggregation of elementary cells, provides global characteristics such as rainfall and potential evapotranspiration (PET).

4.2
The model instantiates two social entities: the households and the Public Utility Board (PUB) agent. Households, divided into landowners and relatives, are mainly portrayed through attributes impacting on water resources (ie. household's size, water demand, water equipments). Monetized inputs were left aside in this first version. The PUB agent manages groundwater extraction and distribution.

4.3
The model portrays as well three passive objects: WaterBalance, Wateruse and Landuse. Each cell is linked to a WaterBalance module in charge of soil water transfers. Each Household is provided with a set of Wateruses containing at least a Well. Rain-Tank and PUB-Tank are also available to supplement access to freshwater. Three types of Landuse are taken into account (bare soil, crop and tree) and impact on the calculation of the water balance through infiltration and evaporation-related attributes.

4.4
Thus, the AtollGame simulator is a simplified and condensed version of the UML-based Class Diagram presented in figure 8. Classes have been merged following common sense and technical practicalities: the Climate class has become an attribute of the Island class; the Goods, Fish and Shellfish classes have been discarded as — unlike the role-playing game — there is no monetized component in the simulator.

4.5
The environment is based on a 50 × 45 regular spatial grid with hexagonal cells. Each unit cell plot corresponds to a 490m2 land plot. Two virtual oval-shape islands with lagoon and ocean sides are displayed (Figure 10). The top island corresponds to a scarcely populated island where the government is already pumping freshwater while the bottom one corresponds to an overcrowded island equipped with a distribution pipe for drinking water. Hence, they respectively stand as a schematic representation of North and South Tarawa.

Figure 10
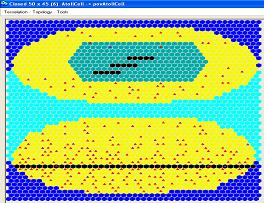
Figure 10. AtollGame environment with top island featuring Water Reserve and pumping stations, and bottom island featuring a water distribution pipe. Triangles represent the landowners (in purple) and their relatives (in red)

4.6
According to the field interviews, freshwater lenses were perceived as global and undivided resources on each island. Water infiltration into the soil was acknowledged by a majority of interviewees. Runoff was not a concern due to the very high permeability of the coral-sand soils. Water uptake by vegetation and evapotranspiration processes were far less perceived. Therefore, we opted for a simple reservoir-like water balance model. The model, called WATBAL (Falkland 1992), uses 10-day period values of rainfall and potential evapotranspiration (PET). Recharge of the lens may occur only after plants have satisfied their water requirements. Pumping galleries, traditional wells, and coconut trees are able to extract water directly from the lens. Using the Cellular Automata capacities of the simulator, the water balance is calculated for each land plot allowing the spatial heterogeneity of the processes and their time dependence to be taken into account.

4.7
The shape and the depth of the freshwater lens are calculated according to the model proposed by Volker et al. (1985). This model predicts the depth of the freshwater lens and the thickness of the transition zone from the recharge and uptake values, according to the maximum length of the lens (radius). Two strong assumptions limit the use of this simple 2D model: (1) the recharge is constant, and (2) the lens is in a steady-state condition. Hence, the model is often used for long-term predictions based on ten years averaged data. This 2D model was modified into a 3D-like simulator using the isotropic properties of the mesh (Perez et al., 2003). To do so, some cells were selected and designated as lens nucleus, surrounded by concentric circles of isopiezometric cells (Figure 11, left). The orthogonal distance between the lagoon and ocean shores, crossing a nucleus gives the value of the corresponding radius (L). The elongated lens is approximated by a succession of these elementary units. The global volume of the lens corresponds to overlapping bowls (Figure 11, right).

Figure11_left figure11_right
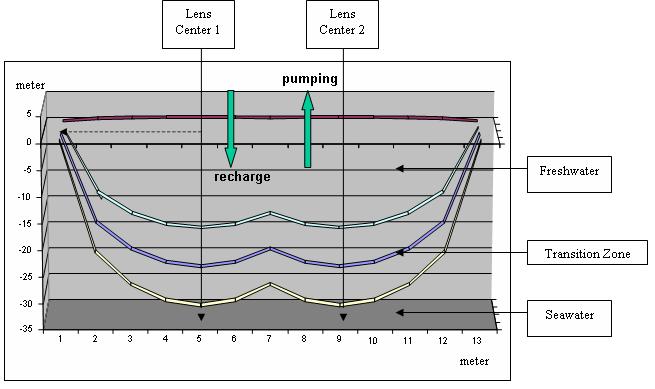
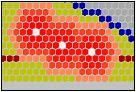
Figure 11. Representation of the freshwater lens in AtollGame. Nuclei and izopiezometric areas (left), and corresponding volume (right)

For a given land plot, the freshwater thickness is given by the attribute depth. The hydrogeological model calculates each individual depth after averaging inputs and outputs over the whole freshwater lens. This attribute is then used to specify the water quality by updating the land plot's attribute "wellWaterQuality" according to a simple rule: if the depth is lower than 1.6m, the water is considered salty, if the depth is higher than 3.1m the water is considered fresh, and in between the water is declared brackish. Hence, the simulator offers a simplified formalism of the biophysical processes involving water resources. However, the water balance model has been built and validated with the help of relevant experts.

4.8
Based on available population census, as well as data from IAS, the model mimics the population trends and relative densities on North and South Tarawa by initially allocating 50 households (11 landowners and 39 relatives) on the top island and 220 households (42 landowners, 158 relatives) on the bottom one. Population growth and migration pattern are simulated through the creation of new relatives (between 1 and 6) for each household every time. They are randomly located but a maximum capacity load per land plot limits their positioning. As highlighted during the IAS, all households are provided with a well. However, only 6 households on the top island can benefit from a rainwater tank compared to 24 on the bottom one. Only households on the bottom island have access to the distribution pipe. Demand for water is set up to a 60 L/d/person. Water use equipments have different using priorities (drinking, cooking, washing). The water availability is updated at each time step according to the type of equipment (direct rainfall for the rainwater tanks, groundwater for the wells or global discharge for the PUB connections).

4.9
As described in a companion paper (Dray et al. 2005), a board game version reproduces the main features of the AtollGame simulator. 16 players — 8 on each island — are able to interact according to a set of pre-defined rules. Their choices and actions are directly incorporated into the simulator at the end of each round of the game. During the game, players can ask for more information from the simulator or discuss the results provided by the simulator (salinity index, global demand).

Figure12
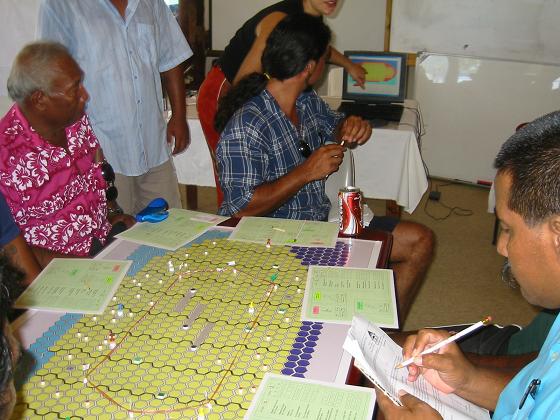
Figure 12. Players interacting with the simulator during a session

4.10
At this stage of the project, the role-playing game has been played with local stakeholders once only. During the game session, players didn't really interact with the computer simulator as they hardly questioned the information provided at the end of each round. Players tended to favour interactions with the game boards and amongst themselves. One way forward would be to convert the current model into a fully-interactive simulator without supporting game boards, entailing players to interact directly with the computer. However, one can question whether an increased interactivity with the simulator, at the expense of direct communication during the role-playing game would benefit the whole process. In Tarawa's context, spatiality - represented physically on the game boards - plays a major role in understanding the complexity of socio-environmental interactions.

* Conclusion

5.1
This paper presents our attempt to convert individual and fragmented narratives into a simplified and shared representation of the system via a semi-automatic process. Once field interviews have been collected and formatted into verbatim transcripts, the process actually involves 5 stages requiring 3 different softwares: open coding followed by associative networks building with Qualrus©; extraction of the Smallest Common Denominator Codes and creation of a common ontology with Protégé© and finally conversion of the ontology into a UML class diagram with Visual Paradigm©. The next stage consists in the creation and implementation of a computer-assisted role playing game which actual outcomes are to be found in a companion paper (Dray et al. 2005).

5.2
The authors wanted to stress the paramount importance of the — often overlooked — early stages of participatory modelling approaches. Collecting, understanding, and finally processing local knowledge is anything but trivial (Becu et al. 2003). The implementation of increasingly popular computer simulations, associated with various media of communication, tend to overshadow the creative process itself. Existing reviews on ABM-simulators insist mainly on what type of dynamics are described or on what type of uses are targeted (Bousquet et al. 2002; Hare and Deadman 2004), seldom on how the initial information was selected and processed. As a matter of fact, one can hardly find any well documented paper on the topic, with significant exceptions like D'Aquino et al. (2003).
5.3
Retrospectively, the first two stages processed with Qualrus©, which aimed at eliciting collective representations from the different Group Voice's interviews, provided useful insights in revealing significant overlap and correspondences as well as divergences and singularities. The major source of contrasts or conflicts came - not surprisingly - from the opposition between government experts and local residents. This result is consistent with the theory of Collective Action Frames which, according to Benford and Snow (2000): "intend to mobilize potential adherents and constituents, to garner bystander support, and to demobilize antagonists". The division over the pollution concept clearly delineates and justifies the local residents' behaviour on one side and the Government's coercive actions on the other side. At the same time, variations between associative networks elicited from narratives and flowchart created during the card games illustrate how much pervasive these collective frames can be. The same antagonism arose from the IAS interviews where a majority of people claiming that their island was polluted were themselves acknowledging polluting behaviours later on.

5.4
Our attempt to separate mental constructs (GTA) from behavioural patterns (IAS) helped us to overcome some issues raised by Becu et al. (2003) when trying to build models from local knowledge only. But the fact that we ended up with a consistent simulator that was accepted by all parties relied on our low-key objective to create a consensual model based on our Smallest Common Denominator Codes (SCDC) using Protégé©. The result is a meta-frame that shares enough ground with the different existing representations of the system. This is - beyond doubt — our own interpretation of local sources of knowledge. As nicely stated by Clancey (1989): "knowledge can be represented, but it is never actually at hand. Each statement by the observer captures what he needs to say at any point in time, and each such statement is later interpretable in different ways".

5.5
Despite inherent limitations of Qualitative Analysis software, we agree with Brent and Slusarz (2003) that they provide powerful means for "feeling the beat" of encoded narratives through relatively simple logical inferences. But there is still a significant role for human insight and interpretation, especially during the clean-up of redundant codes and the normalisation of link-descriptors. As pointed out by Barr and Feigenbaum (1981): "In semantic network representations, there is no formal semantics, no agreed-upon notion of what a given representational structure means, as there is in logic, for instance." The weakest link in this semi-automated process happens at the Protégé© stage and corresponds to the merging of the different associative networks in order to design the skeleton of the common ontology. Although we initially decided to discard any conflicting semantic link, the decisive steps rely on a "do it yourself" approach. It is expected that on-going work developed around the Semantic Web will help very soon to overcome this limitation.

5.6
The ability of the interviewees to explicit their mental constructs, to manipulate spatial entities on the map, to break down complex systems into simple elements and to accept to play games by the rule, confirmed the potential of a Role-Playing Game during the next phase of the participatory process. Besides, by designing the game from a simplified and shared ontology, we allowed conflicting representations to eventually emerge from the implementation of the computer assisted role-playing game. This post-normal standpoint, developed — among others - by Bousquet et al. (2002), give us the opportunity to overcome what is known as "cognitive dissonance". According to the theory, the inconsistency and psychological discomfort of cognitive dissonance can be reduced by changing one's beliefs, values, or behavior (Bradshaw and Borchers 2000). We argue that companion modelling approaches have the potential to reduce collective dissonance if the interacting medium is strongly embedded into local beliefs and if we can develop further methodologies that can avoid initial individual discomfort for all players.

* Acknowledgements

The authors wish to thank the Agence Francaise de Developpement (AFD, France) and the Australian Centre for International Agricultural Research (ACIAR, Australia) for their financial support to this study.

* References

BARR A. and FEIGENBAUM E.A. (1981). The Handbook of Artificial Intelligence, vol. I. Los Altos, CA: William Kaufmann.

BECU N., BOUSQUET F., BARRETEAU O., PEREZ P. and WALKER A. (2003) "A methodology for eliciting and modelling stakeholders' representations with Agent Based Modelling". Lecture Notes in Artificial Intelligence, 2927, 131-149.

BENFORD R.D., SNOW D.A. (2000) Framing Processes and Social Movements: An Overview and Assessment. Ann.Rev. of Socio., 26, ABI/INFORM Global, pp611-639.

BOUSQUET F., BAKAM I., PROTON H. and LE PAGE C. (1998) « CORMAS : Common-Pool Resources and Multi-Agent Systems". Lecture Notes in Artificial Intelligence 1416: 826-837.

BOUSQUET F., BARRETEAU O., AQUINO (d') P., ETIENNE M., BOISSAU S., AUBERT S., Le PAGE C., BABIN D. and CASTELLA J.-C. (2002) "Multi-agent systems and role games : collective learning processes for ecosystem management". In: M. A. Janssen (ed.) Complexity and Ecosystem Management: The Theory and Practice of Multi-agent Systems. Edward Elgar Publishers. pp. 248-285.

BRADSHAW G.A., BORCHERS J.G. (2000) "Uncertainty as Information: Narrowing the Science-policy Gap. Conservation Ecology 4(1): 7. http://www.ecologyandsociety.org/vol4/iss1/art7/

BRENT E. and SLUSARZ P. (2003). "Feeling the Beat": Intelligent coding advice from metaknowledge in qualitative research. Social Science Computer Review 21 (3), pp. 281-303.

CLANCEY W. (1989). The knowledge level reinterpreted: modelling how systems interact. Machine Learning, 4, 285-291. Netherlands.

D'AQUINO P., LE PAGE C., BOUSQUET F., BAH A. (2003) "Using self-designed Role-Playing Games and Multi-Agent Systems to empower local decision-making process for land use management: The SelfCormas experiment in Senegal. Journal of Artificial Societies and Social Simulation vol. 6, no.3. https://www.jasss.org/6/3/5.html

DESCOLA P. (1996) "Constructing natures: symbolic ecology and social practice". In Descola, P. and Palsson, G. (eds.) Nature and Society: anthropological perspectives. Routledge, London. pp. 82-102.

DRAY A., PEREZ P., LE PAGE C., D'AQUINO P., WHITE I. (2005). Who wants to terminate the Game ? The role of vested interests and meta-players in the AtollGame experience. Simulation and Gaming (accepted).

FALKLAND A.C. (1992) "Review of Tarawa freshwater lenses, Republic of Kiribati". Hydrology and Water Resources Branch, ACT Electricity and Water, Rep 92/682, Canberra, Australia, (unpublished report).

FALKLAND A.C. and BRUNEL J.P. (1993) "Review of hydrology and water resources of the humid tropical islands". In: M. Bonell, Hufschmidt and J. Gladwell (eds.) Hydrology and Water Management in the Humid Tropics. Cambridge Univ. Press-IAHS, Cambridge, England, pp 135-163.

GRUBER T. R. (1993). A translation approach to portable ontology specification. Knowledge acquisition 5(2), p. 199-220.

HARE M., DEADMAN P. (2004) "Further towards a taxonomy of agent-based simulation models in environmental management". Mathematics and Computers in Simulation, 64, pp 25-40.

NEWELL A. (1982) "The Knowledge Level". Artificial Intelligence, 18:87-127.

NOY N.F. and McGUINESS D. (2001). "Ontology Development 101: a Guide to Creating Your First Ontology". Stanford Knowledge Systems Laboratory Technical Report KSL-01-05.

PEREZ P., DRAY A., WHITE I., LE PAGE C. and FALKLAND T. (2003) "AtollScape: Simulating Freshwater Management in Pacific atolls, Spatial processes and time dependence issues". In: Post D. (Ed) Proc. of the International Congress on Modelling and Simulation (Townsville, Australia, 14-17 July 2003). MODSIM 2003, vol 4, 514-518.

REYNOLDS T.J. and GUTMAN J. (1984) "Laddering: Extending the Repertory Grid Methodology to Construct Attribute-Consequence-Value Hierarchies" in Personal Values and Consumer Psychology, Pitts, R.E. and Woodside, A.G. (Eds) Lexington Books, Lexington.

QUILLIAN M. R. (1968). Semantic memory. Semantic Information Processing. M. Minsky. Cambridge, Massachusetts, MIT Press: 216-270.

SHADBOLT N. and MILTON, N. (1999) From Knowledge Engineering to Knowledge Management. British Journal of Management, vol. 10, No 4.

SMITH L. (1993). Necessary Knowledge: Piagetian Perspectives on Constructivism (Essays in Developmental Psychology). Lawrence Elrbaum Associates Ltd, Publishers, Hove, UK, 155 p.

STRAUSS A. and CORBIN J. (1990). Basics of Qualitative Research: Grounded Theory Procedures and Techniques. Newbury Park, CA: Sage.

VOLKER R.E., MARIÑO M.A., and ROLSTON D.E. (1985) Transition zone width in groundwater on ocean atolls. J. Hydrol. Engng., 111, 659-676.

WHITE I., FALKLAND T., PEREZ P., DRAY A., JONES P., METUTERA T. and METAI E. (2002) "An Integrated Approach to Groundwater Management and Conflict Reduction in Low Coral Islands". In: Proc. of the International Symposium on low-lying coastal areas. Hydrology and Integrated Coastal Zone Management (9-12 Sept 2002, Bremerhaven, Germany). UNESCO HIP, pp 249-256.

WHITE I., FALKLAND A., CRENNAN L., JONES P., ETUATI B., METAI E., and METUTERA T. (1999) "Issues, Traditions and Conflicts in Groundwater Use and Management". UNESCO-International Hydrological Programme, Humid Tropics Programme. IHP-V Theme 6. Technical Documents in Hydrology No. 25. UNESCO, Paris.

----

ButtonReturn to Contents of this issue

© Copyright Journal of Artificial Societies and Social Simulation, [2005]