©Copyright JASSS

JASSS logo ----

Hugo Fort and Nicolás Pérez (2005)

The Fate of Spatial Dilemmas with Different Fuzzy Measures of Success

Journal of Artificial Societies and Social Simulation vol. 8, no. 3
<https://www.jasss.org/8/3/1.html>

For information about citing this article, click here

Received: 26-Jul-2004    Accepted: 16-Mar-2005    Published: 30-Jun-2005


* Abstract

Cooperation among self-interested individuals pervades nature and seems essential to explain several landmarks in the evolution of live organisms, from prebiotic chemistry through to the origins of human societies. The iterated Prisoner's Dilemma (IPD) has been widely used in different contexts, ranging from social sciences to biology, to elucidate the evolution of cooperation. In this work we approach the problem from a different angle. We consider a system of adaptive agents, in a two dimensional grid, playing the IPD governed by Pavlovian strategies. We investigate the effect of different possible measures of success (MSs) used by the players to assess their performance in the game. These MSs involve quantities such as: the utilities of a player in each round U, his cumulative score (or 'capital' or 'wealth') W, his neighbourhood 'welfare' and combinations of them. The agents play sequentially with one of their neighbours and the two players update their 'behaviour' (C or D) using fuzzy logic which seems more appropriate to evaluate an imprecise concept like 'success' than binary logic. The steady states are characterised by different degrees of cooperation,'economic geographies' (population structure and maps of capital) and 'efficiencies' which depend dramatically on the MS. In particular, some MSs produce patterns of 'segregation' and 'exploitation'.

Keywords:
Complex Adaptive Agents, Cooperation, Artificial Societies, Spatial Game Theory

* Introduction

1.1
Cooperation among individuals is necessary in order to allow organisational structures that offer important advantages to them. The problem is that in general, by definition, individuals are self-interested. However, there are many examples in nature of cooperative behaviour. Animals collaborate in families to raise their offspring or in foraging groups to prey or to defend against predators. Cooperation is also essential to raise more advanced societies, in building social capital and social arrangements which contribute to the economic growth, in achieving shared goals and making efficient use of the sharer resource. Furthermore, cooperation seems to be a crucial ingredient to explain several landmarks in the evolution of live organisms, from prebiotic chemistry through to the origins of human societies (Maynard-Smith and Szathmary 1995).

1.2
A particular useful conceptual playground is the iterated Prisoner's Dilemma (IPD) game, introduced by Flood and Dresher (Flood 1952) to model the social behaviour of "selfish" individuals (individuals which pursue exclusively their own self-benefit). The PD involves 2 players, each confronted with a choice, to cooperate (C) or to defect (D). A 2 × 2 matrix specifies the 4 possible payoffs for each player: A player who plays C gets the "reward" [R] or the "sucker's payoff" [S] depending on whether his opponent plays C or D respectively, while if he plays D he gets the "temptation to defect" [T] or the "punishment" [P] depending on whether his opponent plays C or D respectively. These four payoffs obey the relations:

T > R > P > S (1a)
2R > S + T (1b)

1.3
The dilemma is that in any one round, independently of what the other player does, D yields a higher payoff than C (T > R and P > S). However, by playing D in a sequence of encounters (IPD), both players do worse than if both had cooperated (P < R). That is, there are several strategies that outperform a strategy of defection in the IPD and lead to some non-null degree of cooperation.

1.4
The problem of how cooperation emerges and becomes stable is often approached from a Darwinian evolutionary perspective: the most successful strategies are the ones that propagate and survive at the expense of the less successful. In 1973, Maynard-Smith and Price introduced the concept of an evolutionary stable strategy (ESS) (Maynard-Smith and Price 1973; Maynard-Smith 1982): a strategy which if adopted by all members of a population cannot be invaded by a mutant strategy through the operation of natural selection. Since then a growing number of social scientists have become interested in evolutionary game theory in the hope that it will provide tools for addressing a number of deficiencies in the traditional theory of games. Unlike traditional game theory models, which assume that all players are fully rational and have complete knowledge of the details of the game, evolutionary models assume that people choose their strategies through a trial-and-error learning process in which they gradually discover that some strategies work better than others. In games that are repeated many times, low-payoff strategies tend to be weeded out, and an equilibrium may emerge. Indeed, despite its biological stance, evolutionary stability seems to provide a sound criterion for human behaviours in a wide range of situations, including many interactions in the realm of economics (see Weibull 1995 and references therein). The problem of the interplay between evolutionary game theory and the equilibrium selection problem in noncooperative games is examined in great detail by Samuelson (1997). Many economic applications of evolutionary game theory are reviewed, for instance, by Friedman (1998). The issue of the evolutionary stability in repeated games was addressed by Binmore and Samuelson (1991).

1.5
Different mechanisms have been proposed to explain the evolution of cooperation. One of the most popular is based on direct reciprocity which requires either memory of previous interactions (Axelrod 1984), or "tags" (Epstein 1998), permitting cooperators and defectors to distinguish one another. In other words, cooperation becomes an equilibrium because no one will gain from defecting because of the retaliation and losses they would suffer. This is the philosophy behind the strategy known as tit-for-tat (TFT): cooperate on the first move, and then cooperate or defect exactly as your opponent did on the preceding move.

1.6
An alternative viewpoint for the evolution of cooperation was proposed by Nowak and May (1992). They neglected all strategic complexities or memories of past encounters and showed that, territoriality by itself in a classic Darwinian setting (under some circumstances) is sufficient for the evolution of cooperation.

1.7
In this work we approach the problem of cooperation from a different angle: we consider a system of adaptive agents playing the IPD, in a two dimensional spatial setting[1], governed all by a "win-stay, lose-shift" strategy that is an extension of the strategy known as Pavlov (Kraines and Kraines 1988) or Simpleton (Rapoport 1965). The simplest criterion to decide if you are winning or losing is to take into account your utilities in the last round of the game. However, there are many other possibilities and here we focus on analysing different alternative measures of success MSs (distinct criteria to judge whether a player did well or badly in the iterated game). Each MS defines a different pavlovian strategy i.e. a different extension of the original Pavlov strategy. We do not worry about the resistance of the strategy to invasion by other strategies (like unconditional D), but rather choose Pavlov at it seem to be a widespread strategy in nature (Domjan and Burkhard 1986) and even experiments with humans have shown that a great fraction of individuals indeed use pavlovian strategies (Wedekind and Milinski 1996). Furthermore, Pavlov has shown that it does pretty well when competing against several other strategies including TFT and some of its variants like generous tit-for-tat (GTFT) (Nowak and Sigmund 1993). Therefore, at this stage, instead of analysing the cooperation from an evolutionary perspective we focus on the richness of different steady states[2] produced by distinct plausible MS universally adopted by all players. We explored several different MSs, some of them producing very interesting results (that sometimes are quite counter-intuitive). Here, we choose a small set that illustrate different points that might shed light on structural features of societies:

1.8
One of the main criticisms of agent-model approaches is that these binary and completely deterministic agents are an over-simplification of real individuals, whose levels of cooperation exhibit a continuous range of values. In that sense, completely deterministic algorithms would fail to incorporate the stochasticity of human or animal behaviour. We take into account the stochastic component in the adaptive behaviour of the players through the use of fuzzy logic (Zadeh 1965, 1975) which provides a conceptual framework to include uncertainty.

1.9
The membership in a fuzzy set is specified by real numbers in the interval [0,1]. The value 0 means that the element is definitely out of the set while the value 1 represents complete membership. Mathematically, this corresponds to defining a mapping or membership function μ (x) from the universe of discourse for a fuzzy subset S (the collection of all possible values that the variable x may take) to the interval [0,1]. In this way, fuzzy logic provides a meaningful representation of imprecise or vague concepts like "success" in an exact mathematical manner. In our work, the fuzziness enters through the MS used by the players to assess their degree of success in the game through a membership function μsuccess. Each player updates his behaviour (C or D) as follows: he maintains it with probability equal to μsuccess. It is worth remarking that the introduction of measures of success of the kind we are considering could have been implemented using just probabilities instead of adopting a full fuzzy set framework. However, we prefer the fuzzy treatment basically for two reasons. Firstly: it is more general (for instance it does not require additivity of the fuzzy values, that is that they must add together to one) and indeed all probability distributions are fuzzy sets. Secondly is of semantic character: the distinction between fuzzy logic and probability theory has to do with the difference between the notions of probability and a degree of membership. Probability statements are about the likelihoods of outcomes: an event either occurs or does not. However, with fuzziness, one cannot say unequivocally whether an event occurred or not, and instead you are trying to model the extent to which an event occurred.

1.10
This approach, besides its obvious contact with economics and social sciences, might be applicable to Biology. For instance, the agents can represent different species co-existing in an ecosystem. Thus, although we will employ the economic parlance and refer to "utilities" and "wealth" or "capital" as synonyms of the score the players get in each game and their cumulative score respectively, one has to bear in mind that the agents do not necessarily represent the "homo economicus". For example, the "capital" or "wealth" might be interpreted in a biological context as the "fitness". A similar approach, without spatial structure (pairs of players were chosen at random) and considering only the simplest MS (taking into account individual utilities in the last game), was proposed recently (Fort 2003a, 2003b).

* The Model and The Measures of Success

2.1
The model we consider is very simple. Each agent is associated with a square cell in a two dimensional grid or lattice with periodic boundary conditions[3]. The state of the system at time t is described by two variables attached to each square cell with centre coordinates (x,y): c(x,y;t) representing the "behaviour" of the corresponding agent, that takes values 1 or 0 (for C or D respectively), and his cumulative "capital" or "wealth" W(x,y;t) (the sum of utilities received through the rounds he played the PD game up to time t).

2.2
The grid is swept starting at t=0 by the agent located at cell (x = 1, y = 1), in the next time step we move to the neighbouring cell at the right (x=2, y=1); when the right end is reached (x=L, y=1) we start at the next row. The agent at (x,y) plays the PD only with one of his nearest neighbours chosen at random. We considered two different neighbourhoods: a) the von Neumann neighbourhood (z = 4 neighbour cells, the cell above and below, right and left from a given cell) and b) the Moore neighbourhood (z = 8 neighbour cells, von Neumann neighbourhood a situated on diagonals).

2.3
The payoffs can be arranged in a payoff matrix:

Payoff matrix

i.e. R =1, S = -2, T = 2 and P = -1. Since the four payoffs sum to zero, if all players would update their behavioural variable at random they would get, on average, a null score. The state of players are updated cell by cell so we have an asynchronous cellular automata (ACA)[4]. The initial state at t=0 is taken as C and D chosen at random for each cell i.e. the fraction of cooperators c is equal to 0.5 (we checked that the equilibrium states are independent from the initial configurations. The number of agents in our simulations varied from N=2500 (a 50 × 50 grid) to N = 1,000,000 (a 1000 × 1000 grid). The typical number of lattice sweeps is Ns=400 (i.e. from 1,000,000 to 400,000,000 time steps). The results we present here do not change appreciably with the size of the grid.

2.4
We explored several different MSs and in all the cases the strategy was win-stay, lose-shift (win or lose according to the MS).

2.5
In this work we present a selection of those MSs with more illustrative and interesting results, organised as follows. First, we discuss in detail a simple straightforward application of the Pavlovian criterion, and 4 different MSs. Second, we just present the interesting results produced by a more sophisticated two-level-of-decision strategy that combines two MSs, one for each level. Let us begin by describing the four different MSs used we will analyse:
  1. Individual utilities IU (ordinary Pavlov). Each player takes into account just his individual utilities in the last round. The universe of discourse is given by the set of the four payoffs {R,T,P,S}. We choose the corresponding membership function as

    μIU(T) = 1
    μIU(R) = 2/3
    μIU(P) = 1/3
    μIU(S) = 0.

  2. Individual capital IC. Each player compares his capital W(x,y;t) with an average capital <w>. Two possibilities are considered:
    1. ICL: <w> ≅ WavN i.e. the average is performed over the cell at (x,y) and his neighbours N(x,y) (the subscript L is for "local").
    2. ICG: <w> ≅ Wav i.e. <w> coincides with the global mean capital - averaged over all cells (the subscript G is for "global").
  3. Neighbourhood welfare NW: compares WavN with the global average capital Wav.

2.6
For the last three MSs, if Wmax and Wmin are the maximum and minimum capital among the N agents[5], the membership function is thus chosen as:

μ(X) = 1 if (Wmax + <w>)/2 < X
μ(X) = 2/3 if <w> < X d (Wmax + <w>)/2
μ(X) = 1/3 if (Wmin + <w>)/2 < X ≤ <w>
μ(X) = 0 if X ≤ (Wmin + <w>)/2

where X ≡ W(x,y) (X ≡ WN ) for measures of success ICL and ICG (for measure of success NW) and <w> ≡ WavN (<w> ≡ Wav) for measure of success ICL (ICG and NW).

2.7
Our choice of membership functions is quite arbitrary. In the most simple case of ordinary PAVLOV, the universe of discourse is discrete and comprises the four payoffs. We chose a "balanced aspiration level. (Posch Pischler and Sigmund 1999) in which a player assumes he is doing well (badly) i.e. μ > 1/2 (< 1/2) corresponds to the 2 higher (lower) payoffs. The more symmetric way to do that is to divide the unit in four equal parts. Other possible choices would be the "modest aspiration level" (the player assumes he is doing well if the utilities are greater than the sucker's payoff) or the "ambitious aspiration level" (he assumes he is doing well only if he gets the temptation T ). For the other MS, the universe of success is a quasi-continuous of values. For simplicity we maintain the requirement that the membership function divides the unit in four equal parts. The ends of the universe of discourse are the minimum and maximum wealth and the average wealth can be taken as a middle point.

* Results

3.1
It turns out that different MSs lead to self-organisation in distinct equilibrium states characterised by different fractions of C-agents cooperation ceq, different spatial distributions of c(x,y) and W(x,y) and different "economic efficiencies".

3.2
In Figure 1 we plot the fraction of C-agents at time step t, c(t) vs. t for the 4 MSs. Once equilibrium has been reached, the transitions from D to C, on average, must equal those from C to D. Thus, ceq is obtained by equalising the flux from C to D (JCD) to the flux from D to C, (JDC). The flux JXY is defined as the average amount of agents that "flip" from state X to state Y. In the case of measure IU this leads to a simple algebraic equation from which ceq can be computed exactly. The players who play C either get R (in [C,C] encounters) or S (in [C,D] encounters). In the first case they change from C to D with probability1/3 and in the second with probability 1. [C,C] encounters occur with probability c2 and [C,D] encounters with probability c(1-c).Consequently, JCD can be written as:

JCD = 1/3 c2 + c(1-c). (2)

3.3
In an analogous way, those who play D and get P (in [D,D] encounters) change from D to C with probability 2/3. Therefore, JDC can be written as:

JDC = 2/3 (1-c)2. (3)

3.4
At equilibrium JCD(ceq) = JDC (ceq), and equalising (2) and (3) we get a simple equation for ceq:

4ceq2+ -7ceq+2 = 0. (MS IU ) (4)

3.5
The positive root in the interval [0,1] of equation (4) is ceq= (7-√17)/8 ≅ 0.36, which agrees quite well with the asymptotic value observed in Figure 1. For the remaining MS, based on comparisons of cumulative capital instead of utilities, the calculation of ceq is much less straightforward.

Figure 4
Figure 1. The fraction of C agents for different measure of success MSs. Thin lines, from below to above: ICL, IU, ICG and NW. Thick upper line corresponds to the discriminating or two-level strategy. The lowest ceq corresponds to ICL.

3.6
From ceq we can estimate the corresponding average equilibrium per-capita-utilities Ueq as:

Ueq E U(ceq) = (R-S-T+P) ceq2 +(S+T-2P) ceq +P = 2 ceq -1. (5)

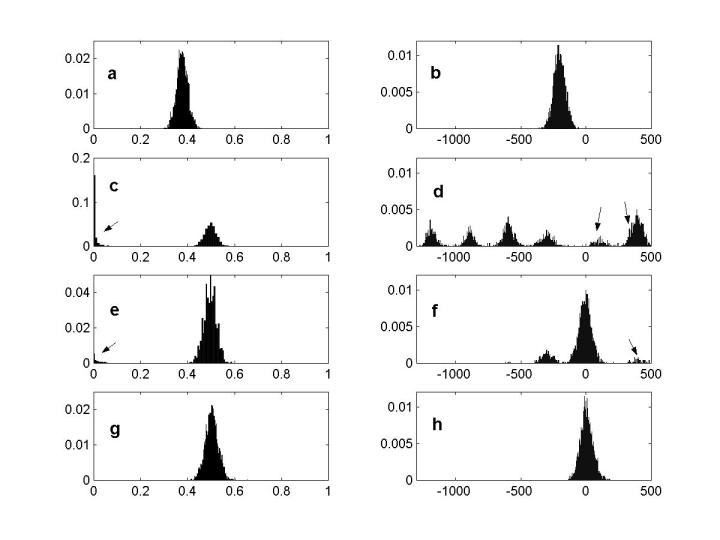
Hence, Ueq is greater (smaller) than zero if ceq is greater (smaller) than 1/2. We found that for MS IU and ICL we get respectively Ueq ≅ -0.28 and Ueq ≅ -0.4 in complete agreement with equation (4). On the other hand, for measures ICG and NW, Ueq ≅ 0 in consonance with the fact that ceq ≅ 0.5 for both. Let us denote by ¢ the normalised temporal average of the number of times a player played C. In Figure 2 histograms of ¢and W are depicted for the von Neumann neighbourhood. For measures ICL and ICG both are multi-peaked. The ¢ histograms exhibit two peaks: One centred around c=0.5 and the other at c=0 (indicated by an arrow), which is large for ICL (Figure 2c) and very small in the case of ICG (Figure 2e ), which corresponds to D-agents. The peaks of the respective W histograms can be explained in terms of different local spatial patterns for c. For instance, the right peak at W=400 (large in Figure 2d and small indicated by an arrow in Figure 2f) corresponds to a D player surrounded by four players with c=0.5. This configuration gives to the central player average utilities U=(T+P)/2=1/2 per game. On average each agent plays two times per lattice sweep (one for sure plus another one with each of his z neighbours with probability 1/z). Therefore the average capital accumulated during Ns lattice sweeps is given by U × 2 × Ns = Ns = 400, in accordance with Figure 2. In an analogous way all the peaks can be explained[6].

Figure 2
Figure 2. Histograms for temporal average ¢ (right column) and average capital (left column). (a) & (b) IU , (c) & (d) ICL, (e) & (f) ICG and (g) & (h) NW. The ¢ and W histograms for measures ICL and ICG are multi-peaked. The cooperation histograms exhibit two peaks, one of them at ¢=0 -large (very small) for ICL (ICG) (see arrows in Figure 2c and 2e)-, corresponding to D-agents, and the other centred around ¢=0.5. The peaks of the respective capital histograms can be explained in terms of different local spatial patterns for c (see text).

3.7
Two remarkable observations are:
  1. The striking differences in the fraction of cooperators and capital distributions between the two IC measures. The "innocent" change of replacing the local average capital for the global one as a reference point to compare the individual wealth has dramatic consequences. Comparison with a global average - which comprises more information - produces a more fair (with roughly half of the population above the W=0 "poverty line") and more efficient society (a higher Wav ).
  2. Notwithstanding the similarity in the efficiency (average utilities) between measures ICG and NW, the distributions of capital are very different. Something similar occurs for the couple of measures of success IU and ICL.

3.8
The fraction of cooperators and the population structure provide interesting global information. We are interested also in the asymptotic spatio-temporal patterns and the corresponding emerging "economic geographies". Thus, we propose the following rough classification of agents into "economic classes" in terms of the standard deviation σWW of the capital W: "rich" ("poor") agents are those whose capital is greater (smaller) than WavW (Wav - σW) and all the rest constitute the "medium class". Figure 3 illustrate the asymptotic W "maps" for z = 4 neighbouring cells and for the four considered MSs. We observe that clear spatial patterns appear for IC measures that produce non Gaussian (multi-peaked) histograms whilst measures IU and NW produce no clear spatial structure. The measure ICL produces "chess board" patches of rich and poor agents (red and yellow) separated by medium class agents (blue). On the other hand the measure ICG gives rise to "flowers", with a rich agent (red) in the centre surrounded by 4 poor agents (yellow), in a sea of medium class (blue). These red centres correspond to the small peak at c = 0 in Figure 2-f. Although both chess board patches and flowers reflect "exploitation", the medium class for measure ICG is much bigger. This is in complete agreement with 1) the respective capital histograms and 2) the higher fraction of cooperators ceq reached by measure ICG.

3.9
For the case of z = 8 we also found clear spatial patterns for IC measures and random maps for IU and NW. The IC measures, for z=4 or z=8, exhibit complex localised long lived spatial patterns while IU and NW don't. It seems thus that the first MS is reminiscent to the so-called "class IV" cellular automata (CA) while the other two to "class III" (Wolfram 1984). Table 1 summarises most of the above results.

Figure 3
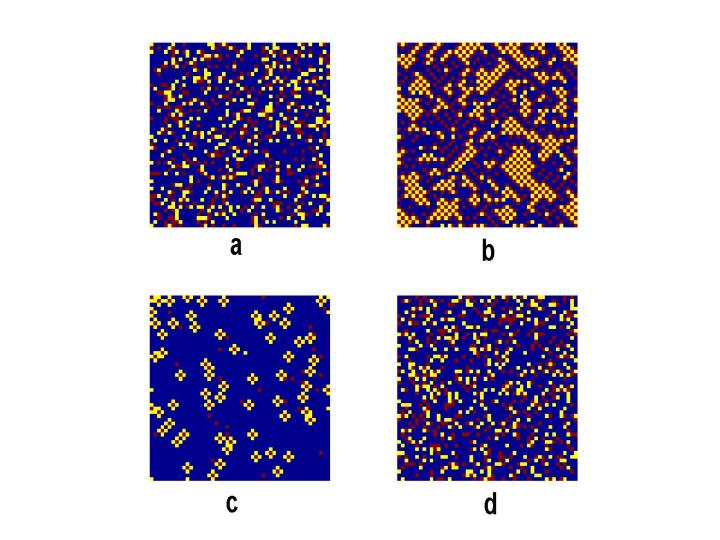
Figure 3. Asymptotic capital maps for different MSs (50 × 50 subsets of 500 × 500 lattices): (a) IU, (b) ICL, (c) ICG and (d) NW. IC measures, produce spatial patterns that are in consonance with their multi-modal histograms, whilst measures IU and NW produce random spatial structure.


Table 1: Summary of equilibrium properties for the 4 elementary measures of success (von Neumann's neighbourhood)

MSceqUeqW HistogramC HistogramW fluctuationsW Spatial patterns
IU≅0.36≅-0.28Gaussian likeGaussian like ξ = 0.5Random
ICL≅0.3≅-0.46 peaks histogram2 peaks histogram ξ ≅ 2"Chess board" patches
ICG0.5-0-3 peaks histogram2 peaks histogram ξ ≅ 1"Flowers"
NW0.5+0+Gaussian likeGaussian like ξ = 0.5Random

Notes:
1) The ceq (and thus Ueq ) for the Moore's neighbourhood are the same except for ICL , for that MS ceq ≅ 0.36.
2) ξ is the correlation length in lattice units obtained from the 2-point capital correlation function G2W(r) ≅ W(s)W(s + r) - W(s)W(s + r). The brackets "<>" denote sum over all lattice sites s.

3.10
Let us now briefly present a more sophisticated two level or discriminating strategy which combines different MSs. The first step or level of decision for this strategy consists in assessing preliminarily the performance according to the measure ICL. In a second level of decision if the player did badly, he updates his state using simply Pavlov (IU measure). Otherwise he uses a more softly update: he takes account of the combined utilities of him and his partner. Therefore, the corresponding universe of discourse of this new (fifth) "combined utilities" measure of success CU are the 3 values { 2R, 0, 2P } and the membership function is

μCU(2R)=1
μCU(0)=1/2
μCU(2P)=0.

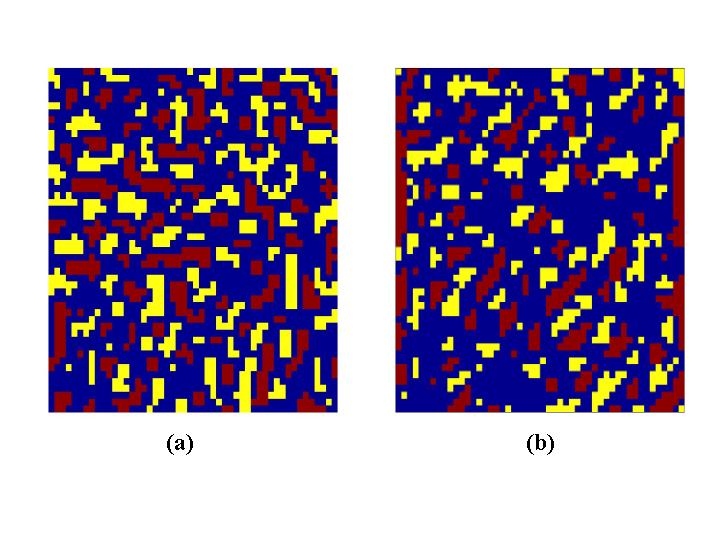
This strategy gives rise to a more cooperative (and more efficient) society with a ceq higher than all the straightforward applications of the 4 elementary MSs (see Figure 1). It turns out that the interesting "segregation" patterns depicted in Figure 4 emerge: "islands" of rich C-agents (red) and of poor D-agents (yellow) in a sea of medium class (blue).

Figure 4
Figure 4. Asymptotic capital map for the two level strategy (50 × 50 subset of 500 × 500 lattices). (a): von Neumann's neighbourhood; (b): Moore's neighbourhood. A segregation pattern with "islands" of rich C-agents (red) and "islands" of poor D-agents (yellow) in a sea of medium class (blue) is clear.

* Conclusions

4.1
In summary, we found that the combination of spatial structure and different measure of success produce a great diversity of statistical and spatial patterns. We checked that the results are robust against changes of the payoffs as long as the inequalities (1) are respected. On the other hand, the results depend quantitatively on the choice of the membership function. In order to become independent from this arbitrary choice one could average over many possible choices. Nevertheless, the results for different membership functions are qualitatively similar.

4.2
Results of particularly interesting are produced by measures of success that take into account the cumulative capital. The explanation we find for this is that the capital collected by agents implicitly involves an evaluation of the "historical" degree of cooperation of their neighbourhood. When this information is used by players to tune their responses, more lasting patterns emerge.

4.3
On the other hand, we observe no flashy statistical structure (simple gaussian distributions) or spatial patterns (random and non lasting) for measures involving just utilities in the last game or the neighbourhood welfare.

4.4
The more sophisticated two-level strategy tend to lump together the C-agents and, separated from them, D-agents. Perhaps this might be connected with a main issue in the social sciences like the formation of social capital, understood in Putnam's sense of the networks and norms of trust and reciprocity that promote civic cooperation (Putnam 1993, Helliwell and Putnam 1995). In particular, it has been argued that trust and social capital are dominant determinants of firm size across countries.

4.5
We envisage several extensions of this model and some work is in progress. For instance, the game can be played beyond nearest neighbours and take into account strategies that play nicer with closer neighbours and in a less nice manner with more distant players. The inclusion of heterogeneity in strategies and/or MSs it is worth exploring. In particular, in order to include evolution the changing of frequency of various genotypes is required and the successful ones must resist invasion from mutants being evolutionary stable. We are also investigating other games like the "Hawk-Dove" (Maynard-Smith 1982), and "Stag Hunt" (Skyrms 2004) which may be more appropriate to describe certain biological settings or social contexts.

4.6
Many features of our "experimental setup" can be modified in order to extend its applicability and made it more realistic. For example, in some cases the dyadic relationship fails to capture reality as it may happen with much of human cooperation which occurs in n-person groups. The choice of a regular lattice as spatial structure doesn't seem very realistic. Rather the underlying architecture of various complex systems in everyday life (from social networks to the World Wide Web) and in nature (cell's metabolic system, epidemics, ecological networks, etc) is better described by either "Scale Free" (Barábasi 2002) or "Small Worlds" (Watts 1999). Hence, a future issue to address is to combine different MSs with networks having more realistic topologies. Additionally, depending on the particular context, more sophisticated agents can be considered, with memory of previous encounters and/or applying a discount factor to past wealth earnings (the impact on the individual behaviour of an amount of wealth recently acquired should be greater than the same amount earned in a distant past).

4.7
However, at this stage, we opted for simplicity and neglected all the above subtleties. Our aim was to explore the combined effect of territoriality and different criteria to assess success in the interaction between agents modelled as a simple spatial game.


* Notes

1We are interested in spatially extended games because natural environments clearly possess a spatial dimension which is crucial to understand their properties and dynamics.

2In what follows we will call these steady states by the usual terminology of "equilibrium" states, however one should bear in mind that indeed are dynamical equilibriums (i.e on average the fraction of C's agents is fixed but, there are C agents that transform into D and vice versa).

3We checked that for sufficiently large lattices the results are independent of the boundary conditions.

4We also considered the synchronous dynamics in which all the agents update their states simultaneously at the end of each lattice sweep (that correspond to ordinary CA) to check the robustness of results.

5Indeed, the determination of the global minimum and maximum of W is not a trivial matter for players and the informational assumptions involved in using Wmax and Wmin are rather implausible. However, we checked that changing Wmax and Wmin whith rough estimates doesn't change results qualitatively.

6This identification of peaks of the histogram of capital with local patterns of c works also for z=2 and z=8 neighbours.


* Acknowledgements

It is a pleasure to thank Lord Robert May for useful advice and encouraging comments.

* References

AXELROD, R. (1984), The evolution of cooperation, Basic Books, New York.

BARÁBASI, A. L. (2002) Linked: The New Science of Networks, Cambridge: Perseus.

BINMORE, Ken and Samuelson, L. (1991), Evolutionary Stability in Repeated Games Played By Finite Automata, Journal of Economic Theory 57, 278-305 (1991).

DOMJAN, M. and Burkhard, B. (1986) "Chapter 5: Instrumental conditioning: Foundations", The principles of learning and behavior, (2nd Edition). Monterey, CA: Brooks/ Cole Publishing Company 1986.

EPSTEIN, J. (1998), Zones of Cooperation in Demographic Prisoner's Dilemma, Complexity Vol. 4, Number 2, November-December 1998.

FLOOD, M. (1952), Some Experimental Games, Research Memorandum, RM-789-(1952).

FRIEDMAN, D (1998) "On economic applications of evolutionary game theory", Journal of Evolutionary Economics 8, 15-43 (1998).

FORT, H. (2003a), Cooperation with random interactions and without memory or "tags", Journal of Artificial Societies and Social Simulation 6, 2, https://www.jasss.org/6/2/4.html.

FORT, H. (2003b), Cooperation and Self-Regulation in a Model of Agents Playing different Games, Phys. Rev. E 68, 026118.

HELLIWELL, John F. and Putnam Robert D. (1995) "Economic Growth and Social Capital in Italy", Eastern Economic Journal 21(3), 295-308.

KRAINES, D. and Kraines, V. (1988) "Pavlov and the Prisoner's Dilemma" Theory Decision 26, 47-79.

MAYNARD-SMITH, J. and Price, G. (1973), The Logic of Animal Conflict, Nature (London) 146, 15.

MAYNARD-SMITH, J. (1982), Evolution and the Theory of Games, Cambridge University Press.

MAYNARD-SMITH, J. and Szathmary, E. (1995), The Major Transitions in Evolution, Oxford University Press.

NOWAK, M. and May, R. 1992 Nature 359, 826-828.

NOWAK, M. and Sigmund, K. (1993), "Win-stay, lose-shift outperforms tit-for-tat." Nature 364, 56-58.

POSCH M. , Pischler A. and Sigmund K. (1999), "The efficiency of adapting aspiration levels", Proc. R. Soc. Lond. B 266, 1427-1435.

PUTNAM R. D. (1993), Making democracy work. Civic traditions in modern Italy. Princeton: Princeton University Press.

RAPOPORT A. and Chammah A. M., (1965) Prisoner's Dilemma: A Study in Conflict and Cooperation. The University of Michigan Press.

SAMUELSON, L. (1997). Evolutionary Games and Equilibrium Selection. Cambridge, Massachusetts: MIT Press.

SKYRMS, B. (2004), The Stag Hunt and the Evolution of Social Structure, Cambridge University Press.

WATTS, D. (1999) Small Worlds: The Dynamics of Networks between Order and Randomness, Princeton University Press.

WEDEKIND, C. And Milinski, M. (1996) "Human cooperation in the simultaneous and the alternating Prisoner's Dilemma: Pavlov versus Generous Tit-for-Tat." Proc. Natl. Acad. Sci. 93, 2686-2689.

WEIBULL, J. W. (1995) Evolutionary Game Theory, The MIT Press, Cambridge, Massachusetts.

WOLFRAM, S. (1984), "Universality and complexity in cellular automata" Physica D 10, 1-35.

ZADEH, L. (1965), "Fuzzy Sets," Information and Control 8, 338.

ZADEH, L. (1975), "The Calculus of Fuzzy Restrictions", in Fuzzy Sets and Applications to Cognitive and Decision Making Processes, edited by L. A. Zadeh et. al., Academic Press, New York, pages 1-39.

----

ButtonReturn to Contents of this issue

© Copyright Journal of Artificial Societies and Social Simulation, [2005]