
Michael Agar (2005)
Agents in Living Color: Towards Emic Agent-Based Models
Journal of Artificial Societies and Social Simulation
vol. 8, no. 1
<https://www.jasss.org/8/1/4.html>
To cite articles published in the Journal of Artificial Societies and Social Simulation, reference the above information and include paragraph numbers if necessary
Received: 14-Jul-2004 Accepted: 19-Sep-2004 Published: 31-Jan-2005
 Abstract
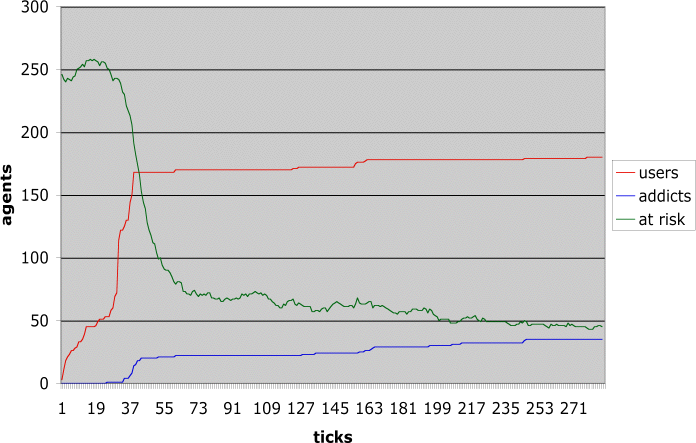 |
| Example A |
|
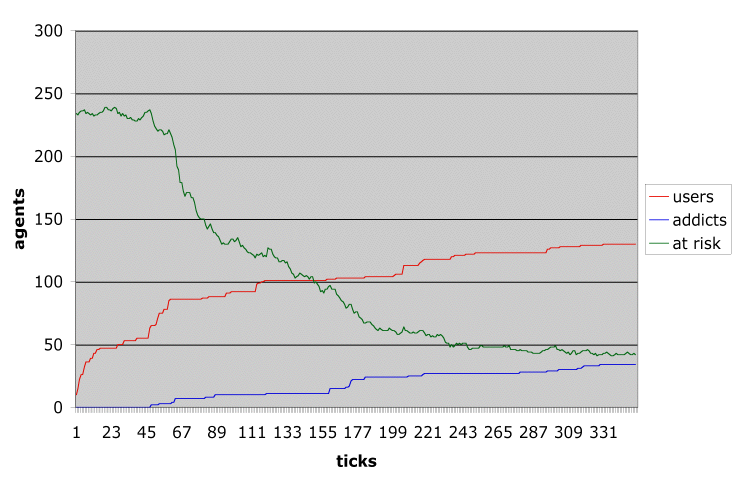
| Example B |
|
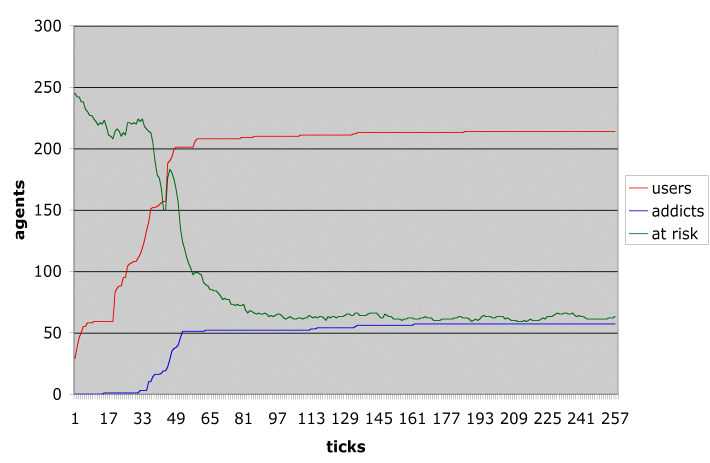
| Example Y |
|
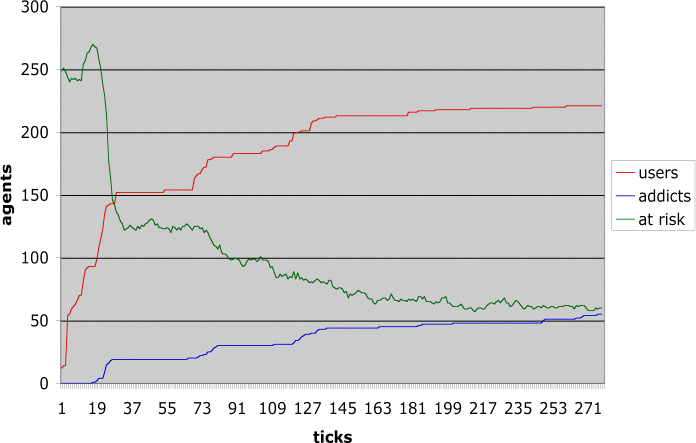
| Example Z |
AGAR, Michael H. and Heather Schacht Reisinger. 2000. "Explaining Drug Use Trends: Suburban Heroin Use in Baltimore County." Pp. 143-165 in Illicit Drugs: Patterns of Use -- Patterns of Response, edited by A. Springer and A. Uhl. Innsbruck: STUDIENVerlag.
AGAR, Michael H. and Heather Schacht Reisinger. 2001. "Open Marginality: Heroin Epidemics in Different Groups." Journal of Drug Issues 31:729-746.
AGAR, Michael H. and Heather Schacht Reisinger. 2004. "Ecstasy: Commodity or Disease?" Journal of Psychoactive Drugs 36:253-264.
AGAR, Michael and Dwight Wilson. 2002. Drugmart: Heroin Epidemics as Complex Adaptive Systems. Complexity 7(5):44-52.
AGAR, Michael H., Stephen Guerin, Robert Holmes, and Dan Kunkel. 2005. "Epidemiology or Marketing? The Paradigm-Busting Use of Complexity and Ethnography." In Proceedings of the Agent 2004 Conference, Oct. 7-9, 2004, University of Chicago, forthcoming.
BARABASI, Albert-Laszlo. 2002. Linked: The New Science of Networks. Cambridge MA: Perseus Books.
BEHRENS, Doris A., Jonathan P. Caulkins, Gernot Tragler, and Gustav Feichtinger. 2000. "Optimal Control of Drug Epidemics: Prevent and Treat--But Not at the Same Time?" Management Science 46:333-347.
DUPONT, Robert L. 1974. "The Rise and Fall of Heroin Addiction." Natural History 83:66-71.
EPSTEIN, Joshua M. 1997. Nonlinear Dynamics, Mathematical Biology, and Social Science. Boston: Addison-Wesley.
HEADLAND, Thomas N., Kenneth L. Pike, and Marvin Harris. 1990. Emics and Etics: The Insider/Outsider Debate. Newbury Park: Sage.
MUSTO, David F. 1999. The American Disease: Origins of Narcotic Control. New York: Oxford University Press.
PIKE, Kenneth L. 1967. Language in Relation to a Unified Theory of Human Behavior. The Hague: Mouton.
REISINGER, Heather Schacht. 2004. "Young and Thuggin: The Unresolved Life of a Crack Dealer." Anthropology, American University, Washington DC.
ROBINS, Lee N. and George E. Murphy. 1967. "Drug Use in a Normal Population of Young Negro Men." American Journal of Public Health 57:1580-1596.
ROGERS, Everett M. 1995. Diffusion of innovations. New York: The Free Press.
TVERSKY, Amos, Daniel Kahneman, and Paul Slovic. 1982. Judgment Under Uncertainty: Heuristics and Biases. Cambridge: Cambridge University Press.
WILENSKY, Uri. 1999. "NetLogo." Evanston IL: Center for Connected Learning and Computer Based Modeling, Northwestern University, http://ccl.northwestern.edu/netlogo/.
 Return to Contents of this issue
© Copyright Journal of Artificial Societies and Social Simulation, [2005]