© Copyright JASSS

  JASSS logo ----

Zhigang Wang and Warren Thorngate (2003)

Sentiment and social mitosis: Implications of Heider's Balance Theory

Journal of Artificial Societies and Social Simulation vol. 6, no. 3
<https://www.jasss.org/6/3/2.html>

To cite articles published in the Journal of Artificial Societies and Social Simulation, please reference the above information and include paragraph numbers if necessary

Received: 25-Mar-2003      Accepted: 30-May-2003      Published: 30-Jun-2003


* Abstract

Two Monte Carlo simulations were developed to investigate the social consequences of balancing sentiment relations among triads of members of a larger group, when balancing one triad can imbalance others. Using assumptions of Balance Theory (Heider 1958), random starting combinations of liking, disliking and no relations among 9, 16 or 25 people were iteratively adjusted to determine if the relations ever settled to a steady state and what subgroups might emerge. Results show that, regardless of the starting configuration of sentiments, all imbalances in a group are eventually balanced in a steady state containing no more than two subgroups. Two subgroups are the rule; their relative size depends on the starting number of positive, negative and null relations. Members within each subgroup are linked by positive relations (liking), and show only negative relations (disliking) towards members of the other subgroup, a form of social mitosis. A second simulation demonstrates that a starting configuration containing only positive and negative relations (no null relations) will completely determine who will eventually belong to which of the two groups. As null relations become more plentiful in the starting configuration, the order or historical trajectory of restoring balance among triads also contributes to subgroup membership.

Keywords:
Balance Theory; Sentiment And Social Mitosis; Sentimental Relations; Triad

* Introduction

1.1
Though relations between two people are usually multifarious, almost all have a common component called sentiment.More often than not, the sentiment tends to be symmetrical: two people like each other or dislike each other more often than one person likes the second while the second dislikes the first. Casual observation suggests that mismatched sentiments will eventually lead one to change; if A likes B but B dislikes A, then in time A will either come to dislike B or B will come to like A. The regularity of this pattern is nicely captured by Fritz Heider's Balance Theory (1946; 1958) and its extensions (e.g., Cartwright and Harary 1956; Newcomb 1968, 1981; Osgood and Tannenbaum 1955).

1.2
In simplified form, Heider's Balance Theory (1958, Chapter 7) states that sentimental relations between two people tend toward a homeostatic state of symmetry or balance in which the sentiments are the same, either both positive (+) or both negative (-). Sentiments among three people also tend toward balance, mostly easily indicated whenever multiplying the three algebraic signs of the three symmetrical constituent relations results in a positive. Thus, if A and B like each other (sentiment relation = +), if B and C like each other (sentiment relation = +), and if A and C like each other (sentiment relation = +), then their sentiments are balanced: + * + * + = +. They are also balanced if any two of the three like each other and mutually dislike the third, for example, if A and B like each other (+) and both dislike C (- & -): + * - * - = +. This balanced configuration is captured in the old adage, "My enemy's enemy is my friend."

1.3
Heider (1958) proposes that when only two of the three symmetrical relations have been established, the third or null relation is likely to develop in the direction that balances the other two through a process he calls induction (205-206). If A and B like each other, and if B and C like each other, A and C are likely to like each other when introduced, "Any friend of yours is a friend of mine!" If A and B like each other, and if B and C dislike each other, then A is likely to dislike C when introduced, "My friend's enemy is my enemy."

1.4
Imbalance among three people occurs when the multiplied algebraic signs of sentiment yield a negative (see Heider, 1958, especially 207-209). This can happen when any two signs are positive and the third is negative, for example, when A and B like each other (+), when A and C like each other (+) and when B and C dislike each other (-): + * + * - = -. It can also occur when all three signs are negative, when A and B and C mutually dislike each other: - * - * - = -. According to Heider, such states of imbalance create stress, "Tension will arise and forces will appear to annul the tension." (207). The forces will act to change or flip at least one sentiment relation in a direction that makes the sentiments of the triad balanced. Changing any one of the three sentiments will suffice, either one negative to a positive or one positive to a negative. Empirical research generally supports the prediction that imbalanced relations create tension, which motivates people to reduce the tension in some way (e.g., see Auster 1980; Carroll 1977; Crano and Cooper 1973; Moore 1978; Rosenberg and Abelson 1960)

1.5
Predicting the consequences of restoring balance in relations of more than three people is more complex, partly because restoration of balance in one triad can produce imbalance in another triad. Consider, for example, four people. A and B like each other; so do A and C, B and D. However, B and C do not like each other, nor do C and D, nor do A and D. The BCD triad is balanced, so is the ACD triad. The ABC triad is imbalanced, as is the ABD triad. Changing the AC relation to negative will balance ABC but cause imbalance in ACD. Changing the BC relation to positive will also balance ABC but will cause imbalance in BCD, which if restored to balance by changing the CD relation to positive, will in turn cause imbalance in the ACD triad. Working through similar possibilities with 5, 6 or more people leads to the speculation that balance might be restored in some triads with no consequences for other triads, but that restoring balance fin other triads might cause a chain reaction that could affect most, perhaps all, of the relations among people. Such consequences are the stuff of many interpersonal conflicts and a basis of shifting political alliances in medium to large groups (e.g., see Rae and Taylor 1970).

1.6
Can we predict anything about the consequences of restoring balance beyond the triad? Given a starting or current configuration of positive and negative sentiments among several people, can we say what network of sentiments might emerge? Will imbalances within a large group of people lead the people to form many small cliques, with positive relations among members of each clique and negative relations between members of any two cliques? Will everyone eventually like each other, or will almost everyone like each other because they dislike one or two others? Will two large, warring factions emerge? Or will the imbalances never lead to a stable configuration? All of these seem plausible and worthy of investigation.

1.7
A mathematical investigation seems daunting. Cartwright and Harary (1956) attempted to generalize Heider's notions beyond three people, but their mathematical treatment focuses more on developing measures of imbalance than predicting where the restoration of balance might end. Harary, Norman, and Cartwright (1965: 342) suggest that restoration of balance in large networks will produce two subnetworks with positive relations inside each and negative relations between them. But no mathematical proof is given, and nothing is said about the size of these two groups or what, if anything, might effect their size.

1.8
Lacking a clear mathematical statement of the trajectory of restoring balance in large, imbalanced groups, many researchers have resorted to Monte Carlo or agent-based simulation. In doing so, most researchers assess the degree of balance in larger groups with random clusters. For example, some researchers use indices developed by Harary, Norman, and Cartwright (1965) to count [what are termed] positive semicycles to measure balance and [what are termed] negation-minimal sets of arcs to measure imbalance in signed graphs. Hummon and Doreian (2003) used another approach created by Doreian and Mrvar (1996) to measure imbalance by counting inconsistencies such as negative relations within clusters and positive relations between clusters in signed graphs. In contrast, our strategy, inspired by the agent-based models of Axelrod (1997), Carley (1991), Mark (1998), Nowak and Vallacher (1998; see also Macy & Willer, 2002, for a review) was simple. Create a random matrix of sentiment relations among a group of people, then repeatedly apply Heider's balance principles to alter these relations and observe the result. Record how often the changes in relations lead to a stable solution, and record the number and size of subgroups that form whenever the Heiderian dust had settled. Repeat with new random matrices a few hundred times. Vary the number of people in the group, and the proportion of positive, negative and null relations among them, to determine how these variables affect the chances of a stable solution and the distribution of the number and size of subgroups that form.

Study 1

* Methods

2.1
Research design. Monte Carlo simulations were run for hypothetical groups of 9, 16, and 25 people. The numbers 9, 16, and 25, were chosen somewhat arbitrarily. We wanted at least one group to have an odd number of members, at least one to have an even number, and we wanted the number of relationships among group members to be divisible by 3 and 4 to make comparable proportions of positive, negative and null relations (e.g., 33% and 25%). Thirty-six symmetrical dyadic relations (9!/7!*2!) can be formed among 9 people; 120 such relations (16!/14!2!) can be formed among 16 people; 300 such relations (25!/23!*2!) can be formed for 25 people. These numbers are all divisible by 3 and 4. The number of positive, negative and null relations allocated to the start of each simulation run were systematically varied. Half of the runs began with no null relations; all 36 relations in the 9-person group (120 in the 16-person group, 300 in the 25-person group) were either positive or negative. The remaining half of the runs began with 33% null relations: 12 of the 36 for the 9-person group; 40 of the 120 for the 16-person group; 100 of the 300 for the 25-person group. The number of positive and negative relations were then systematically varied within these allocations. Table 1 shows the variations defining the runs.

Table 1: Settings of the variables for each run of the simulation.

RunGroup sizePositive relationsNegative relationsNull relations
196300
2910260
3914220
4918180
5922140
6926100
793060
8932112
9961812
10991512
119121212
12915912
13918612
14921312
1516151050
161630900
171645750
181660600
191675450
201690300
2116105150
2216107040
2316206040
2416305040
2516404040
2616503040
2716602040
2816701040
2925302700
3025702300
31251101900
32251501500
33251901100
3425230700
3525270300
362525175100
372550150100
382575125100
3925100100100
402512575100
412515050100
422517525100

2.2
The Simulation. The simulation programme was written in Euler, version 1.68, a Matlab-like programming language developed by Grothmann (2002) and freely available on the Internet. A listing of the programme is given in Appendix A. Five functions defined the programme. The function fill took as input the number of people in a group (nrc), and the number of positive (npo) and negative (nmi) relations defining the run of the simulation. It then created a nrc × nrc square matrix for representing the sentiment relations, calculated the number of null relations (total - npo - nmi), and randomly distributed the corresponding +1s, -1s and 0s in the cells above the main diagonal. An example of the output of the fill function is shown in Figure 1.

Figure 1: . A starting nine-person matrix with 15 positive sentiment relations (+1), 11 negative sentiment relations (-1) and 10 null relations (0) randomly configured.

+10-10+1+1-10
-1-1+10+1+1-1
00+1-1+1+1
000-1+1
-1+1+1-1
-1+10
+1-1
+1

2.3
The function balance randomly sampled, with replacement, thousands of triads generated by the fill function and balanced each if necessary. The number of samples was set to insure that all possible combinations of triads would be included. By trial and error, we established that 5,000 samples were sufficient for 9-person groups, 8,000 for 16-person groups, and 100,000 for 25-person groups. Following the rules of Heider, if the relations of a sampled triad were imbalanced (++-, +-+, -++ or ---), then the balance function would change the sign of one of the three relations at random to balance the triad. If a triad had one null relation, balance would change the null to a +1 or -1 to create a balanced triad. If a triad were balanced, or if it had two or three null relations, balance would leave the triad untouched.

2.4
The function nbal counted the number of all triads that were balanced, imbalanced or incomplete (contained at least one null relation). The nbal function was used only to determine how many iterations were needed inside the balance function before changes in relations ceased. It was not a part of the regular simulation.

2.5
The function subgroups employed a cheap programming trick to determine which persons in a 9-person or a 16-person group or a 25-person group liked and disliked the same people. Two people were considered to be part of the same subgroup if (1) they liked each other, and (2) they liked and disliked the same remaining people. The output of the balance function became the input of the subgroups function. The output of the subgroups function was a list of who was in each of the subgroups found. From this list, the number of groups and their size could be calculated.

2.6
One run of the simulation consisted of 300 iterations of the fill, balance and subgroups cycle, each iteration starting with the same number of people (9 or 16 or 25) and the same number of positive, negative and null relations. The function doit started a simulation run with three inputs: (1) the size of the group; (2) the number of positive relations; (3) the number of negative relations. The number of null relations was calculated from these three inputs. When doit was called, it called the functions fill, balance and subgroups 300 times, and kept a record of the size of the largest subgroup to emerge each time. The distributions of these sizes, and the average size of the largest group, constituted the primary results of our study.

* Results

3.1
For all 12,600 iterations of the 42, 300-iteration simulation runs, the initial matrix of random positive, negative and null relations settled to a steady state in which all triadic relations were balanced. Furthermore, all 12,600 iterations produced no more than two subgroups. When only one group emerged (all people in the initial group), all relations were positive -- a simulated "love in". When two subgroups emerged, each subgroup contained only positive relations among its members, and each subgroup contained only negative relations with all members of the other subgroup. A typical result of the 12,600 iterations is shown in Figure 2. The initial configuration in Figure 2 comes from the relations listed in Figure 1. The final configuration indicates that two subgroups have emerged: one subgroup of three people (1, 3 and 6) and one subgroup of six people (3, 4, 5, 7, 8 and 9). Only liking exists with each subgroup, and only disliking exists between the two subgroups - the social psychological equivalent of mitosis.

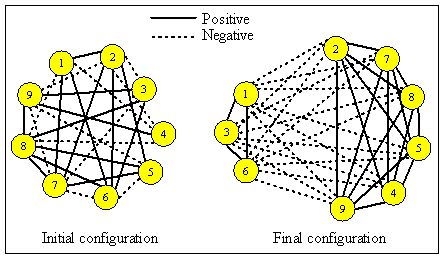
Figure 2. Transformation of random positive, negative and null relations among nine people into two subgroups

3.2
The size of the subgroups emerging from each iteration of the simulation was quite variable, and seemed to depend in part on the initial number of positive and negative relations. The results are summarized in Table 2 for 9-person groups, Table 3 for 16-person groups, and Table 4 for 25-person groups. Consider the results of the first 14 runs of the simulation, initialized with various combinations of positive, negative and null relations among nine people, and summarized in Table 2. The Table indicates, for example, that of the 300 iterations of Run 4 (each beginning with a random sprinkle of 18 positive, 18 negative and 0 null relations), subgroups of 5 people and 4 people emerged from just over half of them (160), and subgroups of 6 and 3 people emerged from just under one-third (96) of them; six iterations developed one subgroup of 8 people all disliking the 9th person, and one iteration produced a single, all-positive, 9-person group.

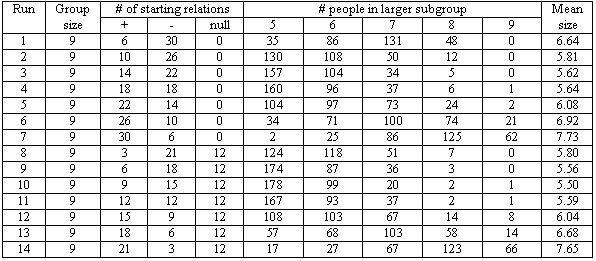
Table 2. Number of the 300 iterations in a run when the largest subgroup of a 9-person group contained 5, 6, ..., 9 people.

3.3
Tables 2, 3, and 4 indicate that as the ratio of positive to negative relations increased beyond 1.0, so also did the ratio of the larger to smaller subgroups. The general trend can be seen by examining the increase in mean size of the larger group emerging from Runs 4-7 and 11-14 (Table 2), from Runs 18-21 and 25-28 (Table 3), from 32-35 and 39-42 (Table 4). For example, when the starting ratio of positive to negative relations in a run of the16-person group was 1 to 1 (Runs 18 and 25), the resulting larger group contained an average of about 9.5 people, the smaller about 16-9.5 = 6.5 people. When the ratio of positive to negative starting relations was 3 to 1 (Runs 20 and 27), the resulting larger group contained an average of about 12 people and the smaller about 16-12 = 4 people. In general, as positive relations come to dominate negative relations, the size of the emerging majority group increases.

3.4
When the ratio of positive to negative starting relations declined below 1 to 1, that is, when there were more negative than positive starting relations, the relation between positives and group size becomes more complex. It appears as though a group dominated by negative relations evolves to two subgroups of more equal size than the groups equally dominated by positive relations. For example, Table 3 shows that when the ratio of positive to negative relations is 3:1 (Run 20), the larger group that evolves has, on average, 12.3 members. When the ratio of positive to negative relations is 1:3 (Run 16), the larger group that evolves has only 11.3 members. This difference in subgroup size is consistent for all 12 relevant comparisons: Runs 1 versus 7, 2 versus 6, 3 versus 5, 8 versus 14, 9 versus 13, ..., 23 versus 25. We are not aware of any theoretical or practical significance of this finding, and speculate that it might be a mathematical artifact.

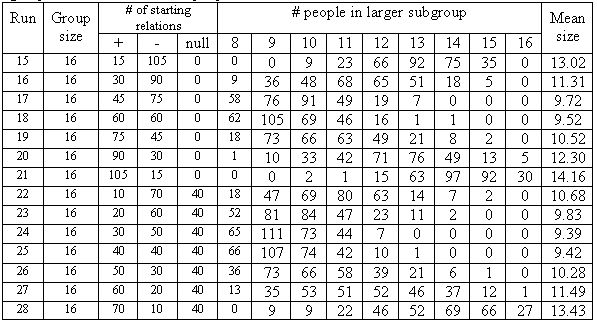
Table 3. Number of the 300 iterations in a run when the largest subgroup of a 16-person group contained 8, 9, ..., 16 people.

3.5
The results also indicate that null relations had small but consistent effect on the distributions of group sizes that emerged. The effect is most easily seen in Table 3 and 4 where starting proportions of positive and negative relations remain equal for runs with no null relations (Runs 15-21 or Runs 29-35) versus runs with 33% null relations (Runs 22-28 or Runs 36-42). The relevant comparisons are between Runs 15 versus 22, 16 versus 23, 17 versus 24, ..., 34 versus 41; 35 versus 42. In each case, the average size of the larger subgroup evolving from Heiderian dynamics was greater when group began with no null relations when it began with 33% null relations. For example, as the iterations of Run 20, starting with 90 positive, 30 negative and no null relations, evolved into two subgroups, the larger subgroup had an average of 12.30 members. As the iterations of Run 27, starting with 60 positive, 20 negative and 40 null relations, evolved into two subgroups, the larger subgroup had an average of 11.49 members. Though the difference is consistent, it may not be interesting or important.

3.6
Likely more important is evidence that the proportions of positive and negative relations replacing the null relations in a Run are roughly equal to the proportions of starting positive and negative relations. For example, if a Run began with 60 positive, 20 negative and 40 null relations, then the 40 null relations would eventually be replaced by about 30 positive and 10 negative relations, retaining the beginning 3:1, positive-to-negative, ratio. This is reflected in the relative sizes of the two evolving subgroups, which remain about the same even when 1/3 of the starting relations are null. The result suggests that persons originally unaligned with one or another group will eventually align themselves in roughly the same proportions as the originally aligned groups.

3.7
Perhaps most importantly, the results also suggest how difficult it is for two groups with no love for one another not to emerge when governed by Heiderian dynamics. As seen in Tables 2, 3, and 4, even a smattering of negative relations can divide a group into two warring factions. For example, even when only 12.5% of the non-null relations were negative (Run 14), only 66 of the 300 iterations of the Run (22%) evolved to a single, all-embracing group. On 41% of the 300 iterations, eight of the nine people in the group emerged united in their liking for each other and their dislike of the ninth person. But on the remaining 37% of those 300 iterations, the tiny proportion of negative relations produced two mutually disliked groups of 4 versus 5 people, 3 versus 6 people or 2 versus 7 people - enough for a nonconformist to have at least one ally, sustain opinions and perhaps transform a personal problem into a political movement.

3.8
Finally, though the evolution of one group into two subgroups provides a nice example of equifinality, variations in the sizes of these two subgroups among the 300 iterations of each run prompts an important question: Why do the sizes of these groups vary even when the proportion of positive, negative and null relations remains the same? There are two possible answers. First, the initial placement of the positive, negative and null relations (who likes, dislikes or doesn't know whom) might influence the membership and size of the evolving subgroups. Second, the order in which imbalanced triads are balanced might influence the membership and size of the evolving subgroups. Of course, both might be influential. Study 2 was designed to determine how much the initial configuration and the order of resolution would influence the distribution of subgroup membership and size.

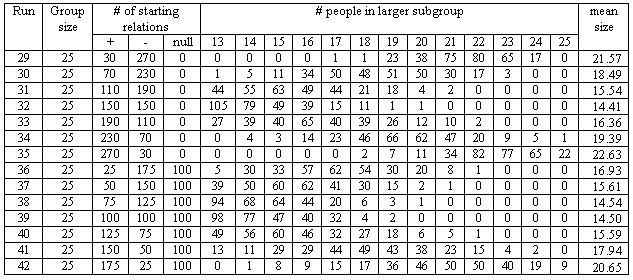
Table 4. Number of the 300 iterations in a run when the largest subgroup of a 26-person group contained 13, 14, ..., 26 people.

Study 2

* Methods

4.1
Recall that each of the 300 iterations comprising a simulation run in Study 1 varied both (1) the starting configuration of the positive, negative and null relations, and (2) the order in which the programme selected triads to balance. As noted above, our task in Study 2 was to separate these two possible sources of variation. In the Same Start condition, each of the 300 iterations of a run began with a constant configuration of a fixed number positive, negative and null relations, and the order in which the programme selected triads to be balanced was randomly varied. For example, in a Same Start 300-iteration run with 9 people, 15 positive relations, 11 negative relations and 10 null relations, the programme might begin each of the 300 iterations with the configuration shown in Figure 1. For iteration 1 it might first select persons 2, 4 and 9 for balancing, then select persons 1, 4 and 5, then 3, 6 and 8, etc. For iteration 2 it might first select persons 3, 4 and 6 for balancing, then select 2, 5 and 6, then 1, 7 and 8, etc.

4.2
In the Same Order condition, each of the 300 iterations of a run began with a different random configuration of the same fixed number of positive, negative and null relations, then selected triads for balancing in a constant, random order. For example, Iteration 1 of a Same Order run with 9 people, 15 positive, 11 negative and 10 null relations might begin with the random configuration shown in Figure 1, then first select persons 1, 3 and 8 for balancing, then persons 2, 3 and 6, then persons 4, 7 and 9, etc. Iteration 2 of the run would select a random permutation of the 15 positive, 11 negative and 10 null relations, almost certainly resulting in a different configuration than the one shown in Figure 1 and, as in Iteration 1, first select persons 1, 3 and 8 for balancing, then persons 2, 3 and 6, then persons 4, 7 and 9, etc.

4.3
Replication of a random sequence was easily accomplished using Euler's "seed" function. Like the seed function in pseudo-random number generators of almost all programming languages, Euler's seed function allows its pseudo-random number generator to produce the same arbitrary sequence of pseudo-random numbers by specifying a starting number, called a seed. For example, a seed of 0.123 always produces the same unordered sequence of numbers looking something like this: 11, 64, 21, 87, 82, 14, 22, 31... A seed of 0.127 always produces another unordered sequence looking something like this: 43, 24, 25, 78, 71, 39, 62, 94... The Euler instruction seed(time()) gets the seed number from the computer system clock, making the seed as arbitrary as the time of day in 1/000ths of a second.

4.4
In order to produce the same starting configuration of positive, negative and null relations in the Same Start runs, we modified the doit function to seed the random number generator with .0123 before calling the fill function. We then repeated these runs with a second seed = 0.457. The two seeds were arbitrary. To produce different sequences of triads for each iteration of a run we seeded the generator with Euler's internal time() function before calling the balance function. The modified doit function for the Same Start condition is shown in Appendix B. In order to produce a different starting configuration of positive, negative and null relations in each of the Same Order runs, we again modified the doit function, this time to seed Euler's random number generator with time() before calling the fill function. To produce the same order of triad samples for each of the Same Order runs, we seeded the random number generator with 0.123 before calling the balance function. We then repeated these runs with a second seed = 0.457. The modified doit function for the Same Order condition is shown in Appendix C.

4.5
The modifications of the doit function noted above produced distributions of group sizes that resulted from keeping the starting configuration constant (Same Start) and from keeping the order of triad balancing constant (Same Order). In addition to observing these distributions, we also wanted to know who was a member of each resulting group. This was easily accomplished by adding a single line of code, "groups" just above the return command in the subgroups function. Adding this commend printed the vector called groups which kept track of which group each of the persons in a run belonged to. Visual inspection of the screen allowed us to determine if the people in each group emerging from the Same Start runs and in the Same Order runs were the same or different people.

* Results

5.1
When we started runs with no null relations, the results were very clear: The number of people in each emerging group was completely determined by the starting configuration of the positive and negative relations. The order in which triads were sampled for balance had no effect at all on the resulting group sizes. Examples are shown in Tables 5a (Same Start condition) and 5b (Same Order condition).

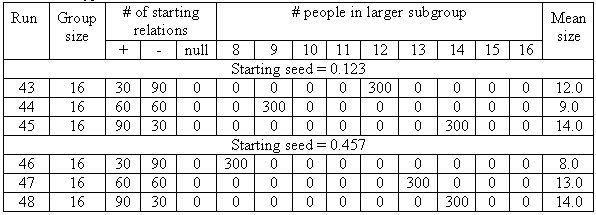
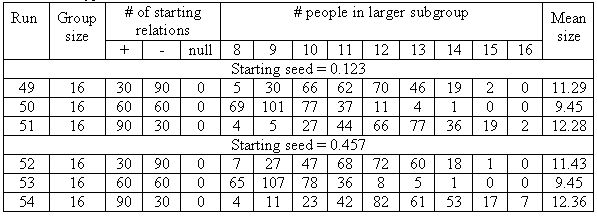
Table 5a. Typical results from Same Start condition, no null relations.

Table 5b. Typical results from the Same Order condition, no null relations.

5.2
Each of the six runs shown in Table 5a shows that its 300 iterations generated the same sized subgroups. For example, all 300 iterations of Run 30 produced two subgroups, the larger containing 12 persons and the smaller containing the remaining 4 persons. Visual inspection of the vector called group printed on the computer screen in each of the 300 iterations of all six runs shown in Table 5a confirmed that the resulting groups always contained the same people. Thus, in a 300-iteration run in which a subgroup of 12 and a subgroup of 4 always emerged, the 12 people would always be the same, and the 4 people would always be the same. These constancies occurred even though the imbalances among the triads in the starting configuration were resolved in 300 different orders.

5.3
In contrast, Table 5b shows that when 300 different starting configurations were generated and imbalanced triads were resolved in the same order, the sizes of the resulting groups varied as much as they did in Study 1. Indeed, comparable runs 16, 18 and 20 (Table 3) are virtually identical with the corresponding runs in Table 5b.

5.4
What can be made of this result? When there are no null relations, the results suggest that some mathematical principle is at work. If people do change their positive and negative sentiment relations as Heider suggests, then the eventual group consequences of resolving imbalances among people who like or dislike each other can be accurately predicted.

5.5
Alas, such accurate predictions are not possible when null relations exist in the starting configuration. Tables 6a and 6b show the distribution of group sizes that emerge when 33% of the starting relations are null. Comparing Table 5a with Table 6a reveals that null relations do allow the number of people emerging in each subgroup to be influenced by the order in which imbalanced triads are balanced. The variation in subgroup size was, however, much less than in Study 1 (compare, for example, the distribution of larger subgroup sizes in Run 25 versus Runs 56 and 59). Visual inspection of the composition of these subgroups as they were printed on the computer screen reveals that some people in the random starting permutations remain in the same group across the 300 iterations of a run, while others flip from one group to the other. For example, a run might show that persons 1, 3, 5 and 14 always appear in the same subgroup; persons 6, 7, 10, 12, 13 and 16 always appear in the other subgroup; but various numbers and combinations of persons 2, 4, 8, 9, 11 and 15 "join" one subgroup or the other from iteration to iteration. The number and identity of the "core members" and the "floating members" of either subgroup appears to depend entirely on the particulars of the starting configuration.

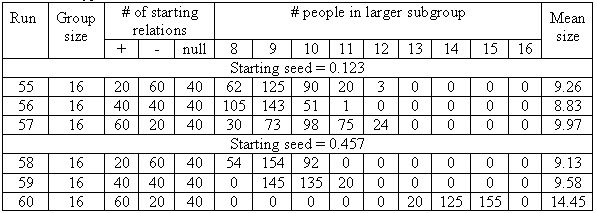
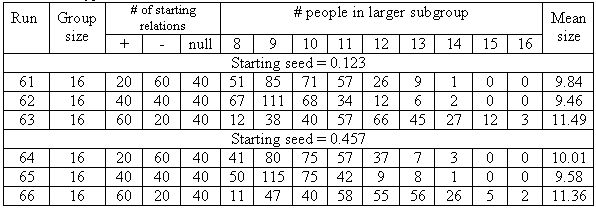
Table 6a. Typical results from Same Start condition, 33% null relations.

5.6
Table 6b shows again that varying a starting configuration that contains 33% null relations has a large effect on the size of the two resulting subgroups, even when the sampling order of triads to be balanced remains the same. Runs 61-66 (Table 6b) generate frequency distributions of subgroup sizes comparable to those of Runs 49-54 (Table 5b), and to Runs 23, 25 and 27 (Table 3). In short, even when there is a substantial proportion of null relations in a starting configuration, the configuration generates a greater variety of balanced outcomes than does the order in which balance is achieved.

Table 6b. Typical results from Same Order condition, 33% null relations.

* Discussion

6.1
Our research attempted to determine the implications of Heider's (1958) Balance Theory for groups larger than three people. Study 1 reported a Monte Carlo simulation generating three important findings. First, almost all starting configurations of positive, negative and null relations result in a state of balance among all group members. There is one obvious exception: when there are so many null relations (for example, 119 of the 120 of the sentiment bonds among 16 people) that positive or negative bonds cannot be induced for most connections. But, at least for starting configurations having fewer than 33% null relations, balance is always achieved.

6.2
Study 1 also demonstrates that no more than two subgroups emerge from balancing all relations in the original group, and that two groups will almost certainly emerge. Occasionally, the balanced resolution of an initial configuration of sentiment bonds will produce only one group: the original group now linked only by positive sentiments. This is most likely to occur when almost all the original sentiment bonds are positive. Somewhat more often, all group members save one will form the larger subgroup, united by their positive sentiments towards each other and by their negative sentiments toward the minority of one. More often still will be divisions of the original group into two subgroups closer to equal in size, each subgroup bonded exclusively by positive sentiments among its members and by negative sentiments towards all members of the other subgroup. This division will occur even when negative relations predominate the starting configuration of sentiments; many people will come together in positive sentiment because they share a common dislike of someone else. The simulation thus confirms earlier statements about the inevitability of bifurcation (see Harary, Norman and Cartwright 1965: 342), and additionally tabulates the distribution of subgroup sizes that form.

6.3
Finally, Study 1 illustrates how frequently and easily those who change their sentiments according to Heider can form two subgroups that dislike each other. Even low proportions of negative relations in a starting configuration of sentiments can lead to this form of social mitosis. A random "light salting" of negative sentiments in a sea of positive sentiments stands a good chance of splitting an otherwise amiable group into two mutually disliked subgroups. The result suggests that such bifurcation is close to inevitable, that virtually all groups sooner or later divide into them versus us. The result thus accounts for the development of ingroups and outgroups and the misperceptions that result (e.g., see Bronfenbrenner 1961; Tajfel 1970). And it raises at least one interesting question: What might happen if negative sentiments begin to appear in one or both of the two groups? Study 1 suggests that the appearance of a small proportion of negative sentiments would split a subgroup as it had split the original group. Future simulations might examine the conditions under which such a secondary split would lead to further bifurcations or to reconfigurations of the original two subgroups with different members. It might also be worthwhile to examine whether specific changes in the number or location of sentiments might lead two subgroups to merge.

6.4
Study 2 showed that when a starting, imbalanced configuration of sentiments has only positive and negative (no null) relations, the final, balanced configuration can be completely predicted and is not sensitive to the order in which triads in the configuration are sampled and balanced. When null relations are included, the balancing order does make a difference in the size and composition of the two subgroups that form. We cautiously speculate that variations in the size and composition of the subgroups increase as the proportion of null relations increases. Future research can easily test this speculation. In the meantime, current results of Study 2 shed some light on an old debate about the predictability of social evolution (e.g., see London and Thorngate 1981). Does the order of events influence the trajectory of group development? The answer, it seems, is no and yes, depending on the proportion of unformed relations in the group.

6.5
Results of the current studies are based on Balance Theory assumptions. To increase the generality of the results, it is important to examine the consequences of relaxing or altering these assumptions. For example, Balance Theory does not address the relative strength of sentiment relations. It seems reasonable to believe that sentiment relations do vary in strength, noted in phrases such as casual acquaintance and close friend. The tendency to alter sentiment bonds is likely to be inversely proportional to their strength, and the implications of this tendency for social mitosis is important to determine (see Rosenberg and Abelson 1960). So too would be implications of the rule that a triad with three negative bonds is imbalanced, or the rule that a null relation in a triad having two established relations (positive or negative) will be changed to balance the other two.

6.6
Balance Theory addresses relations between people and attitude objects (facts, things, ideas, etc.) as well as relations between people themselves. Sentiments toward topics or ideas were not addressed in our studies. It would be worthwhile to explore how group members' differing attitudes toward one or more topics or ideas might affect social mitosis. Each triad in our studies had an equal probability of being sampled, and perhaps altered, in a simulation run. Life rarely provides this form of equal opportunity, because opportunities for triads to interact are affected by geography, economics, communication possibilities, transportation and time. Future simulations will explore how communication structures and frequencies might affect the development of groups, and the direction and extent of social mitosis.

* Appendix A. The Euler simulation programme

..comment
..fill(A,b,c): fills top-right corner of an AxA square matrix with b "+1s", c "-1s" and
............ (A*A-A)/2 - b - c zeros. ..nbal(A): calculates the number of balanced, imbalanced and null triads ..balance(A): runs the Heider balance simulation ..who(A): finds people in groups and counts them ..It is used for the Heider simulation ..w thorngate, 19 December 2002 ..endcomment function fill(nrc,npl,nmi) .. nrc: # of rows/columns, npl: # of + links, nmi: # of - links relations=zeros(nrc,nrc); plus=ones(1,npl); .. create a vector of npl 1s minus=-(ones(1,nmi)); .. create a vector of -1s zero=zeros(1,(nrc*nrc-nrc)/2-npl-nmi); .. create the vector of 0s y=plus | minus | zero;.. catonate the three vectors y=shuffle(y); .. randomize the order of 1s, -1s and 0s w=1; for i=1 to (nrc-1); .. loop to put the elements of y in the upper triangle of relations matrix relations(i,i+1:nrc) = y(w:w+nrc-i-1); w=w+nrc-i; end; return relations .. return the resulting relations triangle endfunction function nbal(relations) .. used only to determine how many iterations needed to reach steady state balanced=0; imbalanced=0; null=0; r=rows(relations); for i=1 to r-2; .. select all combinations of three group members for j=i+1 to r-1; for k=j+1 to r; a=relations(i,j); b=relations(i,k); c=relations(j,k); d=a*b*c; .. multiply the three links if d==1; .. if result is +1, the triad is balanced balanced=balanced+1; endif; if d==-1; .. if result is -1, the triad is imbalanced imbalanced=imbalanced+1; endif; if d==0; .. if result is 0, 1 or 2 links must be zero null=null+1; endif; end; end; end; return {balanced,imbalanced,null}; endfunction function balance(rel) relations=rel; r=1:rows(relations); for trial=1 to 100000; a=shuffle(r); b=sort(a(1:3)); first=relations(b(1),b(2)); second=relations(b(1),b(3)); third=relations(b(2),b(3)); bal=first*second*third; if bal==-1; relations(b(1),b(2))=-(relations(b(1),b(2))); endif; if ((bal==0) && (abs(first)+abs(second)+abs(third)==2)); if first==0; relations(b(1),b(2))=second * third; elseif second==0; relations(b(1),b(3))=first * third; elseif third==0; relations(b(2),b(3))=first * second; else; endif; endif; end; nbal(relations); return relations; endfunction function subgroups(relations) x=relations+relations'; .. add mirror image in bottom right triangle r=cols(x); groups=zeros(1,r); g=0; for i=1 to r-1; if groups(i)==0; .. Has current element been categorized? 0=no g=g+1; .. create next category number groups(i)=g; .. assign new category number to ith element endif; for j=i+1 to r; y=sum(x(i,:)*x(j,:)); .. test to see if i and j have equal relations to all others if y==(r-2) && groups(j)==0; .. if they do, then they are in same group groups(j)=groups(i); endif; end; end; if groups(r)==0; .. tests for condition when last element is different than all others
groups(r)=g+1; endif; g1=sum(groups==1); .. count times result = 1 group g2=sum(groups==2); .. count times result = 2 subgroups g3=sum(groups>=3); .. count times result = 3 or more subgroups return [g1 g2 g3] endfunction function doit(a,b,c) .. run a 300-iteration simulation sums=zeros(300,3); "trial:" for t=1 to 300 t .. shown on screen just to indicate how far simulation has run z=fill(a,b,c); .. fill the matrix with relations for this iteration x=balance(z); .. balance the filled matrix sums(t,:)=subgroups(x); .. record the size of the subgroups end; b=max(sums(:,1),sums(:,2))'; .. find the largest subgroups mean(b) .. show average of largest subgroups on screen result=zeros(2,a); for i=1 to a; result(1,i)= i; result(2,i)= sum(b==i); end; return result endfunction

* Appendix B. Modified doit function to produce same starting configuration of sentiment relations and different order of triad sampling (Same Start condition)

function doit(a,b,c) .. run a 300-iteration simulation
sums=zeros(300,3);
"trial:"
for t=1 to 300
t .. shown on screen just to indicate how far simulation has run
seed(123); .. and seed(457) to produce same pseudorandom sequence
z=fill(a,b,c); .. fill the matrix with relations for this iteration
seed(time()); .. to produce different pseudorandom sequence for each triad sampling
x=balance(z); .. balance the filled matrix
sums(t,:)=subgroups(x); .. record the size of the subgroups
end;
b=max(sums(:,1),sums(:,2))'; .. find the largest subgroups
mean(b) .. show average of largest subgroups on screen
result=zeros(2,a);
for i=1 to a;
 result(1,i)= i;
  result(2,i)= sum(b==i);
end;
return result
endfunction

* Appendix C. Modified doit function to produce different starting configuration of sentiment relations and same order of triad sampling (Same Order condition)


function doit(a,b,c); .. run a 300-iteration simulation
sums=zeros(300,3);
"trial:"
for t=1 to 300
t .. shown on screen just to indicate how far simulation has run
seed(time());  to produce different pseudorandom sequence for sentiment relations
z=fill(a,b,c); .. fill the matrix with relations for this iteration
seed(124); .. and seed(457) to produce same pseudorandom sequence for triad sampling
x=balance(z); .. balance the filled matrix
sums(t,:)=subgroups(x); .. record the size of the subgroups
end;
b=max(sums(:,1),sums(:,2))'; .. find the largest subgroups
mean(b) .. show average of largest subgroups on screen
result=zeros(2,a);
for i=1 to a;
result(1,i)= i;
 result(2,i)= sum(b==i);
end;
return result
endfunction

* References

AUSTER C J (1980) Balance theory and other extra-balance properties: An application to fairy tales. Psychological Reports, 47(1). pp. 183-188.

AXELROD R (1997) The complexity of cooperation: agent-based models of competition and collaboration. Princeton, N.J.: Princeton University Press.

BRONFENBRENNER U (1961) The mirror-image in Soviet-American relations: A social psychologist's report. Journal of Social Issues, 17. pp. 45-56.

CARLEY K (1991) A Theory of Group Stability. American Sociological Review, 56(3). pp. 331-354.

CARROLL, M. P. (1977) A test of Newcomb's modification of balance theory. Journal of Social Psychology, 101(1). pp. 155-156.

CARTWRIGHT D and Harary F (1956) Structural Balance: A Generalization of Heider's Theory. Psychological Review, 63. pp. 277-293.

CRANO W D and Cooper R E (1973) Examination of Newcomb's extension of structural balance theory. Journal of Personality and Social Psychology, 27(3). pp. 344-353.

DOREIAN P and Mrvar A (1996) A Partitioning Approach to Structural Balance. Social Networks, 18(2). pp. 149-168.

GROTHMANN, R. (2002). The Euler programming language. Available at http://mathsrv.ku-eichstaett.de/MGF/homes/grothmann/euler/

HARARY F, Norman R, and Cartwright D (1965) Structural Models: An Introduction to the Theory of Directed Graphs. Wiley, New York.

HEIDER F (1946) Attitudes and cognitive organization. Journal of Psychology, 21. pp. 107-112.

HEIDER F (1958) The psychology of interpersonal relations. New York: John Wiley & Sons.

HUMMON N P and Doreian P (2003) Some dynamics of social balance processes: bring Heider back into balance theory. Social Networks, 25(1). pp. 17-49.

LONDON I and Thorngate W (1981) Divergent Amplification and Social Behavior: Some methodological considerations. Psychological Reports, 48. pp. 203-228.

MACY M W and Willer R (2002) From Factors to Actors. Annual Review of Sociology, 28. pp. 143-166.

MARK N (1998) Beyond Individual Differences: Social Differentiation from First Principles. American Sociological Review, 63(3). pp. 309-330.

MOORE M (1978) An international application of Heider's balance theory. European Journal of Social Psychology, 8(3). pp. 401-405.

NEWCOMB T M (1968) "Interpersonal balance". In Abelson, R. P., Aronson E, McGuire W J, Newcomb T M, Rosenberg M J, and Tannenbaum O H (Eds.). Theories of Cognitive Psychology, Chicago: Rand McNally.

NEWCOMB T M (1981) Heiderian balance as a group phenomenon. Journal of Personality and Social Psychology,40. pp. 862-867.

NOWAK M A and Vallacher R R (1998) Dynamical social psychology. The Guilford Press. New York.

OSGOOD C E and Tannenbaum P H (1955) The principle of congruity in the prediction of attitude change. Psychological Review, 62. pp. 42-55.

RAE D and Taylor M (1970) The analysis of political cleavages.New Haven, CT: Yale University Press.

ROSENBERG M and Abelson R (1960) An analysis of cognitive balancing. In Rosenberg M J (Ed.), Attitude organization and change: An analysis of consistency among attitude components, New Haven, CT: Yale University Press.

TAJFEL H (1970) Experiments in intergroup discrimination. Scientific American, 223(2). pp. 96-102.

----

ButtonReturn to Contents of this issue

© Copyright Journal of Artificial Societies and Social Simulation, [2003]