© Copyright JASSS

  JASSS logo ----

Laurie Brown and Ann Harding (2002)

Social Modelling and Public Policy: Application of Microsimulation Modelling in Australia

Journal of Artificial Societies and Social Simulation vol. 5, no. 4
<https://www.jasss.org/5/4/6.html>

To cite articles published in the Journal of Artificial Societies and Social Simulation, please reference the above information and include paragraph numbers if necessary

Received: 28-Sep-2002      Published: 31-Oct-2002


* Abstract

This paper provides an overview of social modelling and in particular a general introduction to and insight into the potential role and usefulness of micro-simulation in contributing to public policy. Despite having made a major contribution to the development of tax and cash transfer policies, there are many important areas of government policy to which microsimulation has not yet been applied or only slow progress has been made. The paper starts with a brief review of some of the main distinguishing characteristics of social models. This provides a contextual background to the main discussion on recent microsimulation modelling developments at the National Centre for Social and Economic Modelling (NATSEM) in Canberra, Australia, and how these models are being used to inform social and economic policy in Australia. Examples include: NATSEM's static tax and cash transfer model (STINMOD); modelling the Australian Pharmaceutical Benefits Scheme; application of dynamic modelling for assessing future superannuation and retirement incomes; and the development of a regional microsimulation model (SYNAGI). Various technical aspects of the modelling are highlighted in order to illustrate how these types of socio-economic models are constructed and implemented. The key to effective social modelling is to recognise what type of model is required for a given task and to build a model that will meet the purposes for which it is intended. The potential of microsimulation models in the social security, welfare and health fields is very significant. However, it is important to recognise that policy decisions are going to involve value judgements - policies are created and implemented within a political environment. The aim is for social modelling, and in particular policy simulations, to contribute to a more rational analysis and informed debate. In this context, microsimulation models can make a significant contribution to the evaluation and implementation of 'just and fair' public policy.

Keywords:
Australia; Microsimulation; NATSEM; Public Policy; Social Modelling

* Introduction

1.1
A standard definition of public policy has been "a public policy is an action which employs governmental authority to commit resources in support of a preferred value" (Considine 1994, p3). Policy-making includes: the clarification of public values; commitments of money and services; and granting of rights and entitlements (Considine 1994). These actions involve the public exercise of power and constitute one of the central processes through which societies respond to major social, economic, environmental and political issues. Public 'economic' policy questions usually involve the analysis of the cost and (re-) distributional impacts of changes in policy - what are the costs (or savings) to government versus the community? Who are the winners and who are the losers? Social models can be used to examine the nature of policy and the detailed effects of structural changes. These models typically have been applied to government policy in the taxation, social security and welfare fields. A more recent phenomenon has been the emerging demand for social models from the private sector for informed analysis of changes in company policies and structural and fiscal arrangements with respect to client services - for example the likely implications of wealth accumulation and participation in private superannuation schemes.

1.2
In the past two decades, microsimulation models have become very powerful tools in many countries, being used routinely within government to analyse the distributional impact of policy changes to tax and cash transfer programs (such as unemployment benefits or age pensions). Such models have frequently played a decisive role in determining whether or not particular policies are implemented. Yet, despite having made a major contribution to the development of tax/transfer policies, there are many important areas of public policy to which microsimulation has not yet been applied. Only slow progress has been made in moving beyond simulating the immediate impact of tax/transfer policies to include, for example, the use of health, disability or aged care services, the behavioural responses of consumers to policy changes, and the distributional impact of such economic changes as variations in protection or interest rates. Similarly, while the use of models estimating the current immediate distributional impact of tax/transfer policy change has become routine, microsimulation models simulating the future impact of policy changes or the future structure of the population have not yet become as widely used by policy makers. In addition, spatial microsimulation - or the production of synthetic small area estimates - is a relatively recent development, occurring in the late 1990s.

1.3
The aim of this paper is to provide an overview of social modelling - and in particular microsimulation modelling - as it applies to public policy in Australia. It is acknowledged from the outset that the perspective adopted, of necessity, takes an instrumental and narrow view of what is public policy (this instrumental view being reflected in the standard definition given above). The paper examines socio-economic and technical aspects of modelling in which policy is conceptualised more as a theory of choice and a study of costs (and benefits) (March and Olsen 1989). The origins of the policies that are referred to in the paper, the processes and decisions generating the policies, the bigger social questions surrounding these policies, and other types of 'social' policy, for example, are not discussed. These concerns would be included in a broader definition of public policy and would be addressed in the evaluation of public policy reforms.

1.4
The paper addresses two basic questions: 'what is social and microsimulation modelling?' and 'how are microsimulation models being applied in the social security, welfare, and health fields in Australia?' The specific objective is to provide a general introduction to and highlight the potential role and usefulness of microsimulation in analysing government policy (and private sector structures). A key to effective social modelling is to recognise what type of model is required for a given task and to build a model that will meet the purposes for which it is intended. Some of the main distinguishing characteristics of social models therefore are outlined briefly in the following section.

1.5
The paper then describes recent microsimulation modelling developments at the National Centre for Social and Economic Modelling (NATSEM) at the University of Canberra, and how these are being used to inform social and economic policy in Australia. Examples include the potential use of NATSEM's static tax and cash transfer model in assessing changes in the Commonwealth government Disability Support Pension, modelling the Pharmaceutical Benefits Scheme, application of dynamic modelling for estimating future superannuation and retirement incomes, and the development of a geographical-base i.e. regional microsimulation model. Various technical aspects of the modelling are highlighted in order to illustrate how these types of social models are constructed and implemented.

* Social Modelling

2.1
Social modelling can be defined simply as the representation of social phenomena and/or the simulation of social processes. Social models come in all shapes and sizes. While there are endless types of social models, they can be classified according to some key characteristics, as listed in Table 1.

Table 1: Types of Social Models

simplecomplex
small large
qualitativequantitative
staticdynamic
deterministic (rule-based)stochastic (probabilistic)
non-behaviouralbehavioural
non-spatial (national)spatial (regional)

2.2
To illustrate the varying nature of social models, these dualisms are briefly discussed in turn.
  • Models may be regarded as 'simple' or 'complex' or fall along some continuum between these two polls. Classification is somewhat arbitrary but it is clear that there is a wide range in the complexity of the construction, data requirements and applications of social models.
  • Small models typically examine a limited range of (hypothetical) types of households or individuals and often do not attempt to include all the complex details of actual systems (e.g. income tax and transfer payments) under study (Creedy 2001). In contrast, microsimulation models are large social models. These are typically population-based, use large cross-sectional datasets with a comprehensive range of information on households and individuals, and capture in detail the complexity of the systems being modelled. Some 'small' models can be very sophisticated and produce very realistic results. It is important to recognise that just because a model is large and complicated, this does not mean its output is necessarily more realistic or reliable than that produced from a simpler and smaller model.
  • Models are almost invariably assumed to be quantitative (i.e. empirically and numerically data driven) and mathematically or statistically constructed using, for example, either a spreadsheet approach using computer packages such as Excel or Clarisworks, or microsimulation modelling drawing on programmable computer languages such as SAS, C+, Fortran etc. This isn't necessarily the case or the ideal approach to take. Qualitative models are also common in the social sciences. These may also be empirically driven but are based on subjective measurement or normative approaches. Both quantitative and qualitative models can have a large number of parameters (variables), can be highly structured, and consist of stocks, flows (functional links) and feedback loops.
  • Most social (microsimulation) models are static in that there is usually no attempt to model a time sequence of changes (Creedy 2001). These models are commonly referred to as measuring the effects of policy changes on the 'morning after' the change. Static models are relatively 'simple' in structure and assess what each individual would, counterfactually, have under a new system or set of policy rules. Static models are most frequently used to provide estimates of the immediate distributional impact of policy changes. Static ageing techniques are typically used to either age a microdata file so that it more accurately represents the current world or to provide forward estimates of the impact of policy change during the next few years.

    Dynamically ageing microsimulation models, on the other hand, involves updating each attribute for each micro-unit for each time interval. Dynamic models are more complicated in that a temporal element is introduced into the modelling. Individuals are aged and stochastically undergo transitions, as well as being subject to modified policy regimes (Halpin 1999; Sauerbier 2002). Dynamic models often start from exactly the same cross-section sample surveys as static models. However, the individuals within the original microdata (the model's cohort) are then progressively moved forward through time. This is achieved by making major life events - such as education and training, labour force participation, family formation and dissolution (marriage, children, separation, divorce), migration, retirement, death etc - happen to each individual, in accordance with the probabilities of such events happening to real people within a particular country. Thus, within a dynamic microsimulation model, the characteristics of each individual are recalculated for each time period. This involves the use of large transition matrices or econometric techniques to determine the various year-to-year shifts. Hence, dynamic microsimulation models are generally much more complex and expensive to build.

  • Social models tend to be either deterministic or stochastic in nature. If a model is deterministic then it is rule-based - if A then B e.g. if an individual meets certain criteria then they are eligible for a government pension. Stochastic modelling, in contrast, is based on conditional probabilities that certain social conditions or processes will exist or occur - for example, the likelihood that an 18 year old from a high income family, completing year 12 from a private school, will attend university.
  • The majority of models are non-behavioural in that no allowance is made for changes in individuals' behaviour in response to policy changes. Other than being a standard practice in microsimulation modelling, it is often reasonable to make this assumption in the absence of any real world data as to how people would react to changes in their circumstances. A challenge is to incorporate behavioural elements and responses (e.g. consumer preferences, labour supply responses, elasticities of demand) into social models. This adds complexity to the model and increases the technical difficulty in its construction and maintenance. However, some policies are designed to impact on behaviour - such as altering the consumption of certain goods and services, changing individuals' participation in the labour market or increasing compulsory savings through superannuation. Increasing patient copayments for prescribed medicines subsidised on the pharmaceuticals benefit scheme (PBS) is not only a method for government to raise revenue to help pay for the pharmaceutical bill but is also suppose to act as a price signal to consumers to encourage more appropriate patterns of consumption of PBS-listed pharmaceuticals. In such situations, behavioural models should be constructed if at all possible.
  • Until recently, most econometric-based models were non-spatial - the concern being for 'who is affected' not 'where do these people live'. An important limitation of the models to date has been that results have only been available at the national level or, at best, at a State or Territory level. This is because the existing models have been constructed on top of ABS sample survey data, which does not by itself allow estimates at small geographic levels. Thus, it has not been possible in the past using most models to predict the spatial impact of possible policy changes upon the household sector. Regional models are now being developed through the construction of synthetic small area populations (see 3.23) that will allow policy analysts to investigate the local area impacts of policy changes.

2.3
The aim is to determine what type of model - which of the above characteristics - best suits the tasks in hand. Microsimulation models are typically complex, large, by definition quantitative, more commonly static, deterministic, non-behavioural and non-spatial. However, as discussed later in the paper, newer models are emerging that are increasingly dynamic, encompass behavioural elements, or are designed as regional models. The overall key to effective social modelling is to design, build and use the model for the purposes for which it is intended, and to interpret the results within the limitations of the model.

2.4
Microsimulation models are a pre-eminent type of social model. They now are used extensively throughout the industrialised world, most often for predicting the immediate distributional impacts of government policy change. Such models are unusual in the degree of detail they provide about distributional impact, and are regarded as one of the more useful modelling approaches available to those interested in the likely future impacts of population ageing (including retirement incomes) (Citro and Hanushek 1991; OECD 1996).

2.5
The key use of microsimulation models has been to elucidate the immediate revenue and distributional impacts of changes in tax and social security policy. The idea of analysing the impact of social and economic policies by simulating the behaviour and characteristics of individual decision-making units was pioneered by Guy Orcutt in the United States in the 1950s (Orcutt 1957; Orcutt et al 1961). Microsimulation models were first introduced into Australia in the mid 1980s.

2.6
Microsimulation models start with microdata i.e. "low-level" population data - typically the records of individuals from a national sample survey conducted by a national Bureau of Statistics. This is one of the most important advantages of large scale microsimulation models. Being based on unit records, it is possible to examine the effects of policy changes for narrowly defined ranges of individuals or demographic groups (Creedy 2001). Further, they can mirror the heterogeneity in the population as revealed in the large household surveys. Other strengths are that the models can replicate the complexity of the policy structures, transfers, and settings, and they can be used to forecast the outcomes of policy changes and 'what if' scenarios - the results describe what, under specified conditions, may happen to particular individuals and groups.

2.7
An overview of microsimulation -what is microsimulation, the various types of models, some of the technical characteristics and considerations, and examples of model applications - can be found in Harding (1996) and Gupta and Kapur (2000).

2.8
The National Centre for Social and Economic Modelling (NATSEM) is a specialist microsimulation modelling centre, established at the University of Canberra in 1993. The NATSEM models and results are used by a wide range of Federal and State Government departments to answer questions about the distributional and revenue impacts of possible policy changes. The models have played an important role in public policy debate in Australia. Some of these will now be discussed to illustrate their technical construction and the potential usefulness of this type of social modelling.

* Examples of NATSEM's Microsimulation Models

STINMOD - A static model of tax and transfer policy

3.1
STINMOD is NATSEM's publicly available static microsimulation model that simulates the payment of personal income taxes and the receipt of social security cash transfers. STINMOD is used to estimate the impact of these systems on Australian families. In essence, STINMOD applies the rules of the income tax and government cash transfer programs to a database of income units[1] representing the Australian population (Bremner et al 2002). From a modelling perspective, STINMOD can be conceptualised as having two major components. The first is the suite of 'entitlement' modules. These modules simulate the policy rules of the major federal tax and transfer programs, including eligibility, entitlement and interaction. These rules are translated into computer code using SAS software. The second component is the basefile. The policy rules are applied to a population database comprising income units, the individuals of which are a representative sample of the Australian population (Bremner et al 2002). This database is referred to as the basefile, and is constructed from the representative population samples interviewed in national ABS surveys. Each record in the basefile, representing an income unit, contains information about the income unit as a whole and information on each person in the income unit.

3.2
The first version of STINMOD was released in 1994. Since then, the ANTS (A New Tax System) tax reform package has been implemented and more up-to-date data released. The latest versions of STINMOD are based on the 1996-97 and 1997-98 ABS Income Surveys (SIHCs). The basefile includes a wide range of demographic and economic indicators as well as income unit, family and household structure. Each person, income unit, family and household in the SIHC dataset has a unique identifier attached to it. These identifiers allow users to link people in the same income unit, family or household (Bremner et al 2002). In this way, the impact of policy changes can be investigated with respect to not only narrowly defined groups of individuals but also types of families. STINMOD reflects the latest income tax and social security systems with forecasts over a five year period (outyears). STINMOD as an outyears model, allows users to choose the financial year they wish to analyse (Bremner et al 2002). The latest version contains 23,263 records (combining the microdata from the two most recent SIHCs as well as including records representing a synthetic sample population of the institutionalized population).

3.3
STINMOD basefiles are constructed from known benchmark data (e.g. ABS surveys). The microdata are then up-rated to try to better reflect the current world. For example, unit records are aged by re-weighting them (see below) using sources such as ABS population projections, labour force data, forecasts of key parameters such as the consumer price index (CPI), and Department of Family and Community Services (FaCS)(and other) administrative data and client projection figures. The aim is to match STINMOD output as closely as possible to available administrative, survey or census data.

3.4
There are three important elements in the STINMOD projected basefile creation process. These are: 1) calculating the weights attached to each income unit. Each of the individuals in an income unit has to be assigned a weight. This weight represents the likelihood of finding persons with a similar set of characteristics in the Australian population. Weights are provided in the ABS surveys but these apply to the time of the surveys and therefore need to be adjusted to better match up-dated administrative program numbers and compositional changes in the population; 2) uprating private incomes. The process of uprating private incomes includes revising wage and salary earnings (by full-time and part-time labour force status and by quintile of income), income from self-employment, and incomes from other sources (e.g. dwelling rents, interest, dividends, royalties and other investments). The value of transfer payments recorded in the surveys is not uprated, since STINMOD calculates these amounts directly; and 3) imputation of information not collected in the ABS surveys. The ABS microdata datasets do not contain all the information needed to be able to accurately apply the rules of the government cash transfer and income tax systems modelled in STINMOD. Thus a number of imputations need to be performed as well, for example, including family links about parental income and family structure for single income units (young adults) living away from home and still considered dependants for cash transfer purposes, or workforce independence for single income units (Bremner et al 2002).

3.5
The STINMOD model can provide estimates of the immediate distributional impact of a proposed policy change, such as a liberalisation of the age pension income test, or a tax cut - showing who wins and who loses from the policy change and how great are the gains and losses for particular types of families. It also shows the impact on the spending of government departments and on revenue collected by the Australian Tax Office. The STINMOD model has now been used for more than five years by Federal government departments - such as FaCS and the Treasury - to look at the impact of policy change. In the late 1990s, the STINMOD model was joined with Professor Neil Warren's STATAX model of indirect taxes. The resulting STINMOD-STATAX model was used to assess the likely distributional impact of the government's GST tax reform package for the Senate Committee on a New Tax System (Warren et al. 1999). After all of the changes, NATSEM found that final tax reform package provided the greatest benefits to single income couples with children and sole parents (Figure 1). Results from the model were one of the factors leading to the Government delivering more generous compensation to social security recipients and reducing the proposed income tax cuts to high income earners.

Figure 1
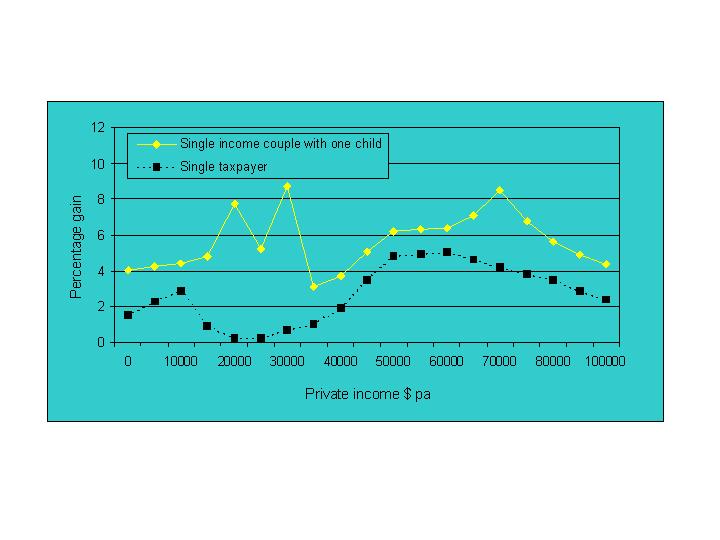
Figure 1. Estimated Percentage Gain in Disposable Income from the Final GST Tax Reform Package (Source: Harding et al 2000)

3.6
Tax and cash transfer microsimulation models, such as STINMOD, offer significant opportunity for assessing the fiscal and distributional impacts of social security and welfare policy reforms such as those announced in the Australian 2002-03 Federal Budget. For example, in Australia, the Commonwealth government provides means-tested income support to people with disabilities as well as to partners, parents and other carers of people with disabilities (2002-03 Budget Paper No 1, p6-30). Key payments, such as the Disability Support Pension (DSP) or the Carer Payment, are contained within STINMOD's entitlement modules.

3.7
The Government 2002-03 budget measure "Recognising and Improving the (Work) Capacity of People with a Disability" was expected to result in a significant reduction in Commonwealth Government expenditure on the disability support pension after 1 July 2003 as the budget announced a change to the DSP qualification criteria such that people with a disability who can work at least 15 hours a week at award wages within two years of assessment would no longer qualify for DSP. Currently, the work criteria is being unable to work at least 30 hours a week at award wages. The number of new DSP claims approved would diminish - the Government stating that most unsuccessful claimants would move onto other more appropriate income support payments, such as the Newstart Allowance[2] (2002-03 Budget Paper No 1, p6-30). Existing recipients also would be assessed under the new criteria at the time of their DSP review, with a resultant shift of many recipients from the DSP to Newstart Allowance.

3.8
These changes in Government policy have implications for microsimulation modelling. A liberalisation or contraction of the income test, for example, can be modelled relatively easily in STINMOD by changing the parameters within the entitlement modules and some of the SAS coding, and the consequential impacts on families estimated. Given the income data within STINMOD, it is possible to estimate the number of individuals and families that would be affected by replacing the income test for DSP with that for Newstart for example - the program the Government expects most new and current DSP recipients to go onto. The change in personal and family disposable income for different groups of persons with disabilities - e.g. different age groups or family types - from shifting between these two schemes, and the net savings to Government, could be estimated. Similarly, the degree to which DSP recipients and their families would be 'better-off' by participating in part-time paid employment could be simulated in STINMOD, by allocating to DSP recipients, on some pro-rata basis, possible number of work hours, award rates and expected earnings.

3.9
However, difficulties start to emerge when considering how to explicitly model the proposed change in the 'hours of work ' criteria - the cornerstone of the budget measure. Essentially, there are insufficient data within the SIHC to accurately model this. The national surveys contain no data that would indicate either the capacity or the propensity of persons with a disability to work at least 15 hours, and specifically what proportion and who of the majority of DSP beneficiaries who have identified themselves as not currently working, could work if encouraged to do so. It also is not known whether or not those who currently report working some hours are willing to or could work more hours. The policy centres much more on value judgements as to who is able or not able to work, and is therefore more discretionary and consequently much more difficult to model. In this situation, the microsimulation modelling is limited by the lack of appropriate individual behavioural data on labour market participation, which is needed to adequately simulate such policy changes.

A Socio-Economic Model of the Australian Pharmaceutical Benefits Scheme

3.10
In the last few years NATSEM has begun to apply microsimulation techniques to health policy issues. The first Australian Pharmaceutical Benefits Scheme (PBS) microsimulation model was developed by NATSEM in 1997-98. This was a static microsimulation model that used STINMOD as a base and then added data from the National Health Survey (NHS) about usage of prescribed pharmaceuticals according to age, gender and concession cardholder status. The model simulated spending on PBS subsidised pharmaceuticals by different types of households; the resultant government outlays under the PBS; and the remaining out-of-pocket costs (patient copayment contributions) to the two different classes of consumers in Australia i.e. concessional patients and general patients (Walker et al 1998; Walker 1999).

3.11
Since the early 1990s, PBS expenditures in Australia have grown at over 10 per cent a year - well above the growth in the total health budget (6 per cent) or the economy (4 per cent in terms of GDP). The PBS is an uncapped scheme and the likely future growth in outlays by government is a cause for government concern. Future increases in expenditure will be partly driven by population ageing but are also the result of forecast increases in drug prices and the introduction of new high cost biotechnology and other targeted drugs. During the past year, NATSEM has been working with the Medicines Australia (formerly the Australian Pharmaceutical Manufacturers Association - APMA) to build a sophisticated PBS model and forecasting capacity to examine the distributional and cost impacts of the PBS. The goal is to be able to simulate the widest possible variety of changes - in the drugs listed under the PBS, in their prices, and in the rules (settings) of the PBS such as the amount that consumers have to pay before becoming eligible for government subsidy as well as the safety net thresholds, which are the arrangements put in place to protect individuals and families from large overall expenses for PBS listed medicines.

3.12
The 'APMA' model is made up of two modules: a medicine and a patient module. The medicine module is based on data on monthly expenditure and scripts for all items listed on the PBS. It uses this time-series data to project total scripts and average costs per script into the future. These data then form the inputs to the patient module. The patient module is based on an input dataset (basefile) at the person-level with a family identifier to link family members. This link is crucial since the PBS rules regarding safety net thresholds concern family expenditure on drugs.

3.13
Four data sources are combined at the unit-record level to create the patient module's basefile: STINMOD(v.01A) provides the base population dataset; the ABS 1995 National Health Survey (NHS) is used to derive information on the usage of prescribed pharmaceuticals across 36 drug classes; the number and type of drugs are imputed by sex, age and concessional cardholder status with weekly household expenditures on prescribed pharmaceuticals being obtained from the 1998-99 HES; and administrative data on PBS scripts and costs across the 36 drug classes, from the Pharmaceutical Benefits Branch (PBB) of the Department of Health and Ageing is used to align the model (i.e. to revise scripts per person so aggregates match real data). The model's population database is the non-institutionalised population that spends on prescribed drugs (i.e. the dataset contains only spenders on prescribed medicines)[3].

3.14
The script data in the person-level dataset is revised each year to be consistent with the aggregate level of scripts estimated in the medicine module. As with STINMOD, the basefile is up-rated using ABS population projections, trends in male weekly average earnings and the CPI, for example. Using average costs generated by the medicine module, patient and government expenditures on PBS prescribed drugs are estimated for a base year such that these match actual figures on PBS scripts and expenditures for that year. The module then can forecast PBS scripts and expenditures for the next five years, as well as simulating 'what if' scenarios reflecting possible policy changes in the PBS settings.

3.15
NATSEM recently was successful in gaining an Australian Research Council Linkage Grant, with the Medicines Australia as an industry partner, to extend this model to begin looking at the benefits, as well as the costs, of prescribed medicine usage. To date, the primary utility of the model has been based on its capacity to generate PBS expenditures, as well as to estimate the corresponding effect on families belonging to various income groups. While the model has provided valuable insights into the effects of various policies on government expenditure on PBS medicines and distributional equity, it does not have the capability to quantify the value that pharmaceutical spending delivers.

3.16
To present a more comprehensive picture of the contribution of pharmaceuticals to the economy and society, one needs to present not only the costs but also the benefits that it delivers - particularly in the form of improved health outcomes. Extending the model to include health outcomes will be more complex and resource intensive than the modelling attempted to date. Modelling health outcomes presents a range of theoretical and practical challenges, particularly at the level of aggregation at which the APMA model currently operates. There are limitations in the methodology and data available for health outcomes modelling which will need to be explored and overcome if the current model is to be significantly progressed. However, the outcomes of achieving this are potentially enormous.

3.17
For example, a necessary first step to developing a health outcomes facility is the introduction of diseases and disabilities into the model's basefile. Adding variables on morbidity patterns to complement the variables already available on drug usage and cost patterns would enable us to, for example, identify groups of individuals with specific health problems and disabilities and examine the impact of policy changes in the PBS settings on these sectors of the community. It would be possible to examine, for example, options that raise copayment thresholds for general patients but simultaneously protect the chronically ill through concessional rates and safety net provisions. The next step would be to quantify health outcomes, which is much more difficult.

3.18
The significance of this type of microsimulation modelling is that this new PBS model will increase Australia's capacity for making informed decisions about the rules of this scheme and, ultimately, about the overall social and economic value of the PBS to Australian society and to specific members of the community.

DYNAMOD - A dynamic microsimulation model

3.19
The modelling efforts described above fall within the province of static microsimulation modelling. NATSEM's dynamic model, DYNAMOD, has been under construction for the past nine years (King et al. 1999). The model starts with the 1986 census one per cent sample (about 160,000 individuals). It then ages each of those individuals, month by month, for up to about 60 years. Dynamic models are particularly useful for looking at the likely future or long-range impacts of government policy or current social and economic trends. During the past year NATSEM has been adding assets and superannuation to the DYNAMOD model, with the aim of throwing light on the likely future retirement incomes of Australians.

3.20
The level of superannuation coverage for both men and women has increased dramatically in Australia since the introduction of a three percent industrial award superannuation and then the Superannuation Guarantee in 1992. The latter of these, with its compulsory nine per cent employer contributions for every employee earning more than $450 per month, is having a dramatic impact on the coverage of superannuation. In 1993, only half of all employees aged 15 to 74 years were covered by superannuation. The NATSEM simulations suggest that this proportion has now increased sharply, to about 85 per cent of all such employees (Kelly et al. 2001).

3.21
The introduction of compulsory superannuation is making a particularly dramatic difference for women, who were less likely than men to be covered by superannuation at the beginning of the 1990s. In 1993, female average superannuation assets were worth 43 per cent of average male assets. In other words, in 1993 the average woman had accrued less than half the amount that the average man had. By 2030, the average woman's superannuation is forecast to have increased to 70 per cent of the average man's. (Women still lag behind because they remain more likely to take time out of the labour force for parenting and, when in the labour force, earn less than men.) The results from DYNAMOD suggest that compulsory superannuation will particularly benefit women in their 40s and early 50s.

3.22
The DYNAMOD forecasts indicate that in the near future almost all Australians will be retiring with at least some superannuation entitlement. However, for many Australians, accumulated superannuation is expected to be relatively low. Even by 2030, about 10 per cent of women of retirement age are forecast to have superannuation assets of less than $100,000 (Figure 2). The middle (median) amount of superannuation for such women of retirement age is forecast to be just under $200,000 by 2030, up from less than $50,000 in 2000. If a government decided that this was an inadequate level of superannuation coverage, DYNAMOD could then be used to simulate a world where the Superannuation Guarantee was raised to, say, 15 per cent of earnings.

Figure 2
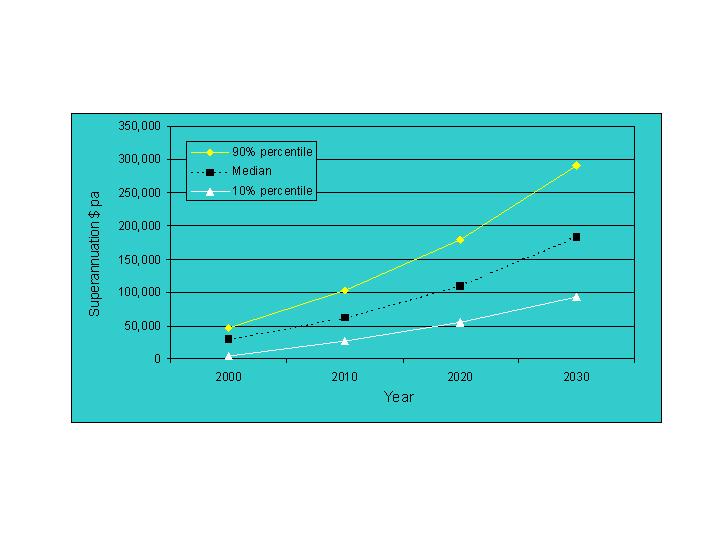
Figure 2. Forecast Superannuation Assets for Women Aged 55 to 64 Years, 2000 to 2030 (Source: Kelly et al. 2001)

Regional models - Synthetic Australian Geo-demographic Information (SYNAGI)

3.23
A particularly exciting development during the past two years at NATSEM has been the creation of regional microsimulation models. Regional issues have recently assumed much greater importance in Australia. There is a growing realisation that recent gains from economic growth have not been equally distributed amongst different regions in Australia. For example, the overall stability in national poverty rates since the early 1980s appears to have disguised increasing poverty and inequality in many areas of regional and rural Australia (Vinson 1999; Gregory and Hunter 1995; Harding and Szukalska 2000).

3.24
The region in which people live profoundly affects the life experiences of all Australians and the economic opportunities available to them. For example, those who live in areas that are developing rapidly are more likely to experience abundant job opportunities and increasing wealth. In contrast, those who live in highly depressed areas may face a constellation of problems, including greater difficulties with crime and personal safety and poorer health (Taylor et al 1992; Gregory and Hunter 1995; Murphy and Watson 1997; Vinson 1999; Walker and Abello 2001; ACT Chief Minister's Department 2002).

3.25
The new regional microsimulation models, being developed under NATSEM's 'Synthetic Australian Geo-demographic Information' (SYNAGI) banner, combine data from the population census and the ABS sample surveys (such as HES and SIHC). The crucial advantage of the census, the importance of which cannot be over-emphasised, is that it contains detailed regional socio-demographic information. However, although the census products from the ABS are regarded as being among the best in the world, they have important limitations that have constrained regional socio-economic analysis in Australia until now. One limitation, for example, is that detailed data on expenditures and incomes are not available in the census. A second important problem is that output for the whole census file is only available as a pre-defined series of tables for area units - the smallest unit being the Census Collection District (CD) which is approximately 200 households - rather than being in the form of records for each person or family, which is what is required for a microsimulation model. This means that many of the relationships between characteristics of interest cannot be fully explored.

3.26
On the other hand, the ABS sample surveys, like the HES, contain exceptionally detailed expenditure and income data at the individual and household level, but lack any detailed geographic information. In part, this is to protect the confidentiality of respondents to the survey. Often the most detailed geographic classification available in the publicly released data is the 'State'.

3.27
To overcome the problem of the non-spatial element in microsimulation models, during the past two years NATSEM has begun the construction of regional microsimulation models. To date, these new types of model have combined data from the population census and the ABS sample surveys. The new spatial microsimulation modelling techniques developed at NATSEM blend the census and sample survey data together to create a synthetic unit record file of households for every CD. In other words, the characteristics of interest unavailable in the census but available in the survey are synthesised at CD level by utilising both data sources.

3.28
The first model to be constructed by NATSEM using these new techniques was the Marketinfo model, which provides detailed regional expenditure and income estimates. The model first recodes the HES and census variables to be comparable, and then re-weights the HES, utilising detailed socio-demographic profiles from the census. This is done for each CD separately, and a re-weighted HES unit record file is generated for each area. To date, the output from this model has principally been used by private sector clients - to determine where to put new shopping centres; to examine what percentage of total spending in an area is received by their shops; to maximise the efficiency of direct marketing efforts, or to examine the estimated incomes and assets of consumers living within each CD.

3.29
However, these modelling techniques are now starting to be used to address the concerns of public policy makers. For example, NATSEM has looked at estimated poverty rates by statistical subdivision in the Australian Capital Territory (ACT) (Harding et al 2000). This study indicated that just over 13 per cent of all residents living in the North Canberra area were in poverty, with this being due to the high concentration of students and public housing tenants in this area. This model has also been used to examine postcodes with the highest and lowest poverty rates within each state (Lloyd et al. 2001).

3.30
NATSEM is also engaged in a long-term project to develop a small area model of the characteristics and access channel usage of Centrelink clients, both now and in five years time. Centrelink is a federal government agency that delivers a range of services, programs and payments for Commonwealth government departments. The model will help Centrelink with its property management strategies, as well as providing forecasts of the likely demand for each of the various methods of accessing Centrelink services (e.g telephone, internet, post, in-person).

3.31
NATSEM is now spearheading a project that aims to substantially improve the decision-support tools available to State and Territory governments by providing them with, first, far more detailed small area data than has previously been available, via the creation of a synthetic small area household database; and second, the capacity to assess the current and future impact of possible policy reforms and likely social, demographic and economic changes at the small area level, through the construction of regional microsimulation models on top of the synthetic household data.

3.32
These efforts to develop spatial microsimulation are at the leading edge internationally. Other countries where spatial microsimulation is being developed comprise the highly regarded CORSIM project in the US (Caldwell et al 1998); Sweden (Comaren 1999); and Leeds and Liverpool Universities in the UK (Voas and Williamson 2000, Ballas and Clarke 1999). NATSEM's current work involves refining the techniques used to create the synthetic small area data; providing much more extensive validation of the outcomes; adding additional characteristics to the simulated households; simulating the impact of tax, social security and other changes at a spatial level; developing techniques for ageing the small area data forward through time; and initiating linkages between NATSEM's dynamic modelling of wealth and superannuation and the spatial projections of households. The significance of this project is that it seeks to create robust and validated spatial datasets and models that State and Territory policy makers can have confidence in and use to address their key policy issues.

* Conclusions

4.1
This paper has described some recent modelling developments at NATSEM, including the development of complex health and regional microsimulation models. These new models lie at the frontiers of current knowledge, with microsimulation techniques only now being applied to the analysis of these issues, both in Australia and internationally. As Halpin (1999) highlights, the next phase in the development of microsimulation modelling is to apply these to social issues wider than the 'bounded domain of government transfer policy' - their traditional focus. It is expected that ultimately these new models will extend to the health and regional analysis fields the same sophisticated decision-support capacity as microsimulation models currently provide to policy makers in the tax and social security arenas.

4.2
Microsimulation models have been criticised for embodying more technical knowledge than theory (Halpin 1999). In practical terms, these models are relatively complex, have significant data handling and computing requirements, are costly to build and maintain, and usually require a team of developers with a wide range of expertise and skills. Models are limited by their design, their assumptions and algorithms, and data requirements. The key is to make these explicit and then interpret the results within the models' limitations and capacities.

4.3
The aim is to use social models appropriately and for the purposes for which they are built. In this way, the potential of microsimulation models in the social security, welfare and health fields is very significant. However, it is important to recognise that measuring economic and social benefits is 'not just about the dollars'. Policy decisions are necessarily going to involve value judgements - policies are created and implemented within a political environment. The aim is for social modelling, and in particular policy simulations, to contribute to a more rational analysis and informed debate which leads to the implementation of equitable public policies. In this context, microsimulation models can make a significant contribution to the evaluation of public policy, as well as private sector structures, and more specifically as they relate to people with disabilities. While the challenge will be to develop models that will perform well, the future prospects are very exciting.

* Acknowledgments

The authors wish to thank NATSEM staff for their assistance and helpful comments on the paper. The paper draws on a variety of research projects undertaken by NATSEM. Some of these projects have been supported by Australian Research Council grants and funding from a variety of industry partners.


* Notes

1 The Australian Bureau of Statistics defines an income unit as 'one person or a group of related persons within a household, whose command over income is assumed to be shared. Income sharing is assumed to take place within married (registered or de facto) couples, and between parents and dependent children' (ABS 2001).

2 Newstart is for unemployed people aged over 21 or people who are temporarily unable to work due to illness, injury or disability.

3 The APMA Model basefile excludes persons (and their families) that have no expenditure on prescribed drugs, and persons living in institutionalised care, for example, hospitals or nursing homes. Prescribed drug usage figures at ages above 70 years, therefore, are likely to be under-estimates.


* References

AUSTRALIAN BUREAU OF STATISTICS (2001). Income Distribution, Australia, Catalogue No. 6523.0, Canberra.

ACT Chief Minister's Department, Australian Capital Territory Government (2002). Youth in the ACT.A social and demographic profile. ACT Government, Canberra.

BALLAS, D and Clarke G. (1999). 'Modelling the local impacts of national social policies: A microsimulation approach', Papers presented at the 11th European Colloquium on Theoretical and Quantitative Geography, Durham Castle, Durham, England, 3rd to 7th September, 1999.

BREMNER, K., Beer, G., Lloyd, R., and Lambert, S. (2002). Creating a Basefile for STINMOD, NATSEM Technical Paper No. 27, University of Canberra, Canberra.

CALDWELL, S. B., Clarke, G. P. and Keister, L.A. (1998). Modelling Regional Changes in US Household Income and Wealth: A Research Agenda, Environment and Planning C: Government and Policy, 16, pp. 707-722.

CITRO, C.F. and Hanushek, E.A. (1991). The Uses of Microsimulation Modelling, Review and Recommendations, Vol 1, National Academy Press, Washington.

COMAREN P, Ventcatasawmy, Holm, E., Rephann, T., Esko, J., Swan,N., Ohman, M., Astrom, M., Alfredson, E., Holme K., and Siikavaara, J. (1999). 'Building a spatial microsimulation model', Spatial Modelling Centre on Human Dimension of Environmental Change, SMC, Urnea Universtiy and Lulea Technical University, Kiruna Sweden. Paper presented at the 11th European Collopuium on Quantatative and Theoretical Geography, Durham England, Sept. 1999.

CONSIDINE, M. (1994). Public Policy: a Critical Approach. MacMillan, South Melbourne.

CREEDY, J. (2001). Tax modelling. Economic Record, 77 (237), pp. 189-202.

GREGORY, R.G. and B. Hunter. (1995). The macro economy and the growth of ghettos and urban poverty in Australia. Discussion Paper No 325, Centre for Economic Policy Research, Australian National University.

GUPTA, A. and Kapur, V. (eds) (2000). Microsimulation in Government Policy and Forecasting, Contributions to Economic Analysis Series, North Holland, Amsterdam.

HALPIN, B. (1999). Simulations in sociology. The American Behavioral Scientist. 42(10), pp.1488-1508.

HARDING, A. (ed). (1996). Microsimulation and Public Policy, Contributions to Economic Analysis Series, Amsterdam, North Holland.

HARDING, A. and Szukalska, A. (2000).Trends in Child Poverty in Australia, 1982 to 1995-96, Economic Record, 96(234), pp. 236-254.

HARDING, A., Lloyd, R., Hellwig, O. and Bailey, G. (2000). Building the Profile: Report of the Population Research Phase of the ACT Poverty Project, Poverty Task Group Paper No. 3, ACT Government, Canberra.

KELLY, S., Percival, R. and Harding, A. (2001). Women and Superannuation in the 21st Century: Poverty or Plenty? Paper presented at the National Social Policy SPRC Conference, University of New South Wales, Sydney, Australia. 4-6 July 2001.

KING, A., Bækgaard, H. and Robinson, M. (1999). Dynamod-2: An Overview.Technical Paper No. 19, National Centre for Economic Modelling, University of Canberra.

LLOYD, R., Harding, A. and Greenwell, H. (2002). Worlds Apart: Postcodes with the Highest and Lowest Poverty Rates in Today's Australia, in Eardley, A., and Bradbury, B. (eds), Refereed Proceedings of the National Social Policy Conference 2001, SPRC Report 1/02, April. 2002.

MARCH, J.G. and Olsen, J.P. (1989). Rediscovering Institutions: The Organisational Basis of Politics. The Free Press, New York.

MURPHY, P. and Watson, S. (1997). Surface City: Sydney at the Millennium. Pluto Press, Sydney.

OECD, (1996). Policy Implications of Ageing Populations: Introduction and Overview, OECD Working Paper no. 33, Paris.

ORCUTT, G. (1957). A new type of socio-economic system, Review of Economics and Statistics, 58(2), pp. 773-797.

ORCUTT, G., Greenberger, M., Korbel J. and Rivlin, A. (1961). Microanalytic Simulation Models to Support Social and Financial Policy, Harper and Row, New York.

SAUERBIER, T. (2002). UMDBS - A new tool for dynamic microsimulation. JASSS, 5 (2), https://www.jasss.org/5/2/5.html

TAYLOR, R., Quine, S., Lyle, D., and Bilton, A. (1992). Socioeconomic correlates of mortality and hospital morbidity differentials by Local Government Area in Sydney 1985-1988. Australian Journal of Public Health, 16(3), pp. 305-314.

VOAS, D and Williamson, P. (2000). An Evaluation of the Combinatorial Optimisation Approach to the Creation of Synthetic Microdata, International Journal of Population Geography, 6, pp. 348-366.

VINSON, T. (1999). Unequal in Life: The Distribution of Social Disadvantage in Victoria and NSW, The Ignatius Centre, Melbourne.

WALKER, A. and Abello, A. (2000). Changes in the Health Status of Low Income Groups in Australia, 1977-78 to 1995, Discussion Paper 52, National Centre for Economic Modelling, University of Canberra.

WALKER, A. (1999). Distributional Impact of Higher Patient Contributions to Australia's Pharmaceutical Benefits Scheme . Discussion Paper no. 45, National Centre for Economic Modelling, University of Canberra, September, 1999.

WALKER, A., Percival, R. and Fischer, SA. (1998). Microsimulation Model of Australia's Pharmaceutical Benefits Scheme -Technical Paper No. 15, National Centre for Economic Modelling, University of Canberra . August, 1998.

WARREN, N., Harding, A., Robinson, M., Lambert, S. and Beer, G. (1999). Distributional Impact of Possible Tax Reform Packages, Main Report, Senate Select Committee on a New Tax System, Senate Printing Unit, 445-508, 1999.

----

ButtonReturn to Contents of this issue

© Copyright Journal of Artificial Societies and Social Simulation, [2002]