Reviewed by
Oswaldo Teran
Centre for Policy Modelling,
Manchester Metropolitan University, Manchester, UK.

Published five years ago, Per Bak's book How Nature Works: The Science of Self-Organised Criticality presented a new concept to the wider scientific community, that of Self-Organised Criticality. The image of the sand pile, retaining its conical shape as more sand is added, became widely known. Although avalanches on the sides of the pile (maintaining its stability) were individual unpredictable in size and timing, the distribution of avalanches and their timings displayed an interesting kind of regularity. In this review, I describe Bak's key ideas and explore their implications for social simulation and our understanding of society.
Some of the characteristics of a self-organised system Bak introduces are:
Bak's evolution model is derived from the failed attempts which he and Stuart Kauffman made to produce self-organised critically (SOC) in the Kauffman NKC model: a model also referred to as 'interacting dancing landscapes'. Using this model, Bak and some collaborators devised another model that successfully displayed SOC. This model is particularly illustrative of Bak's ideas and the theory of SOC. Bak uses this model to show not only characteristics of the state of SOC but also features of the 'transition state' from a (non self-organised) initial state to the state of SOC. It seems important to start by describing the original NKC model because of the importance Bak attributes to it. As he states: "...it is the first serious attempt to model a complete biology." Nevertheless, experimentation with this model was not entirely successful, as Bak himself points out: "...despite Stu's early enthusiastic claims, for example in his book The Origin of Order, that his models converge to the critical point, that they exhibit SOC, they simply don't."
The NKC model consists of an array of size K representing K interacting species, where each species consists of a binary string {0, 1} of size N. Each digit represents a gene (or "trail") and each species interacts with C other species. This interaction would involve only certain specific genes of the interacting species. For example, a 232 model (e.g., N = 2, K = 3 and C = 2) would be shown as (10 11 01). In this case, all species interact with each other by using one gene. The first species interacts with the second one by means of the first species' first gene (with value 1 at present) and the second species' first gene (also with value 1 at present).
A fitness function is associated with the system. This function determines the fitness of a species by operating over the species' digits. The dynamics is defined as follows: for each species, one digit is randomly chosen, then this digit and the linked digits of other species (those digits by means of which other species interact with the selected species) are randomly changed (mutated).
This model was devised as an attempt to experiment with representations of co-evolution in systems that include more than one species. The predator-prey model is the typical example of interaction for only two species - a model that has been well studied but is very limited as a metaphor for reality.
Bak reports that he and Kauffman spent three years attempted to find SOC operating in several variations of this model without any success. Then, he explains how he and his colleague Kim Sneppen found a very interesting variation of the model that successfully shows SOC. The important insight, he says, concerned the method for choosing the mutating species. It was necessary to choose the least fit species rather than all of them. Bak justifies this change in the model on empirical evidence "...bacteria start mutating at a faster rate when their environment changes for the worse, for example when their diet changes from sugar to starch" and from what seems to be a rule in nature. Those species with the lowest fitness are the most likely to disappear or mutate as they are most vulnerable to environmental or to internal fluctuations.
By further simplification Bak and Sneppen developed another model. In this, species were represented by a single number (their fitness) and placed in a circle where each species can interacts only with its two neighbours. The dynamics of the model involves beginning with random numbers, choosing the species with the lowest fitness in each period and then randomly changing its fitness and the fitness of its two neighbours. In Bak's words, "Random numbers are arranged in a circle. At each time step, the lowest number, and the numbers of their two neighbours, are each replaced by random numbers". This model robustly demonstrates SOC under different randomisation of the mutations.
One of the most enlightening and enjoyable parts of the book is Bak's report of the model dynamics towards SOC via periods of avalanches and stasis, as well as the description of the further dynamics after the model reaches the self-organised state. Once the system becomes self-organised, periods of avalanches and stasis continue but the system does not 'organise' any further - the successive stasis states are described by the same analytical rules.
Aspects of the model dynamics in its transition towards self-organisation can be observed in the figure below. (This figure and those that follow are all reproduced from Bak's book.) Here, the smallest fitness values over time are shown as black dots. The envelope function gives the maximum of the smallest fitness up to a particular point in time. This envelope gives an idea of the dynamics behind the 'transition' process. Important aspects of the dynamics occur during the periods between two skips of the envelope function and at the moment of a skip. After a skip the system finds certain relative qualitative 'improvement' in the sense that the smallest of all species' fitnesses historically increases reaching a new relative maximum. Immediately after this jump the fitness of the chosen species (that with the minimal fitness) changes and goes away from their relative maximum, starting an avalanche of changes (a domino effect is generated) where other species' fitnesses are modified and brought away from their relative maximums. Notice that after a skip some fitnesses become smaller than the value of the envelope at the corresponding point of time for the skip. After a skip, the avalanche of mutations continues until a new relative maximum of the minimal value of all species' fitnesses is reached. Then a new skip occurs and a new avalanche is triggered. Consecutive avalanches generally affect different groups of species. In some sense, each avalanche has a measure of independence from the previous one. This process sounds like the improvement of fitness by regions. Nevertheless, as time passes the links between regions become more active and the regions potentially affected by avalanches become bigger. As can be seen below, the process of 'improvement in the overall fitness' shown by the envelope ceases after a certain stage, beyond which the envelope function is located about its upper bound fc. At this point the system has reached the state of SOC: the area potentially affected by any avalanche becomes a single region covering all species. Once the system reaches the state of SOC, the smallest fitness does not exceed the threshold fc. When this is about to happen, an avalanche is triggered instead.
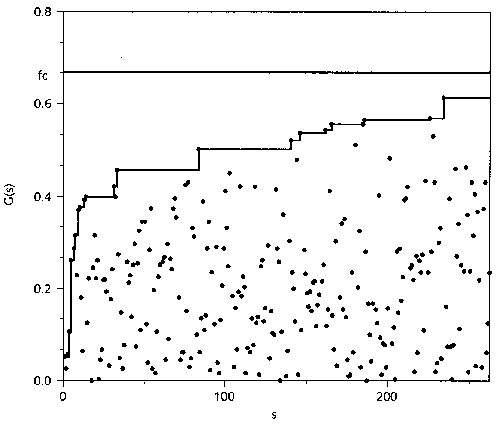
Figure 1. Fitness of least fit species versus the numbers of udpate steps in a small evolution model with twenty species. The envelope function, defining the fitness gap, increases in a stepwise manner. An avalanche starts when there is a step, and ends at the next step, where a new avalanche starts. The envelop function eventually reaches the critical function fc.
The situation after an avalanche is pictured in Figure 2 below. All species' fitnesses are shown just after an avalanche is triggered. The fitnesses below the threshold illustrate how the avalanche advances - changes happen following a pattern similar to the domino effect. This has similarities with the effect of an avalanche in the transition state (i.e., while the system is advancing towards the state of SOC), with the difference that, in this case, the thresholds are relative and move up until reaching the 'critical' value fc.
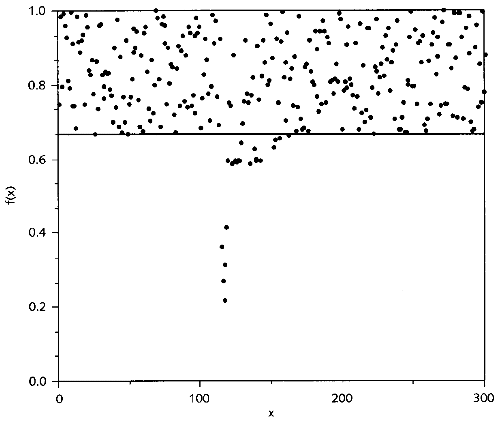
Figure 2. Snapshot of the fitnesses in the stationary critical state in the evolution model. Except for a localised region where there are relatively small fitnesses due to a propagating evolutionary avalanche, all the fitnesses in the system have values above the self-organised threshold f = 0.6670.
Bak describes aspects of natural evolution using this model as a metaphor. For example, he suggests that changes in fitness can not only be described via the processes of mutation, effective adaptation and the like (variation and selection) but also as influenced by extinction. Avalanches show that good fitness is not a guarantee of safety - a species with a high fitness might be touched by an avalanche and then replaced. He suggests that avalanches resemble those sudden changes (characterised mainly by the high proportion of species first extinguished and then replaced) in natural evolution.
In the following section, the most important theoretical aspects of the two processes: self-organisation (or system changes towards SOC) and SOC itself, will be described.
A fascinating aspect of these processes is that fractals on time and space, with associated power law distributions, are found in the spatiotemporal dynamics. Bak describes the process of moving towards self-organisation only for the variation of the NKC model described above.
In Bak's words: "the self-organisation can be described by an inescapable divergence of the size of avalanches". Bak finds that such divergence follows a power law distribution with parameter ã. (He reports a value of ã of 2.7 for the experiment in reference.) This divergence is shown in Figure 1 above. The avalanche brings some improvement in all the species' fitnesses below the value of the minimum fitness resulting at the next jump (or value of the envelope at the next jump). This means that each avalanche generally involves changes in a larger number of species' fitnesses than the previous one. Just before a gap all fitnesses are above the envelope at that gap point, which value is higher than the value of the envelope at the previous gap point, so a later gap should involve mutations over more species than an earlier one.
The asymptotic tendency of the gap to the
'attractor' (or asymptotic value) fc is reported to
be:

where t represents the iteration in the simulation, N the number of species, A is a parameter and ã was defined above. This expression is called the 'gap equation' and corresponds to the envelope in figure 1 above. Bak reports a value fc of 0.667 for the experiments he cites in the references.
The value fc is a sort of attractor and is indicative of the more general dynamics indicated by the robustness of SOC towards which the initially non-self-organised system moves.
The duration of an avalanche measured as the
number of mutation events in the avalanche (variable s) versus
the number of avalanches of each size (variable N) follows the
power law:

where ![]() . That is, avalanches of size, let us say 1,
2, 3, 4, 5 ... s, would occur with probabilities in the proportions
1, 1/2, 1/3, 1/4, 1/5 ... 1/s. That is, the probability of occurrence
is inversely proportional to the size of the avalanche. This
corresponds to a fractal pattern. Bak finds that the log-log plot of
avalanche size against the number of avalanches of that size is a
straight line. This pattern is called 1/f noise or more
generally 1/fa noise where a is in the
interval [0, 2]. In the present case, f = s and a =
1.
. That is, avalanches of size, let us say 1,
2, 3, 4, 5 ... s, would occur with probabilities in the proportions
1, 1/2, 1/3, 1/4, 1/5 ... 1/s. That is, the probability of occurrence
is inversely proportional to the size of the avalanche. This
corresponds to a fractal pattern. Bak finds that the log-log plot of
avalanche size against the number of avalanches of that size is a
straight line. This pattern is called 1/f noise or more
generally 1/fa noise where a is in the
interval [0, 2]. In the present case, f = s and a =
1.
In Figure 3 below, Bak presents a 'fractal graph' representing the dynamics of the model . Here, a black dot indicates a mutation. Bak explains another fractal tendency using this graph. "Starting from a single mutating species, the number R of species that will, in average, be affected after a large number S of updates will be a power law, S = RD, where the exponent D is called 'fractal dimension of the graph'."
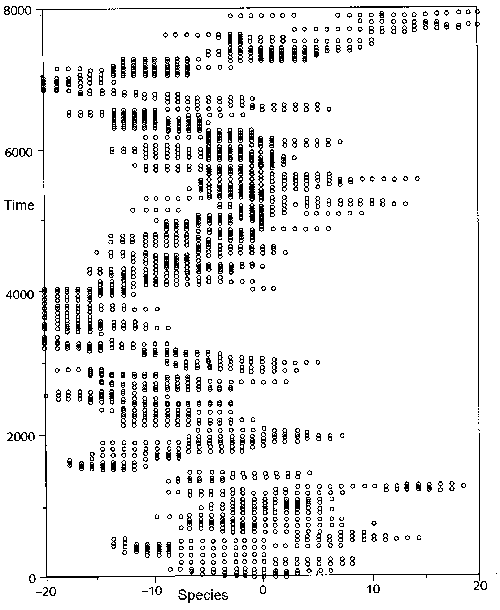
Figure 3. Activity pattern for the evolution model. For each species, the points in time where it undergoes a mutation are shown as black dots. Time is measured as the number of update steps. The pattern is a fractal in time and space.
In figure 4 (below), Bak represents the accumulated mutations for a certain species over time. We can observe the intercalated periods of stasis and avalanches of changes for this species. The horizontal line after a mutation shows stasis and the vertical jumps representing mutations indicate the avalanches of change. This curve with many small jumps and few big jumps is called the 'Devil's staircase'. The periods of stasis are generally much longer than the periods of 'busts'. Bak establishes that the structure of this curve is very similar to that found in data about mutations in the physical size of some natural species. This and other comparisons with data from biological evolution cause Bak to suggest that "The actual statistical properties of the extinction record supports the view that biological evolution is a critically self-organised phenomenon."
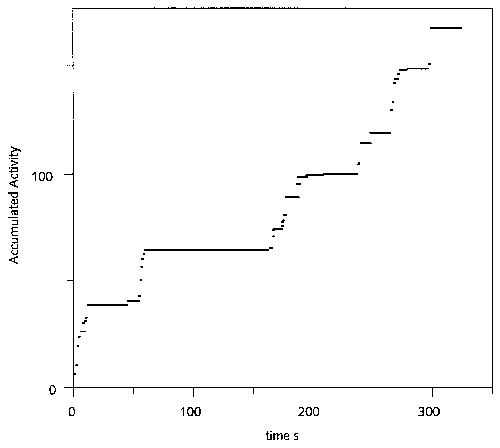
Figure 4. Punctuated equilibria in the evolution model. The curve shows the number of mutation events for a single species, that is the number of black spots encountered when moving along the vertical direction through the fractal shown in Figure 3.
Finally, Bak argues that all parameters of the
observed behaviour can be expressed in terms of the two parameters
 and D defined above. For
example, the positive part of the exponent in the gap equation above,
satisfies:

Similarly, the length of the periods of stasis
shown in figure 4 for the accumulated mutation of a certain species
is a fractal noise following the law 1/fá,
where á was found to be:

and, for the particular experiment the graph refers to, Bak reports a value of á = 0.58.
The robustness of these results indicates that the model is general and makes its application for describing empirical systems very promising.
Bak, in collaboration with Michael Woodford and Jose Scheinkman (p. 187), elaborated a simple model of an economy. It consisted of a 'cascade' of combined producer-consumers, where those in an upper row buy from those in the row below them (see figure 5 below). Those in the first row are pure consumers, those in the intermediate rows are producer-consumers and those in the lower row are pure producers. Each consumer buys from two producers as shown in the figure. The dynamics is as follows. When a producer is asked for goods, if it has enough in stock to satisfy the order it serves that order and does nothing else. Otherwise, it orders a quantity of good from the two producers it is connected with and, as soon as its own order is satisfied, it will serve the orders it has received.
This model is critically self-organised. An
example of an avalanche triggered by the order placed by a consumer
is shown in figure 6 below. An arrow in the first row indicates the
consumer placing the initial order. The initial state of the system
and the successive states are shown in that figure below each other.
Those producers having goods are shown as black dots. Bak finds that
the avalanches follow the law:

with  = 4/3.
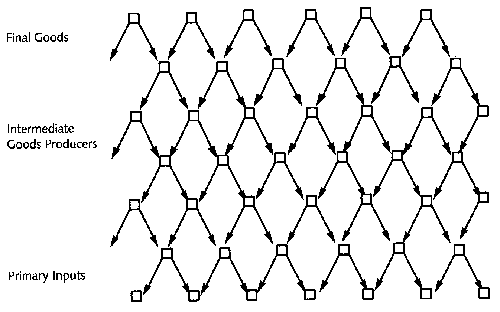
Figure 5. Model of interacting producers. Each producer receives orders from two customers in the row above him. If he does not have sufficient amounts of goods in stock, he sends orders to two vendors further down the network, receives one unit of goods from each vendor, produces two units of his own goods and ships the ordered amount of goods. If he has one unit of his goods left after the transactions, he keeps it in stock for the next round. The process is initiated by consumer demands at the top of the diagram.
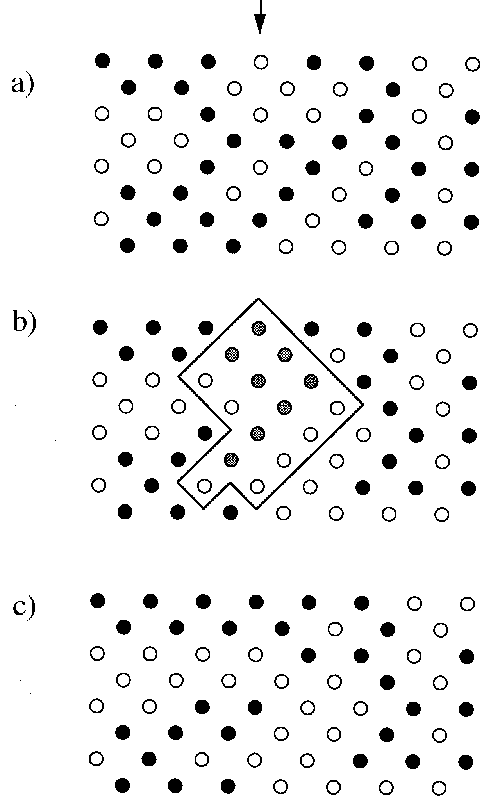
Figure 6. Network a) before and c) after the avalanche initiated by a single demand at the position of the arrow. The arrow indicates the flow of orders. The goods flow in the opposite direction. The black dots indicate the agents who have one unit of their goods in stock. The grey dots indicate who had to produce in order to fulfil the demands. The enclosed area indicates the size of the avalanche.
Bak uses a metaphor and the concept of long-term equilibrium to describe how traditional economists model economics. In this metaphor, economic flow and the economic agents are compared with water and reservoirs, respectively. The economic flow then will correspond to water flowing continuously and linearly through the reservoirs in such a manner that all reservoirs obtain the best value they can (with accumulation of water corresponding to economic satisfaction) - achieving some sort of stability equivalent to Nash equilibrium.
He rejects this traditional view, considering it simplistic, and presents his idea that the dynamics of economic flows is more like the dynamics observed in (and in his models of) sand piles, as changes are not linear and continuous but rather non-linear and discrete. The forces which each individual agent (grain) exercises over the others plays and important role in the dynamics of the system. He considers that there is friction in the economic flow and that agents are not perfectly rational. He believes that friction prevents (long-term) equilibrium from being reached and that fluctuations in economics are of a different nature than those notions the traditional economists propose. He refers to empirical data to support his suggestion that economic systems would be better modelled as critically self-organised systems. For example, he discusses results obtained by Benoit Mandelbrot, in which the percentage of monthly variation in the price of cotton versus the number of occurrences of such percentages over several months follows a power law distribution.
Bak also hypothesises that the dynamics of an economic system should be somewhat similar to that shown by the evolution model described above, where agents (consumers, producers, traders, thieves) interact with each other in accordance with the set of options they have, exploiting such options in order to increase their 'happiness'. These ideas depict a co-evolution model where the more successful agents will survive while the least fitted ones will not or will be forced to mutate by changing their strategy.
SOC related ideas have influenced computational economic and social studies. Examples are the work developed in social simulation by Scott Moss and Bruce Edmonds (Moss 2001a, 2001b, Moss et al. 2000) and in Econophysics by Nagel et al. (2000). Lux (1998, Lux et al. 1999) also reports SOC properties in socio-economic models in his earlier work.
Thomas Lux develops a model of the social and economic interaction of speculators in a securities or foreign exchange market. The behaviour of some agents (the chartists) combines elements of memetic contagion and trend chasing, while the behaviour of others (the fundamentalists) is based in comparing market prices with certain fundamental value. Agents shift between chartist and fundamentalist modes in accordance with their performance and the performance of other observed agents. Lux finds that the distribution of returns derived from the chaotic trajectories of the model exhibits leptokurtosis. This distribution is also found in empirical data. He does not make any reference to SOC. His results seem to be independent, at least in the early stages, from the SOC literature. Lux suggests that the observed tendency (leptokurtosis) is due to the introduction of contagion (or imitation) in the agents' decision-making process.
Moss reports that models he built with his colleague Bruce Edmonds show SOC properties and that such properties also have been found in the data of empirical systems. Such models were also built independently of SOC studies. In Moss (2001a), an agent-based social simulation model of intermediated exchange displayed the same type fat tailed time series and cross sectional data found in data for fast moving consumer goods in retail outlets.
The models developed by Moss and Edmonds consist of agents that reason and are 'socially embedded'. Moss claims that adaptive agent models of markets with such agents "have the same statistical signatures as real markets" (Moss 2001a, p. 1). Moss also emphasises the importance of the opportunities that this kind of model offers for validation on the basis of domain expertise and qualitative analysis. This is valuable for policy analysis in the case of human systems whose structure is highly dynamic.
Moss stresses the differences between modelling physical systems whose dynamic structure (laws of change) are supposed to be valid for much longer time periods than those of human systems. He claims that characteristics of SOC in human systems should be addressed differently than in physical systems and that a different modelling approach should be assumed than that of, for example, 'econophysicists'. Specifically, Moss suggests that there is no stable population distribution underlying observed and simulated time series or cross sectional data in the case of social systems - a result he has found in empirical data and he has been able to reproduce in his simulation models.
This fundamental difference between a human system and a physical system seems to be entirely valid, as a social system is at a higher level of complexity than a physical system. Each agent in or component of a social system is able to manipulate symbols representing ideas and concepts, to elaborate a model of the environment (including agents in its surroundings), to elaborate strategies for acting and to make choices - abilities not found in the components of a physical system. Such abilities produce the autonomy which components of a social system enjoy, make their behaviour more uncertain and add complexity not only to the components but also to the whole social system through component interaction. (For more about levels of systems see, for example, Heylighen 1991.)
Like Lux, Moss argues that the source of self-criticality is the interaction between the agents. However, he goes further and suggests that the kind of interaction able to generate properties of SOC in social systems is that dominated by social embeddedness as described by Granovetter (1985) and Edmonds (1999).
Moss uses his results about SOC in social simulation to question the way that social theory is made and to make claims for new approaches and tools. In particular, he argues that social simulation based on multi-agent systems showing empirically grounded characteristics (e.g., social embeddedness and emergence of SOC properties) would serve as an important research tool.
The system is open. Openness to external forces is located in the interaction of the individuals (agents) and the activity of their cognitive models. The final socio-economic forces (resembling the forces unleashed by grains of sand dropping into a sand pile) seem to be located in the individuals' decision-making process (traced to primary needs, media induced needs, imitation of other individuals or extravagant capricious tastes and so on). North (1990) mentions socio-economic motivation sources at different levels, for instance: institutional (which he considers offers political-economic incentives of high importance for studying economics), social and individual (e.g., of an economic, selfish, or ideological nature). In addition to the different nature of the potential energy input in a social system, as described above, there are important differences between a human system and a physical system. For instance, in a sand pile the effect of a new (dropping) grain would depend on the state of the system, the physical characteristics of the grain and the 'manner' (speed and so on) in which it reaches the sand pile. By contrast, in a human system, an individual's choice might change as a result of tiny changes in the internal model, in motivation or even in feelings. Consequently, the internal model of a component in a human system should play an important role in the self-organised criticality of a socio-economic system.
The choices of an individual are discrete suggesting the existence of a sort of threshold for the agent's decision variables. This, once surpassed, would trigger certain agent's choices. This introduces the idea of metastability to the components in the system.
The system is dissipative. Dissipation occurs as the agents act in accordance with their aims and as the degree of achievement for such aims increases. Dissipation also occurs as the agents change their motivations and their relative 'happiness' is modified. To an even greater extent, dissipation takes place when agents are constrained (or self-constrained) in their needs. It also occurs when the agents' cognitive models miss aspects of their environment as a consequence of their bounded rationality, when the agents' context changes (relationships among agents change or the institutional framework is modified) and because agents do not imitate slavishly. As individuals' choices are discrete, dissipation also occurs discretely.
There are reasons to suggest that socio-economic systems might organise themselves into a critical state with avalanches of change at all sizes via which dissipation mostly works itself out. This is a proposition to be tested but already statistical data like that found by Mandelbrot, Moss and Lux suggest that some variables change via avalanches of all sizes and that the power law distribution describes behaviour for some of these variables. Avalanches may serve, for instance, as a means of dissipation for the internal forces in markets.
A socio-economic system might become catastrophically unstable if the system were manipulated and forced to attain a certain optimal state interfering with its natural dissipation process. This has been observed in centrally controlled economies like that in Russia. However, it does not mean that any external control or influence generates this kind of 'negative' consequence. If an economy were a critically self-organised system, it might be controlled in such a way as to take advantages of its SOC properties. For example, it might be the case that in a weak economy (highly dependent on foreign markets), such as those in developing countries, some controls to protect the country from variations in the markets would help in changing towards or remaining on a 'good' development path. Better understanding of the dynamics of self-organised systems might allow to enhance those factors that minimise the number of large avalanches by channelling system dissipation through more frequent avalanches of small size.
EDMONDS B. 1999. Capturing Social Embeddedness: A Constructivist Approach. Adaptive Behaviour, 7:323-347.
GRANOVETTER M. 1985. Economic Action and Social Structure: The Problem of Embeddedness. American Journal of Sociology, 91:481-510.
HEYLIGHEN F. 1991. Cognitive levels of evolution: From pre-rational to meta-rational. In F. Geyer, editor, The Cybernetics of Complex Systems: Self-Organisation, Evolution and Social Change. Intersystems, Salinas, CA.
LUX T. 1998. The Socio-Economic Dynamics of Speculative Markets: Interacting Agents, Chaos, and the Fat Tails of Return Distributions. Journal of Economic Behaviour and Organisation, 33:143-165.
LUX T. and M. Marchesi 1999. Scaling and Criticality in a Stochastic Multi-Agent Model of a Financial Market. Nature, 397:498-500.
MOSS S., B. Edmonds and S. Wallis 2000. The Power Law and Critical Density in Large Multi-Agent Systems. CPM Report Number 00-71, Manchester Metropolitan University, UK.
MOSS S. 2001a. Policy Analysis from First Principles. CPM Report Number 01-83, Manchester Metropolitan University, UK.
MOSS S. 2001b. Competition in Internal Markets: Statistical Signatures and Critical Densities. CPM Report Number 01-79, Manchester Metropolitan University, UK.
NAGEL K., M. Shubik, M. Paczuski and P. Bak 2000. Spatial Competition and Price Formation. Working Paper Number 00-05-029, Santa Fe Institute, Santa Fe, NM.
NORTH D. 1990. Institutions, Institutional Change and Economic Performance. Cambridge University Press, Cambridge.
Return to Contents
of this issue
© Copyright Journal of Artificial Societies and Social Simulation, 2001