©Copyright JASSS

JASSS logo ----

Shuguang Suo and Yu Chen (2008)

The Dynamics of Public Opinion in Complex Networks

Journal of Artificial Societies and Social Simulation vol. 11, no. 4 2
<https://www.jasss.org/11/4/2.html>

For information about citing this article, click here

Received: 22-May-2006    Accepted: 10-Jul-2008    Published: 31-Oct-2008

PDF version


* Abstract

This paper studies the problem of public opinion formation and concentrates on the interplays among three factors: individual attributes, environmental influences and information flow. We present a simple model to analyze the dynamics of four types of networks. Our simulations suggest that regular communities establish not only local consensus, but also global diversity in public opinions. However, when small world networks, random networks, or scale-free networks model social relationships, the results are sensitive to the elasticity coefficient of environmental influences and the average connectivity of the type of network. For example, a community with a higher average connectivity has a higher probability of consensus. Yet, it is misleading to predict results merely based on the characteristic path length of networks. In the process of changing environmental influences and average connectivity, sensitive areas are discovered in the system. By sensitive areas we mean that interior randomness emerges and we cannot predict unequivocally how many opinions will remain upon reaching equilibrium. We also investigate the role of authoritative individuals in information control. While enhancing average connectivity facilitates the diffusion of the authoritative opinion, it makes individuals subject to disturbance from non-authorities as well. Thus, a moderate average connectivity may be preferable because then the public will most likely form an opinion that is parallel with the authoritative one. In a community with a scale-free structure, the influence of authoritative individuals keeps constant with the change of the average connectivity. Provided that the influence of individuals is proportional to the number of their acquaintances, the smallest percentage of authorities is required for a controlled consensus in a scale free network. This study shows that the dynamics of public opinion varies from community to community due to the different degree of impressionability of people and the distinct social network structure of the community.

Keywords:
Public Opinion, Complex Network, Consensus, Agent-Based Model

* Introduction

1.1
In recent years, a large number of agent-based models have been built in order to explore consensus and opinion dynamics. For example, the pioneering papers of Galam and Moscovici (1991a; 1991b) proposed the first consensus models based on Ising model. Axelrod (1997) built an agent-based adaptive model to study the dissemination of culture and revealed that local convergence could generate global polarization. The Snazdj model (Stauffer 2001; Stauffer 2002a; Stauffer 2002b) and rumors model (Galam 2003) can also be cited as seminal models in this area. In addition, the research on complex networks, driven by the groundwork of Watts and Strogatz (1998) and Barabási and Albert (1999), has become a vibrant area in academia. Many physicists and social scientists apply networks theories and methodologies in a variety of social issues (e.g. Watts 2002, Jones and Handcock 2003, Stauffer and Meyer-Ortmanns 2003, Galam 2002, Amblard and Deffuant 2004, and Tassier 2004). However, there are so far few agent-based models that formulate opinion dynamics by combining theories of complex networks.

1.2
In this study we are primarily interested in how the dynamics of public opinion formation performs in the context of complex networks. For instance, our study is interested in determining whether: People choose to applaud to stand or just keep sitting at the end of a brilliant concert; senior undergraduates choose to get a job, or enroll in graduate school either at home or abroad; people do or do not jump on the bandwagon when a new fashion appears (Leibenstein 1950). Although the opinion of an individual seems to be trivial, the aggregation of them (that is, the public opinion) is indeed worth being studied because new properties at a system level arise out of the interactions at an element level (Holland 1998). We deem that figuring out the driving factors behind these decisions or choices may shed new light on understanding the mechanism of public opinion formation.

1.3
Sociologists regard the formation of public opinion as the result of social interactions and communication (Powel 1951). It is noted that public opinion formation is distinguished from collective decision making in many studies (e.g. Moscovici and Doise 1992). Therefore public opinion formation is not defined by either discussion or persuasion that attempts to achieve a consensus or the principle that the minority should subordinate to the majority. Instead, in public opinion formation, individuals' opinions only reflect the wills of themselves mainly because it is impractical for thousands of people widely spread in a vast (i.e. countrywide) area to come together to discuss specific issues. Based on this comparison, we summarize the common characteristics of public opinion formation and propose a simple model for public opinion formation without persuasion. It does not aim at an exact description of reality. Instead, by doing some crude approximations, the model focuses on highlighting essential features of an otherwise very complex phenomenon.

1.4
The rest of this paper is organized as follows. In section 2, we introduce the factors affecting public opinion formation. In section 3, we give a basic description of our model and a detailed analysis of its simulations. We offer concluding comments in Section 4.

* Factors affecting public opinions

2.1
In order to fully understand the complexity of factors that attribute to public opinion formation, we contextualize the discussion of the model by proposing a theoretical framework, in which the roles of individual attributes, environmental influences and information flow are examined. The framework serves as the underpinning of our model when constructing parameters and hypotheses.

Individual attributes

2.2
In any social system individuals are diverse and complex. We rely on Jager's (2000) definition of the micro-level driving factors of human and we assume that the following individual attributes affect the formation of individual opinions:

Environmental influences

2.3
Human existence cannot be separated from the environment where human beings live. In this study, we divide environmental influences into two levels:
  1. Macro-level environmental influences include technology, economy, demography (population), institutions and culture (Vlek 1995) and thus affect individual behaviors. Even in a setting of no direct interaction between individuals, there is a chance that the individuals face significant and perhaps even coercive social pressure to conform (Amaro de Matos 2004). A leader, a societal majority or other non-tangible factors, may influence the direction of everybody's attitude. For example, individuals may decide to buy Coca Cola rather than Pepsi Cola simply because they are big fans of one movie star who likes to drink Coca Cola.

    Global or top-down control is often used when building a multi-agents model. What we mean by top-down control (Sanderson 2000) is not to manipulate the rules of individual behaviors, but instead use global information to govern. Alfred W. Hubler (2005) demonstrated the advantage of considering both patterns of information process — bottom-up and top-down, in comprehending the emerging patterns and dynamics. Although he demonstrated his theory through a model of the competition of plant seedlings for sunlight and water, it remains applicable and relevant to how society functions.

  2. Micro-level environmental influences are defined as the interactions between neighbors or acquaintances at a local level. Neighborhood effects carry significant influences on many behavioral outcomes, such as criminal activity, drug and alcohol use, childbearing out of wedlock, schooling and church attendance (Case and Katz 1991). Local interactions models in economics highlight how agents' preferences, information, choices or outcomes are directly affected by other agents' behavior and are not, as commonly believed, mediated primarily by markets (Conley and Topa 2003).These local interplays are subject to individuals' expectations and from their long-term learning and adaptation (Holland 1996). At this point, we do not think the issue of public opinion formation falls into the field of game theory, because traditional game theory often assumes that players have knowledge of the entire environmental structure and of other players' decision making process (Sato et al. 2004).

Information flow

2.4
Flow is considered a fundamental concept in complex adaptive systems. Three types of flow are identified: material flow, energy flow and information flow. Nevertheless, not all flow presents simultaneously in a single system. For example, in Holland's echo model (1996), only material flow and information flow coexist. Since in the context of public opinion formation, few elements of material flow or energy flow are observed among individuals or between individuals and the environment, in our study, we merely take into account information flow.

2.5
In order to fully imagine information flow, it is often depicted visually through its topological properties, which ultimately helps us understand the pattern of information flow. On the largest scale, the collectivity of individuals (e.g. a community, a city or a nation) can be viewed as a giant network; within this giant network, a "link" is the acquaintanceship between two persons. In fact, research shows that the topological properties of a social network considerably affect its function and overall organization (Vazquez et al. 2004; Weisbuch et al. 2005). Small world networks can be highly clustered, like regular networks, yet they have small characteristic path lengths, like random graphs (Watts and Strogatz 1998). Scale-free networks differ from lattices by the inhomogeneity of connectivity and by their smaller diameters. In social networks, the characteristic path length refers to the total average length of shortest paths between two individuals. If the network structure of a community is parallel to a regular network, information transferring tends to be slow within the neighborhood; if it is parallel to a random network, information travels rapidly and widely; if it is analogous to a small world network or a scale free network — such as the collaboration graph of film actors (Watts and Strogatz 1998; Barabási et al. 1999), information can also diffuse rapidly, yet most information diffusion takes place within a limited neighborhood.

2.6
Furthermore, the information flow in public opinion formation should be distinguished from informational cascade that has been observed in a number of conformity models (Bikhchandani et al 1992; Kawaguchi 2004). An informational cascade occurs when it is optimal for an individual, having observed the actions of those ahead of him, to follow the behavior of the preceding individual without regard to his own information (Bikhchandani et al. 1992). The problem of utilizing informational cascade models to explain public opinion formation is three-fold. First, in public opinion formation decisions do not have to be made sequentially. Second, in public opinion formation, people do not ignore choices of those behind them. Third, people in public opinion formation can change their opinions every moment during the process.

* The model

3.1
To visualize the problem of public opinion formation in a simple manner, we develop a simple computational model. It aims, by making crude approximations, to discover certain essential aspects of opinion dynamics. Our model is based on two hypotheses:
  1. The social environment is homogeneous for everyone. In other words, each agent shares the same macro-level environment.
  2. No discussion and persuasion are considered in the process of public opinion formation. By making this hypothesis, we distinguish our model from collective decision models.

Basic descriptions

3.2
We consider a population of N (For clarity, N=900) interacting agents. Many earlier models, such as the Ising model (Galam and Moscovici 1991a; Galam and Moscovici 1991b), the Sznajd model (Sznajd-Weron and Sznajd 2000), the compromise model (Ben-Naim et al. 2003) and the constrained voter model (Vazquez et al. 2003), focus on quantifying agents' evaluations on a given issue, using either a discrete or a continuous variable. Our study is concerned with the options agents choose rather than how agents evaluate possible options. For simplicity, we concentrate on a case of three options; three is the minimum number that gives non-trivial results and yet permits us to explore the dynamics of the model. Let sj,i be a Boolean variable to denote the choice of agent j upon option i (i = 1, 2, 3). For example, s20,2 =1 means that agent No.20 is in favor of option 2, and s20,1 and s20,3 should necessarily be equal to 0.

3.3
As discussed in Section 2, individuals have different private incentives. In a very large population, it is not feasible to describe the different individual incentives. Luckily, such manipulation is also unnecessary because our model aims to examine not only the interactions between individuals and the environment, but also the influence of different social network structures on model behaviors. Undue emphasis on detailed description of the diversity of agents does not help us to meet our primary objective, to explore the mechanism of the model. In this study, the distribution of private incentives is modeled by a probability density. We define a random variable ti, ranging from 0 to 1, and ti follows uniform distribution. Vector T = (t1, t2, t3) denotes the intrinsic evaluations on each option.

3.4
Opinions of individuals in a heterogeneous society evolve under the influences of acquaintances. In previous models (e. g. Laguna et al. 2005), agents are distributed in a hierarchy of different authority levels. Here we equip each agent with a continuous variable vi, measuring the influence on other agents when its choice is i. We assume that v follows a uniform distribution in [0, 1] in small world and random networks. However, we consider two hypotheses — uniform distribution or proportional distribution with respect to the distribution of v in scale free networks. We assume the influence parameter in small world and random works follows random distribution instead of proportional to the number of acquaintances for two reasons. First, a random distribution of the influence is inherent in the generating processes of small world and random works. Unlike the preferential choices in scale-free networks, agents establish their connections in a random way, and thus agents do not consider the influence of others when establishing a connection. Second, a well-connected agent may not be the person who has great influential power. For example, film stars know and are known by a lot of people; however, their acquaintances (e.g. their fans) may not agree with the opinions of these film stars on issues like health care reform or anti-terrorism. In this case, the connectivity of an agent has little to do with his or her influential power. In contrast, scale free networks distinguish themselves from other types of networks by the key feature of preferential attachment (Barabási and Albert 1999). Preferential attachment addresses the point that new vertices attach preferably to those who are already well connected. In reality, people are willing to be known by influential persons. The connections are established "purposely" rather than "randomly". As a result, those influential individuals are by and large also well-connected. Therefore, we model another scenario besides uniform distribution in which the influence parameter in scale free networks is proportional to the number of acquaintances.

3.5
At the beginning of the simulation, agents initialize their choices based on the evaluation vector T. In other words, each agent goes for the option upon which he/she places the highest evaluation. In the following steps, agents interact with each other by exchanging information. Each agent receives decision signals from its acquaintances, and then calculates the weighted average value, which is used to formulate the influence of the environment. Let vector H = (h1, h2, h3) denote the environment influence of every opinion. The mathematical expression of h is:

Equation (1)

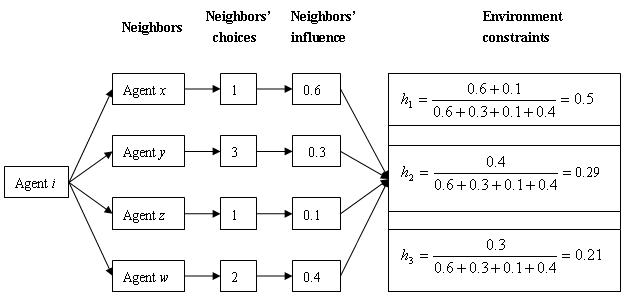
where agent j connects with agent i. Figure 1 presents an example to show how to compute the environment influence.

Figure
Figure 1. The process of calculating the environment influence

3.6
Agents balance their desire to provide an honest signal of their intrinsic preferences against the pressure to conform, and then get the total utility function, U. U is the conclusive variable for agents to switch their choices within each simulation step. The expression of U is given by Cobb-Douglas function (Cobb and Douglas 1928):

Equation (2)

The indices β and 1-β are elasticity coefficients of environment influence and intrinsic factors, respectively.

3.7
To examine the dynamics under a variety of information diffusion structures, we consider four types of complex networks: regular, small world, random and scale-free. We use the method of Watts and Strogatz (1998) as a reference and we treat the collection of agents as a ring of n vertices, each connecting with k nearest neighbors, and then a regular network has been constructed. We choose a vertex and the edge that connects it to its nearest neighbors in a clockwise sense. With probability p (p=0.3), we reconnect this edge to a vertex chosen uniformly at random over the entire ring, with duplicate edges forbidden; we continue this process, circulating around the ring and proceeding outward to more distant neighbors after each lap, until each edge in the original network has been considered once. We do this until we get a small world graph. Increasing p until p=1, all edges are rewired randomly and then the graph itself becomes a random graph. As for the construction of scale-free networks (Aleksiejuk et al. 2002), we start with a full-connected network with m (m < 30) vertices. Since m is far smaller than N, how the m vertices connect does not affect the topology of the whole network. Then, additional N-m nodes are added as follows: each new node is linked to k existing nodes, with a probability proportional to the number of connections that these existing nodes have. When the new link happens, it increases the number of connections by one for both nodes. The algorithms of network construction can be found in Appendix 1.

Results

3.8
Our model aims primarily at shedding light on two questions. First, what equilibrium characteristics does the system demonstrate as the network structure changes? Second, to what degree will the model dynamics be altered once we add some macro control to the model?

3.9
In the first step (t=0), each agent initializes their opinions based upon interior evaluations. The evaluation is generated by a random number [0, 1]. They compare evaluations among three options and then exercise choices. Agents with the same choice form a group. The collectivity of agents who are in favor of one option is called the install base (Gandal 2002) of this option. To minimize the disturbance of the install base on system dynamics, each option has roughly the same number of supporters in the initial state. We suppose that the influential factors of an agent follows uniform distribution in four types of networks as mentioned above. To minimize the disturbance from the initial states of agents, we run models using the same data in terms of influential factors and interior evaluations. Starting at the initial configuration, the model proceeds in a way as shown in Appendix 2.

3.10
Computational modeling allows great flexibility in implementation of timing and process. To demonstrate how timing can be implemented, we consider two updating procedures: random and sequential. By sequential we mean agents update opinions in a serial order from No. 1 to No. 900. At first, we take it for granted that sequential updating is more likely leading to a consensus than random updating. By simulation, however, we find that in both cases, this conjecture cannot be validated for the differences of model dynamics are not sufficiently significant. The simulations under a regular network can be seen in figure 2. We varied network types and observed similar test results for 30 runs each case. Even in the case of sequential updating, agents consider both anterior and posterior information in terms of decision signals, which is the critical difference from the information cascade model (Bikhchandani et al. 1992).

Figure
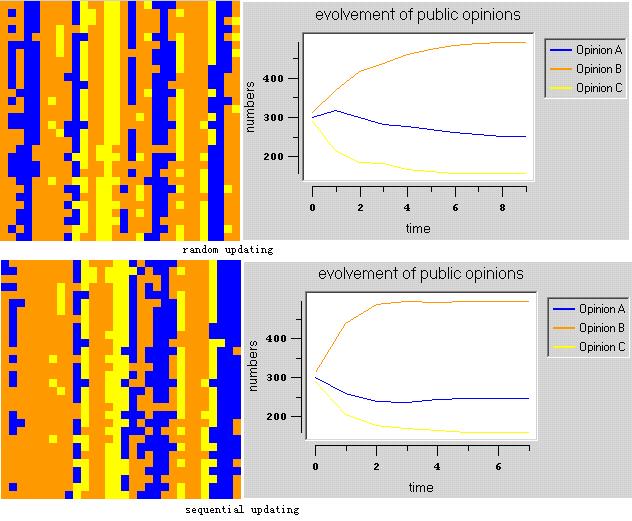
Figure 2. Comparison of two information updating mechanisms. Here, both simulations are run under the situation that the average connectivity is 30 and β is 0.5 with a regular graph. The left two graphs are lattices in which the color of each cell represents the opinion of one agent. The right two graphs are the evolving curves of public opinion.

3.11
In the rest of this section, all simulations are done in a way that agents update opinion states randomly. In regular graphs, we find that no matter how β changes, there is always opinion fragmentation. Even if we increase the value of β up to 1 — that is, the behavior of agents is thoroughly subject to the environment influence, global consensus still fails to appear. We also remodeled the standing ovation problem (Miller and Page 2004) using the Swarm platform, and got similar results: there is no global consensus in auditorium. This is because regular graphs have long characteristic path lengths, which narrow down the scope of information diffusion.

3.12
Nevertheless, simulations associated with the three other types of networks report different results. We adjusted the value of β as well as the average connectivity (AC) of the graph, and ran the model 30 times for each combination of β and AC to compare outcomes under different scenarios (see Table 1, 2 and 3). CPL in the tables denotes the average of characteristic path length for 30 runs. The statistical data denote the average numbers of opinions (ANO) in stable states. The data within parentheses are the standard deviations of ANOs whereas no parenthesis means zero standard deviation. As shown in each table, a higher AC follows a smaller CPL, which promises a higher efficiency of information diffusion. Notice that under some combinations of AC and β, ANO are not integers, indicating multiple outcomes for runs. For instance, when AC is 30 and β is 0.7 within a small world graph, the number of opinions in a stable state can be equal to either one, two or three. Recall that the initial states of all agents have been predetermined for each run, so this uncertainty can be traceable to nonlinear factors endogenous in a deterministic system. In other words, the random process of network construction, ungoverned by exterior conditions, attributes to the multiform of results. For the combinations in which the standard deviations are not equal to zero, an unequivocal prediction of the number of opinions seems to be impossible. We refer to these combinations as sensitive areas.

Table 1: The average number of opinions in small world networks

SW Graph
(p=0.3)
β
ACCPL0.10.30.50.70.9
67.46(1.30)33333
104.27(0.22)33333
302.60(0.04)332.96(0.20)2.04(0.81)1.71(0.62)
502.20(0.05)332.23(0.43)1.46(0.51)1


Table 2: The average number of opinions in random networks

Random Graphβ
ACCPL0.10.30.50.70.9
66.7(1.32)33333
104.12(0.52)3332.37(0.74)1.33(0.55)
302.32(0.37)332.39(0.50)11
502.0(0.14)332.13(0.34)11


Table 3: The average number of opinions in scale-free networks

Scale-free Graphβ
ACCPL0.10.30.50.70.9
5.993.85(0.28)33331.63(0.97)
9.993.11(0.17)3331.25(0.53)1
29.972.30(0. 02)332.18(0.50)11
49.942.04(0.01)332.08(0.27)11

3.13
Two salient features are found in these tables: (1) as AC and β increase, ANO decreases from 3 to 1. This suggests that systems with higher AC and β are more likely to conform and reach a global consensus (It is worth to be noted that Amblard and Deffuant (2004) find the same phase transition with a different model and they further suggest that the consensus results more from the redundancy of links than from the average shortest path. However, the latter can also be considered as an indirect indicator of the redundancy). (2) Sensitive areas exist in all three networks. The difference among the three tables lies in that the average number of opinions in table 1 is equal to or larger than that in Table 2, and both of them are equal to or larger than that in table 3.Yet, the difference is not remarkable. It may be explained by the fact that one topological character may be shared by a small world, random and scale-free networks. All three networks have similar characteristic path lengths given the same average connectivity. However, a relatively small CPL does not necessarily follow a small ANO. Figure 3 shows us an example to the point in a random graph (β=0.7). When CPL equals to 2.65 with connection being 6, the result of ANO is 3; in contrast, when CPL equals to 2.65 with connection being 30, the result of ANO is 1. Based on this observation, we argue that it is sometimes problematic to use the characteristic path length as the single parameter to predict the number of opinions when reaching equilibrium.

Figure
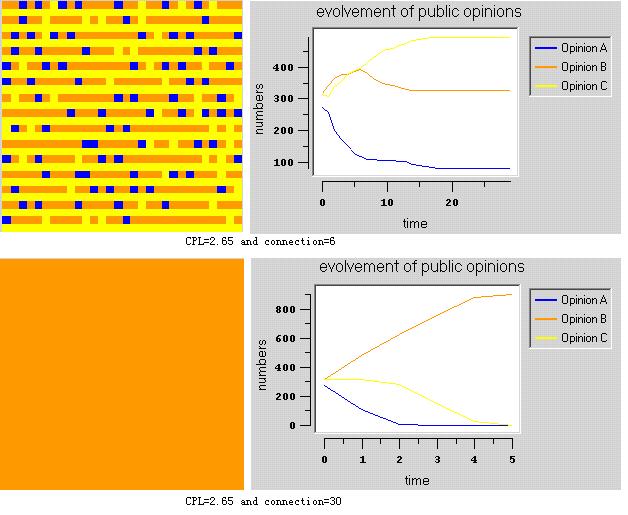
Figure 3. Comparison of equilibrium between two connections with the same characteristic path length in a random network

3.14
The control, handling, and possible manipulation of information are now major issues in social organizations including economy, politics, defense, and even in fashion and personal affairs (Galam 2003). Hence, our model considers the role of authoritative individuals in the general public. We define authoritative individuals as agents with influential factors larger than a given threshold (for example, vi > 0.85 in this model). Our purpose is to examine on what condition agents follow the opinions of authorities and which type of network facilitates an expected consensus most effectively. We designed the experiment as follows: based on the same initial state as above simulations (here β = 0.7), we fix the opinions of agents with the highest influential factors as option A (blue-colored in Figure 2 and 3). Notice that even by doing this, option A still has an disadvantage in terms of the number of its supporters, compared with option B and C. Therefore, it is reasonable to claim that the positive network effect (Katz and Shapiro 1994) of an installed base doesn't account for the success of option A provided that A dominates the public opinions at the end. Suppose that the influence of agents follows uniform distribution, we write down the minimum percentage of authorities (MPA, also an average for 30 runs) required to reach an equilibrium where all agents go for opinion A (Table 4). That is, the opinion of the general public is consistent with that of the authorities and thereby the result turns out to be exactly what has been expected.

Table 4: Minimum percentage of authorities for a controlled consensus

AC1020304050
Nets
Small world14%3%2.6%3.3%3.6%
Random6%2.6%2.4%2.7%3.1%
Scale-free6%
(1%)
6%
(1%)
6%
(1%)
6%
(1%)
6%
(1%)

3.15
By comparing MPA of small world network and random network in table 4, we uncover some interesting results: (1) MPA in random networks is smaller than the counterpart in small world networks. That is , in order to reach a controlled consensus of opinion A, a social network with a random structure needs a relatively low proportion of authoritative individuals. On the other hand, in a small world structure agents in random networks can effectively exploit their authorities to impose their opinions on others, regardless of the actual value of their opinions. (2) As AC increases from 10 to 50, MPA in small world and random networks descends notably at first. After reaching a lowest point, however, AC goes up slowly. A possible explanation of this tendency might be that a relatively higher AC facilitates the diffusion of authoritative opinions. Nevertheless, when agents have too many connections with other ones, they are overwhelmed with information from both authoritative and non-authoritative individuals. As a consequence, the role of authoritative opinions is compromised due to the disturbance from non-authorities. This situation calls for a higher MPA for the purpose of generating the expected equilibrium. We have unfolded here the tendencies of the dynamics of public opinion, and not an exact quantitative determination of any data. In scale-free networks, we find that MPA refuses to fluctuate with AC. Because the probability of finding a highly connected vertex decreases exponentially with its connectivities (Barabási and Albert 1999), most authoritative agents by random selection are not in the position of hub nodes (hub nodes have the highest connectivity). Low connectivity of authorities frustrates the diffusion of their opinion, and hence, a higher MPA is required for a global consensus of opinion A in scale-free networks. Besides random distribution, we also run the simulations under the hypothesis that the influential factor of an agent in scale-free networks is proportional to its connectivity. The results of MPA are shown in the parentheses of table 2. Under this assumption, agents with the highest influential factors are exactly those with the highest connections. The opinion of authorities can be diffused to the largest extent. Consequently, a quite small percentage (1%) of authorities can sway the systemic equilibrium.

* Conclusions

4.1
In this study, we summarize three factors affecting the formation of public opinion. They are individual attributes, environmental influences and information flows. We present an agent-based model where conforming behavior may lead to homogeneity or segregation into distinct groups. By exploring the dynamic characteristics of systemic equilibrium with different elasticity coefficients of the environmental influence, mechanisms of information updating as well as network topologies, we gain some important insights. In the regular geometry of social relationships, the system manifests itself by local consensus and global diversity. When the social relationship is modeled by small world networks, random networks or scale-free networks, however, the result is sensitive to elasticity coefficients of the environmental influence and the average connectivity of networks. Ultimately, the higher the average connectivity of the network is, the fewer opinions remain at the end. During the simulations for certain average connectivity, sensitive areas are discovered unexpectedly. The system in sensitive areas presents determinate randomness so that the number of opinions when reaching equilibrium remains uncertain. We also find that it might be misleading to predict the number of surviving opinions merely based on the characteristic path length of the network, since a short characteristic path length may possibly accompany with a low average connectivity, which determines the systemic dynamics more directly and essentially.

4.2
We examine the role of information control, and find that few individuals with the highest influence, namely authorities in this paper, can sway the balance of outcomes. In a social structure of small world networks or random networks, increasing the average connectivity facilitates the diffusion of authorities' opinion. However, in the process of decision-making, people will be subject to disturbances from non-authorities. While a moderate average connectivity may be preferable for the public to form a specific opinion in small world or random networks, the role of authorities in a community with a scale-free structure remains immune to the change of the average connectivity. Provided that the influence of individuals is proportional to the number of their acquaintances in scale-free social networks, the smallest proportion of authorities is required to reach a controlled consensus. Our findings address the extent to which a community would reach a consensus on certain issues. The findings suggest that different communities exhibit different dynamics that is attributable to the different degree of impressionability of people and the distinct structure of the social network of community.

4.3
To conclude, we have presented a simple model of opinion dynamics which is able to reproduce some of the complexities the social reality. The model may be generalized to a large spectrum of social, economical and political phenomena that involve conformity effects. But more thoughts and studies should be performed before getting to a clear proposal scheme. One limitation of this study is that we don't address the question how much the results are sensitive to the initial even distribution of intrinsic preference types. The preliminary results reported here suggest many avenues for future research. For example, in real life not every person is open-minded and ready to change opinions. Therefore, it would be interesting to introduce stubborn agents into the model. In addition, we can also take into account the scenario in which mutually connected agents share similar preference and form groups or strata.

* Appendix 1: the algorithms of network construction

Small world network:

Define a 2-D array, crunode[][], as the adjacent matrix of the network;
Initialize crunode[][] by the regular network;
For each vertex i
	For each vertex j connected with i
		Generate a random number, p, in [0, 1];
		If p is smaller than the probability of rewiring, then
			Break the link between i and j;
			Select a vertex randomly and connect it with i;
		End_if
	End_for
End_for

Random network:

Initialize crunode[][] by the regular network;
For each vertex i
	For each vertex j connected with i
		Broke the link between i and j;
		Select a vertex randomly and connect it with i;
	End_for
End_for

Scale-free network:

Let d be the number of links that new vertexes are to be added in the net.
Let k be the number of links that one vertex connects with others. 
Construct a regular net with 2*d vertexes.
For the vertex i 2*d : size
	Do
		Select an existing vertex from 0 to i-1 randomly, marked by v;
		If v has not been linked with i, then
			Calculate the probability that i connects with v 
Equation
			If p(k) is larger than the generated random number in [0,1], then
	 			Connect i and v;
				Increase ki and kv by one.
			End_if
		End_if
	While ki is less than d
End_for

* Appendix 2: the process of updating

For each agent i:
	Let utility[] store the utility of agents toward different choices;
	Let propensity[] store interior evaluation.
	Let influence[] store the influence from agents connecting with i;
	Let b be the psychological weight for balancing interior preference and outer influences.
	For each agent j connecting with i:
		For each decision modality k:
			If the decision of agent j is k, then increase the value of influence[k] by agent j's weight;
		End_for
	End_for
	For each decision modality k:
		utility[k] = (influence[])b (propensity[])1-b;
	End_for
	Update the state by comparing utility[k].
End_for

* References

ALEKSIEJUK A, Holyst, Janusz A and Stauffer D (2002). Ferromagnetic phase transition in Barabási-Albert networks. Physica A, 310: 260-266

AMARO de Matos J (2004). Information Flow, Social Interactions and the Fluctuations of Prices in Financial Markets. Econometric Society 2004 Latin American Meetings

AMBLARD F and Deffuant G (2004). The Role of Network Topology on Extremism Propagation with the Relative Agreement Opinion Dynamics. Physica A: Statistical Mechanics and its Applications, 343:725-738

AXELROD R (1997). The Dissemination of Culture: A Model with Local Convergence and Global Polarization. Journal of Conflict Resolution, 41( 2): 203-226

BARABÁSI A L and Albert R A (1999). Emergence of Scaling in Random Networks. Science, 286: 509-512

BARABÁSI A L, Albert R and Jeong H (1999). Mean-Field Theory for Scale-Free Random Networks. Physica A, 272: 173-187

BECHARA A (2004). The role of emotion in decision-making: Evidence from neurological patients with orbitofrontal damage. Brain and Cognition, 55: 30-40

BEN-NAIM E, Krapivsky P L and Redner S (2003). Bifurcations and Patterns in Compromise Processes. Physica D, 183: 190-204

BIKHCHANDANI S, Hirshleifer D and Welch I (1992). A Theory of Fads, Fashion, Custom, and Cultural Change as Informational Cascades. Journal of Political Economy, 100(5): 992-1026

BOSMAN R, Hennig-Schmidt H and Frans van Winden (2006). Exploring Group Decision Making in a Power-to-Take Experiment. Experimental Economics, 9: 35-51

CASE A C and Katz L F (1991). The Company You Keep: The Effects of Family and Neighborhood on Disadvantaged Youths. National Bureau of Economic Research Cambridge, Mass., USA

COBB C W and Douglas P H (1928). A Theory of Production. American Economic Review, 18(1):139-165

CONLEY T G, Topa G (2003). Identification of Local Interaction Models with Imperfect Location Data. Journal of Applied Econometrics, 18(5): 605-618

GALAM and Moscovici S (1991a). Towards a Theory of Collective Phenomena: Consensus and Attitude Changes in Groups. European Journal of Social Psychology, 21: 49-74

GALAM S and Moscovici S (1991b). Compromise versus Polarization in Group Decision Making. Defense Decision making, Russ. Psychol. J, 13: 93-103

GALAM S (2002). Minority opinion spreading in random geometry. Eur. Phys. J., B 25, 403-406

GALAM S (2003). Modelling rumors: the no plane Pentagon French hoax case. Physica A, 320: 571-580

GANDAL N (2002). Compatibility, Standardization, and Network Effects: Some Policy Implications. Oxford Review of Economic Policy, 18(1): 80-91

HOLLAND J H (1996). Hidden Order. Addison-Wesley Publishing Company

HOLLAND J H (1998). Emergence: From Chaos to Order. Oxford University Press

HUBLER A W (2005). Predicting Complex Systems with a Holistic Approach. Complexity, 10(3): 11-16

JAGER W (2000). Modelling Consumer Behaviour (dissertation), Veenendaal, the Netherlands: Universal Press

JONES J H and Handcock M S (2003). Sexual Contacts and Epidemic Thresholds. Nature, 423(5): 605-606

KAWAGUCHI D (2004). Peer effects on substance use among American teenagers. Journal of Population Economics, 17: 351-367

KATZ M L and Shapiro C (1994). Systems Competition and Network Effects. Journal of Economic Perspectives, 8(2): 93-115

KOOLE S L, Jager W, Van den Berg AE, Vlek C A J and Hofstee W K B (2001). On the Social Nature of Personality: The Influence of Self- and Peer-rated Extraversion and Agreeableness in a Social Dilemma. Personality and Social Psychology Bulletin

LAGUNA M F, Gusman S R, Abramson G, Goncalves S and Iglesias J R (2005). The Dynamics of Opinion in Hierarchical Organizations. Physica A, 351: 580-592

LEIBENSTEIN H (1950). Bandwagon, Snob, and Veblen Effects in the Theory of Consumers?Demand. Quarterly Journal of Economics, 64: 183-207

MAX-NEEF M (1992). Development and human needs. In: P. Ekins and M. Max-Neef (Eds.): Real-life economics: Understanding wealth creation. London, New York: Routledge

MCCLINTOCK C G (1978). Social values: Their definition, measurement and development. Journal of Research and Development in Education, 12: 121-137

MESSICK D M and McClintock C G (1968). Motivational basis of choice in experimental games. Journal of Experimental Social Psychology, 4: 1-25

MILLER J H and Page S E (2004). The Standing Ovation Problem. Complexity, 9(5): 8-16

MOSCOVICI S and Doise W (1992). Dissensions & consensus. Paris : PUF

POWEL N T (1951). Anatomy of Public Opinion. Prentice-Hall, New York

SATO Y, Akiyama E and Crutchfield J P (2004). Stability and Diversity in Collective Adaptation. Santa Fe Institute Working Paper, http://arxiv.org/abs/nlin.AO/0408039

SANDERSON I (2000). Evaluation in Complex Policy Systems. Evaluation, 6(4): 433-454

STAUFFER D (2001). The Sznajd model of consensus building with limited persuasion. http://arxiv.org/abs/cond-mat/0111419 v1

STAUFFER D (2002a). Better be third then second in a search for a majority opinion. http://arxiv.org/abs/cond-mat/0202357 v1

STAUFFER D (2002b). Frustration from Simultaneous Updating in Sznajd Consensus Model. http://arxiv.org/abs/cond-mat/0207598 v1

STAUFFER D and Meyer-Ortmanns H (2003). Simulation of Consensus Model of Deffuant et al on a Barab´asi-Albert Network. http://arxiv.org/abs/cond-mat/0308231 v2

SZNAJD-WERON K and Sznajd J (2000). Opinion evolution in closed community. Int. J. Mod. Phys. C, 11(6)

TASSIER T (2004). A Model of Fads, Fashions, and Group Formation. Complexity, 9(5): 51-61

VAZQUEZ A, Dobrin R, Sergi D, Eckmann J P, Oltvai Z N and Barabási A L (2004). The Topological Relationship between the Large-scale Attributes and Local Interaction Patterns of Complex Networks. Proceedings of the National Academy of Sciences, 101(52): 17940-17945

VAZQUEZ F, Krapivsky P L and Redner S (2003). Constrained opinion dynamics: freezing and slow evolution. J. Phys. A, 36, L61

VLEK C A J (1995). Technical versus socio-behavioral solutions to environmental problems: psychology's unexploited potential. Extended version of an invited lecture for the Environmental Psychology Division of the American Psychological Association, presented in New York

WATTS D J and Strogatz S H (1998). Collective Dynamics of Small-world Networks. Nature, 393: 440-442

WATTS D J, Dodds P S and Newman M E J (2002). Identity and Search in Social Networks. Science, 296(17): 1302-1305

WEISBUCH G, Deffuant G and Amblard F (2005). persuasion dynamics. Physica A, 353: 555-575

----

ButtonReturn to Contents of this issue

© Copyright Journal of Artificial Societies and Social Simulation, [2008]