
Keith Christensen and Yuya Sasaki (2008)
Agent-Based Emergency Evacuation Simulation with Individuals with Disabilities in the Population
Journal of Artificial Societies and Social Simulation
vol. 11, no. 3 9
<https://www.jasss.org/11/3/9.html>
For information about citing this article, click here
Received: 12-Jan-2007 Accepted: 16-Jun-2008 Published: 30-Jun-2008

 Abstract
| Table 1: Prevalence of disability among people ages 21-64 years (RRTCDDS 2005). Respondents may have more than one type of disability. Therefore, each type summed exceeds the total disability prevalence value. | ||
| Group | % of Population | Prevalence |
| Total Individuals with a Disability | 12.6 | 21,455,000 |
| Physical Disability | 7.8 | 13,313,000 |
| Mental Disability | 4.4 | 7,526,000 |
| Go-Outside-Home Disability | 3.1 | 5,336,000 |
| Sensory Disability | 3.0 | 5,074,000 |
| Self-Care Disability | 2.2 | 3,712,000 |
|
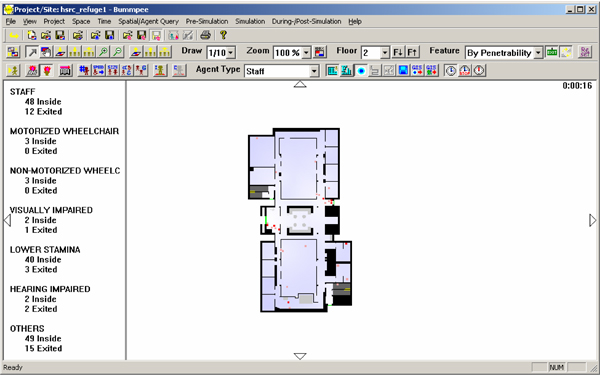
| Figure 1. A typical interface screen of the BUMMPEE model. |
|
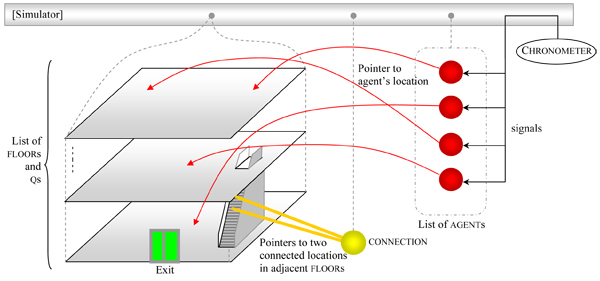
| Figure 2. Class interrelation |
v = my current floor → get the speed of type a at (x, y)
if (v _ Δ T ≥ U [0,1] ) then
I am eligible to move
if ( my current floor → can agent of type a occupy ( x, y) ) then
I move to ( x, y)
(x0, y0) = my previous location
(x1, y1) = my current location
s = the strategy taken to move myself from (x0, y0) to (x1, y1)
a = my agent type m = number of signals that I heard while being at (x0, y0)
|
(1) |
|
|
(2) |
|
|
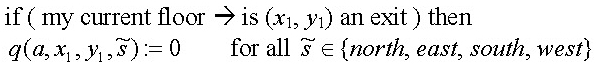
(3) |
|
|
(4) |
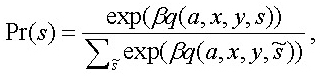
with probability 1–ε, and a uniform random strategy otherwise. The multinomial logit decision method lets an agent of type a at location (x, y) take one of the strategies s* ∈ {north, east, south, west} with the probability of each strategy s ∈ {north, east, south, west} weighted by Gibbs distribution as
|
(5) |
where β < 0 is a predetermined parameter (a scale parameter). Note that this parameter is negative since smaller Q-values are more preferred than larger ones. Epsilon-greedy algorithm has relative computational ease, and the results shown in the subsequent section are based on this algorithm.
| Table 2: Demographic Profile for Physical and Simulated Evacuation Populations. (U.S. Census Bureau 2006). | |||
| Type of Disability | HSRC Population | Simulated Population | U.S. Census Pop. Figures* |
| Visual Impairment | 1 | 1 | 1 |
| Physical Impairment | 1 | 1 | 4 |
| Hearing Impairment | 0 | 0 | 1 |
| Lower Stamina | 4 | 4 | 4 |
| No Identified Disability | 65 | 65 | 61 |
| Totals | 71 occupants | 71 occupants | 71 occupants |
|
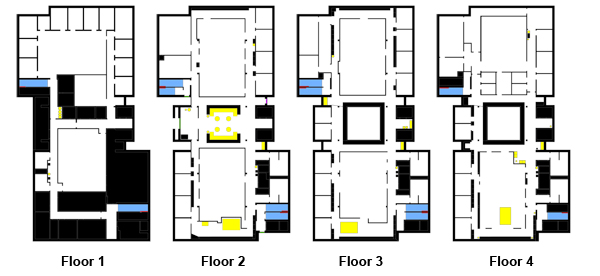
| Figure 3. Layout of the Human Services Research Center (HSRC). Exits on Floor 2 are shown in green and red, stairways are shown in blue. North is up in the illustration. |
| Table 4: Population Criteria Values | ||||||||
| Individual with… | Max Speed on Level Plane (m/s) | Max Speed on Stairs (m/s) | Max Speed negotiating an obstacle (m/s) | Size in plan view (ft × ft) | ||||
| a motorized wheelchair | .69 1 | 0 | 0 | 2 × 2 2 | ||||
| a manual wheelchair | .89 1 | 0 | 0 | 2 × 2 2 | ||||
| a hearing impairment 5 | 1.25 | .70 | .70 | 1.5 × 1.5 | ||||
| a visual impairment | .86 3 | .61 3 | 0 | 1.5 × 1.5 | ||||
| less environment familiarity (mental disability) 4 | 1.25 | .70 | .70 | 1.5 × 1.5 | ||||
| a stamina disability | .78 1 | .36 1 | 0 | 1.5 × 1.5 | ||||
| -out a disability | 1.25 1 | .70 1 | .70 | 1.5 × 1.5 | ||||
| 1 Boyce, Shields, and Silcock 1999. 2 Based on a review of current wheelchair specifications. 3 Wright, Cook, and Webber 1999. 4 For the type of disability, the operative population criterion value is a less defined Q value and/or more random decision making. 5 Hearing impairments are assumed to not have a significant effect on evacuation speeds. | ||||||||
| Table 5: September 14, 2005 HSRC Physical Evacuation Observations | ||
| Observation Location | Number of Evacuees Through Location | Time at Final Evacuee (seconds) |
| Southeast Exit | 11 | 60 |
| East Exit | 20 | 155 |
| West Exit (Accessible) | 40 | 150 |
| Areas of Evac. Assist. | 0 | |
| Totals | 71 occupants | 155 seconds |
| Table 6: HSRC Evacuation Simulation Results, mean value reported. *Determined from 245 values, 5 values more than 3 standard deviations from the mean are excluded. | ||
| Observation Location | Number of Evacuees Through Location | Time at Final Evacuee (seconds) |
| Southeast Exit | 21 (21.072) | |
| East Exit | 7 (7.008) | |
| West Exit (Accessible) | 42 (42.032) | 122 (121.788) |
| Areas of Evac. Assist. | 1 (.063) | |
| Totals | 71 occupants | 122 seconds* |
| Table 7: Comparison of Physical and Simulated HSRC Evacuations | ||
| Measure | Physical Evacuation | Simulated Evacuation |
| # of individuals using Southeast Exit | 11 | 21 |
| # of individuals using East Exit | 20 | 7 |
| # of individuals using West Exit (Accessible) | 40 | 42 |
| Time at Final Evacuee | 155 seconds | 122 seconds |
BOYCE K E, Shields T J, and Silcock G W H (1999a) Toward the characterization of building occupancies for fire safety engineering: Prevalence, type, and mobility of disabled people. Fire Technology, 35(1), 35-50.
CENSUS 2000 SUMMARY FILE 4—United States / prepared by the U.S. Census Bureau. (2003). http://www.census.gov/prod/cen2000/doc/sf4.pdf
CHRISTENSEN K M, Collins S D, Holt J M, and Phillips C N (2006) The Relationship Between the Design of the Built Environment and the Ability to Egress of Individuals with Disabilities. Review of Disability Studies, 2(3); 24-34.
CHRISTENSEN K M, Blair M E, Holt J M (2007) The Built Environment, Evacuations, and Individuals with Disabilities: a guiding framework for disaster policy and preparation. Journal of Disability Policy Studies, 17(4); 249-254.
DEPARTMENT OF EDUCATION (2006) Notice of Proposed Priorities for Disability and Rehabilitation Research Projects and Rehabilitation Engineering Research Centers. Federal Register, 71(181): 54869-54879.
GALEA E R (Eds.) (2003) Proceedings of the 2nd International Conference on Pedestrian and Evacuation Dynamics. Greenwich, UK. 20-22 August 2003.
GERSHON R (2006, September) World Trade Center Evacuation Study. Presentation at the WTC Evacuation Study Scientific Meeting; Translating Research into Practice.
GIMBLETT R H (2002) Integrating geographic information systems and agent-based modeling techniques: for simulation social and ecological processes. New York, NY, Oxford University Press.
HELBING D, Buzna L, Johansson A, and Werner T (2005) Self-organized pedestrian crowd dynamics: Experiments, simulations, and design solutions. Transportation Science, 39(1); 1-24.
PROULX G and Fahy R F (2001) Toward creating a database on delay times to start evacuation and walking speeds for use in evacuation modeling. 2nd International Symposium on Human Behavior in Fire; 175-183.
PURSER D A and Bensilum M (2001) Quantification of behaviour for engineering design standards and escape time calculations. Safety Science, 38(2), 157-182.
REHABILITATION RESEARCH AND TRAINING CENTER ON DISABILITY DEMOGRAPHICS AND STATISTICS (2005) 2005 Disability Status Reports. Ithaca, NY: Cornell University.
SASAKI Y, Flann N S, and Box P W (2006) "The multi-agent games by reinforcement learning applied to online optimization of traffic policy". In Chen et al, (Eds.) Computational economics: a perspective from computational intelligence, Hershey, PA, Idea Group.
SUTTON R S and Barto A G (1999) Reinforcement learning: an introduction. Cambridge, MA, MIT Press.
U.S. CENSUS BUREAU (08-Nov-2006). State and County Quick Facts. Data derived from Population Estimates, 2000. Washington, D.C.: U.S. Department of Commerce.
U.S. FIRE ADMINISTRATION (September 1999) Removing the Barriers; A Fire Safety Factsheet for People with Disabilities and their Caregivers. Emmetsburg, MD: Office of Fire Management Programs.
WATKINS C J C H (1989) Learning from delayed rewards. Ph.D. thesis, Cambridge University.
WATKINS C J C H and Dayan P (1992) Q-learning. Machine Learning, 8, 279-292.
WRIGHT M S, Cook G K, and Webber G M B (1999) Emergency lighting and wayfinding provision systems for visually impaired people: Phase I of a study. Lighting Research Technology, 31(2), 35-42.
 Return to Contents of this issue
© Copyright Journal of Artificial Societies and Social Simulation, [2008]