
Sylvie Huet and Guillaume Deffuant (2008)
Differential Equation Models Derived from an Individual-Based Model Can Help to Understand Emergent Effects
Journal of Artificial Societies and Social Simulation
vol. 11, no. 2 10
<https://www.jasss.org/11/2/10.html>
For information about citing this article, click here
Received: 04-Aug-2007 Accepted: 15-Mar-2008 Published: 31-Mar-2008

 Abstract
|
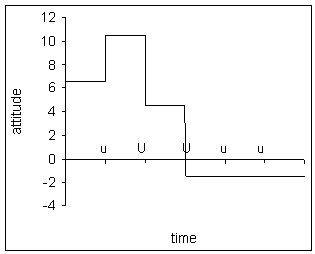
| Figure 1. Examples of temporal evolution of the attitude of an individual with g = 6.5. On the left, the individual receives the features in order u, U, U, u, u. Its final attitude is negative |
|
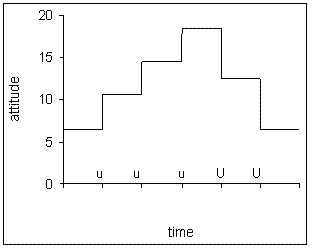
| Figure 2. Trajectory for order of exposure u, u, u, U, U, and the final attitude is positive |
|
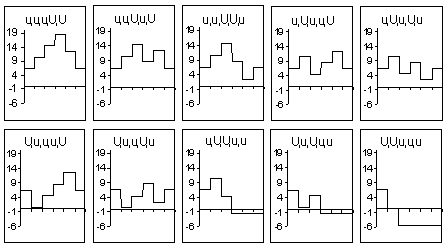
| Figure 3. The 10 possible individual trajectories, for case g = 6.5, 5 features composed of 2 U and 3 u with U = -6 and u = +4. Three trajectories over ten lead to a final negative attitude |
|
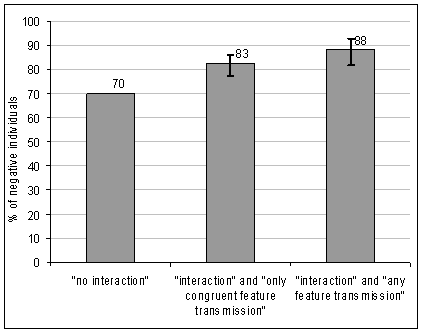
| Figure 4. Final percentage of negative individuals, averaging on 100 replicas, for g = 2.5 for three various dynamics: isolated individuals; interacting individuals transmitting only congruent features and interacting individuals transmitting any feature |
| Table 1: Final sign of the global attitude for the ten different trajectories and all different values of g | |||||||
| Exposure order |
g < 0 | 0 ≤ g < 0.5u | 0.5u ≤ g < u | u ≤ g < 1.5u | 1.5u ≤ g < 2u | 2u ≤ g < 3u | g ≥ 3 u |
| UUuuu | - | - | - | - | - | - | + |
| UuUuu | - | - | - | - | - | + | + |
| UuuUu | - | - | - | - | + | + | + |
| UuuuU | - | - | - | - | + | + | + |
| uUUuu | - | - | - | - | - | + | + |
| uUuUu | - | - | - | + | + | + | + |
| uUuuU | - | - | + | + | + | + | + |
| uuUUu | - | - | - | + | + | + | + |
| uuUuU | - | + | + | + | + | + | + |
| uuuUU | - | + | + | + | + | + | + |
|
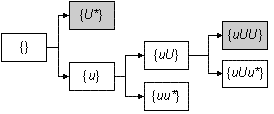
| Figure 5. The graph of transitions between the groups for u ≤ g < 1.5 u, defined by the set of retained features. The groups with a negative attitude are in grey |
| Table 2: communicated features for each group in the case u ≤ g < 1.5 u or U | |||||||
| Group | Media | {U*} | {u} | {Uu} | {uu*} | {uUU} | {uUu*} |
| Communicated features | U, u | U | u | U | u | U | U |

|
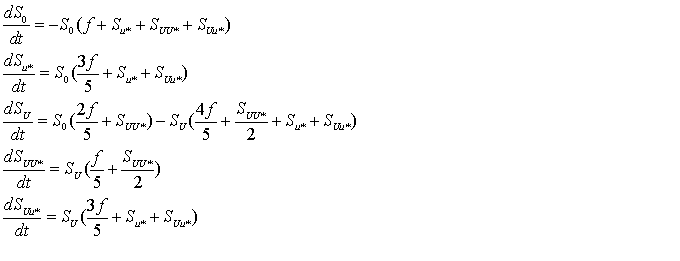
(1) |
with:
S0: proportion of individuals with a void list of retained features,
Su: proportion of individuals with a list of retained features containing only u,
S U*: proportion of individuals following all trajectories beginning with U,
SuU: proportion of individuals with a list of retained features containing only u at first and U at second
S uu*: proportion of individuals following all trajectories beginning with uu.
SuUU: proportion of individuals following all trajectories beginning with uUU.
S uUu*: proportion of individuals following all trajectories beginning with uUu.
f: frequency of media feature communication.
We compute finally the evolution of groups at the end by calculating, for each group SG with G ∈ {0, u , U*, uU, uu*,UU, uUu*}:
|
|
(3) |
|
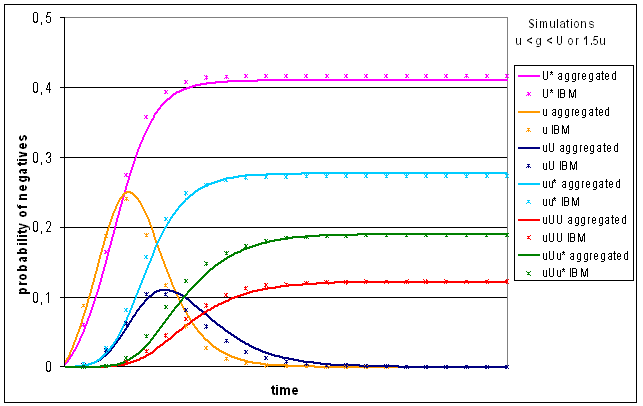
| Figure 6. Comparison of trajectories of each groups of aggregated and IBM model. One measure of the IBM's replicas is put all the ten measures of the aggregated model |
|
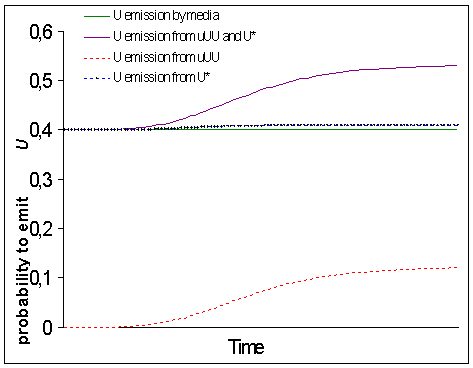
| Figure 7. Comparison of probability of U emission due to interaction with the probability of U emission due to medium for u ≤ g < 1.5 u |
|
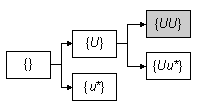
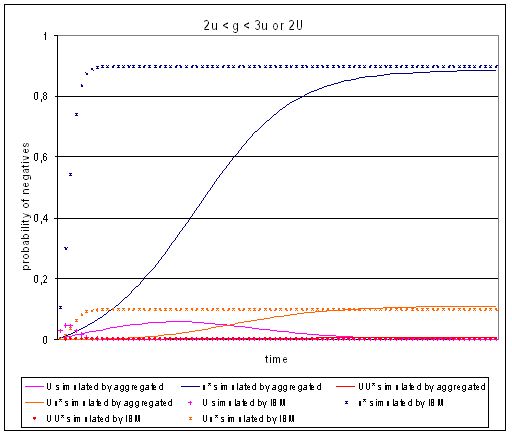
| Figure 8. The graph of transitions between the groups for 2 u ≤ g < 3 u, defined by the set of retained features. The groups in grey have a negative attitude |
| Table 3: communicated features for each group in the case 2 u ≤ g < 3 u or 2 U | |||||
| Group | Media | {U} | {u*} | {UU} | {Uu*} |
| Communicated features | U, u | none | u | U | u |
|
(2) |
with :
S0: proportion of individuals with a void list of retained features,
SU: proportion of individuals with a list of retained features containing only U,
S u*: proportion of individuals following all trajectories beginning with u,
S UU*: proportion of individuals following all trajectories beginning with UU,
S Uu*: proportion of individuals following all trajectories beginning with Uu.
f: frequency of feature diffusion by the media.
|
| Figure 9. Comparison of trajectories of each groups of aggregated and IBM model for 2 u ≤ g < 3 u. One measure of the IBM's replicas is put all the ten measures of the aggregated model |
|
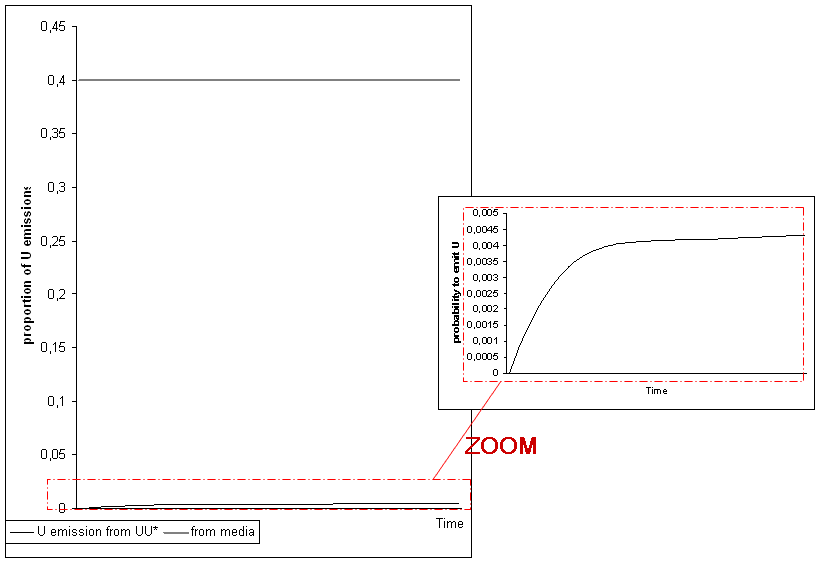
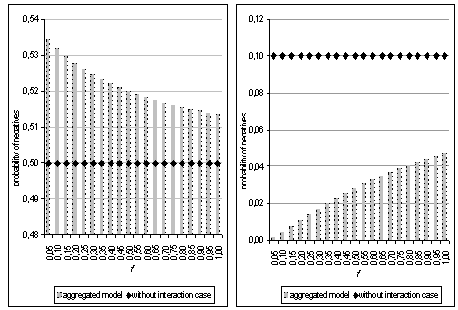
| Figure 10. Comparison of probability of U emission due to interaction with the probability of U emission due to medium for the "decrease" interaction" effect case |
We see on figure 10 that the probability of U emission by interaction (from 0 to 0.0042) is always lower than the probability of U emission by the media (0.4).
|
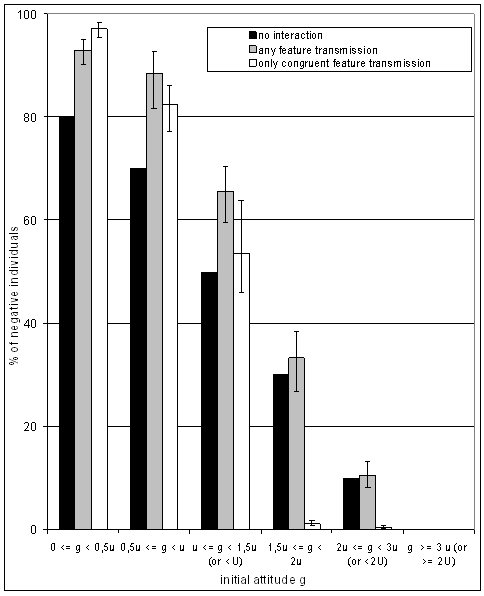
| Figure 11. Final percentage of negative individuals for various values of g and for three dynamics: isolated individuals (no interaction), interaction with any feature transmission, interaction with only congruent transmission (average on 100 replicas). The errors bars represent the minimum and maximum values on 100 replicas |
We observe on the left, for 0 ≤ g < 1.5 u, that both interaction cases lead to a higher part of the population exhibiting the primacy effect.
|
| Figure 12. Comparison of the final part of negatives for various values of the frequency parameter f in case "without interaction" and case "with interaction" with the aggregated models: on the left, "increase" interaction effect case (for u ≤ g < 1.5 u); on the right, "decrease" interaction" effect case at bottom (for 2 u ≤ g < 3 u) |
ASCH, E.S. (1946) "Forming Impressions of Personality". Journal of Abnormal and Social Psychology, 41, pp. 258-290.
ANDERSON, N. H. (1971) "Integration theory and attitude change". Psychological Review, 78, 171-206.
BEN-NAIM, E., KRAPIVSKY P. L. and S. REDNER (2003) "Bifurcations and Patterns in Compromise Processes", Physica D: Non linear phenomena, vol. 183, 190-204.1
DEFFUANT, G., NEAU, D., AMBLARD, F., WEISBUCH, G. (2001). "Mixing beliefs among interacting agents", Advances in Complex Systems, 3, pp87-98, 2001.
DEFFUANT, G. (2004) "Modéliser les Systèmes Complexes. Quelques pistes pour relever le défi." Habilitation dissertation, Ecole doctorale "Sciences Pour l'Ingénieur", Université Blaise Pascal de Clermont-Ferrand (France), 133 p.
DEFFUANT, G. and HUET, S. (2006) "Collective Reinforcement of First Impression Bias". First World Congress on Social Simulation, Kyoto (Japan), August. Working paper, 10 pages.
DEFFUANT, G. and HUET, S. (2007) "Propagation effect of filtering incongruent information". Journal of Business Research, 60(8): 816-825.
DEFFUANT G., WEISBUCH G. (2007) "Probability distribution dynamics explaining agent model convergence to extremism", in B. Edmonds, C. Hernandez and K. G. Troitzsch, eds., Social Simulation. Technologies, Advances, and New Discoveries (Information Science Reference, Hershey, USA), 43-60.
EAGLY, A.H., CHAIKEN, S. (1998) "The psychology of attitudes". Thomson/Wadsworth; 1993, 1998, 800 pages
EDWARDS M., HUET, S., GOREAUD, F., DEFFUANT, G. (2003). "Comparing an individual-based model of behaviour diffusion with its mean field aggregate approximation". Journal of Artificial Societies and Social Simulation, 6(4)9. https://www.jasss.org/6/4/9.html
EDWARDS, M. (2004) "Intérêt d'un modèle agrégé pour étudier le comportement et simplifier la simulation d'un modèle individu-centré de consommation couplé à un modèle de ressource en eau". Thèse en informatique, 17.09.2004, Université Paris 6 - Pierre et Marie Curie - Paris (France), 281 p.
FESTINGER, L. (1957) "A Theory of Cognitive Dissonance". Stanford, CA: Stanford University Press.
GRIMM, V. (1999) "Ten years of individual-based modelling in ecology: what we have learned and what could we learn in the future?". Ecological Modelling, 115:129-148.
HAUGTVEDT, C.P. and WEGENER, D.T. (1994) "Message Order Effects in Persuasion: An Attitude Strength Perspective". Journal of Consumer Research, vol. 21, 205-18.
HEGSELMAN, R. and KRAUSE, U. (2002) "Opinion Dynamics and Bounded Confidence Models, Analysis and Simulation". Journal of Artificial Societies and Social Simulation, 5(3)2. https://www.jasss.org/5/3/2.html
HUET, S. and DEFFUANT, G. (2006) "Effets d'un filtre cognitif sur la diffusion d'information". MOSIM 2006, Rabat.
HUET S., EDWARDS M., DEFFUANT G. 2007. "Taking into account the variations of social network in the mean-field approximation of the threshold behaviour diffusion model". Journal of Artificial Societies and Social Simulation, 10(1)10 https://www.jasss.org/10/1/10.html.
LORENZ, J., (2007) "Continuous Opinion Dynamics Under Bounded Confidence: A Survey". International Journal of Modern Physics C, vol. 18 (2007), 1-20.
MARTIN S., DEFFUANT G., NADAL J.P., WEISBUCH G. (2004). "Comparing the Binary Opinion Vector Version of the BC Model with Different Approximating Aggregated Dynamics". Proceedings of ESSA conference. Valladolid.
MILLER, N. and CAMPBELL, D. T. (1959) "Recency and primacy in persuasion as a function of the timing of speeches and measurements". Journal of Abnormal and Social Psychology, 59, 1-9
VISSER, P.S., BIZER, G.Y. and KROSNICK, J.A. (2006) "Exploring the Latent Structure of Strength-Related Attitude Attributes". Advances in Experimental Social Psychology, vol. 38, 1-76.
 Return to Contents of this issue
© Copyright Journal of Artificial Societies and Social Simulation, [2008]