
Giangiacomo Bravo (2008)
Imitation and Cooperation in Different Helping Games
Journal of Artificial Societies and Social Simulation
vol. 11, no. 1 8
<https://www.jasss.org/11/1/8.html>
For information about citing this article, click here
Received: 11-Jul-2007 Accepted: 07-Dec-2007 Published: 31-Jan-2008

 Abstract
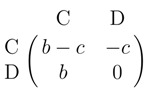
|
where C (cooperate) means to help the other player while D (defect) means not to help him/her. The game is hence analogous to a Prisoner's dilemma (see Seinen and Schram 2006).
|
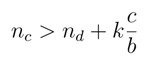
(1) |
which implies that cooperators can have higher payoff than defectors only when they have more cooperative neighbors than the defectors, plus a constant term given by the neighborhood dimension times the cost-benefit ratio.
|
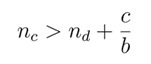
(2) |
which also implies nc > nd, but is less restrictive than the former condition.
| Table 1: Overview of experimental conditions for both the public and the private HG | |
| Condition | Parameters |
| M | n = 1024, t = 250, TP ∈ {true, false}, b ∈ {2, 4, 8, 12, 16}, c = 1 |
| S | n = 1024, t = 250, TP ∈ {true, false}, b ∈ {2, 4, 8, 12, 16}, c = 1 |
| MS | n = 1024, t = 250, TP ∈ {true, false}, b ∈ {2, 4, 8, 12, 16}, c = 1 |
| M-move | n ∈ {342, 612}, t = 2500, TP ∈ {true, false}, b ∈ {0.9, 2, 4, 8, 12, 16}, c = 1 |
| S-move | n ∈ {342, 612}, t = 2500, TP ∈ {true, false}, b ∈ {0.9, 2, 4, 8, 12, 16}, c = 1 |
| MS-move | n ∈ {342, 612}, t = 2500, TP ∈ {true, false}, b ∈ {0.9, 2, 4, 8, 12, 16}, c = 1 |
| Table 2: Final cooperator proportion for the private HG, no-move conditions. Proportions above 0.5 are in bold | |||||||
| b | |||||||
| Condition | TP | 2 | 4 | 8 | 12 | 16 | |
| M | false | Mean | 0.00576 | 0.00368 | 0.01556 | 0.01859 | 0.03809 |
| Std. dev. | 0.00770 | 0.00794 | 0.00817 | 0.01293 | 0.01053 | ||
| true | Mean | 0.00277 | 0.00257 | 0.01911 | 0.03919 | 0.05674 | |
| Std. dev. | 0.00711 | 0.00826 | 0.01116 | 0.01300 | 0.01746 | ||
| MS | false | Mean | 0.00000 | 0.15319 | 0.89922 | 0.95589 | 0.95234 |
| Std. dev. | 0.00000 | 0.25793 | 0.01545 | 0.01084 | 0.01156 | ||
| true | Mean | 0.00000 | 0.64160 | 0.96048 | 0.97936 | 0.98005 | |
| Std. dev. | 0.00000 | 0.36037 | 0.01147 | 0.00681 | 0.00789 | ||
| S | false | Mean | 0.00000 | 0.00462 | 0.07725 | 0.14281 | 0.17227 |
| Std. dev. | 0.00000 | 0.00480 | 0.01635 | 0.03213 | 0.02488 | ||
| true | Mean | 0.00000 | 0.00417 | 0.08086 | 0.13210 | 0.17806 | |
| Std. dev. | 0.00000 | 0.00491 | 0.02310 | 0.02762 | 0.02237 | ||
|
|

|
|
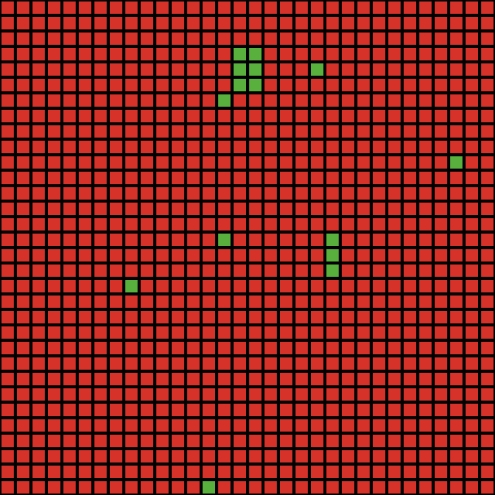
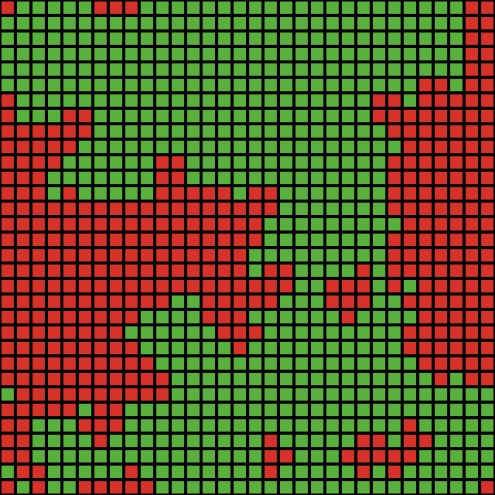
| a. t=0 (start) | b. t=1 | c. t=5 | d. t=20 |
| Figure 1. Spatial distribution of cooperators (green) and defectors (red) in a typical run of the MS no-move model for the private HG with TP = true and b = 4 | |||
| Table 3: Final cooperator proportion for the public HG, no-move conditions. Proportions above 0.5 are in bold | |||||||
| b | |||||||
| Condition | TP | 2 | 4 | 8 | 12 | 16 | |
| M | false | Mean | 0.06725 | 0.10119 | 0.13880 | 0.13314 | 0.14290 |
| Std. dev. | 0.03463 | 0.05157 | 0.05048 | 0.04727 | 0.05253 | ||
| true | Mean | 0.11789 | 0.16452 | 0.17847 | 0.19551 | 0.19788 | |
| Std. dev. | 0.06455 | 0.08247 | 0.08358 | 0.09007 | 0.08598 | ||
| MS | false | Mean | 0.95160 | 0.95339 | 0.95671 | 0.95540 | 0.95576 |
| Std. dev. | 0.01169 | 0.01147 | 0.01227 | 0.01258 | 0.00961 | ||
| true | Mean | 0.98203 | 0.98926 | 0.99010 | 0.99095 | 0.98952 | |
| Std. dev. | 0.00821 | 0.00519 | 0.00550 | 0.00448 | 0.00590 | ||
| S | false | Mean | 0.09382 | 0.14421 | 0.18190 | 0.17142 | 0.18431 |
| Std. dev. | 0.02816 | 0.03562 | 0.03021 | 0.03341 | 0.03768 | ||
| true | Mean | 0.17777 | 0.24294 | 0.25658 | 0.28145 | 0.28011 | |
| Std. dev. | 0.02909 | 0.02533 | 0.03275 | 0.02501 | 0.02249 | ||
| Table 4: Final cooperator proportion for the private HG, move conditions, n = 342. Proportions above 0.5 are in bold | |||||||
| b | |||||||
| Condition | TP | 2 | 4 | 8 | 12 | 16 | |
| M | false | Mean | 0.08099 | 0.91501 | 0.98782 | 0.99561 | 0.99776 |
| Std. dev. | 0.17187 | 0.05504 | 0.01449 | 0.00961 | 0.00618 | ||
| true | Mean | 0.06891 | 0.88090 | 0.98158 | 0.99357 | 0.99951 | |
| Std. dev. | 0.14708 | 0.17465 | 0.01995 | 0.01068 | 0.00173 | ||
| MS | false | Mean | 0.49318 | 0.99981 | 0.99990 | 1.00000 | 1.00000 |
| Std. dev. | 0.50174 | 0.00107 | 0.00053 | 0.00000 | 0.00000 | ||
| true | Mean | 0.62125 | 1.00000 | 1.00000 | 1.00000 | 1.00000 | |
| Std. dev. | 0.48100 | 0.00000 | 0.00000 | 0.00000 | 0.00000 | ||
| S | false | Mean | 0.02710 | 0.70302 | 0.94483 | 0.98421 | 0.98480 |
| Std. dev. | 0.06981 | 0.13869 | 0.04424 | 0.02592 | 0.02762 | ||
| true | Mean | 0.01462 | 0.71550 | 0.94522 | 0.98168 | 0.98704 | |
| Std. dev. | 0.05916 | 0.07877 | 0.04922 | 0.02535 | 0.02289 | ||
| Table 5: Final cooperator proportion for the private HG, move conditions, n = 612. Proportions above 0.5 are in bold | |||||||
| b | |||||||
| Condition | TP | 2 | 4 | 8 | 12 | 16 | |
| M | false | Mean | 0.00000 | 0.24031 | 0.87048 | 0.91830 | 0.95114 |
| Std. dev. | 0.00000 | 0.24223 | 0.06774 | 0.04260 | 0.02475 | ||
| true | Mean | 0.00000 | 0.32849 | 0.86498 | 0.92565 | 0.95496 | |
| Std. dev. | 0.00000 | 0.26191 | 0.05127 | 0.03852 | 0.02367 | ||
| MS | false | Mean | 0.06242 | 0.99907 | 0.99951 | 1.00000 | 1.00000 |
| Std. dev. | 0.23732 | 0.00334 | 0.00197 | 0.00000 | 0.00000 | ||
| true | Mean | 0.02947 | 0.96645 | 0.99995 | 0.99989 | 1.00000 | |
| Std. dev. | 0.16108 | 0.18253 | 0.00030 | 0.00060 | 0.00000 | ||
| S | false | Mean | 0.00000 | 0.10044 | 0.46623 | 0.59248 | 0.65419 |
| Std. dev. | 0.00000 | 0.10510 | 0.06289 | 0.05600 | 0.06697 | ||
| true | Mean | 0.00000 | 0.12789 | 0.47162 | 0.59869 | 0.65626 | |
| Std. dev. | 0.00000 | 0.11514 | 0.06707 | 0.05265 | 0.05747 | ||
| Table 6: Final cooperator proportion for the public HG, move conditions, n = 342. Proportions above 0.5 are in bold | |||||||
| b | |||||||
| Condition | TP | 2 | 4 | 8 | 12 | 16 | |
| M | false | Mean | 0.97456 | 0.98967 | 0.99786 | 0.99854 | 0.99883 |
| Std. dev. | 0.02552 | 0.01764 | 0.00434 | 0.00594 | 0.00250 | ||
| true | Mean | 0.97329 | 0.99435 | 0.99844 | 0.99834 | 0.99786 | |
| Std. dev. | 0.02305 | 0.01053 | 0.00314 | 0.00552 | 0.00334 | ||
| MS | false | Mean | 0.99990 | 1.00000 | 1.00000 | 1.00000 | 1.00000 |
| Std. dev. | 0.00053 | 0.00000 | 0.00000 | 0.00000 | 0.00000 | ||
| true | Mean | 0.99990 | 1.00000 | 0.99971 | 0.99990 | 1.00000 | |
| Std. dev. | 0.00053 | 0.00000 | 0.00160 | 0.00053 | 0.00000 | ||
| S | false | Mean | 0.95156 | 0.99016 | 0.99532 | 0.99912 | 0.99834 |
| Std. dev. | 0.04718 | 0.02158 | 0.01026 | 0.00480 | 0.00588 | ||
| true | Mean | 0.94815 | 0.98694 | 1.00000 | 0.99513 | 1.00000 | |
| Std. dev. | 0.04526 | 0.03734 | 0.00000 | 0.01391 | 0.00000 | ||
| Table 7: Final cooperator proportion for the public HG, move conditions, n = 612. Proportions above 0.5 are in bold | |||||||
| b | |||||||
| Condition | TP | 2 | 4 | 8 | 12 | 16 | |
| M | false | Mean | 0.89766 | 0.97108 | 0.98045 | 0.97805 | 0.98540 |
| Std. dev. | 0.05058 | 0.01131 | 0.01226 | 0.02635 | 0.00952 | ||
| true | Mean | 0.91078 | 0.95654 | 0.97985 | 0.98469 | 0.98557 | |
| Std. dev. | 0.04115 | 0.02992 | 0.01077 | 0.00890 | 0.00587 | ||
| MS | false | Mean | 1.00000 | 1.00000 | 1.00000 | 1.00000 | 1.00000 |
| Std. dev. | 0.00000 | 0.00000 | 0.00000 | 0.00000 | 0.00000 | ||
| true | Mean | 0.99978 | 0.99995 | 1.00000 | 0.99951 | 1.00000 | |
| Std. dev. | 0.00093 | 0.00030 | 0.00000 | 0.00239 | 0.00000 | ||
| S | false | Mean | 0.52734 | 0.70833 | 0.80158 | 0.81547 | 0.84243 |
| Std. dev. | 0.10689 | 0.07230 | 0.06767 | 0.04215 | 0.06016 | ||
| true | Mean | 0.52870 | 0.69989 | 0.80681 | 0.83034 | 0.83883 | |
| Std. dev. | 0.07979 | 0.08329 | 0.04705 | 0.04347 | 0.05259 | ||
| Table 8: Final cooperator proportion for the public HG, move conditions, b = 0.9. Proportions above 0.5 are in bold | ||||
| n | ||||
| Condition | TP | 342 | 612 | |
| M | false | Mean | 0.24366 | 0.18573 |
| Std. Dev. | 0.35439 | 0.22386 | ||
| true | Mean | 0.41043 | 0.14744 | |
| Std. Dev. | 0.34334 | 0.22619 | ||
| MS | false | Mean | 0.83168 | 0.96656 |
| Std. Dev. | 0.37833 | 0.18255 | ||
| true | Mean | 0.79250 | 0.96629 | |
| Std. Dev. | 0.40327 | 0.18251 | ||
| S | false | Mean | 0.15838 | 0.08415 |
| Std. Dev. | 0.22885 | 0.09860 | ||
| true | Mean | 0.11862 | 0.04532 | |
| Std. Dev. | 0.18688 | 0.06621 | ||
|
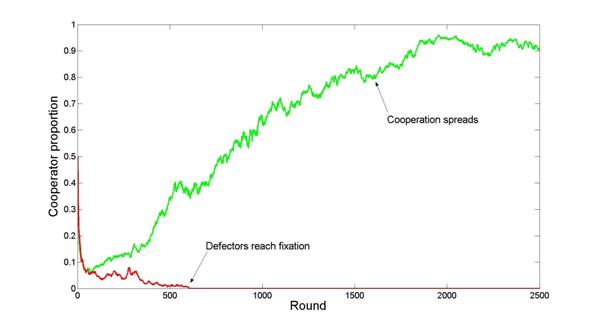
| Figure 2. Cooperation dynamics in two different runs of the M-move condition with b = 0.9, TP = true and n = 342 |
|
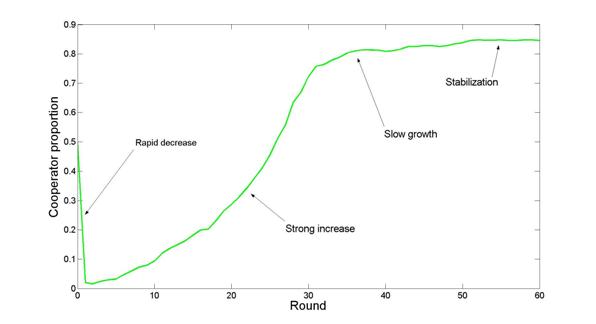
| Figure 3. Cooperator proportion in the first 60 rounds of a run of the private HG model, MS no-move condition with b = 4 and TP = true |
2 From a different point of view, m can also represent the propensity of a given agent to continue with its current strategy, resisting the conditioning of other agents by leaving them.
3 Agents in empty neighborhoods are automatically considered unsatisfied and always move.
4 A t tests shows that the differences between the phases are significant at the 1% level.
5 The differences are also significant at the 1% level
ALEXANDER RD (1987) The Biology of Moral Systems. New York: Basic Books.
AROSON E, Wilson TD, and Akert RM (2002) Social Psychology (4th ed.). Upper Saddle River: Prentice Hall.
AXELROD R (1984) The Evolution of Cooperation. New York: Basic Books.
BERG J, Dickhaut J, and McCabe KA (1995) Trust, Reciprocity and Social History. Games and Economic Behavior, 10: 122-142.
EPSTEIN JM (1998) Zones of Cooperation in Demographic Prisoner's Dilemma. Complexity, 4, 2: 36-48.
FEHR E and Fischbacher U (2003) The Nature of Human Altruism. Nature, 525: 785-791.
FEHR E and Gäcther S (2002) Altruistic Punishment in Humans. Nature, 415: 137-140.
GIGERENZER G and Goldstein DG (1996) Reasoning the Fast and Frugal Way: Models of Bounded Rationality. Psychological Review, 103: 650-669.
GINTIS H, Bowles S, Boyd R, and Fehr E (2003) Explaining Altruistic Behavior in Humans. Evolution and Human Behavior, 24: 153-172.
HAMMERSTEIN P, editor (2003) Genetic and Cultural Evolution of Cooperation. Cambridge: The MIT Press.
HENRICH J and Boyd R (1998) The Evolution of Conformist Transmission and the Emergence of Between-Group Differences. Evolution and Human Behavior, 19: 215-241.
ISAAC MR and Walker J (1988) Communication and Free-Riding Behavior: The Voluntary Contribution Mechanism. Economic Inquiry, 26: 51-74.
JOYCE D, Kennison J, Densmore O, Guerin S, Barr S, Charles E, and Thompson NS (2006) My Way or the Highway: a More Naturalistic Model of Altruism Tested in an Iterative Prisoners' Dilemma. Journal of Artificial Societies and Social Simulation, 9 (2) 4 https://www.jasss.org/9/2/4.html.
MARGULIS L (1998) The Symbiotic Planet. A New Look at Evolution. London: Weidenfeld & Nicolson.
NÉMETH A and Takács K (2007) The Evolution of Altruism in Spatially Structured Populations. Journal of Artificial Societies and Social Simulation, 10 (3) 4 https://www.jasss.org/10/3/4.html.
NOWAK MA (2006) Five Rules for the Evolution of Cooperation. Science, 314: 1560-1563.
NOWAK MA and May RM (1992) Evolutionary Games and Spatial Chaos. Nature, 359: 826-829.
NOWAK MA and Sigmund K (1998) Evolution of Indirect Reciprocity by Image Scoring. Nature, 393: 573-577.
Nowak MA and Sigmund K (2005) Evolution of Indirect Reciprocity. Nature, 437: 1291-1298.
OHTSUKI H, Hauert C, Lieberman E, and Nowak MA (2006) A Simple Rule for the Evolution of Cooperation on Graphs and Social Networks. Nature, 441: 502-505.
OSTROM E, Walker J, and Gardner R (1992) Convenants With and Without a Sword: Self-Governance Is Possible. American Political Science Review, 86: 404-417.
RABIN M (1993) Incorporating Fairness into Game Theory and Economics. American Economic Review, 83: 1281-1302.
RENDELL L and Whitehead H (2001) Culture in Wales and Dolphins. Behavioral & Brain Sciences, 24: 309-82.
RICHERSON PJ and Boyd R (2005) Not by Genes Alone: How Culture Transformed Human Evolution. Chicago: The University of Chicago Press.
SEINEN I and Schram A (2006) Status and Group Norms: Indirect Reciprocity in a Helping Experiment. European Economic Review, 50: 581-602.
SOBER E and Wilson DS (1998) Unto Others: The Evolution and Psychology of Unselfish Behavior. Cambridge: Harvard University Press.
TRIVERS RL (1971) The Evolution of Reciprocal Altruism. Quarterly Review of Biology, 46: 35-57.
TRIVERS RL (1985) Social Evolution. Menlo Park: Benjamin Cummings.
WHITEN A (2000) Primate Culture and Social Learning. Cognitive Science, 24: 477-508.
WILENSKY U (1999) Netlogo 3.1. Center for Connected Learning and Computer-Based Modeling, Northwestern University, Evanston, IL. http://ccl.northwestern.edu/netlogo/.
ZENTALL T and Galef JBG, editors (1988) Social Learning: Psychological and Biological Perspectives. Hillsdale, NJ: Lawrence Erlbaum Associates.
 Return to Contents of this issue
© Copyright Journal of Artificial Societies and Social Simulation, [2007]