©Copyright JASSS

JASSS logo ----

Müge Özman (2007)

Network Formation and Strategic Firm Behaviour to Explore and Exploit

Journal of Artificial Societies and Social Simulation vol. 11, no. 1 7
<https://www.jasss.org/11/1/7.html>

For information about citing this article, click here

Received: 15-Jan-2007    Accepted: 03-Dec-2007    Published: 31-Jan-2008

PDF version


* Abstract

The aim of this paper is to investigate the effect of technological opportunities and knowledge tacitness on inter-firm network formation, under two different industry regimes. In the first regime environment is stable and the aim of firms is to exploit knowledge. In this case, they attribute more value to repeated interactions with geographically close firms. In the second regime, there is environmental turbulence, which increases the value of access to novelties from distant partners for the purpose of exploration. The question addressed is, under these regimes how do technological opportunities and knowledge tacitness influence structure of networks? A simulation model is carried out where firms select partners and learn from them, which further shapes their selection process. How the macro structure of the network is shaped from the individual partner selection decisions of firms is analysed. The results reveal that in both regimes richer technological opportunities and higher tacitness generates local and global star firms depending on the parameter range.

Keywords:
Networks, Knowledge, Innovation, Exploitation, Exploration

* Introduction

1.1
It is now acknowledged that external interactions of a firm are vital for its competitive advantage. In the literature, one of the main incentives to form external linkages has been shown to be organizational learning. According to this literature one of the motives of firms in forming linkages with other firms is learning. The pioneering paper has been that of Powell et al. (1996), where they state that firms network with each other because they seek to explore and exploit knowledge bases. In particular, their seminal work on biotechnology places the concept of organizational learning at the heart of the network literature. Distinguishing between exploration and exploitation dimensions of organizational learning, the former refers to experimentation with new alternatives, and the latter to the "exercise of refinement and extension of existing competencies, technologies and paradigms" (March 1991: 85). Interactions between firms not only enhance learning about new developments, but also strengthen internal competencies and thus the locus of innovation is found in the networks of learning (Powell et al. 1996).

1.2
Previous studies reveal that whether a firm collaborates for the purpose of exploring or exploiting depends on the external conditions (Rowley et al. 2000) like the stage in the industry life cycle or the growth phase of the firm. Some recent studies examine in detail the motivations for exploration versus exploitation alliances, in the context of life cycle of the firm (Oliver 2001), industry life cycle (Rothaermel and Deeds 2004) effects of uncertainty and industry life cycle (Beckman et al. 2004). According to Rowley et al. (2000) firms in turbulent environments may benefit more from exploring knowledge, while firms in more stable environments can prefer to deepen their existing knowledge through their external contacts (Rowley et al., 2000). In addition they point out that exploration is carried out effectively by constructing weak links with distant firms, while exploitation happens through strong ties and repeated interactions with other firms. These results also have implications for the debate between social capital and structural hole proponents in the literature.

1.3
Proponents of the social capital view (Coleman 1988) argue that, taking place in dense networks with embedded relations (Granovetter 1985) in which interactions are accompanied with thick knowledge exchange, and which are frequent and face to face, helps to build trust among the parties, so that concerns for reputation mitigate possible opportunistic behavior. Networks rich in social capital facilitate transfer of tacit knowledge since a common language is developed among the parties, which increases efficiency in terms of time and costs of negotiation (Uzzi 1997). It has also been shown that in industries where knowledge is highly tacit, a clustered network structure facilitates the flow of knowledge (Cowan et al. 2004; Audretsch and Feldman 1996). On the other hand, too much embeddedness can have counter effects, like rendering the firm vulnerable to external shocks or insulating it from novel knowledge residing elsewhere in the network (Uzzi 1997).

1.4
Inspired from Granovetter's leading arguments on the strength of weak ties (Granovetter 1973), proponents of structural holes argue that networks rich in social capital result in redundancy of knowledge exchange, since the same parties interact frequently. As they argue, firms should fill structural holes in the network, and act as " bridges" connecting otherwise disconnected clusters of firms (Burt 1992). These weak ties are advantageous in terms of getting access to novel knowledge from diverse sources, thus beneficial for exploration purposes and when the knowledge being transferred is more codified (Rowley et al. 2000). It is argued that especially in technologically turbulent environments, a firms' access to novel knowledge is critical for competitive advantage. Weak ties also have the benefit of giving the firm flexibility in adapting to new circumstances (Gargiulo and Benassi 2000; Uzzi 1997). One of the disadvantages of filling structural holes is that the flow of tacit knowledge is constrained, which can mitigate innovative performance, as observed in the case of chemicals (Ahuja 2000).

1.5
These studies reveal that the overall network structure among firms in an industry depends on the industrial conditions. This is because under different conditions of the industry firms may use different criteria to construct external linkages. This observation is the starting point of this paper. In particular the question addressed in this paper is, what are the characteristics of the overall network structure when firms individually select other firms under different conditions of the industry? In addressing this question, it is assumed that 1) firms interact with each other with the objective of organizational learning, in the form of exploration or exploitation of their knowledge bases and 2) industrial conditions shape with whom firms want to interact. In the paper, interactions are taken as informal meetings of firms, where they are short term and do not require significant commitment in terms of resources. These can be resembled to interactions that happen through working groups, task forces or technical committees, in which learning from other firms is the main outcome (Rosenkopf et al. 2001).

1.6
Because many firms select partners in a decentralised manner based on their own self interest, the overall structure of networks that emerge cannot be predicted a priori. An agent-based simulation model is a promising avenue to explore the overall consequences of individual decisions, and how the macro structure of the network emerges from the micro decisions of each firm in the industry. In defining industrial conditions, we focus on three dimensions as turbulence, tacitness of knowledge and technological opportunities. The results reveal that depending on the parameter space defined by technological opportunities, knowledge tacitness and turbulence, local and global star firms are likely to emerge in the network, who have more connections than other firms.

1.7
The paper is organized as follows. In the second section, we explain the model. In the third section we present simulation results, followed by some discussions in section four and finally concluding remarks.

* The Model

2.1
The aim of the model is to highlight the characteristics of networks that emerge when firms voluntarily select partners under different industry conditions. The intuition behind the model is that firms will have different partner selection criteria under different conditions of the industry. The question addressed is, what types of networks emerge under three industry dimensions as technological opportunities, tacitness of knowledge and turbulence? The model is based on four premises:
(A1) Firms construct external linkages for the purpose of organizational learning, in the form of exploration or exploitation;
(A2) In stable environments firms are willing to exploit, and firms in turbulent environments are willing to explore (Rowley et al. 2000) [1];
(A3) Constructing strong ties is better for exploiting knowledge, and constructing weak ties is better for exploring new knowledge (Rowley et al. 2000);
(A4) As knowledge becomes more and more tacit, a firm needs to interact more frequently with geographically close firms (i.e. strong ties) to increase its extent of learning (Cowan et al. 2004; Audretsch and Feldman 1996; Uzzi 1997).

2.2
There are two stages in the model. In the first stage firms select partners. In the second stage firms learn from their partners and in this way knowledge diffuses. Below, these stages are explained in detail, followed by a description of the algorithm of the model explaining how these stages are linked.

Selection of Partners

2.3
In the first stage of the model, firms select other firms by assigning an expected value to a potential interaction. This expected value depends on the industry conditions and the perceived level of the other firm's knowledge.

2.4
Mathematically, when ego firm i is choosing among other firms, it assigns the following value to an interaction with firm j [2];

Equation (1)

where we define the function s(.,.) as

Equation

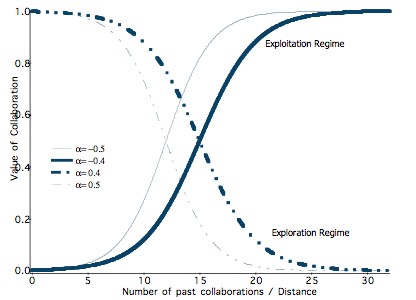
vij the value of collaboration between firm i and j, kj is the knowledge level of firm j, βij is a parameter to account for the error term that firm i might commit in forming its expectation regarding the value of its collaboration with firm j, hij is the number of times firm i and j have collaborated in the past, dij is the geographical distance between firms i and j, and α is a parameter that we vary to control for stability of the industry and tacitness of knowledge. According to Equation (1), the higher is the value of firm j's knowledge, the more value firm i places on their collaboration.

2.5
The parameter α measures the first two dimensions of industry regime. The sign of α controls for stability of industry, and the magnitude of α controls for the tacitness of knowledge. The term exploitation regime is used for industries which are more stable, and the term exploration regime is used for industries in which there is high instability (from A2 above).

2.6
In Equation (1), values of α < 0 represent an exploitation regime, which refers to an industry which is relatively stable. This means that, firms would find it more beneficial to deepen their knowledge in a specific field, rather than to explore new knowledge (from A2 above). Therefore, the value that a firm assigns to a potential partner will increase with greater number of past interactions and less distance between them (from A3 above). The logistic curve with α < 0 enables us to model these aspects of firm valuation as shown in Figure 1. Two aspects of this function is important. Firstly, given a level of partner's knowledge kj value that a firm assigns to a partnership (vij) is positively related with number of past meetings (Equation), and negatively related with distance between two firms (Equation).

2.7
Secondly, we would expect that as the number of meetings between two firms increase, the marginal value of each meeting first increases and then falls. This is because in the beginning firms do not know each other sufficiently well and they have more to learn from each other. As firms get to know each other after sufficient meetings, there is less to be gained from each meeting. This implies that in the beginning two firms will have more contribution to make to each other, and soon after the marginal contribution starts falling. In the functional form used in Equation (1), this implies that Equation.[3] Only when the marginal contribution of collaboration is zero, firms achieve the full benefits from their meetings. These features of the functional form employed can be seen in Figure 1. Based on Equation 1, for a given level of partner's knowledge, the value that firm assigns to its meeting with firm j is increasing in the number of previous meetings divided by their distance. Two additional features of the logistic function are important for the model:
(AS1) Shift of the curve to the right (thick solid line in Figure 1) : As the absolute value of α gets smaller (rightward shift of the curve) knowledge becomes more and more difficult to transfer via meetings. In other words, acquiring the same level of benefit from a collaboration requires more meetings and/or shorter distance. From (A4) above, the effect of an increase in tacitness results in more frequent interactions with closer neighbours. Thus, the model assumes that more frequent interactions is due to the fact that the level of tacitness of knowledge has increased.
(AS2) Change in the slope (thick solid line in Figure 1): As the absolute value of α gets smaller, the slope of the curve decreases. In this way the function also captures an important effect. As knowledge becomes increasingly tacit, the marginal value of past meetings over history falls. For an ego firm, this means that there is very little difference in terms of expected value, of connecting to an immediate neighbour, or else the one next to the immediate neighbour, because in any case knowledge transfer is far too limited in both cases.

2.8
In the exploitation regime, the magnitude of alpha controls for knowledge tacitness. How sensitive is the value of a collaboration to the number of previous interactions and distance (i.e. the extent of tacitness of knowledge, α) is a parameter we vary under this regime. In an exploitation regime, firms seek to build strong ties with close neighbours, and more competent firms are more attractive for a firm based on Equation 1. Therefore, when a firm makes a decision to select a partner, it values closer partners with whom it has met more in the past, as well as who are more competent.

2.9
Values of α > 0 represent an exploration regime, which characterizes a turbulent environment. This is shown in the exploration regime part of Figure 1. In this regime, more distant and novel collaborations yield more value, because opportunity cost of committing resources to the same partner increases (based on A2 above). In this case, there is no additional value to be derived from repeated interactions. On the contrary, novel partners are what firms are looking for, to access novel sources of knowledge and to gain knowledge about recent developments elsewhere in the network. As in the case of an exploitation regime, in an exploration regime, as value of α falls knowledge becomes more tacit. In other words, it requires more past meetings and/or closer distance to achieve a certain level of benefit. This is shown by a rightward shift of the exploration curve in Figure 1, demonstrated by the thick dashed line.

2.10
To summarize, the sign of α controls for the industry regime which we characterize by the extent of turbulence in the environment, while its magnitude controls for the tacitness of knowledge in both regimes. Firms select partners according to the industry regime, and the tacitness of the knowledge, using Equation 1.

Figure
Figure 1.

2.11
Figure 1 shows function v(.,.) in Equation 1 for a given level of knowledge of the partner. The vertical axis shows the perceived value of a collaboration for the ego firm, with potential partner. Horizontal axis shows the status of the relationship between ego firm and the partner, which is given by number of past meetings between ego firm i and firm j, divided by distance between them. In an exploitation regime, value of collaboration is increasing in number of past meetings divided by distance. In an exploration regime, value of collaboration falls with number of past meetings divided by distance between the two firms.

Diffusion

2.12
In the second stage of the model, every firm selects a partner by choosing the one to whom it has attributed the highest value by Equation 1, and firms interact. It is assumed that cost of connections are negligible, and forming a link does not require the consent of the other firm. Although these two assumptions can be considered as strong, cost of connections and mutual consent usually depend on the type of connection being made. Here it is assumed that the type of contacts between firms are based on informal meetings which are usually short term, and have important learning effects. These can occur in the context of working groups, task forces, or technical committees. In such interactions, the costs of connection for a firm is quite low in terms of the resources committed (Oliver 1991). Moreover, in such meetings significant degree of knowledge spillovers occur, and such informal contacts usually result in the establishment of more formal alliances between firms (Rosenkopf et al. 2001).

2.13
In each period each firm contacts another firm (we assume that self collaborations yield zero value). A firm may have contact with many other firms, if it is selected by them. After partners are selected, the firms learn from each other, their knowledge levels are updated and the period ends. In the next period they select partners again with their updated knowledge levels.

2.14
The extent of learning depends on the three dimensions of the industry regime. The first two dimensions are explained above as turbulence and tacitness. The third dimension is technological opportunities, which is introduced in this part. Here it is assumed that when firms are making their decisions, they have an estimation of the partner's knowledge level (given above in Equation 1), but they are not farsighted enough to estimate what they can learn from their partners, given the combination of their own knowledge and the partner's knowledge.

2.15
In an exploitation regime, the more two firms have met in the past and the closer they are, the more they can learn from each other. On the other hand, in an exploration regime, the less they have met in the past and the more distant they are, the more they can learn from each other. In addition, industries with higher technological opportunities yield more learning.

2.16
At the end of one period, firm i learns from the collaboration with firm j according to[4]

Equation (2)

where we define g(.,.) as

Equation

with

Equation (3)

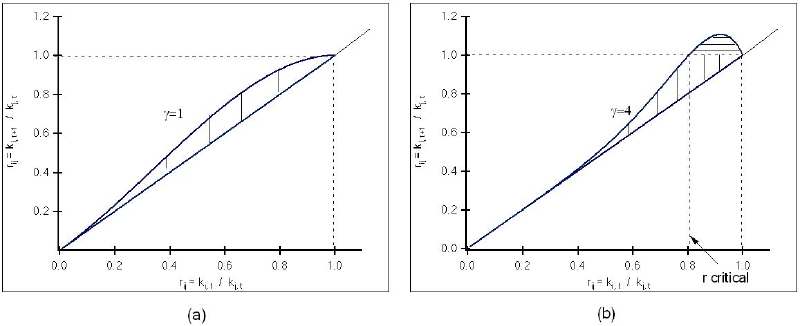
where sij is as explained in Equation (1). Equation (2) tells that, the extent of learning depends on a) history and distance as revealed by function s(.,.) and b) technological opportunities. Technological opportunities are measured by parameter γ which is the third dimension of the industry regime. According to function g(.,.) learning in a collaboration depends on the relative knowledge levels between firms i and j. In modelling increases in a firm's knowledge as a result of the receipt of new knowledge (See Cowan et al. 2004 for this type of learning function):

(AD1) The resultant knowledge level is continuous in the initial level of the ego firm;
(AD2) If the ego firm knows more than the partner, the knowledge level of the ego firm does not change;
(AD3) When the ego firm's knowledge level is small relative to that of the partner, the increment to its knowledge decreases as it falls further behind;
(AD4) It is in general possible for an ego firm to leapfrog the partner, achieving a higher knowledge level than the partner after the collaboration.

Figure
Figure 2 Absorption and Innovation

2.17
Parameter γ measures two aspects of learning: absorption of knowledge and innovation. In Figure 2(a) and (b), the horizontal axis shows the relative knowledge levels of the ego firm i and partner j before collaboration, and the vertical axis shows the relative knowledge levels after collaboration. Here, the 45° line to the right of rij=1 reveals that it is only possible to learn from more advanced people. If firm i has more knowledge than firm j, rij > 1 and firm i's knowledge does not change. When γ = 1, there is only absorption shown by the vertical lines. In Figure 2(b), there is both absorption and new knowledge creation (i.e. leapfrogging). When the relative knowledge levels before collaboration are above the critical threshold rc (1 > rij > rc ), the less knowledgeable firm i increases its knowledge over and above that of firm j in the next period. This area is revealed by the horizontal lines, where the new relative knowledge levels are bigger than one. The horizontal lines show the areas of innovation. As γ increases further, the possibilities for innovation increase. Therefore in this model γ measures the potential of the industry to innovate (Cowan et al. 2004).

2.18
In addition to technological opportunities, the history of a partnership as a determinant of learning and networks is also taken into account in Equation (2) with function s(.,.) as explained in the selection process.

2.19
The reasoning behind the learning function Equation (2) is as follows. Let us think of an industry in which technological opportunities are very high. This implies that when two firms meet, for γ > 1 the firm who knows less has even the chance to leapfrog the partner as implied by function g(.,.). However, if it is an exploitation regime where knowledge is highly tacit, its diffusion between two firms will be more constrained than a regime in which knowledge is more codified (i.e. α < 0 and higher absolute values of α). Therefore, tacitness is a factor which inhibits the ego firm from fully utilizing technological opportunities, unless it has met with the partner firm sufficiently before. This is how the history of meetings matter. As implied by function s(.,.) in Equation (2) the more two firms have met in the past, the more chances they will have to fully utilize technological opportunities by counterfeiting the negative effect of difficulties in knowledge transfer. When knowledge is relatively more codified, these problems are of no concern. In this case history matters less for utilization of technological opportunities since its transfer is relatively easier. This function captures these aspects of the knowledge diffusion process. In short, it tells that the more tacit knowledge is, the more important it is that two firms have met more in the past (or be closer to each other geographically) to be able to capture a certain amount of technological opportunities.

Figure
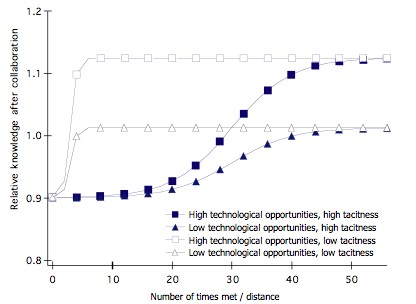
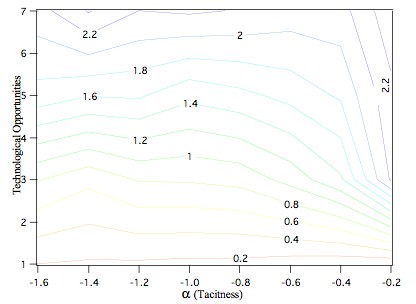
Figure 3 Relative Knowledge Levels under different levels of Technological Opportunities and Tacitness

2.20
These effects are shown in Figure 3. The initial knowledge proportion is 0.9. Higher technological opportunities (square markers) yield higher knowledge creation. But if knowledge is highly tacit (filled squares) making the most of opportunities requires more meetings in the past and/or shorter distance between partners. The same is valid for low technological opportunities, which yield less chances for knowledge creation (triangle markers).

2.21
Once diffusion occurs, knowledge levels of firms are updated, and in the next period, process of partner selection is repeated. We look into the types of networks that emerge and the distribution of knowledge among firms, in the parameter space defined by technological opportunities, type of regime (i.e. exploration or exploitation) and the tacitness of knowledge.

A Summary of the Simulation Model

2.22
A brief description of the model is as follows. In period t = 0 the initial knowledge levels of firms and parameter values are set. In the beginning of the period, each firm assigns to every other firm an expected value of collaboration using Equation 1. Next each firm forms a connection to the firm which it has assigned the highest value. In this way a network forms and it is recorded. In this scheme, each firm selects one partner. But some firms might be selected by many other firms. Therefore in the network, each of the firms have at least one connection. After selection of partners, firms learn from their neighbours. Learning takes place via Equation 2. Knowledge levels of the firms are updated, which marks the end of the period. Links are deleted, and the second period begins with the updated knowledge levels. The same loop is repeated. After sufficient periods elapse, the frequency matrix is obtained (showing who interacted with whom and how many times) and the simulation run ends. The parameter values are changed, new knowledge levels are assigned, and another simulation run begins as described above.

* Results

3.1
The population consists of N = 30 firms, who are located on a circle. Each firm i is endowed with a knowledge scalar, ki assigned randomly (drawn from a uniform distribution) at period t = 0; ki shows the level of firm i's knowledge. Firms are endowed with different knowledge levels. The main parameters that we vary are α, which measures a) the industry regime (α < 0) for exploitation regime and α > 0 for exploration regime), and b) tacitness of knowledge (higher values connote higher tacitness) and γ which measures technological opportunities. In the simulations, α ∈ [-2,2], β ∈ [0.9,1.1] and γ ∈ [1,7]. Because the aim of the model is to highlight the type of networks that emerge under different conditions of the industry, we look at measures of network structure in the parameter space defined by α and γ. For this purpose, social network analysis tools are used. One simulation run consists of 1000 periods. At the end of the 1000 periods, we record frequency matrices, showing the number of times firms have formed links. We run 10 simulations for each of the parameter combinations, and the results correspond to the average of network measures. We analyse the resulting networks using social network analysis tools. In particular, we look at the degree of localization of links, reachability among firms and centrality of the networks.

Spatial Strength

3.2
Firstly, we measure the extent to which firms in the network form strong ties. As we use the term, strength of a tie has two dimensions; firstly it measures the extent to which the tie is constructed with a geographically close firm, and second the number of times the tie is repeated between two firms. For this purpose, the spatial strength index measures the extent to which they interact frequently with close neighbours. This is given by;

Equation

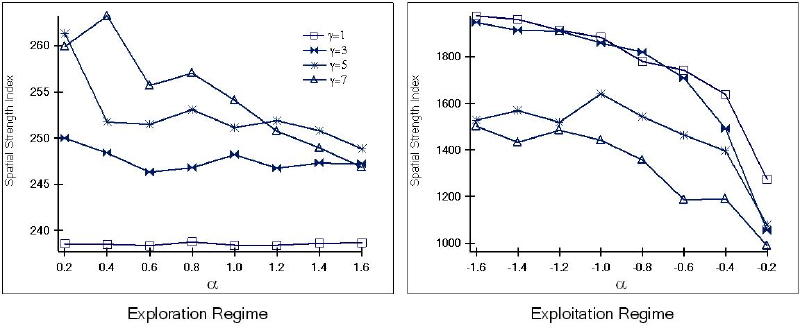
where dij is the distance between firms i and j, and hij is the number of times i and j have collaborated. The average is taken over all firms in the population. Higher values of the spatial strength index reflect the tendency in the population to form strong ties with close firms. Lower values of the index reflect a tendency to form weak ties with distant firms. Figure 4 shows this measure.

Figure
Figure 4 Spatial Strength Index

3.3
In an exploitation regime, firms learn more by forming strong ties with close neighbours. Therefore, the absolute values of the spatial strength index is high compared to the exploration regime, in which networks are more dense and ties more diversified. In an exploitation regime, choosing a close neighbour and forming a link repeatedly enables a firm to utilize more technological opportunities that he can get from this partnership. But as knowledge tacitness increases, the spatial strength index falls. Indeed, this result is a consequence of AS2. The results are further discussed below in relation to other network measures.

3.4
An important aspect of the model is that forming a tie does not require the consent of the partner. Any firm can form a link with any other firm. Therefore this aspect of the model permits cases in which some firms might be high in demand, which will increase their centrality in the network.

Centrality

3.5
Degree centrality in a network is measured as follows;

Equation

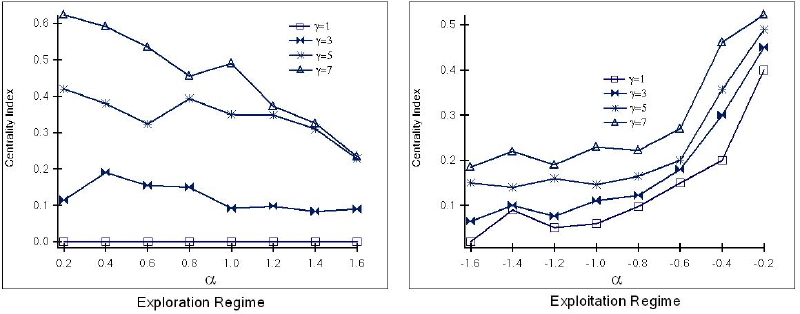
where cmax is the degree of the firm with the highest connections, ci is the degrees of actor i. The term in the denominator gives the maximum possible value of difference among all actors (Wasserman and Faust 1994).

Figure
Figure 5 Degree Centrality

3.6
Figure 5 shows that in both regimes, centrality increases with tacitness. At the same time, in industries with higher technological opportunities, centrality of the networks are higher. In the exploitation regime, it was observed that when technological opportunities are higher and knowledge more codified, there are local stars, which is evident from high spatial strength (Figure 4) accompanied by high centralization. As knowledge becomes more tacit, these local stars are replaced by global stars, as evidenced by even higher degree centrality of the networks. To see the extent to which the firms are connected to each other, we also looked at the reachability of firms in the network.

Reachability

3.7
Reachability of the network measures the extent to which two nodes are accessible to each other directly or via intermediaries.[5] For higher technological opportunities and codified knowledge, we mentioned above that there are local stars in the network. In Figure 6 it is possible to see that in this range the reachability depends on technological opportunities. As technological opportunities rise, firms are more connected to each other, accompanied by local stars (Figure 5), and strong ties (Figure 4). In an exploration regime, it is an expected result that all firms are connected to each other since networks are denser.

Figure
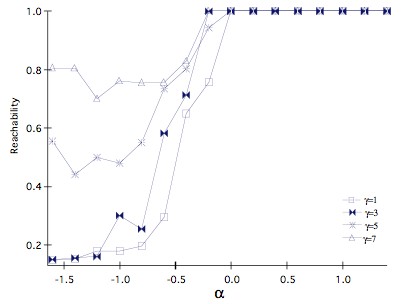
Figure 6 Reachability

* Discussion

Exploitation Regime

4.1
In an exploitation regime, firms can learn more from a partner the more they have met before, and the less distance between them. Although this generates a magnet effect which attracts firms to repeat links with close neighbours, this magnet effect diminishes because of two reasons: increasing tacitness, and increased technological opportunities. These are observed in Figure 4 where spatial strength index falls as technological opportunities and tacitness increase.

4.2
The loosening of local interactions when knowledge is more tacit might seem contradictory to most empirical evidence, which reveals that tacitness of the knowledge base increases clustering. However, this result is hardly surprising in this model, because it is imposed by the functional form employed. This is a consequence of AS2, which states that the difference between connecting to an immediate neighbour, or else connecting to a firm in the vicinity is lower as tacitness increases. As expected, this creates a loosening of the connections towards more distant partners, which reduces strength of ties.

4.3
At the same time, it is observed that this localization is loosened when technological opportunities are higher. Moreover, an interesting effect of technological opportunities on network structure is that when knowledge is codified, higher technological opportunities generate "local stars", whereas as knowledge becomes more tacit, higher technological opportunities generate "global" stars. This can be explained by the two forces operating in opposite directions as explained below.

4.4
When an ego firm is making a decision to select partners, it can take into account the partner's knowledge level, and also their history and distance (see Equation (1)). The network structure that emerges is a result of the effect that dominates. If knowledge effect dominates, firms care less about their history and distance, but more about the knowledge of the partner and we see loosening of localization. For example, when knowledge of the potential partner is too high, it becomes too attractive to be ignored for the ego firm, so instead of commitment to making strong ties with close firms, it can select the star firm. If history effect dominates, firms care more about forming strong ties with close neighbours, regardless of their knowledge level. The process works in the following way.
Codified Knowledge and High Technological Opportunities: Local Stars

4.5
When knowledge is relatively codified, it is obvious that the history effect is more dominant (by axiom AS2), so firms have a tendency to form strong ties with close partners. Here, as technological opportunities increase firms have more chances to leapfrog the knowledge of their partners, provided that their relative knowledge levels are close (see Equation (2)). In this case, some lucky firms have neighbours whose knowledge levels are close to themselves. These firms can easily leapfrog their partners, and they have more chances to innovate. As this process takes place, they become more attractive for the other firms in the vicinity. In other words, having a firm in the vicinity whose knowledge becomes significantly higher than others attracts other firms to the star firm. For these peripheral firms, this is the case where the knowledge effect starts dominating the history effect, because there is a firm in the vicinity whose knowledge is too big to ignore. Because transfer of knowledge is easier when knowledge is codified, the knowledge gap between peripheral firms and the star firm does not grow too much. Therefore star firms always remain as the local stars, without being able to extend their field of attraction to all the network. This is why the centrality is higher for higher technological opportunities in Figure 5, which also corresponds to the region where spatial strength is high. In this way, the spatial strength because of less tacit knowledge, and the loosening effect because of higher technological opportunities yield the emergence of local stars.
Tacit Knowledge and High Technological Opportunities: Global Stars

4.6
As knowledge becomes more and more tacit, axiom AS2 tells that spatial strength will be lower in the network as explained above. In this case, the knowledge effect can dominate the history effect. Therefore firms will have a tendency to prefer knowledgeable partners to forming strong ties with close neighbours. However, in this case knowledge is relatively more difficult to transfer. Some lucky firms who have neighbours with similar knowledge levels in the vicinity start innovating. This time, however, because it is relatively difficult to transfer knowledge, the gap between these firms and peripheral firms keeps increasing and peripheral firms fall further behind (see axiom AD3). This is how some firms become more and more attractive, and extend their field of attraction to other firms in the network, and eventually they become "global" stars.

4.7
To confirm these results, we also looked at the knowledge gap among firms, measured by the standard deviation of knowledge in the population. Figure 7 gives this measure. As it can be seen, both technological opportunities and tacitness of knowledge have the effect of increasing the knowledge gap among firms.

Figure
Figure 7 Average Reachability among Network Members

Exploration Regime

4.8
In an exploration regime, firms want to meet new and distant firms to be informed about knowledge residing elsewhere in the network other than in close vicinity. The results reveal that in an exploration regime, the same rules hold as for the exploitation regime. More specifically, higher technological opportunities and knowledge tacitness increase centrality (Figure 5). The main difference between the exploration and exploitation regimes in terms of networks is that, in the former case networks are denser, and thus spatial strength index is lower (Figure 4). Figure 6 shows that in an exploration regime, all nodes are reachable from each other as a result.

4.9
To interpret these results, let us think of the two forces at work in partner selection; knowledge of the partner and history of interactions. Contrary to the exploitation case, here the dilemma that a firm faces is whether to connect weakly to a distant firm and have access to novelty, or to connect to highly competent firms. Because there are no increasing returns from repeated interactions, firms can now select both options. This is why the spatial strength index is very low, and the reachability of the network is one in an exploration regime. In short, the networks are very dense, as expected.

4.10
One interesting result in this regime is that when technological opportunities are high, network centrality is higher. There are some firms who benefit from their distant connections more than other firms because of relative knowledge levels. This gives them more chances to innovate. In this way, they become more attractive to other members of the network. When knowledge is codified, its transfer is easier, so overall knowledge differences among the firms do not grow too much. As knowledge gets more and more tacit, star firms strengthen their position in the network, because their knowledge easily exceeds that of other firms. In other words, only these firms can make use of technological opportunities in the industry while others are attracted to them without being able to learn too much and by falling further behind (see axiom AD3). In this way, higher tacitness and technological opportunities generate stars in the industry as revealed by higher centrality measures in Figure 5.

* Conclusion

5.1
In the economics literature the recent decade has witnessed a surge of interest in interacting agents models, which suggest that the classical general equilibrium approach with its emphasis on the behavior of a representative agent is quite inappropriate in modeling aggregate economic and social behavior. Any attempt to explain aggregate patterns has to take into account the particular interaction structure among heterogeneous agents, and how it evolves over time. In this paper, we follow a similar approach taking network structure to be an emergent property resulting from the interaction of knowledge embodying firms. In other words, adopting a bottom-up approach is a promising avenue to investigate the self-organizing process of network formation under different conditions of the industry.

5.2
In general, simulation models enable a wide range of experimentation possibilities despite their abstractness. In this sense, this paper is not an exception. There are some shortcomings of the model, which can be considered in future research. In particular, one can investigate a regime in which firms are both explorers and exploiters simultaneously. Another extension of the model could be the case in which the tacitness of the industry undergoes change as interactions proceed. Nevertheless, the simulation model in this paper reveals some interesting dynamics related to emerging network structures under different industry conditions. It remains to future research to test empirically the results of the model in different industrial settings.

5.3
According to the results of the paper in a world where we can distinguish between two regimes as an exploitation regime and an exploration regime, different network structures emerge depending on technological opportunities and extent of tacitness of knowledge. In an exploitation regime, the environment is stable, and value of a collaboration and learning increases as firms meet more with each other and with those who are close to themselves. Here we assume that the environment is rather stable. On the other hand, in an exploration regime, the environment is turbulent, so opportunity cost of committing to a single close firm is higher, in terms of foregone access to novel knowledge residing elsewhere in the network. In this case, firms do not want to interact repeatedly, rather they search for novel and distant partners.

5.4
In an exploitation regime, networks are composed more of strong ties, where firms interact repeatedly with geographically close firms. In this regime, high technological opportunities and codified knowledge result in the emergence of local star firms. When knowledge gets more tacit, local stars become global stars in the network who are more competent than other firms. Our results imply that in an exploitation regime, firms who are similar to each other in terms of their knowledge level should be in the same vicinity to capture the most of technological opportunities. When knowledge is highly tacit, too much diversity in knowledge reduces the chances to capture technological opportunities, and increases the knowledge gap among actors, producing local and global star firms.

* Acknowledgements

I thank two anonymous referees for their helpful suggestions and comments.


* Notes

1 In the real world firms might find it useful to explore and exploit simultaneously. Therefore although such a strict differentiation might be considered unrealistic, for purposes of clarity, we include this assumption to reflect a general tendency of firm behaviour in different environments.

2 The firms are knowledge intensive firms, where their contacts with other firms in the industry are important mechanisms for organizational learning and increasing their innovative capacity.

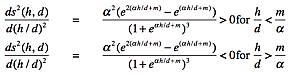
3 See Appendix for derivatives.

4 Here, we use the time subscript (t+1) because this updated knowledge level will be used in the partner selection process of the next period (t+1).

5 To calculate reachability in the network, the software UCINET was used (Borgatti et. al. 2002).


* Appendix

A.2
In an exploitation regime, given a certain level of the partners knowledge, the value that a firm assigns to its interaction with another firm (given by s(h,d) in Equation 1) is positively related with the number of times they have met in the past (h) and negatively related with the distance between them (d). This can be shown taking the first derivative of s(.,.) with respect to h/d:

Equation

A.3
As the number of meetings between two firms increase, the marginal value of each meeting first increases and then falls. This implies that in the beginning two firms will have more contribution to make to each other, and soon after the marginal contribution starts falling.

A.4
For these purposes, the second derivative of the function s(.,.) with respect to h and d is as follows:

Equation


* References

AHUJA G (2000) Collaboration Networks, Structural Holes and Innovation: A longitudinal Study. Administrative Science Quarterly, 45(3): 425-53

AUDRETSCH D B and Feldman, M P (1996) Knowledge spillovers and the geography of innovation and production. American Economic Review 86, 630--640

BECKMAN, C M, Haunschild, P R, Philips D J (2004). Friends or Strangers? Firm specific uncertainty, Market uncertainty and Network partner selection. Organization Science, 15(3): 259-275.

BORGATTI, S P, Everett, M G and Freeman, L C (2002) UCINET for Windows: Software for Social Network Analysis. Harvard: Analytic Technologies.

BURT R S (1992) Structural Holes: The structure of competition. New York: Academic Press.

COLEMAN J S (1988) Social capital in the creation of human capital. American Journal of Sociology, 94, 95-120

COWAN R, Jonard N and Ozman M (2004) Knowledge Dynamics in a Network Industry. Technological Forecasting and Social Change, 71(5), 469-84

GARGIULO B, Bennassi M (2000) Trapped in Your Own Net? Network Cohesion, Structural Holes and Adaptation of Social Capital. Organization Science, 11(2), 183-196

GRANOVETTER M S (1973) The Strength of Weak Ties. American Journal of Sociology, 78(6), 1360-80.

GRANOVETTER M S (1985) Economic Action and Social Structure: The Problem of Embeddedness. American Journal of Sociology, 91, 481-510

MARCH J (1991) Exploration and Exploitation in Organizational Learning. Organization Science, 2: 71-87.

OLIVER, C (1991) Network Relations and Loss of Organizational Autonomy. Human Relations, 44(9): 943-961.

OLIVER, A (2001) Strategic Alliances and the Learning Life-Cycle of Biotechnology Firms. Organization Studies, 22(3):467-489.

POWELL, WW, Koput, KW and Smith-Doerr, L (1996) Interorganizational Collaboration and the Locus of Innovation: Networks of Learning in Biotechnology. Administrative Science Quarterly, 41:116-145.

ROSENKOPF L, Metiu A and George V P (2001) From the Bottom Up? Technical Comitee Activity and Alliance Formation. Administrative Science Quarterly, 46(4): 748-772.

ROTHAERMEL, F.T. and D.L. DEEDS (2004) Exploration and Exploitation alliances in biotechnology: a system of new product development. Strategic Management Journal, 25: 201-221.

ROWLEY T, Behrens D and Krackhardt D. (2000) Redundant Governance Structures: An Analysis of Structural ad Relational Embeddedness in the Steel and Semiconductor Industries. Strategic Management Journal, 21, 369-86.

UZZI B (1997) Social Structure and Competition in Interfirm Networks: The Paradox of Embeddedness. Administrative Science Quarterly, 42(1): 35-67.

WASSERMAN, S and Faust, K (1994) Social Network Analysis: Methods and Applications. New York and Cambridge, Cambridge University Press.

----

ButtonReturn to Contents of this issue

© Copyright Journal of Artificial Societies and Social Simulation, [2008]