©Copyright JASSS

JASSS logo ----

Roy Wilson (2007)

Simulating the Effect of Social Influence on Decision-Making in Small, Task-Oriented, Groups

Journal of Artificial Societies and Social Simulation vol. 10, no. 4 4
<https://www.jasss.org/10/4/4.html>

For information about citing this article, click here

Received: 24-Mar-2007    Accepted: 15-Jul-2007    Published: 31-Oct-2007

PDF version


* Abstract

This paper describes a simulation study of decision-making. It is based on a model of social influence in small, task-oriented, groups. A process model of dyadic social influence is built on top of a dynamic model of status and task participation that describes the emergence of a stable power and prestige order. Two models of group decision-making are examined: a static model for which the beliefs of actors do not change, and a process model for which they do as a function of the standing of each member of each interacting pair in the evolving power and prestige order. The models are compared on a set of N=111 cases, each requiring an affirmative or negative group response to a proposition A(c) that pertains to a case c. Initial beliefs are assigned to each of five members of distinct professions based on an analysis of independently collected behavioral data pertinent to the proposition to be affirmed or denied in each case. Although the two influence models yield identical decisions in 70% of the cases examined, the differences between them are statistically significant and in several instances show a medium effect size. Most importantly, the differences can be explained in terms of social influence and the status and task participation model on which it depends.

Keywords:
Social Influence; Decision Processes; Social Networks; Group Dynamics; Simulation; Agent-Based Modeling

* Introduction

1.1
This paper describes a model of how social influence affects belief and, through it, group decision-making. This model is built, logically speaking, on top of a model of status and task participation (Skvoretz and Fararo 1996) that takes into account the emergence of a stable power and prestige order within each small, task-oriented, group. The model of status and task participation is itself an abstraction of expectation states theory (EST), a prominent theory of how status systems emerge in small groups that has received more empirical support than any other (Bruins and Wilke 1992). As discussed in 9.5, one assumption of the model tends to rule out the emergence of coalitions. Nevertheless, the study is important because it suggests a principled method by which one may identify some of the social elements of decision-making in small, task-oriented, groups.
1.2
The major sections of the paper are as follows. Section 2 discusses belief as it pertains to the members of different professions. The next section concerns expectations, predictions that a member contribution will lead toward group success or failure at the group task. Section 4 describes two models of group decision-making, a process model that takes social influence into account and one which does not. Section 5 describes the sense in which an agent-based model is used in the simulation. In section 6, the simulation variables are presented. In section 7, the outcomes obtained from the simulation based on a process model of decision-making are described and statistically analyzed. In section 8, these outcomes are explained in terms of the status and task participation model and the process model of decision-making. Section 9 the method and findings are discussed. In section 10, related work is discussed. Finally, several directions for future work are described.

* Beliefs

2.1
One anthropologist takes culture to be each individual's "… theory about what his[/her] fellows know, believe, and mean. Culture is then an idealized body of competence differentially distributed in a population, yet partially realized in the minds of individuals … " (Keesing 1981). In this paper, knowledge is regarded as a kind of belief. It is assumed, contrary to fact, that professionals of a given type have the following theory about what their fellow professionals know, believe, and mean: "they know, believe, and mean what I know, believe, and mean." Based on their professional socialization, each actor a (of occupational type s) has the same knowledge, the same beliefs, and the same meanings as his fellows when entertaining a proposition that falls within the scope of her professional interests and activities. Cognitively speaking, professional birds of a feather flock together (as discussed in section 9, necessity is the mother of this radical simplification).
2.2
In order to earn the rewards of service, professionalized or professionalizing coalitions of workers must compete for the opportunities of service. Wright distinguishes between expert, semi-skilled or semi-credentialed, and un-skilled or un-credentialed workers. This, albeit crude, typology makes it possible to analyze intra-professional competition because it suggests a differential distribution of skill/credential and organizational assets that enables and constrains the actors (Mayer 1994).
2.3
The partial view of each occupational group is reflected in what has been termed the exclusionary scheme of that group (Abbott 1988). Each profession/discipline offers an approach (and, hence, a solution) to research (and, sometimes, practical) problems that reflects a distinctive combination of ontology, epistemology, and methodology (Sowa 1984). The professions compete for jurisdiction on the basis of "different exclusionary schemes in diagnosis, inference, and treatment" (Abbott 1988). Such exclusionary schemes express the propositional content of professional belief systems.

* Expectations

3.1
By formalizing an expectation as an expectation state and relating expectation states to patterns of social relations it is possible to determine whether, in a simulated world, differences in professional status and belief yield systematically different collective decision outcomes. As suggested by Figure 1, the task-relevant communicative acts of persons (by which they attempt to exert social influence) are constrained and enabled by expectations states which, in turn, are constrained and enabled by the evolving social relations that exist between members of the task group. An examination of the ontological underpinnings of Figure 1 is underway in relation to (David et al. 2005).

Observable


Unobservable (inferred)


Unobservable (inferred)

Communicative acts

Social relations

Expectation states


Figure 1. The social system

Expectation States Theory

3.2
Readers familiar with expectation states theory may wish to proceed to the next subsection, which treats an extension of that theory. Expectation states theory (hereafter EST) assumes a set of actors who share a preferred task outcome, a standard for evaluating whether a behavior will lead to task success, and a commitment to the completion of the group task (Berger et al. 1985). It is assumed that group members share "beliefs about the existence and characteristics of physical and social objects" and "about the nature of cause and effect".
3.3
It is also assumed that members of a social group often act consistent with particular sets of "statements about what is desirable [i.e., goals] and how to evaluate what is happening [i.e., values]". Consider, for example, a discussion group or committee focused on a complex topic such as human relations. It is sometimes the case that
these groups have a set of beliefs about 'human nature' and the organization of work and family that allow the participants to interpret the 'facts' in the human relations case. (Meeker 1994)
Of course, not all such groups exhibit consensus regarding goals and values: EST is not applicable to these groups.
3.4
It seems reasonable that if group members share a goal, then they are more likely to agree on what constitutes task success and failure. It also seems reasonable, though hardly universal, that group members regulate their behavior in order to achieve success. Shared goals and beliefs concerning cause and effect, even if contrary to fact, generate "valued behavior standards, … the standards by which group members assess how likely an act is to lead to success" (Meeker 1994).
3.5
A performance expectation is a prediction about the quality of a future task-related behavior by a member of the group, which can be self as well as other. If it is predicted that the behavior will lead to task success, then the performance expectation is designated as H (High); if it is predicted that the behavior will lead to task failure, then the performance expectation is designated as L (Low); if no prediction is made, then the performance expectation is undefined.
3.6
A performance expectation state is a relation between two performance expectations. If a "believes" (consciously or otherwise) that his/her task-relevant behavior will lead to task success and that d's task-relevant behavior will lead to task failure, then a's performance expectation state with respect to d is denoted by the ordered pair (H,L). Although it is useful for initial exposition to designate a performance expectation state as a pair of performance expectations, it computationally useful to define an expectation state as a continuous, signed, quantity. The expectation state associated with actor x is denoted e(x). A positively valued e(x) indicates that actor x is connected, in a social-psychological sense, to group task success (symbolized as T(+)). A negatively valued e(x) indicates that actor x is connected to group task failure ( T(-)). The magnitude of e(x) indicates how strongly x is connected to either T(+) or T(-). The calculation of expectation states as continuous, signed, quantities is described below in the context of Status Characteristics Theory, a branch of EST.

Status Characteristics Theory

3.7
Several dozen social psychology experiments have been conducted based on EST. The results suggest that "… [task-]external status differences among members of a task group determine the distribution of power and prestige within the group" (Berger et al. 1966) and that rates of participation are positively correlated with social influence (Balkwell 1994). The plausibility of EST is inherited by Status Characteristics Theory (hereafter SCT), though it too is associated with a strong experimental tradition. SCT assumes that task-external status information and task-internal behavior information affect the formation of social relations, and hierarchy, within groups. A status characteristic is "any attribute possessed by members of a group whose culturally specified meaning is such as to make it potentially relevant to performance at [or, on] the group's task" (Balkwell 1994). Status characteristics can be diffuse or specific.
3.8
Age, gender, race, ethnicity, and education are designated as diffuse status characteristics because in many societies, most people believe (or act as if they believe) them to be associated with differential levels (and, perhaps, types) of performance across a broad range of tasks. On the other hand, the ability to perform mathematical calculations is a specific status characteristic because it is believed in many societies to have few (if any) implications for performance on non-mathematical tasks, such as writing haiku poetry. Finally, the beliefs considered by SCT need not be true: it is assumed that if persons believe something to be true, they act as if it is true.
3.9
SCT is based on four postulates concerning how status processes operate in small, task-oriented, groups. Two of these are especially important for understanding how expectation states are computed. First, the salience postulate asserts that any status characteristic which discriminates among the members of a task group will tend to become a salient element in group interaction, unless there is a cultural belief that the attribute is irrelevant to the particular task. Second, actors process all salient characteristics of every member in the group, generating an aggregate performance expectation state for each group member. SCT uses a graphical model, described below, to compute expectation states based on how the actors in a small, task-oriented, group define the task situation.
Computing Expectation States
3.10
The purpose of this subsection is to enable the reader to understand how expectation states are computed. Figure 2 depicts a generic definition of the situation: that is, how actors a and d associate themselves with various elements (designated as X, Y, Z and, ultimately, T) of the task situation. As with T(+) and T(-), X(+) represents the H state of status characteristic X so that actor a is associated with the H level of X while actor d is associated with the L level of X. For example, if X designates the characteristic of "general intelligence", X(+) indicates that a is thought to possess "high intelligence". A detailed discussion of how a cognitive model such as Figure 2 is constructed can be found in (Berger et al. 1977).

a

X(+)

Y(+)

Z(+)

T(+)


-


d

X(-)

Y(-)

Z(-)

Z(-)

Figure 2. A social-psychological definition of the situation

3.11
A definition of the situation such as that shown in Figure 2 makes it possible to compute the expectation state associated with each actor. Path length is determined by the number of lines and arrows in the path. In Figure 2 there are paths of length: 4 from a (d) to T(+) ( T(-) ) and 5 from a (d) to T(-) ( T(+) ). The sign of a path from an actor to a task outcome is determined by multiplying the sign of all lines/arrows along the path and the sign of the outcome. Unless otherwise indicated, all lines and arrows are positively signed. The path from a to T(+) in Figure 2 is a positive path and the path from d to T(-) is a negative path. In addition, the path from a to T(-) is positive since the sign is determined by the product of the negative sign that connects X(+) and X(-) and the negative sign associated with T(-). SCT makes assumptions about how multiple paths and path lengths affect expectation states.
3.12
If there are n paths connecting an actor to the task outcome, each represented as p(i), the combination of these paths is symbolized as p(1)∪p(2) … p(n - 1)∪p(n). By the second postulate of SCT listed above, actors process all salient status information. If an actor is connected to the task outcomes by multiple paths, the strength of the connection between the actor and the task outcome must take into account all such paths.
3.13
Let f(p) represent the how strongly an actor is connected to the task outcome when the length of the path connecting the actor to the outcome is p. By assumption, the shorter the path, the more strongly connected is the actor and the more positive or negative will be the expectation states associated with that actor. The strength of the path from p to the outcome is defined so that 0 < f(p) < 1. Hence, in Figure 2, actor a is most strongly connected to T(+) and actor d is most strongly connected to T(-). I now use f(p) to calculate simple (versus aggregate, defined below) expectation states for each of a and d.
3.14
In Figure 2, there are two paths from each actor to the task outcome, so p(1) = 4 and p(2) = 5. As described in (Berger et al. 1977), the strength of the connection between an actor and the task outcome via the combination p(1)∪p(2) … p(n - 1)∪p(n) is given by

f(p(1) ∪ … ∪ p(n)) = 1 - [(1 - f(p(1))) × … × (1 - f(p(n)))] (1.1)

3.15
This simple model of path strength has performed well as a predictive element in a number of social-psychological experiments. It turns out that f(4) = 0.1358 and f(5) = 0.0542 (derived in (Fisek et al. 1991)), so that (1 - f(4)) × (1 - f(5)) = 0.8642 × 0.9458 = 0.8174. Hence, a and d are each connected to the task outcome by a path of strength 1 - 0.8174 = 0.1826.

The value of e(x) is computed as the sign of the paths in the combination times the strength of combination of paths from x to the task outcomes. e(a) > 0, so (via equation (1.2)) the simple expectation state associated with a is (collective) task success. Similarly, because e(d) < 0, d is linked by the simple expectation state to (collective) task failure. Note that the prefixed sign in equations (1.2) and (1.3) is determined by the sign of the paths leading from the actor to the task outcome.

e(a) = +1 × (1 - [(1 - f(4) × (1 - f(5))]) = +0.1826 (1.2)

e(d) = -1 × (1 - [(1 -f(4)) × (1 - f(5))]) = -0.1826 (1.3)

3.16
I term the above expectation states simple because they assume a definition of the situation involving only two actors. With more actors, there are more paths to T(+) and T(-), requiring a generalization of the simple expectation state. In SCT, summing the simple expectation states associated with an actor x over all positive paths (denoted ae(x+)) and all negative paths (denoted ae(x-)) yields the aggregate expectation state associated with x, denoted ae(x). If ae(x) < 0 then the performance output (behavior) expected from x is one believed to lead to T(-).
3.17
In general, given any pair of actors, there is one pair of paths from each actor to the task outcome: one of length 4 and one of length 5. If actor x is connected to task outcomes by k pairs of positive paths and if x is connected to task outcomes by j pairs of negative paths, then

ae(x) = 1 – 0.8174k (1.4)

ae(x-) = -(1 - 0.8174j) (1.5)

ae(x) = 0.8174j - 0.8174k (1.6)

3.18
Given a directed graph that describes the pattern of social relations amongst the actors at time t, equation (1.6) makes it possible to compute the aggregate expectation states at that moment.
From patterns of social relations to expectation states
3.19
It sometimes happens that some actor a "takes the lead" in relation to the group task, usually by performing task-related behaviors at a relatively high rate: that is, a has precedence over d. The network of precedence relations that has formed with respect to a group can be depicted in a graph such as Figure 3. Once a precedence relation forms between two actors, an aggregate expectation state can be calculated for each actor. Each precedence relation presupposes that there exists in the underlying definition of the situation a pair of positive paths and a pair of negative paths. The logic is that, if actor a has precedence over actor d in the precedence graph, it must be because a is more strongly connected to T(+) in the underlying cognitive definition of the situation that they (are assumed to) share.
3.20
The direction of the arrow from actor a to actor d in the directed graph in Figure 3 is indicates that actor a has precedence over actor d. This implies that actor a is connected to the task outcome by two positive paths while actor d is connected by two negative paths. Since w has precedence over d in Figure 3, there are two positive paths from w and two additional negative paths from d to the task outcomes in the underlying definition of the situation (similar to Figure 2). In addition, actor d has precedence over z, so d also has a pair of positive paths whereas z has a pair of negative paths to the task outcomes.

a

d → z

w
Figure 3. Sample precedence graph

3.21
When applied to Figure 3, equation (1.6) yields the aggregate expectation states shown in Table 1. To illustrate, here

ae(d) = 0.81742 - 0.81741 = -0.1493 (1.7)

3.22
As indicated by Table 1, actors a, w, and z are more strongly connected to a task outcome than actor d. Actors a and w are connected to T(+) and actors d and z to T(-). Actor d is less strongly connected to T(-) than actor z. These differences are important because aggregate expectation states govern which dyad will next engage in communication.

Table 1: Initial aggregate expectation states derived from Figure 3


Actor x

k pairs of positive paths

j pairs of negative paths

ae(x)


(In degree of actor node)

(Out degree of actor node)


a

1

0

+0.1826

w

1

0

+0.1826

z

0

1

-0.1826

d

1

2

-0.1493


The Status and Task Participation Model

3.23
The status and task participation model of small-group interaction developed by Skvoretz and Fararo is derived from E-state structuralism. An E-state is an abstraction from an expectation state. E-state structuralism analyzes the formation and dissolution of network ties by merging the abstract core of expectation states theory with social network analysis. The method has been used to model dominance structure formation in infra-human populations (Fararo 1989).
3.24
It is assumed in the status and task participation model that E-states, and the precedence ties that form on the basis of them, are complementary. Analogously to EST, as described above, this means that if the E-state of actor a with respect to actor d is H, then the E-state of d with respect to a is L. It is possible to allow non-complementary E-states to form. In a simulation study of an E-state model closely resembling the status and task participation model it was found that non-complementarity in the formation of E-states almost always resulted in actor triads characterized as coalitions in which two actors (who deferred to each other) each dominated a third (Fararo et. al 1994). An E-state model based on complementarity, on the other hand, tended to generate hierarchies in which one actor dominated two actors, and one of the two dominated the other. The subsequent status and task participation model assumed complementarity in the formation of E-states for reasons of simplicity. Because this study is based on the status and task participation model, complementarity is also assumed. The implication of this assumption is discussed in section 9.
3.25
The model of status and task participation has three system control parameters (η, π and θ) that come into play when one actor addresses another. They govern the both the formation of precedence relations and, therefore, the computation of aggregate expectation states, as illustrated above. The η parameter represents the probability that a communicative act involving two actors of different task-external status triggers the formation of a precedence relation between the two interactants. The π parameter represents the probability that a communicative act involving two interactants triggers the formation, based on task-internal behavior, of a precedence relation between the two. The θ parameter represents the probability that, for each observer of an interaction, a communicative act involving two interactants triggers the formation of a precedence tie between the observer and one or both of the interactants. These parameters probabilistically guide an axiomatically specified model.
3.26
Each axiom, informally expressed, is summarized as follows. A small, task-oriented, group begins with no task-related social structure (Axiom 1). This restriction can be weakened to allow for an initial, partial, social structure. As result, all actors begin with the same aggregate expectation state so that it is by chance alone that, in the first interaction of the meeting, a particular actor x addresses actor y (Axiom 5). A precedence relation between two interactants may form based on either task-related behavior or task-external status (Axiom 3). Once a precedence relation forms, it endures for the lifetime of the task group (Axiom 2). This restriction can also be relaxed. Not only do precedence relations form between interactants, but also between observers and interactants (Axiom 4). After a precedence relation forms, the next communication dyad is determined probabilistically based on the newly updated aggregate expectation states of the actors (Axiom 5). So, the formation of a precedence relation generates a change in aggregate expectations states that in turn conditions the formation of future precedence ties. These axioms are discussed in detail in (Skvoretz and Fararo 1996).

* Models of Decision-Making

4.1
Beliefs animate action. Let c denote a case that pertains to some person. Let A(c) denote a proposition pertaining to c. In this study, each actor a is assigned an initial belief regarding A(c), denoted B(i, a, c), a real number in the interval [0.0, 1.0]. That assignment is based on an analysis of the previous behavior of actors of the same type. The value 0 signifies complete lack of belief, and the value 1 complete certitude. When B(i, a, c) is less than 0.5, this signifies that actor a rejects A(c). It is assumed that, other things being equal, each actor engages in communicative acts in order to bring about a collective decision that is consistent with her individual beliefs.

A Static Model

4.2
Assume one knows the values of B(i, a, c) in a meeting where a collective decision is to be made concerning A(c). One decision rule is to reject A(c) if the average value of B(i, a, c) is less than 0.5. I term this model of influence static because the initial beliefs of the actors do not change, so that the collective outcome is determined entirely by the initial beliefs.

if ΣB(i, a, c)/5 < 0.5 then O(i, c) = 0 else O(i, c) = 1 (1.8)

A Process Model

4.3
The status and task participation model does not itself represent the influence of each actor, but it does provide information about the evolving task-internal status of actors. Change in belief is modeled as a function of social influence in dyads (Balkwell 1991), which itself reflects the emerging social structure of the group as defined in terms of a (evolving) network of precedence relations.
4.4
Let Δ(ae(a), ae(d)) = ae(a) - ae(d) where actor d has just been addressed by actor a. If Δ(ae(a), ae(d)) > 0, then actor a has an expectation advantage over d. If Δ(ae(a), ae(d)) < 0 then d has an expectation advantage over a. The notion of expectation advantage is that one actor is more likely to be granted, or take, an opportunity to make a task-relevant contribution.
4.5
To illustrate, reconsider Table 1. Actor a has an expectation advantage over actor d because ae(a) > 0 and ae(d) < 0; not surprising since it was hypothesized that a had precedence over d. Given the assumptions of EST, if actor d at time t has an expectation advantage over actor z, so that d is more closely linked by the group to T(+), then if d addresses z, z is likely to be influenced. The question is, of course, by how much?
4.6
Stating the matter more generally, the probability that actor y maintains (or stays in) his belief regarding A(c) after being addressed by actor x is denoted by p(y, S)and is computed as follows:

δ = Δ(ae(x), ae(y)) (1.9)

num = e(0.472 + 0.632 × δ) (1.10)

p(y, S) = num / (num + 1) (1.11)

4.7
Using the data in Table 1, suppose actor a addresses actor d. This implies that Δ(ae(a), ae(d)) = 0.1826 – (-0.1493) = +0.3319, num = 1.9774 and p(d, S) = 0.664. Hence, the probability that d changes his mind is equal to 0.435. The arguments to the exponential function in equation (1.10) were taken from (Balkwell 1991). Equation (1.11) has been found to adequately account for results from a variety of empirical studies of dyadic influence (Balkwell 1991). As the expectation advantage of x over y decreases/increases, the probability that y changes his mind after being addressed by x also decreases/increases.
4.8
In this paper, though not in the status and task participation model, the value of p(d, S) is used to compute the degree to which d changes her mind concerning A(c) after being addressed by a. B(u, d, c), the updated belief of d, is a weighted average of the prior belief of d, and the current belief of a, regarding A(c). The update occurs after d has been addressed by a. It follows from equations (1.12) through (1.14) that if a and d hold identical beliefs regarding A(c), then the fact that a addresses d has no effect on the strength of d's belief regarding A(c).

r = p(d, S) × B(i, d, c) (1.12)

s = [1 - p(d, S)] × B(i, a, c) (1.13)

B(u, d, c) = r + s (1.14)

4.9
As group interaction unfolds, new precedence ties form. Each new tie changes the aggregate expectation states of the actors. By virtue of equation (1.14), the beliefs of the actors also change. At the end of each simulated meeting, a collective decision regarding A(c) is made according to the following rule, where B(f, a, c) denotes the final belief of actor a:

if ΣB(f, a, c) / 5 < 0.5, then O(f, c) = 0 else O(f, c) = 1 (1.15)

* Agent-based Simulation

5.1
The simulation is agent-based in the following sense. Each actor is represented as a distinct computational process using the JCSP (Java Communicating Sequential Processes) library (Welch and Austin 2003), written in the Java programming language. The behavior of each simulated actor is a stochastic function of the emerging social structure. Readers unfamiliar with object-oriented programming can skip the remainder of this section without loss of continuity.
5.2
The Java code for the class Person is given in Figure 4. below. Each object of type Person has exclusive access to the (private) variables that differentiate its behavior from other identically typed objects. The behavior of each Person object is a stochastic function of the variable _socialStructure which is shared amongst the simulated actors. Because the Person class is derived from the CommNode class, much of the code of the Person code is actually defined elsewhere. The shared variable _socialStructure is accessed by each actor using a Concurrent Read Exclusive Write (CREW) protocol. The Java code and input data used for the simulation are available upon request.

/**
 * Each object of this class represents a Person. A Person is conceived as a
 * semi-autonomous entity and is represented by a CSProcess. CSProcesses
 * communicate over channels. 
 *  
 */
public class Person extends CommNode implements ISocialStructure {
 
                private SocialStructure _socialStructure;
                private Crew _socialStructureCrew;
                private TurnCrew _turnCrew;
                final CSTimer timer = new CSTimer();
 
                /**
                 * @param nodeId
                 * @param simParameters
                 * @param chanParameters
                 * @param belief
                 */
                public Person(
                     int nodeId, 
                     SimParameters simParameters,
                     ChanParameters chanParameters, 
                     Belief belief) {
 
                              super(nodeId, simParameters, chanParameters, belief);
 
                              _socialStructure = _simParameters.get_socialStructure();
                              _socialStructureCrew = _simParameters.get_socialStructureCrew();
                              _turnCrew = _simParameters.get_turnCrew();
                }
 
                // Each actor competes for a conversational turn
                private synchronized boolean is_my_turn() {
 
                                boolean retval = false;
 
                                _socialStructureCrew.startRead();
                                int current_x = _socialStructure.get_current_x();
                                int current_y = _socialStructure.get_current_y();
                                _socialStructureCrew.endRead();
                                
                                if (current_x == _my_nodeId) {
                                                _tgt_nodeId = current_y;
                                                retval = _turnCrew.claim(_my_nodeId);
                                }
                                return retval;
                }
 
                // simulate processing of incoming message
                public void simulate_reader(int other_actor) {
                                
                                _turnCrew.release();
                                timer.sleep(_simParameters.get_worktime(_my_nodeId));
                                
                                _socialStructureCrew.startRead();
                                double ps_focal = _socialStructure.compute_PS(other_actor, _my_nodeId);
                                _socialStructureCrew.endRead();
                                
                                _belief.update(_my_nodeId, other_actor, ps_focal);
                }
 
                // simulate formulation of outgoing message
                public void simulate_writer(String msg) {
 
                                timer.sleep(_simParameters.get_worktime(_my_nodeId));
                                write_msg(update_msg(_normal_msg_out));
                }
 
                // Each actor is modeled as a computational process
                public void run() {
 
                                Message msg_in = null, msg_out = null;
 
                                // Once initiated, run until 'poison' received from upstream
                                while (!_poison_rcvd) {
                                                // If there is a message, read it and handle it
                                                if (_chanParameters.get_medium2person(_my_nodeId).pending()) {
                                                                msg_in = read_msg(_simParameters.get_pkt_src_type());
                                                                _poison_rcvd = false;
                                                                if (msg_in.is_Poison()) {
                                                                                // Forward the poison downstream
                                                                                msg_out = construct_msg_out(ICommNode.SEND_POISON);
                                                                                msg_out.set_content(_belief.get_datum_my_nodeId());
                                                                                write_msg(msg_out);
                                                                                _poison_rcvd = true;
                                                                }
                                                                simulate_reader(msg_in.get_src_nodeId());
                                                }
                                                if (!_poison_rcvd && is_my_turn()) {
                                                                simulate_writer("Writer Cognition");
                                                }
                                }
                }
}

Figure 4. The Person class

* Simulation Variables

Control Variables

6.1
In order to prepare a framework for more realistic modeling of actors, the simulation is based on real, versus discrete, time. This aspect of the study is suppressed here for reasons of space. The value assigned to interactions in Table 2 is derived from the empirical study of small, task-oriented, groups reported in (Smith-Lovin et al. 1986) and represents the average number of dyadic interactions that might occur amongst five group members (Teacher, Principal, Nurse, Social Worker, and Counselor) during a forty minute meeting. The value of interactions functions as a stopping criteria for each run of the simulation and as the basis for estimating a "think" time for each actor after that actor has been addressed by another.

Table 2: Control variables and their values

Variable

Value

interactions

375 per meeting

lifeThinkTime

6.4 seconds


Input Variables

6.2
The input variables are listed, along within their ranges, in Table 3. There are three types of input variable: system parameter; individual belief; and task-external status. The variables associated with each type are described below.

Table 3: Input variables and their values

Variable

Value(s)

η

{0.625, 0.75}

π

{0.50}

θ

{0.25}

B(i, x, c)

For each x and each c, a fixed value in [0.0, 1.0]


B(i, c)

Vector of initial beliefs of group members regarding A(c)

status

{(H, M, M, L, M), (H, M, M, M), (M, M, M, L, M), (H, M, M, H, M)}


System parameters
6.3
The values assigned to the variables η, θ and π were drawn from those used in (Skvoretz and Fararo 1996). Each variable functions as a threshold against which an independently drawn pseudo-random variate is compared. After some actor x addresses some actor y, three pseudo-random numbers are generated and each is tested against the relevant threshold value. If a threshold is exceeded, one or more dyadic precedence relations are formed.
6.4
For simplicity, it is assumed that precedence relations are: (1) most likely to form on the basis of status difference (governed by η); (2) less likely to form on the basis of behavior (governed by π); least likely to form on the basis of observation (governed by θ). The values assigned to η, π and θ thus affect the evolution of the social network and, for the process model of influence, the occurrence and efficacy of attempts at influence by members of the task group. The parameter η is varied in order to assess the effect of differences in the weight actors give to status differences (when they exist).
Initial beliefs
6.5
A national level dataset obtained from a government-funded source made it possible to extract a subset of N = 111 records such that, for each case c, a value was available for each of seven features, one of them being the profession of the person who had affirmed A(c). Each affirmative decision was rendered by an individual, working in an elementary school as one of the following: Teacher, Principal/Administrator, Nurse, Social Worker, and Counselor. The variable B(i, s, c) represents the belief of a professional of type s (who rendered an affirmative decision on one case out of 111) when confronting one of the other 110 cases that the actor had not (by assumption) confronted.
6.6
The first step in assigning a value to B(i, s, c) was to develop a set of rules using a well-known classifier. The input to the classifier consisted of 111 records, each recording seven feature-value pairs defined for a case c (one being the type s of education professional that rendered the affirmative decision regarding c). The output of the classifier consisted of a set of if-then rules which, given the feature-value pairs associated with a particular case c, predicted the type of the professional who affirmed A(c). The rules were then used to compute a value in [0, 1] and assign it to B(i, s, c).
6.7
It is assumed that education professionals are not necessarily of one mind concerning when to affirm A(c). Consistent with the view that the system of professions is marked by jurisdictional competition between the professions on the basis of "different exclusionary schemes in diagnosis, inference, and treatment" (Abbott 1988), different aspects of the cases turned out to be salient for different occupations.
6.8
Those entries of Table 4 that exceed 0.30 in absolute value are taken as roughly indicative of relatively strong agreement or disagreement between pairs of education professional types. For example, the modeled beliefs of the Counselor type show relatively strong disagreement with the modeled beliefs of the Nurse type, as indicated by a correlation of -0.314. Likewise, the beliefs of a Counselor are in relatively strong disagreement with the beliefs of a Teacher type: the two are negatively correlated (-0.389). The absence of relatively strong agreement amongst any pair of actor types suggests that, as modeled, the initial beliefs of different actor types were indeed differentiated.

Table 4: Correlations among the initial beliefs of actor types


Principal

Social

Nurse

Teacher

Counselor


Worker


Principal

+1


Social Worker

+0.124

+1


Nurse

-0.153

-0.336

+1


Teacher

-0.011

+0.082

-0.346

+1


Counselor

+0.013

-0.012

-0.314

-0.389

+1


Status
6.9
As shown in Table 3, the domain of the vector variable status consists of four vector elements. Each element represents the assignment of one of the three status values L (Low), H (High), M (Middle) to each of five types of actor based on the school organizational resources that they control. Note that the status of each actor is clearly related to the position they occupy in the school setting, so this position is not regarded as an node in a network (as, for example, in (Bruins and Wilke 1992)). Each value of the status variable represents the status assigned to the ordered tuple (Principal, Social Worker, Nurse, Teacher, and Counselor). Sociological social psychology highlights the role of task-internal behaviors (however generated) in explaining the emergence of (precedence) structures in small, task-oriented, groups (Lawler and Markovsky 1993).
6.10
It is not claimed that the baseline status value (H,M,M,L,M) best represents the actual distribution of status, but that it is plausible for typical elementary schools in the United States. Although there are 243 possible ways to assign the value of the status variable, I have chosen the four shown in order to assess how differences in the status of the Principal (H in the baseline) and the Teacher (L in the baseline) might affect the collective decision process.
6.11
For each case c, two simulation runs were made for each of the 8 combinations of values of the input variables listed in Table 3. A minimal, full-factorial, experiment requires 8 × 111 = 888 distinct runs of the simulator. The experiments were replicated four times, generating a total of 3552 distinct runs (less one due to a minor programming error).

Output Variables

6.12
Each simulation run generates a value for each variable listed in Table 5. Under the static model of decision-making, there is no need to simulate the interaction of actors, since it is assumed that actors simply cast their vote and each vote is weighted equally. The value of O(i, c) is determined by equation (1.8).
6.13
Under the process model of decision-making, change in belief is possible via equation (1.14). Once there is a precedence relation between every pair of actors, the social network is said to have reached structural equilibrium. Once this occurs, whenever an actor a addresses an actor d and a and d disagree, d's belief will change by a fixed amount. The last value of B(u, d, c) is assigned to B(u, f, c) and the value of O(f, c) is determined via equation (1.15).
6.14
Values of steps2equilibrium were collected in order to check the correctness of the simulation and for secondary analysis. Each of the 3551 simulated social networks reached structural equilibrium after an average of approximately 10 dyadic interactions: that is, a complete set of ties (20) existed amongst the five actors. The fact that complete sets of ties were formed in fewer than twenty dyadic interactions is explained by Axiom 4 whereby precedence relations may form between the observers of direct interaction and one or both of the observed interactants.
6.15
The value of participation(x) is a random variable that depends upon the aggregate expectation states of the actors throughout the simulation and is thus indirectly shaped by the values of η, θ and π. In turn, the values of participation(x) help explain the differences obtained in the simulated outcomes. The abstractness of the simulation model and the rudimentary nature of the simulation engine is such that there is no mechanism for modeling the dependence of participation(a) upon c.

Table 5: Output variables

Variable

Description

B(f, c)

Final belief of group members regarding A(c)

O(i, c)

A(c) under static model: 1 (true); 0 (false)

O(f, c)

A(c) under process model: 1 (true); 0 (false)

steps2equilibrium

# of interactions till the social network is complete

participation(x)

# of interactions in which x addresses some y


* Simulated Outcomes

7.1
Table 6 indicates that, in nearly 70 percent of the simulation runs, the two decision models yield identical decisions. It is perhaps reassuring that the two models of influence are not wildly divergent: After all, the static model does represent a commonsense understanding of group decision-making. On the other hand, sociological common-sense suggests that status sometimes matters in group decision-making. Unless that sociological common sense has no pragmatic value, we should expect the two decision models to generate a substantial number of different outcomes when the actors hold diverging initial beliefs. The purpose of this section is to show that they do.
7.2
A two-sided Fisher exact test (an exact cousin of the chi-square test) indicates that the attained statistical significance of the observed difference in proportions versus under the null hypothesis of their equality, is 1.57e–09. The effect size associated with the difference between the observed proportion and the proportion expected under the null hypothesis of no difference is calculated using the arcsin approximation described in (Dennis et al. 1997). This effect size is considered "medium" in social psychology (Glass and Hopkins 1996). So, the high level of agreement between the two decision models (0.694) is reliable and of moderate size. Attending only to agreement totals can, however, be misleading.

Table 6: The static and process models on A(c) (over all c)

Agree

Disagree

Total

Proportion Agree

2464

1087

3551

0.694


7.3
As shown in Table 7, the process model yields a greater proportion of affirmative decisions than the static decision model. This suggests that the social influence process shifts the initial beliefs of some actors towards the affirmative. This suggestion is confirmed by examining the ways in which the two models yield discrepant outcomes.

Table 7: The static and process models on A(c): More detail

Decision

Runs

Runs

Proportion

model

yielding 1

yielding 0

yielding 1

Static

1760

1791

0.4956

Process

2015

1536

0.5675


7.4
As shown in Table 8, the static and process models can disagree in two ways. It may happen that O(i, c) = 0 (from the Static model) while O(f, c) = 1 (from the Process model), which occurs in 671 instances: I term this a (0, 1) discrepancy. Or, it may happen that O(i, c) = 1, while O(f, c) = 0, which occurs in 416 instances: this is a (1, 0) discrepancy. It appears that a (0, 1) discrepancy is more likely than a (1, 0) discrepancy. A goodness of fit test using a 2 by 1 table with entries 671 and 416 (Levin and Serlin 2000) yields a statistic of 59.82, which is (statistically speaking) highly significant, Thus, we can reject the null hypothesis that the proportions of (0, 1) and (1, 0) discrepancies are equal. The effect size (0.17) is, however, small.

Table 8: Disagreement of the static and process decision models


O(f, c) = 0

O(f, c) = 1

Static Total

O(i, c) = 0

1120

671

1791

O(i, c) = 1

416

1344

1760

Process Total

1536

2015

3551


7.5
The analysis just given can be refined by applying it to the four subgroups defined by the values of status listed in Table 3. For each value of status distribution indicated in Table 9, the number of (0, 1) discrepancies exceeds the number of (1, 0) discrepancies by an amount sufficient to warrant rejecting the null hypothesis, using a chi-square test, of no difference between the static and process decision models. Put otherwise, when the two models disagree, the process model is more likely to yield an affirmation of A(c) when it is negated by the static model than yield a negation of A(c) when it is affirmed by the static model. This is consistent, as expected, with the analysis of the aggregate.
7.6
The proportion of (0,1) discrepancies obtained under each status value can also be compared. For the baseline status distribution, shown in row (a) of Table 9, slightly over 60 (= 100 × 152 / (152 + 100)) percent of the different outcomes obtained under the two influence models are (0, 1) discrepancies. As shown in row (b), when the task-external status of the Teacher is increased (with respect to row (a)), the proportion of (0, 1) discrepancies increases slightly. When the task-external status of the Principal is lowered (with respect to row (a)) from H to M, the proportion of (0, 1) discrepancies increases more noticeably. This suggests that it is the lowering of the task-external status of Principal that is most responsible for increasing the proportion of (0, 1) discrepancies. This suggestion is partly confirmed by the fact that, when the task-external status of Teacher is raised to H in row (d), the proportion of (0, 1) discrepancies decreases with respect to the baseline level.
7.7
The largest difference between the proportions obtained for each task-external status distribution occurs for status values (M,M,M,L,M) and (H,M,M,H,M): the proportion of (0, 1) discrepancies for the status values (M,M,M,L,M) and (H,M,M,H,M) is, respectively, 0.675 and 0.571 yielding a difference in the observed proportions of 0.104. Under a null hypothesis of no difference, the probability of obtaining an absolute difference as large as 0.104 is 0.0148 (obtained via a two-sided Fisher exact test) and the associated effect size is 0.27 somewhat larger than the "small" effect size of 0.18 typical of social psychology. Statisticians dispute whether, in situations such as these, α should be adjusted using the Bonferroni inequality: unable to enter the fray, I report the unadjusted value without comment.

Table 9: Static versus process outcomes (by status)


status

O(i, c)

O(f, c) = 0

O(f, c) = 1

χ2

%


for 2 × 2

0 → 1

(a) (H,M,M,L,M)

0

296

152


60.3


1

100

340


0.0011


(b) (H,M,M,M,M)

0

256

192


61.5


1

120

320


4.588e–05


(c) (M,M,M,L,M)

0

264

183


67.5


1

88

352


7.888e–09


(d) (H,M,M,H,M)

0

304

144


57.1


1

108

332


0.0234


* Explaining the Simulated Outcomes

8.1
Why should a difference in the assignment of task-external status to team members be associated with a difference in the proportion of (0, 1) discrepancies? As shown in Figure 5, for each status distribution [denoted by (a), (b), etc.], the mean values of participation(x) are consistent (in an ordinal sense) with the predicted outcomes: that is, the average participation of H status actors is greater than that of actors of the other two status levels. For example, the Principal has the highest rate of participation amongst the actors under status condition a, shown in blue. Across status values, the mean values of participation(x) for individuals with the same task-external status are not uniform. For example, the level of participation by the Principal, an actor ranked H on task-external status, differs between status condition (a) and status condition (d). These differences in participation help explain the pattern of discrepancies between the decision models because they show a difference in the number of occasions on which, under the process model, one actor can influence another.

Figure
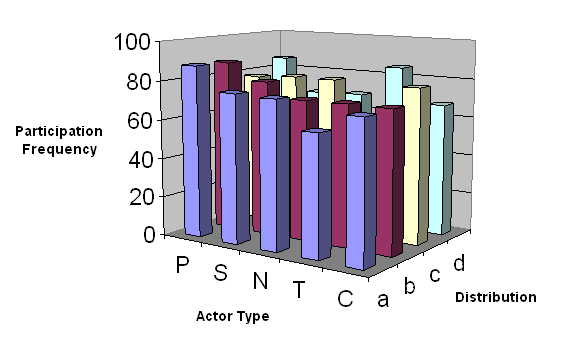
Figure 5. Variation in mean participation frequency

8.2
Actors with higher task-internal status initiated communication more often than actors with lesser task-internal status, but lower status actors were nevertheless able to address, and thus influence, higher status actors. For each actor x, each case c, and each simulation run r, there was a constant k(r) such that B(f, x, c) = k(r) to three decimal places. Convergence in opinion is consistent with work described in (Friedkin and Johnsen 2003). Each simulation run produces a sequence of dyadic interactions. Through equations (1.12) through (1.14), which express a convexity condition, the beliefs of the interacting actors are updated. Given enough interactions, the beliefs of all actors must (under the process model) converge to a common belief value (Goldberg 1976).

* Discussion

9.1
The statistical analyses in sections 7 and 8 suggest that variation in the status characteristics of actors can systematically affect the kinds of outcomes obtained from a collective decision process. The simulated outcomes obtained via a group-decision model that neglects status characteristics often agree with those obtained via a group-decision model that does takes such characteristics into account. The differences are not, however, simply due to random variation.
9.2
With the possible exception of (Fararo and Butts 1999), no model based on E-state structuralism has considered collective decision-making. One might wonder then, whether and when differences in status characteristics are enough to make a practical difference in a collective decision process. In other words, aside from its theoretical import, does the status and task participation model have any empirical import?
9.3
One way to address this question is to carry out a large number of experiments involving real persons engaged in group decision-making. Inducing a status characteristic is easily done in a dyadic setting: Each participant is brought to the knowledge/awareness of their own status and that of the other actor. In a group of five persons, each person would need to know their status in relation to every other member, thus requiring 20 dyadic status inductions per group before the group decision task could be undertaken. As the number of status distributions and the number of replications needed for reliable statistical inferences, the experimental approach might become very daunting indeed. Hence, a simulation approach was taken.
9.4
Doing so, of course, means that actual group decisions were not available for model validation purposes. On the other hand, the model is based on a body of theory for which there is considerable validation. It is also the case that the beliefs imputed to the types of actors considered were not assigned arbitrarily. Rather, inferences from actual behavior of individuals of given types was used to construct a model of belief for each type of actor that was consistent with the behavior of that type of actor. Although the simulation model is not the strongest it could be, it is stronger than simulation models which are driven merely by intuitions about, rather than observations of, actor behavior.
9.5
Finally, the simulation model used here inherits the assumption that E-states and, therefore, precedence relations are formed in a complementary way. As noted in 3.24, a non-complementary E-state model studied in (Fararo, et al. 1994) that is similar to the status and participation model tended to generate triadic coalitions no matter what values were assigned to the system parameters η, π and θ. This implies that the experimental results described in sections 7 and 8 are unlikely to reflect the higher proportion of triadic coalitions that would be expected if non-complementarity in E-state formation had been modeled. It may be the case that decision-making process in the setting assumed for this study is better characterized by a model geared to the formation of coalitions. This suggests that a model based on non-complementarity might be expected, on a priori grounds, to do a better job predicting the outcome of, for example, jury deliberations, the outcomes of which have been observed to be heavily influenced by the existence of coalitions.

* Related Work

10.1
In the power distance theory (PDistanceT) of Mulder, power is a desired resource and power distance is the difference in the power of two persons. According to the theory, the closer two persons are in power, the more strongly motivated is the less powerful person to acquire more power and the less strongly motivated is the more powerful person to protect his/her position. In a review of Mulder's 1977 book, Lawler rebuked him for failing to take into account Power Dependency Theory (PDependencyT) as initially formulated by Emerson (Lawler 1979).
10.2
According to (Molm 2001), older work in Social Exchange Theory (such as PDependencyT) maintained a focus on static, rather than dynamic, network structures. Several studies have empirically assessed certain aspects of PDistanceT using networks to represent power structures in organizations (Bruins et. al 1999; Bruins and Wilke 1992). From the empirical literature I have examined, it seems that PDistanceT is also oriented to static network structures, despite the experimental manipulation of network structure in these studies. In any case, the work described in this study differs from both PDistanceT and PDependencyT in that network structures are not experimentally manipulated, but emerge through interaction.
10.3
Molm (1994) has emphasized the distinction between a network and a group as forms of social organization. In these terms, EST is focused on the group, whereas PDistanceT and PDependencyT are focused on the network. E-state structuralism, the theoretical method employed in this study, aims to integrate expectation states theory with social network analysis and does so by examining the emergence of a social network within the small, task-oriented group. The work reported here is thus another step in the same direction.
10.4
Although Fararo and Skvoretz and (Hummon and Fararo 1995) employ discrete-event simulation, like (Hummon 2000) I use real-time, object-oriented, simulation. Whereas Hummon models each actor as a passive object and constructs a network to support interaction, I model each actor as an active object and formalize the social network as a system of communicating (sequential) processes (Hoare 1985; East 1995). The essence of an active object is nicely captured in the following: "Both its data and algorithms are private. The outside world can neither see that data nor execute those algorithms. Each process is alive, executing its own algorithms on its own data" (Welch and Austin 2003, Description of a CSProcess object). By contrast, neither the data nor the algorithms of a passive object are private: they are available to any other program with sufficient access privileges. In short, active objects are better suited to representing humans as (at least, semi-) autonomous beings.
10.5
Friedkin and Johnsen (2003) interpret expectation states in terms of social influence. As conceived here, due in part to a contribution by Fararo, social influence is instead grounded in expectation states. The virtues of the approach to modeling social influence taken in this paper are consistency with earlier work on expectation states theory and the resulting simplicity.

* Future Work

11.1
The work in this paper can be extended in several ways. First, it may be possible to extend the dynamic model by drawing on sociolinguistic accounts of the relationship between social distinction and linguistic behavior. Second, it is important to endow belief with the power to constrain social action: in the simulation described in this paper, belief plays no such constraining role in the unfolding interaction. Third, allowing E-states, and precedence relations, to form in a non-complementary way would give the model greater ecological validity. Work in these areas would go far to making the simulations and their results more believable and, thus, of greater import.

* References

ABBOTT A (1988) The System of Professions. Chicago, IL: University of Chicago Press.

BALKWELL J W (1991) From expectations to behavior: An improved postulate for expectation-states theory. American Sociological Review, 56, pp. 355-369.

BALKWELL J W (1994) "Status". In Foschi, M and Lawler, E J (Eds.) Group Processes: Sociological Analyses, Chicago, IL: Nelson-Hall.

BERGER J and Cohen, B P and Zelditch Jr, M (1966) "Status characteristics and expectation states". In Berger, J and Zelditch Jr, M and Anderson B (Eds.) Sociological Theories in Progress, Boston, MA: Houghton Mifflin.

BERGER J and Norman, R Z and Zelditch Jr, M (1977) Status Characteristics and Social Interaction. New York, NY: Elsevier.

BERGER J and Wagner, D and Zelditch Jr, M (1985) "Introduction: Expectation states theory. Review and assessment". In Berger, J and Zelditch Jr, M (Eds.) Status, Rewards, and Influence, San Francisco, CA: Jossey-Bass.

BRUINS J and Ellemers, N and De Gilder, D (1999) Power use and differential competence as determinants of subordinates' evaluative and behavioural responses in simulated organizations. European Journal of Social Psychology, 29, pp. 843-870.

BRUINS J and Wilke, H A M (1992) Cognitions and behavior in a hierarchy: Mulder's power theory revisited. European Journal of Social Psychology, 22, pp. 21-40.

COLLINS R (1988) Theoretical Sociology. San Diego, CA: Harcourt Brace Jovanovich.

DAVID N and Sichman, J and Coelho, H (2005) The logic of the method of agent-based simulation in the social sciences: Empirical and intentional adequacy of computer programs. Journal of Artificial Societies and Social Simulation, 8(4).

DENNIS M L and Lenox, R D and Foss, M A (1997) "Practical power analysis for planning substance abuse prevention and services research". In Bryant, K M and Windle, M and West, S G Recent Advances in Prevention Research Methodology: Lessons from Alcohol and Substance Abuse Research, American Psychological Association, Washington, DC.

EAST I (1995) Parallel Processing with Communicating Process Architecture. London, UK: UCL Press Limited.

FARARO T J (1989) The Meaning of General Theoretical Sociology. Cambridge, UK: Cambridge University Press.

FARARO T J and Skvoretz, J and Kosaka, K (1994) Advances in E-state Structuralism: Further studies in dominance structure formation. Social Networks, 16, pp. 233-265.

FARARO T J and Butts, C (1999) Advances in generative structuralism: Structured agency and multilevel dynamics. Journal of Mathematical Sociology, 24(1), pp. 1-65.

FISEK M H and Berger, J and Norman, R Z (1991) Participation in heterogeneous groups: A theoretical integration. American Journal of Sociology, 97, pp. 114-42.

FRIEDKIN N E and Johnsen, E C (2003) Attitude change, affect control, and expectation states in the formation of influence networks. Advances in Group Processes, 20, pp. 1-29.

GLASS E V and Hopkins, K D (1996) Statistical Methods: In Education and Psychology. Needham Heights, MA: Allyn and Bacon.

GOLDBERG R R (1976) Methods of Real Analysis. New York, NY: John Wiley and Sons.

HOARE C A R (1985) Communicating Sequential Processes. Englewood Cliffs, NJ: Prentice Hall.

HUMMON N P (2000) Utility and dynamic social networks. Social Networks, 22(3), pp. 221-249.

HUMMON N P and Fararo, T J (1995) Actors and networks as objects. Social Networks, 17, pp. 1-26.

KEESING R (1981) "Theories of culture". In Casson, R (Ed.) Language, Culture and Cognition: Anthropological Perspectives, New York, NY: Macmillan.

LAWLER E J (1993) Review of The Daily Power Game by Mauk Mulder. Administrative Science Quarterly, 24(1), pp. 145-148.

LAWLER E J and Markovsky, B (1993) "Sociological social psychology: A preface". In Lawler, E J and Markovsky, B (Eds.) Social Psychology of Groups: A Reader, Greenwich, CT: JAI Press.

LEVIN J R and Serlin, R C (2000) Changing students' perspectives of McNemar's test of change. Journal of Statistics Education, 8(2).

MAYER T (1994) Analytical Marxism. Thousand Oaks, CA: Sage Publications.

MEEKER B F (1994) "Performance evaluation". In Foschi, M and Lawler, E J (Eds.) Group Processes: Sociological Analyses, Chicago, IL: Nelson-Hall Inc.

MOLM L D (1994) Dependence and risk: Transforming the structure of social exchange. Social Psychology Quarterly, 57(3), pp. 163-176.

MOLM L D (2001) "Theories of Social Exchange and Exchange Networks". In Ritzer, G and Smart, B (Eds.) Handbook of Social Theory, London, UK: Sage Publications.

SKVORETZ J and Fararo, T J (1996) Status and participation in task groups: A dynamic network model. American Journal of Sociology, 101(5), pp. 1366-1414.

SMITH-LOVIN L J and Skvoretz, J and Hudson, C G (1986) Status and participation in six-person groups: A test of Skvoretz's comparative status model. Social Forces, 64(4), pp. 992-1005.

SOWA J F (1984) Conceptual Structures: Information Processing in Mind and Machine. Reading, MA: Addison-Wesley.

WELCH P H and Austin, P D (2003) Java Communicating Sequential Processes (JCSP) Library (Release Candidate 4), Kent, UK.

----

ButtonReturn to Contents of this issue

© Copyright Journal of Artificial Societies and Social Simulation, [2007]