© Copyright JASSS

JASSS logo ----

Klaus Jaffe and Roberto Cipriani (2007)

Culture Outsmarts Nature in the Evolution of Cooperation

Journal of Artificial Societies and Social Simulation vol. 10, no. 1
<https://www.jasss.org/10/1/7.html>

For information about citing this article, click here

Received: 09-Apr-2006    Accepted: 16-Nov-2006    Published: 31-Jan-2007

PDF version


* Abstract

A one dimensional cellular automata model, describing the evolutionary dynamics of cooperation when grouping by cooperators provides protection against predation, is used to compare the dynamics of evolution of cooperation in three settings: in G only vertical transmission of information is allowed, as an analogy of genetic evolution with heredity; in H only horizontal information transfer is simulated through diffusion of the majority's opinion, as an analogy of opinion dynamics or social learning, and in C, the analogy of cultural evolution, information is transmitted both horizontally (H) and vertically (V) as learned behavior is transmitted to offspring. Our results show that the evolutionary prevalence of cooperative behavior depends on the costs and benefits of cooperation so that: a) cooperation becomes the dominant behavior, even in the presence of free-riders (i.e., non-cooperators obtain benefits from the cooperation of others), under all scenarios, if the benefits of cooperation compensate for its cost; b) G is more susceptible to selection pressure than H achieving a closer adaptation to the fitness landscape; c) evolution of cooperative behavior in H is less sensitive to the cost of cooperation than in G; and d) C achieves higher levels of cooperation than the other alternatives at low costs, whereas H does it at high costs. Our results also suggest that a synergy between H and V is elicited making the dominance of cooperation much more likely under cultural evolution than under the hereditary kind where only V is present.

Keywords:
Social Simulation, Interactions, Group Size, Selfish Heard, Cultural Evolution, Biological Evolution

* Introduction

1.1
Biologists, economists, computer scientists and physicists have all worked to further our understanding of human and animal cooperation. Yet different premises underlay these efforts. The main difference among them is the assumption that social behavior arrived through biological evolution among animals, and that culture and rational decision making is a principal driver of the evolution of cooperation and sociality among humans (Richerson and Boyd 2004). Human cooperation seems to be molded by both cultural and biological forces (Lumsden and Wilson 1981; Cavalli-Sforza and Feldman 1981, 2003; Kurzban and Houser 2005) and using theories for biological evolution has provided a fertile ground to study the dynamics of processes governed by cultural evolution, such as human cooperation (Hammerstein 2004) and economics (Nelson and Winter 1982). However, important differences between the dynamics of cultural evolution (deWaal 2001; Richerson and Boyd 2004; Ehrlich and Levin 2005) and biological evolution (Pagel and Mace 2004; Nowak and Sigmund 2004) exist, although both processes are often mixed up when studying the evolution of cooperation (see Nowak and Sigmund 2005, for example). A fundamental difference between both kinds of evolution is the interplay of genotype and phenotype in biological evolution that is absent in the cultural kind. Possibly, fundamental differences in the direction of information flow, either only vertically in biological evolution and horizontally in social processes are also important. This is the subject of the present experiment in silico.

1.2
Attempts at explaining the maintenance of societies in these biological terms have invoked mechanisms such as kin selection (Hamilton 1964), need for parental investment through the establishment of families (Queller et al. 1988) or colonies (Gadagkar 2001), positive fitness effects (Lehmann and Keller 2006), and economic "added values" of social relationships, by which social individuals receive more synergistic benefits than loners (Jaffe 2001). A particular example of biological process maintaining sociality is that of the "selfish herd," a concept introduced by Hamilton in 1971. It explains why animals are less at risk when the density of conspecifics around them is greater and hence, supports the hypothesis of the origin and maintenance of grouping behavior based solely on selective grounds, without further need of additional assumptions. Indeed, previous results suggest that critical group size is the parameter that often determines the maintenance of primitive social behavior in populations (Cipriani and Jaffe 2005).

1.3
Processes invoked to explain the emergence and maintenance of cooperation in a more sociological setting include: reciprocity or mutualistic interaction, originally proposed by Axelrod and Hamilton (1981), supported by important theoretical and empirical results (see Nowak and Sigmund 2004) and possibly working across species (Osborn and Jaffe 1997); indirect reciprocity, in which individuals help others in order to uphold their reputation, increasing their chance to be included in future cooperation (Nowak and Sigmund 1998; Panchanathan and Boyd 2004); altruistic punishment (Fehr and Gachter 2002); and direct fitness effects and/or economic forces benefiting all individuals in a cooperative group (Jaffe 2002, 2004; Lehmann and Keller 2006).

1.4
Few papers have explicitly compared the effects of cultural and biological evolution on the maintenance of sociality (Boyd and Richerson 1985; Bull et al. 2000; Acerbi and Parisi 2006). Basically, scenarios involving biological evolution (i.e., Darwinian evolution) depend on the proportional transmission of hereditary information via genes from parents to offspring ,G, while scenarios involving cultural evolution result from at least two different dynamic processes: a) vertical flux of information, V, in which offspring acquire relevant behavior via learning and/or imitation from parents (i.e, Lamarckian evolution), and b) horizontal flux of information, H, resulting from a number of mechanisms, all involving learning and/or imitation from peers (Boyd and Richerson 1996; Best 1999).

1.5
In this study, we use the term culture as that defined by Axelrod (1997): the set of individual attributes that are subject to social influence. We are aware that the term culture denotes a multitude of concepts which we are not addressing in this work. We call culture, due to a lack of a better word, the simultaneous occurrence of transmission of information from parents to offspring (V) and from peer to peer (H). This definition is congruent with that used by Acerbi and Parisi (2006) and should be considered as a simple preliminary metaphor for human culture.

1.6
Theoretical processes and concepts related to V and H are less operatively evident than those related to G, as in the latter characters are uniquely transmitted from parents to descendants by their genes and morphological structures coded by genes, or genes themselves, are relatively easy to identify and track. On the contrary, V and H have many different algorithmic analogies and are harder to model, they may interact with G, and cultural characters or "memes" (Dawkins 1976) are not easily identifiable.

1.7
Of the many features characterizing systems driven by biological and cultural evolution, here we study the effects of the dynamics of V and H on the dominance of social roles, regardless of possible differences in its mechanisms. We want to further our understanding of an important unresolved issue related to these evolutionary scenarios: a) G, as in Darwinian evolution, is prevalent in biological systems and is characterized by a the exclusive prevalence of vertical (V) information flow, b) H, common in social systems in which learning occurs by imitation from peers, and c) the combination of both H + V, as in Lamarckian evolution, representing learning from peers and from parents, is the closest metaphor to culture in our experiments for what we will call it C. Here we will compare the different evolutionary scenarios in regard to their propensity to favor cooperation.

* The model

Structure

2.1
We modify a time-discrete, one-dimensional, circular grid model (Cipriani and Jaffe 2005), which is a version of the well known "selfish herd" model of Hamilton (1971). The model assumes that cultural and biological dynamics is driven by a flux of information and by natural selection on the phenotypes (i.e., roles) of individuals, but does not involve group selection mechanisms. We simulate a population of interacting haploid agents, each of them interpreting different social roles or phenotypes: a) cooperative members (co) are agents that reduce the predation rates of their immediate neighbors (co or fr), b) non-cooperative members (nco) are agents that do not affect the predation rates on neighbors and do not receive cooperation, and c) free riders (fr) are agents taking full advantage of the behavior of their cooperative neighbors, benefiting from the reduced predation pressure, without corresponding equivalently. The inclusion of free riders in this model was motivated by the fact that, in evolutionary terms, cooperation is difficult to achieve and maintain under the presence of cheaters and free-riders (e.g., Nowak and Sigmund 2005). Thus we think that the presence of free-riders and their interaction with other social roles are fundamental in understanding the dynamics of cooperation in both cultural and biological scenarios.

2.2
Because co is the role capable of generating cooperative groups, in our simulations we only compare roles in a pair wise fashion, co vs. nco and co vs. fr. Starting from a random uniform spatial distribution, in each iteration every agent interacts with both its immediate neighbors, sequentially, according to its position in the model, using the majority rule. In consequence, three adjacent cooperative individuals make the minimal expected group size while groups of larger sizes result from the dynamics of the model.

2.3
Horizontal transmission of information (H) occurs through the "majority rule", which is a mechanism for the transmission of behaviors, believes, attitudes, and ideas, that has been successfully explored in several theoretical models (e.g.,Anderlini and Ianni 1996; Henrich and Boyd 1998). In the majority rule, any individual accepts norms that are applied by its neighbors or by the majority of individuals with whom it interacts. In our one-dimensional model, if both nco´s neighbors are co, then the nco agent is converted to co with probability pnco- co. The same happens to co agents found between two nco, with probability pco- nco. For example, if "_" are empty spaces, following this sequential rule from position 1 to n, the group of agents co-nco_nco-co-nco-nco_co__co-nco-co-co become co-nco_nco-nco-nco-nco_co__co-co-co-co in one single pass. The same rationale applies for fr. The fact that the agent's phenotype can be simultaneously transmitted from parents to offspring and from peer to peer (i.e., are subject to social influence), allows us to simulate culture C.

2.4
In each iteration, all empty cells are occupied by new recruits, co, nco or fr, with probability rco, rnco or rfr, respectively. Agents reproduce during their lifetime at no cost, and rco + rnco = rco + rfr = 1. When simulating G, the proportion of newborn co to nco and co to fr is the same as that of the surviving parents in the previous iteration (i.e., with heredity). That is, the probability that a recruit with a particular social role occupies an empty space at time t is proportional to the relative numbers of agents on that social role in the population at time t - 1. To avoid H when simulating G, we set pco-nco = pnco-co = pconv = 0. In H, the proportion of newborn co to nco, or co to fr, is constant with a 1:1 ratio (i.e., without heredity, rco and rnco or rco and rfr are constant and have the same value) and 0 < pconv ≤ 1. Finally, to simulate C (H+V), we set rco and rnco or rco and rfr at time t as the proportions of their respective agents in the population at time t - 1, and 0 < pconv ≤ 1.

2.5
At every time step in the simulation, all agents are subject to predation, the mechanism of natural selection. If an agent is predated upon, it dies and leaves an empty space to be populated in the next iteration. Grouping by cooperators provides protection against this process given that the probability of predation on each agent depends on the state of both its neighbors: (a) a co with two cooperative neighbors is predated upon with probability p2n; (b) a co with only one cooperative neighbor is predated upon with probability p1n; (c) a co without cooperative neighbors is predated upon with probability p0n, and (d) a nco is always predated upon with probability pnco.

2.6
Free riding was modeled by modifying predator rates according to the following rules: a) any fr with co neighbors is predated as any co and b) if fr is a neighbor of any co, its effect on the predation rate of the co is equal to that exerted by any other nco. That is, fr profits from having co neighbors as any co would do, yet fr does not provide any benefit to neighbors. Making pfr =pncoallowed fr to suffer predation as any nco did when surrounded only by fr.

2.7
Besides predation, each agent may also die according to a fixed rate of natural mortality, mco, mnco, and mfr. As in the case of predation, when any agent dies by means of m, it leaves an empty space that is populated in the next iteration. The cost of being cooperative is simulated setting mco so that 0 < mco ≤ 1, mnco mco, and mfr mco.

Simulations

2.8
We implemented the model using MS Visual Basic, running our simulations on populations with 104 cells. In some simulations, frequencies converged very fast, before reaching 102 iterations, while others needed longer runs, up to 104 steps or more. As we were interested in comparing the likelihood of cooperators overpowering non-cooperators, we assumed that competing agents with opposing strategies existed in the population by the time the simulation started. At initial conditions, an average of one half of the number of cells was randomly populated by co while the other half was populated by nco or fr.

2.9
In this study, we simulated three different evolutionary scenarios, G, H, and C (C =H+V), and compared them against control runs in which no transmission of information occurred and changes in the proportions of co were dependent only on differential predation.

2.10
When H was active, pconv = 1, otherwise pconv = 0. The effects of intermediate values of pconv on the maintenance of cooperation will be discussed elsewhere. Cooperation resulting from H spread via immediate neighbors while cooperation resulting from G and V spread through offspring planted in random empty spaces. To correct for this potential bias when comparing these scenarios, we randomly shuffled the location of all the agents each time step after reproduction occurred (but seeJensen 1998). Besides the order of functions shown in the section Flow (above), we also tested simulations in which reshuffling occurred just after reproduction. Given that during reproduction new agents randomly occupy available cells, not surprisingly reshuffling options had no effect on simulation results. Thus, in all our simulations, processes followed the order described in the first place. The dynamics of co under G, H, and C was tested against a range of cooperation costs mco = 0, 0.1, 0.2, …, 0.9, 1 and mnco = mfr = 0. Different fitness advantages for grouping were obtained, producing fitness advantages for grouping of 1, 2, …, 5 times relative to non grouping, simulating predation conditions: p0n = pnco = 0.1, 0.2, …, 0.5 and p2n = p1n = 0.1 respectively. The effects of cooperation costs mco on the proportions of co were tested against different selection regimes providing various degrees of fitness advantage to co when in groups.

Flow

2.11
Every simulation followed these steps:
  1. Initialization of the system:
    1. Reading parameter values from GUI.
    2. Saving parameter values in text file.
    3. Dimensioning arrays.
    4. Positioning of agents according to a random uniform distribution.
    5. Calculation of numbers and proportion (heredity) of agents.
    6. Saving data on numbers and proportions in text file.
  2. Simulation loop starts here:
    1. Horizontal transmission of information (H) by majority rule
    2. Optional random shuffling of the positions of all agents
    3. Predation
    4. Natural mortality
    5. Optional calculation of numbers and proportion (heredity) of agents.
    6. Reproduction
    7. Optional calculation of numbers and proportion (heredity) of agents.
    8. Saving data on numbers and proportions in text file.
  3. Simulation loop stops here.
  4. Releasing memory from arrays.
  5. End.

2.12
Code for the simulation can be downloaded from the web at http://atta.labb.usb.ve/Klaus/Jaffe&Cipriani_JASSS_ProgramCode.htm

* Results

3.1
The maintenance of sociality varied according to the type of evolutionary process involved in the dynamics of the population. Table 1 summarizes the effects of such processes when cooperation had no cost on agents. Under low selection against grouping, co always outnumbered nco and fr in all scenarios but in the control run (0.5) and G (0 to 1) of experiment 3. Of these, the proportions of co converged to 1 in all scenarios involving heredity. Also, under scenario H, the proportions of co converged to relative high values (0.94 – 0.99). Control runs involving nco resulted in frequencies of co (0.88 – 0.89) higher than those obtained from simulations involving fr (0.50 – 0.52). Besides those mentioned so far, no other major differences were observed between simulations using either nco or fr when cooperation had no cost on co.

3.2
In all these simulations (Table 1), shuffling the locations of agents produced different results than those obtained from simulations in which positions were not shuffled. The proportion of co found in H scenarios without shuffling, was slightly lower than that observed in those H with shuffling. The inverse tendency was found in control runs under low selection.

Table 1: Average proportion of collaborators (co), competing against non collaborators (nco) and free riders (fr), resulting from scenarios in which cooperation has no cost to co, and genetic and non genetic information is transmitted from parents to offspring and from peers to peers with different mechanisms: G, vertical transmission of information using genes; H, horizontal transmission of non genetic information; C, horizontal and vertical transmission of non genetic information; and Control runs, in which transmission of information never occurs. All standard deviations are smaller than 1.5%. Selection settings: p0n = pnco = 0.5 and p2n = p1n = 0.1. Shuffling: agent's locations were randomly swapped; Heredity: the proportion of newborn is the same as that of the surviving parents in previous time step. Without heredity, rco, rnco, and rfr = 0.5.

Exp.ScenariosShufflingHeredityProportion of co
1GYY1.00
co vs ncoHYN0.99
CYY1.00
ControlYN0.88
2GNY1.00
co vs ncoHNN0.98
CNY1.00
ControlNN0.89
3GYY0 or 1
co vs frHYN0.99
CYY1.00
ControlYN0.50
4GNY1.00
co vs frHNN0.94
CNY1.00
ControlNN0.52

3.3
Cooperation costs affected the dominance of co under different evolutionary scenarios (Figure 1) when predation conditions were p0n = pnco = 0.5 and p2n = p1n = 0.1. In G and C, co dominated nco in populations when cooperation costs were low (under 0.5). In these scenarios, the shift of dominance from co to other strategies was abrupt. Under C, cooperators competing either with nco or fr, dominated the population at higher costs than under G, only when locations of agents were randomly shuffled (Figures 1B and 1D). Without shuffling (Figures 1A and 1C), the dominance switched from co to the competing strategy within the same range of cooperation costs in G and C.

Figure
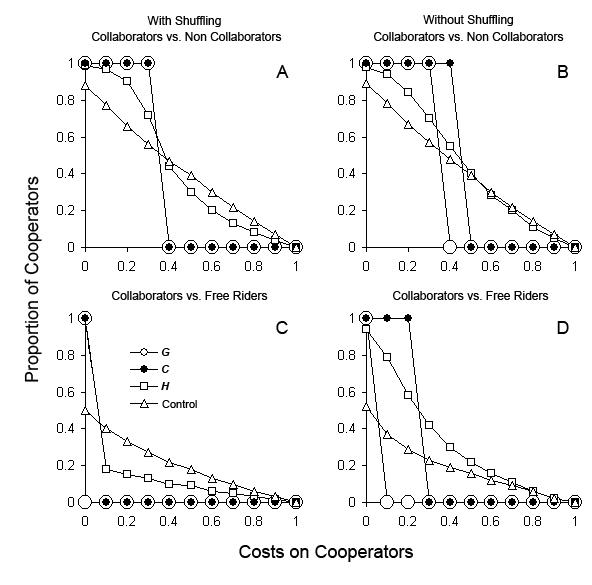
Figure 1. Average proportion of collaborators (co), competing against non collaborators (nco) and free riders (fr), resulting from scenarios in which cooperation had a cost on co, and information was transmitted using different mechanisms: G, vertical transmission of information using genes, large white circles; H, horizontal transmission of non genetic information, white squares; C, horizontal and vertical transmission of non genetic information, small black circles; and Control, without transmission of information, white triangles. A. co vs. nco with random shuffling of agent's locations; B. co vs. nco without random shuffling; C. co vs. fr with random shuffling. The proportion of co under G oscillated between 0 and 1 (not shown); D. co vs. fr without random shuffling. All standard deviations are smaller than 1.5%. Selection settings: p0n = pnco = 0.5 and p2n = p1n = 0.1. Costs on cooperators: mco = 0, 0.1, 0.2, ..., 0.9, 1 and mnco = mfr = 0.

3.4
In all but one case under G and C (Figure 2C), the range of cost's values within which the dominance of co shifts to a competing strategy (i.e., threshold values) strongly depended on the selection applied on agents not forming groups (Figure 2). This strong dependence was found to be particularly evident in the experiments in which co competed against nco (Figures 2A and 2B). However, it is important to keep in mind that the C scenario offered an advantage to co only when cost's threshold ranges, under identical levels of selection, were higher than those found under G. These particular conditions only existed when agent's locations were not shuffled (Figures 2B and 2D) but occurred if co was either competing against nco or fr.

Figure
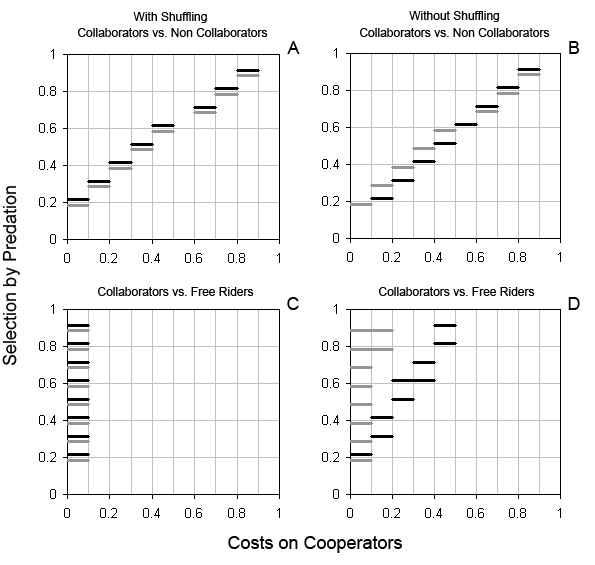
Figure 2. Range of cooperation costs in which the dominance in populations switched from collaborators to competing strategies in G and C, under different values of selection against grouping agents. Experiments simulate collaborators (co) competing against non collaborators (nco) and free riders (fr) under two different scenarios: G, vertical transmission of information using genes, gray bars; C, horizontal and vertical transmission of non genetic information, black bars. A. co vs. nco with random shuffling of agent's locations; B. co vs. nco without random shuffling; C. co vs. fr with random shuffling; D. co vs. fr without random shuffling. Selection settings: p0n = pnco = 0.2, 0.3, &hellip, 0.9 and p2n = p1n = 0.1. Costs on cooperators: mco = 0, 0.1, 0.2, …, 0.9, 1 and mnco = mfr = 0.

3.5
Threshold values in simulations using nco (Figure 2B) were higher under C than under G, when selection increased from 0.2 to 0.6. With predation rates larger than 0.6, threshold values in both scenarios became identical. In simulations using fr under C, threshold values also increased with selection, from p0n = pnco = 0.3 to 0.9 (Figure 2D), even if threshold values under G were independent of predation rates. However, in both G and C with p0n = pnco = 0.8 and 0.9, the sizes of threshold ranges doubled (Figure 2D). It is worth mentioning that the lower bounds of threshold ranges in Figure 2C were rather unstable, even if in the figure are shown as being equal to 0.

3.6
Under selection defined by p0n = pnco = 0.2, proportions of co under H were almost always smaller than those obtained in control runs (Figure 3). The exception was the value of co obtained at a cost of 0.1, in the experiment testing nco without shuffling (Figure 3B). However, even if the co value was larger than that obtained in the control run, this value was within the threshold value of G with p0n = pnco = 0.2 (Figure 2D).

Figure
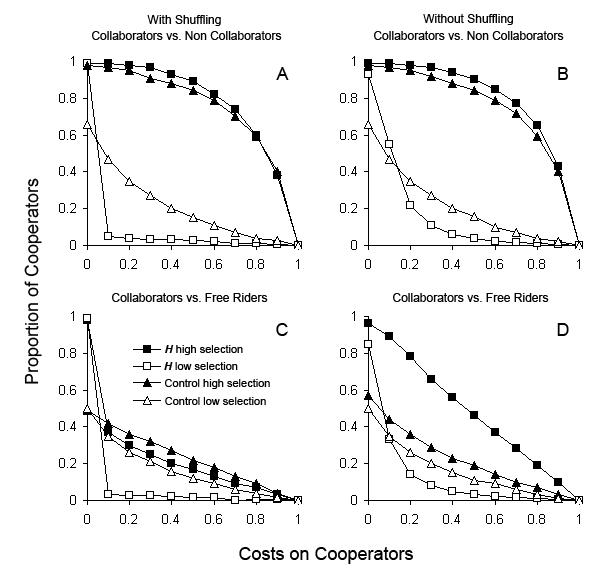
Figure 3. Average proportion of collaborators (co), competing against non collaborators (nco) and free riders (fr), resulting from scenarios in which cooperation had a cost on co, and information was transmitted using different mechanisms: H, horizontal transmission of non genetic information, squares; Control, without transmission of information, triangles. A. co vs. nco with random shuffling of agent's locations; B. co vs. nco without random shuffling; C. co vs. fr with random shuffling; D. co vs. fr without random shuffling. All standard deviations are smaller than 1.5%. Fitness advantages for cooperation: Low selection: p0n = pnco = 0.2 and p2n = p1n = 0.1, white symbols; High selection p0n = pnco = 0.9 and p2n = p1n = 0.1, black symbols. Costs on cooperators: mco = 0, 0.1, 0.2, ..., 0.9, 1 and mnco = mfr = 0.

3.7
Results in which co values obtained under H were larger than those obtained from control runs, but smaller than those produced under G, were also found in the experiments testing nco with p0n = pnco = 0.5 (Figures 1A and 1B). In these experiments, proportions of co under H became immediately equal or lower than those in control runs within the cost's range in which the dominance of co under C shifted to nco. Curiously, this was not the case for values of co obtained from H in the experiment comparing co vs. fr without shuffling (Figure 1 D). There, even if proportions of co were larger than those obtained from the control run, and lower than those from G at low costs, values of co under H remained higher than those from the control run well after the cost's range within which the dominance of co under C shifted to fr. Hence, in this experiment, C allowed co to dominate the population at higher cooperation costs than G, but H alone allowed co to dominate the population at still higher cooperation costs than C.

3.8
Under selection at p0n = pnco = 0.9 (Figure 3), values of co under H with competing nco, were slightly larger than those obtained from control runs along the range of cooperation costs (Figures 3A and 3B) but smaller than, or well within the cost's threshold range, of co values obtained under G (Figures 2A and 2B). Similarly, values of co under H with competing fr but without shuffling, were larger than those obtained from control runs (Figure 3D) and decreased linearly to cooperation costs. Given that the dominance of co in G shifts to nco between costs of 0.3 and 0.5 (Figure 2D), only those proportions of co higher than 0.5 are larger than those obtained from G (Figure 3D). Hence, in this experiment, H allowed co to dominate the population at higher cooperation costs than G only at costs larger than 0.5.

3.9
Finally, and similarly to other results with competing fr and shuffling, all proportions of co obtained under H in these conditions, were smaller than those obtained from control runs (Figure 3D) and are well within the cost's threshold values of G (Figure 2C).

3.10
A summary of the results in which scenarios linked to cultural evolution, C and H, allow collaborators (co) to dominate populations at cooperation costs higher than those allowed by G, are presented in Figure 4.

Figure
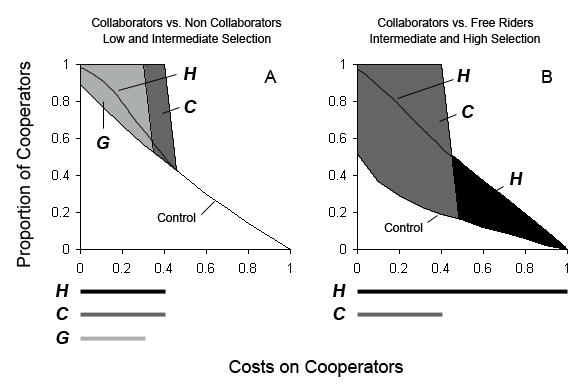
Figure 4. Schematic representation of scenarios linked to cultural evolution, C and H, allowing collaborators (co) to dominate populations at cooperation costs higher than those allowed by the scenario representing biological evolution, G. Darkened areas represent the cost differential attributed to cultural evolution that benefits the dominance of co. The lower limits of darkened areas are the co values resulting from control runs. Bars at the bottom of each plot show the extent of costs along which different scenarios allow co to become the dominant strategy. G, vertical transmission of information using genes, gray; C, horizontal and vertical transmission of non genetic information, dark gray; H, horizontal transmission of non genetic information, black. A. co competing against non collaborators (nco) without random shuffling of agent's locations, under an intermediate fitness advantage for grouping or intermediate selection (e.g., p0n = pnco = 0.5) on agents that do not form groups; B. co competing against free riders (fr) without random shuffling, under a strong selection (e.g., p0n = pnco = 0.9) on agents that do not form groups. Costs on cooperators: mco = 0, 0.1, 0.2, …, 0.9, 1 and mnco = mfr = 0.

* Discussion

4.1
Results of comparing the three evolutionary scenarios, G (exclusive vertical transmission of information), H (exclusive horizontal transmission of information), and C (horizontal and vertical transmission of non genetic information), showed that cooperation is more likely to be maintained in the population when competing either against non cooperators (nco) or free riders (fr), under C for low costs of cooperation and under H for higher costs (Figure 4).

4.2
This difference can be explained by the fact that spatial restriction affected the results of our simulations. The transmission of information of G and V occurred from parents to offspring. When recruited, newcomers occupied random empty spaces along the grid, left behind by dead agents. On the other hand, the information transmitted by H spread via immediate neighbors. The most important consequence of this apparent incongruence was that the effects of H were more likely to allow spatial correlations to build up in the model, so that the benefits of cooperation were readily available "shielding" cooperative agents from natural selection (Soule 2005). Spatial correlations are unwanted when simulating mathematical models in which the spatial scale is not explicitly considered. Spatial correlations can introduce strong biases resulting in large quantitative and qualitative differences between the solution obtained by the simulation and the actual solution of the mathematical model. However, from a social and biological stand point, it seems natural to think that most processes occur in geometrical spaces, for what spatial correlations are in fact mechanisms affecting the unfolding dynamics of almost any system under study. In consequence, spatial correlations were approached as a new parameter to be considered in the simulation rather than a potential bias. To reduce spatial correlations, the positions of the agents that were not forming groups were randomly shuffled immediately after the horizontal transmission of information occurred. The results of these simulations were compared to those in which shuffling was not performed, or were reshuffling as performed after the reproductive step (not shown). This comparison identified spatial correlations as one necessary condition in our model, for co to overcome nco and fr strategies using processes linked to cultural evolution (H + V) and H, under a wide range of costs on cooperators and selection against agents not forming groups. Obviously, spatial correlations depend on the dimensionality of the model, and it is well known that different simulated spatial outlays produce different evolutionary dynamics (i.e.,Iftia et al. 2004; Lieberman et al. 2005; Ohtsuki et al. 2006; Santos et al. 2006).

4.3
A rather counter-intuitive result of this study is that with H, cooperative behavior, is less sensitive to the cost of cooperation than under G, even though the latter always produces the highest proportion of co in the system when cooperation is at no cost. This result could be suggesting that biological evolution is better in tracking fine, fast-occurring differences in fitness landscapes than learning from peers, as the latter is better in keeping the "memory" of the system. For the same reasons, social roles evolving under a G scenario are more susceptible of getting trapped in local optima in rough fitness landscapes compared to social roles changing under the H scenario.

4.4
Our results are in agreement with those of a model just published (Acerbi and Parisi 2006), which compared cultural transmission between and within generations in a context involving learning and using a much more complex modeling framework. This coincidence of results might serve as a fist validation of our model. This exercise showed that even at the highest level of abstraction, represented by an extremely simple one-dimensional model, important differences between cultural and biological evolution emerge. Thus, conclusions drawn by simulations implemented in economy, in which evolution is represented as H (e.g.,Axelrod 1989; Fehr and Fischbauer 2003), might not be necessary meaningful to biological evolution where evolution is represented as G (e.g.,Maynard-Smith and Szathmary 1997) and vice-versa. Synergies elicited by H + V, the best candidate metaphor for culture in this study, seem worthwhile of further explorations.

* Acknowledgements

We thank Maria Daniela Torres, Ivette Carolina Martinez, the editor, Nigel Gilbert, and two anonymous reviewers for helpful comments on earlier versions of the manuscript. RC also acknowledges Decanato de Investigación y Desarrollo of Universidad Simón Bolívar, Project G-026.

* References

ACERBI A and Parisi D (2006) Cultural Transmission Between and Within Generations. Journal of Artificial Societies and Social Simulation, vol. 9 no. 1. https://www.jasss.org/9/1/9.html.

ANDERLINI L and Ianni A (1996) Path dependence and learning from neighbours. Games and Economic Behavior, vol. 13, pp. 141-177.

AXELROD R (1997) The Dissemination of culture. A model with local convergence and global polarization. Journal of Conflict Resolution, vol. 41 no. 2, pp. 203-226.

AXELROD R (1989) The Evolution of Cooperation. Penguin, Harmondsworth.

AXELROD R and Hamilton W D (1981) The evolution of cooperation. Science, vol. 211, pp. 1390-96.

BEST M (1999) How Culture Can Guide Evolution: An inquiry into gene/meme enhancement and opposition. Adaptative Behaviour, vol. 7, pp. 289-306.

BULL L, Holland O. and Blackmore S (2000) On Meme-Gene Coevolution. Artificial Life. vol. 6, pp. 227-35.

BOYD R and Richerson P (1985) Culture and the evolutionary process. Chicago: University of Chicago Press.

BOYD R. and Richerson P (1996) Why culture is common but cultural evolution is rare. Proceedings of the British Academy 88: 73-93.

CAVALLI-SFORZA L.L. and Feldman M.W (1981) Cultural transmission and evolution: a quantitative approach. Monogr Popul Biol. 16:1-388.

CAVALLI-SFORZA L.L. and Feldman M.W (2003) The application of molecular genetic approaches to the study of human evolution, Nature Genetics 33: 266-27

CIPRIANI R and Jaffe K (2005) On the dynamics of grouping. p. 56-60. In: G. Tonella, ed. Proceedings of the Fifth IASTED International Conference on Modelling, Simulation and Optimization, Acta Press.

DAWKINS R (1976) The Selfish Gene. Oxford Univ. Press, Oxford

DEWAAL F.B.M (2001) The ape and the sushi master: Cultural reflections of a primatologist. Basic Books. New York.

EHRLICH P.R and Levin S.A (2005) The Evolution of Norms. PLoS Biology, 3 (6) e194

FEHR E and Gachter S (2002) Altruistic punishment in humans. Nature 415, 137-140.

FEHR E and Fischbauer U (2003) The nature of human altruism. Nature 425, 785-791.

GADAGKAR R (2001) The social biology of Ropalidia marginata: Towards understanding the evolution of eusociality. Harvard University Press.

HAMILTON W.D (1964) The genetic evolution of social behaviour. Papers I and II. Journal of Theoretical Biology 7: 1-16, 17-52.

HAMILTON W.D (1971) Geometry for the selfish herd. Journal of Theoretical Biology 31: 295-311.

HAMMERSTEIN P (ed.) (2004) Genetic and cultural evolution of cooperation. Dahlem Workshop Reports, MIT Press. 450 p.

HENRICH J and Boyd R (1998) The Evolution of Conformist Transmission and the Emergence of Between-Group Differences. Evolution and Human Behavior 19: 215-242.

IFTIA M, Killingback T, Doebeli M (2004) Effects of neighborhood size and connectivity on the spatial Continuous Prisoner's Dilemma. Journal of Theoretical Biology 231: 97-106

JAFFE K (2001) On the relative importance of haplo-diploidy, assortative mating and social synergy on the evolutionary emergence of social behavior. Acta Biotheoretica 49: 29-42.

JAFFE K (2002) An economic analysis of altruism: Who benefits from altruistic acts? Journal of Artificial Societies and Social Simulation 5: 3. https://www.jasss.org/5/3/3.html

JAFFE K (2004) Altruistic punishment or decentralized social investment? Acta Biotheoretica 52: 155-172.

JENSEN H J (1998) Self-Organizing Criticality. Emergent complex behavior in physical and biological systems. Cambridge Lecture Notes in Physics. University of Cambridge Press.

KURZBAN R and Houser D (2005) Experiments investigating cooperative types in humans: A complement to evolutionary theory and simulations. PNAS 102: 1803-1807

LEHMANN L and Keller L (2006) The evolution of cooperation and altruism — a general framework and a classification of models. J. Evol. Biol. 19: 1365-1725.

LIEBERMAN E, Hauert C and Nowak MA (2005) Evolutionary dynamics on graphs. Nature 433: 312-316.

LUMSDEN C.J. and Wilson E.O (1981) Genes, mind, and culture. Harvard University Press, Cambridge, MA

MAYNARD-SMITH J and Szathmary E (1997) The Major Transitions in Evolution. Oxford Univ. Press, Oxford.

NELSON R.R. and Winter S.G (1982) Evolutionary theory of economic change. Belknap Press. p. 454.

NOWAK M.A. and Sigmund K (1998) The dynamics of indirect reciprocity. J. Theor. Biol. 194: 561-574.

NOWAK M.A. and Sigmund, K (2004) Evolutionary dynamics of biological games. Science 303: 793-799.

NOWAK M.A. and Sigmund K (2005) Evolution of indirect reciprocity. Nature 437: 1291-1298.

OSBORN F and Jaffe K (1997) Cooperation vs. exploitation: interactions between Lycaenid (Lepidopera: Lycaenidae) larvae and ants. Journal of Research on the Lepidoptera. 34: 69-82.

OHTSUKI H, Hauert C, Lieberman E, Nowak M.A (2006) A simple rule for the evolution of cooperation on graphs and social networks. Nature 441:502-505

PANCHANATHAN K and Boyd R (2004) Indirect reciprocity can stabilize cooperation without the second-order free rider problem. Nature 432: 499-502.

PAGEL M. and Mace R (2004) The cultural wealth of nations. Nature 428: 275 - 278.

QUELLER D.C, Strassmann J.E. and Hughes C.R (1988) Genetic relatedness in colonies of tropical wasps with multiple queens. Science 242: 1155-1157.

Richerson P.J and Boyd R (2004) Not by Genes Alone: How Culture Transformed Human Evolution. Chicago Univ. Press 344 pp.

SANTOS F C, Rodrigues J.F and Pacheco J.M (2006) Graph topology plays a determinant role in the evolution of cooperation. Proc. Royal Soc. London B 273, 51-55.

SOULE T (2005) Resilient Individuals Improve Evolutionary Search. Artificial Life 12: 17-34

----

ButtonReturn to Contents of this issue

© Copyright Journal of Artificial Societies and Social Simulation, [2007]