© Copyright JASSS

  JASSS logo ----

Stephen M. Younger (2003)

Discrete Agent Simulations of the Effect of Simple Social Structures on the Benefits of Resource Sharing

Journal of Artificial Societies and Social Simulation vol. 6, no. 3
<https://www.jasss.org/6/3/1.html>

To cite articles published in the Journal of Artificial Societies and Social Simulation, please reference the above information and include paragraph numbers if necessary

Received: 18-Dec-2002      Accepted: 7-May-2003      Published: 30-Jun-2003


* Abstract

This paper explores the effect of sharing vs. stealing behavior within the context of several simple social structures that include different strategies for food and material storage. Discrete agent simulations were performed for several scenarios ranging from a pure hunter-gatherer society (food consumed when found, no central storage, no social structures) to a shelter-based society with family units and rudimentary leadership. Special attention was given to tracking a non-economic culture-dependent quality factor within a plausible social value structure. The clustering of agents that occurred in family units and while agents followed the instructions of leaders reduced deaths by starvation and increased the non-economic quality factor of the agents. The accumulation of materials was found to increase with the fraction of non-sharing agents in the population, consistent with previous studies of altruistic sharing. Only a small fraction of sharing agents, about 10%, was required to significantly raise the quality factor for the entire population. Parallels are made with hunter-gatherer societies having analogous behavioral norms and social structures.

Keywords:
Discrete Agent Simulation; Sharing; Social Structures; Storage Economy

* Introduction

1.1
Economic strategies, individual normative behavior, and social structures evolve in an interrelated fashion to suit the environment in which people find themselves. Testart (1982) surveyed the food storage practices of forty hunter-gather societies and found that resource strategies were influenced by the geographical and seasonal availability of food. For example, when food was plentiful and evenly distributed the motivation for a central store of food was less than it was in situations in which uncertain availability demanded a reserve to see the group through lean periods. Also, individuals in societies that immediately consumed gathered food were more likely to share than those in societies that could store food over prolonged periods. And, when food was shared the corresponding payment was often in the form of social prestige and other intangible factors, pointing to the importance of tracking non-economic considerations in assessing social development. It is noteworthy that in many hunter-gatherer societies food collection does not take up much of the time of the participants, again pointing to the importance of non-economic factors as measures of individual and social success. Finally, food storage has an obvious impact on social organization. Societies that depend on large food reserves are more likely to be sedentary vs. mobile. Leadership and social structures not only influence and are influenced by the accumulation of food and materials but are key to the establishment of or inhibition of social equity. In this sense individual behavioral norms, the storage of goods and materials, and social structure are linked in the development of a sustainable population.

1.2
Simulations offer an opportunity to better understand the interplay between individual behavior and social organization in a well-defined environment. From an economic standpoint, individual normative behavior governs how an individual gathers and uses resources to survive both independently and as part of a group. For example, an individual could keep resources for his or her self, share them with others, steal what others have, or place some or all of the resources in a central storage site for communal use. Communication and aggression influence the behavior of individuals and groups as does more complex social intercourse.

1.3
Social structures govern the collocation of agents and hence the frequency and type of interagent relationships. Clustering of agents, such as in family structures, affects both the efficiency of finding food and its distribution within a group. The organization of labor, perhaps following the instruction of leadership, also modifies population density through the formation of social clusters that can affect the frequency and type of interaction (sharing, stealing, communication, aggression, etc) and hence overall social development.

1.4
Discrete agent simulation has emerged as a useful tool in modeling the effect of behavioral norms on individual and social development. Cecconi and Parisi (1998) examined the utility of a central store of resources vs. immediate use by individual agents, a computational analog for certain aspects of hunter-gatherer societies. They found, not surprisingly, that a central store benefited the group by providing a "safety net" for the population. In severely constrained environments, only those groups that employed a central store strategy were able to survive.

1.5
Castelfranchi, Conte, and Paolucci (1998) studied the effect of behavioral norms, and the communication of such, on social coordination and the control of aggression. They found that social equality was optimized within collections of norm-following individuals and that incidents of aggression were reduced relative to populations of utilitarian agents. Further, they studied the effect of normative reputation, the communication of the observed behavior of other agents, on overall social well being. Normative reputation enabled agents to benefit from the experience of other agents, giving them knowledge with a minimum price. They found that without such communication the norm-following society does not achieve the same degree of success as a purely utilitarian group.

1.6
Saam and Harer (1999) studied the effect of behavioral norms within a finder-keeper society with specific attention given to the relative merits of norm-abiding behavior (agents follow a fixed set of rules without choice) vs. norm-governed behavior (agents decide on the best action given the situation). They found that the benefits of norm compliance were sensitive to the social context in which decisions were made and to the details of resource generation and distribution. Social equity was enhanced when resources were distributed equally among heirs. When there was an unequal distribution social equity was reduced and there was a greater polarization within the population.

1.7
Jaffe (2002) studied altruism within a model society with a particular focus on social economics. He found that a purely altruistic norm decreased the net wealth of the group. This somewhat surprising result was thought to change when more complex, non-economic, social factors were taken into account. Few acts are purely altruistic with no benefit whatsoever to the performer.

1.8
The present work explores the effect of sharing vs. stealing behavior in the context of several simple social structures that include different strategies for food and material storage. Discrete agent simulations were performed for a succession of scenarios from a pure hunter-gatherer society (food consumed when found, no central storage, no social structures) to a shelter-based society with family units and rudimentary leadership. Special attention was given to tracking non-economic rewards associated with resource sharing within a plausible example of a social value structure. The thesis of this work is that the clustering of agents that occurs in family units and while agents follow the instructions of leaders would reduce deaths by starvation and enhance social well being.

1.9
The establishment, maintenance, and role of norms in human societies is highly complex, the modeling of which is necessarily incomplete. Extremes of modeling range from pure game-theoretic methods with very simple rules to highly complex sociological models of complex social networks. Danielson (1998) presented a general discussion of the challenges of modeling ethics. High-level discussions of agent based simulations can be found in Castelfranchi (1998) and Macy and Willer (2002).

* Model

2.1
Discrete agent simulation was used to model the relative benefits of sharing in several simple social structures. The discrete agent simulation computer code employed here, called MICROS, was written in Visual Basic and is described in detail in Younger (2002).

2.2
An initial population of 20 agents inhabited a two dimensional landscape of twenty by twenty squares that contained five food centers, six material centers, and ten shelters. (A sketch of the landscape is given in Figure 1.) In some simulations, the shelters at 5,5 and 15,15 were designated as "home shelters" that permitted the storage of food and materials. The strength of a shelter deteriorated at a rate of one unit per timestep and was rejuvenated by material points collected by the agents. Agents returned food and materials collected at food and material centers to their home shelters. An agent could carry up to 400 units of food or materials. The landscape was symmetric about the line between the home shelters to ensure that one shelter did not have a competitive advantage over the other. The food centers were given an initial supply of 100 units each and their replenishment rate was 20 units per center per timestep so that a population of 100 agents, each consuming one unit of food per timestep, could be supported. The material centers were given an initial supply of 1,000,000 units and were not replenished.

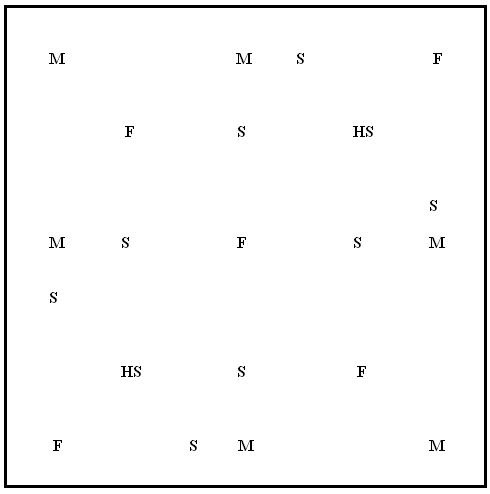
Figure 1. Landscape for the simulations. F: Food Center; M: Material Center; S: Shelter; HS: Home Shelter.

2.3
Agents within a simulation were divided into two categories: sharing and non-sharing. Sharing agents communicated their knowledge of the landscape to others and shared the food and materials that they were carrying with all other agents at their location. Communication and sharing represented a rudimentary cooperation between agents. Non-sharing agents did not share information or goods and stole goods carried by weaker agents. The parameter asharing, the fraction of sharing agents relative to the total population, was fixed at the beginning of the simulation. Thus, asharing served as a type of "cooperation index" for the simulation. The sharing vs. non-sharing status of agents born during the course of the simulation was chosen so as to maintain this distribution. Individual agent status as sharing vs. non-sharing was fixed at the start of life and did not change. In the language of Saam and Harer (1999), MICROS agents were "norm abiding" since they were constrained to follow a fixed set of behavioral rules throughout the simulation. In some simulations the status of all agents at a home shelter was set to either sharing or non-sharing. This allowed the study of the interaction of two small societies, one consisting entirely of sharing agents and one consisting entirely of non-sharing agents.

2.4
The imperative to survive was the dominant motivator for agent decisions. Agents needed food and sleep for physical survival and could die of hunger, fatigue, or old age. If the need for hunger exceeded 200 units or the need for rest exceeded 100 units then the agent died. All agents had the same maximum lifetime of 4000 timesteps. Procreation was enabled so that many generations of agents acting according to the same set of rules could be studied. The length of each simulation was 40,000 timesteps. The rules governing agent behavior were fixed throughout the run; evolution was not modeled. However, it was found that within the fixed agent behavioral rule set trends could take several generations to mature.

2.5
A simple form of leadership was simulated in some of the scenarios. A leader was identified in the input to the run. Leaders gave orders, limited to the collection of food or materials, to agents present at the home shelter. The establishment of a food reserve, the size of which was set somewhat arbitrarily to 1.3 times the maximum food need of the agents times the number of agents assigned to that shelter, was the first priority. When this reserve was met, the leader ordered the collection of materials. Leaders were assigned an "aggression factor" that determined what fraction of its time an agent needed to follow the instructions of its leader vs. satisfy its own needs. Since the aggression factor of leaders was set randomly, the accumulation of food and materials at a shelter was dependent on individual leaders. Note that materials were only collected when leadership was enabled. Leaders were replaced when they died.

2.6
Table 1 lists the parameters of the agents and how they were calculated. The age of the agent, and its needs for food, sleep, companionship, and activity, were each increased by one unit per timestep. Agent strength was a function of age, hunger, and fatigue.

Table 1: Agent Parameters and Method Used in Their Calculation

AgeIncrement one unit per timestep
Strength = age - hunger - sleep for age <= 2000
= 2000 - age - hunger - fatigue for age > 2000
HungerNeed increased one unit per timestep
Decreased by amount of food consumed
Minimum value is zero
SleepNeed increased by one unit per timestep if awake
Set to zero once agent is asleep
CompanionshipNeed increased by one unit per timestep
Set to zero if another agent is present who is awake
ActivityNeed increased by one unit per timestep
Decreased by one unit if goods collected at food or material center
Decreased by one unit if exploring
Set to zero if goods deposited at home shelter
Decreased by one unit whenever the agent moves
Quality factorIncreased by one unit per timestep
Decreased one unit if hunger > 100
Decreased one unit if sleep > 50
Decreased one unit if companionship > 48
Decreased one unit if activity > 96
Increased five units if new fact sensed
Increased one unit if fact given or received
Increased by twenty percent of goods shared
Increased by ten percent of amount of goods received in sharing event
Decreased by ten percent of goods stolen from this agent
Increased by 100 units on first mating if family enabled
Increased by twenty units per mating
Increased by ten percent of agents deposited at home shelter
Increased by one unit if exploring
imx(i,j)Increased one point per fact given to another
Increased one point per fact received from another
Increased by ten percent of goods received in sharing
Increased by twenty percent of goods given to another
Increased by ten percent of sharing taken from another
Decreased by ten percent of goods taken from self by another
Increased by one hundred points for first mating
Increased by twenty points per mating
Set to 100 for offspring
Set to 90 for parents

2.7
In order to quantify non-economic factors in individual and social welfare a quality factor was defined. The quality factor was increased by one unit per timestep to reflect general experience. It was also increased when the agent learned facts, and when goods were given to or received from another agent. It was decreased if the agent was very hungry or tired, when the agent was in great need of companionship or activity, or if goods were stolen from the agent. Mating contributed significantly to the quality factor, as did the satisfaction of delivering goods to the home shelter. The large reward given to finding a permanent mate in family scenarios was intended to mirror the importance given to marriage in many cultures. However, this one-time addition did not dominate the quality factor over the course of an agent's lifetime.

2.8
An interaction matrix, imx, tracked the relative affection of an individual agent for each of the other agents. An interaction matrix element was increased for positive experiences - giving and receiving information and goods - and decreased for negative experiences - theft. Agents did not communicate, share, or mate with agents with whom they had a negative interaction matrix element. In this way they carried a memory of past interactions and so "learned" from previous experience. Sharing agents only communicated information about the environment, specifically the status of food and material centers. Information about other agents, their "normative reputation" in the work of Castelfranchi, Conte, and Paolucci (1998), was not shared with other agents.

2.9
The quality factor and the interaction matrix represented amalgams of quantities tracked in the simulation. They are culture-dependent in that they reflect a specific value and reward structure. Other formulations are possible and should be explored, but some measure of non-demographic and non-economic performance is required. Even in "primitive" hunter-gatherer societies non-economic rewards are important in determining individual satisfaction and social status. The current formulation was chosen to provide one example of a reward structure beyond wealth accumulation. Sharing in a purely altruistic sense can reduce the survival probability of an individual but can increase individual satisfaction, reflected in the quality factor, and social prestige, reflected in the interaction matrix.

2.10
In most cases, an agent could perform only one action per timestep. If rest was the dominant need, the agent continued sleeping, went to sleep on the spot, or moved toward a nearby shelter. Agents rejuvenated faster at shelters than in the open. Hunger was satisfied by eating food being carried or food stored at a home shelter or a food center. If food was not present at the agent's location then it would search its memory for the location of the nearest food center or, in some scenarios, its home shelter. If fatigue and hunger were within bounds and leadership was enabled then the agent carried out the orders of its shelter leader. Sharing agents shared information, food, and materials with all other agents at their location with whom they had zero or positive interaction matrix elements. Non-sharing agents stole from other agents. Non-sharing agents did not share information but could receive information from sharing agents.

2.11
Mating was permitted for agents aged between one quarter and one half of their lifetime. (This interval assured that mating did not occur between parents and offspring.) The probability of conception in a mating event was 0.25 and was increased by 0.05 if the participants were permanent partners and again by 0.05 if the mating occurred in a home shelter. Once pregnant, the female could not mate again until she delivered. The gestation period was 200 timesteps. If the family option was enabled then once the female became pregnant the male and female agents were considered permanently associated and the female was constrained to move with the male. Neither could mate with other partners. (Alternate marriage and family arrangements are possible but were not simulated in this work.) The parameters of newborn agents were set randomly. The knowledge of the mother was passed on to the offspring but its interaction matrix elements were set to zero. Thus, it had to form its own opinions about other agents. Offspring remained with the mother for the first 20% of their maximum lifetime, creating a family unit.

2.12
If communication was the highest need and there were no other agents at that location then the agent would move toward the nearest candidate communicant. If activity was the greatest need then an agent would explore the landscape, remembering the location of food and material centers along with their current supplies. Agents sensed features in the landscape at a distance of 2 squares in each direction. Knowledge was time dependent since the status of the supplies at the centers changed during the course of the simulation. If the agent encountered the boundary of the landscape a new direction of movement was chosen randomly. Such "reflective" boundary conditions corresponded to isolated island geography.

2.13
Agent parameters were chosen with some care to enable a sustainable population and to allow multiple generations to arise within a single run of reasonable length. A lifetime of 4,000 timesteps allowed an agent to "learn" the entire landscape, required it to proceed through at least 40 sleep cycles, and procure food at least 6 times (200 units for consumption plus 400 units carried for later consumption). The probability of conception per mating event was adjusted to create a relatively flat population profile, without large "feast and starve" swings, consistent with the lifetime of 4,000 timesteps. The rather large carry capacity of 400 units, enough to satisfy food requirements for 10% of the agent's lifetime, was chosen to enable significant material accumulation to occur. Simulations were performed with an agent lifetime of 40,000 timesteps with results comparable to those reported here.

* Scenarios

3.1
Six scenarios focused on the effects of shelters, leadership, family, and in particular on the effect of different distributions of sharing and non-sharing agents.
  • M000: No home shelters, no leadership, and no family. This was a "hunter gatherer" society of individuals without attachment to location, family, or social unit. Hunger was satisfied only at food centers. No food or material collection.
  • MH00: Home shelters and food collection, but no material collection. No family and no leadership.
  • MHF0: Home shelters and food collection, but no material collection. Family units enabled but not leadership.
  • MH0L: Home shelters with food and material collection. Leadership but no family units. This scenario contrasted with MHF0 where there was no leadership but where there were family units.
  • MHFL: Home shelters with food and material collection. Both leadership and family were enabled. This was the most socially "advanced" of the simulations.
  • MHFLx: Similar to the MHFL scenario but all agents in one shelter required to be sharing and all agents in the other shelter required to be non-sharing.

3.2
In each of the scenarios, simulations were run for populations containing 10%, 50%, and 90% sharing agents. In the MHFL scenario, additional simulations were performed for 1% and 99% sharing agents.

* Results

4.1
The results of the simulations are shown in Tables 2, 3 and 4. The entries therein represent averages of five runs, each of which displayed generally similar behavior. Standard deviations are given for several key parameters. As demonstrated by the relatively small standard deviations in Tables 2 to 4, the results of the runs within a scenario type were generally consistent, with several exceptions noted below. Figures 2, 3, 4 and 5 show representative plots of populations, quality factor, shelter food supply, and shelter material supply vs. time. The total population typically displayed an initial constant phase as the agents aged to a point where procreation was possible. It then increased rapidly as the agents consumed the food surplus accumulated as a result of continuous food center refurbishment during the initial constant population phase. After this surplus was consumed the population fell to a level sustainable by the fixed food replenishment rate, which was the carrying capacity of the environment. Relative stability in the population occurred after two to four generations.

Table 2: Results of Simulations for All Agents

ScenarioasharingBirthsBirths
std dev
DeathsOld AgeOldAge
std Dev
HungerHunger
std dev
Exhaus
tion
AvgpopAvgqfAvgqf
std dev
Age/
Hunger
Social
Welfare
SW
std dev
Mat'lMat'l
std dev
MHFL0.011706401625622261013429.6106-730520.61-450592.3x1066.7 x105
M0000.12159542070569261499812.410953840.38223300
MH000.12114592026587361433906.0108210820.41893800
MH0L0.119538816816113212411208.6107270960.49140672.1x1064.5x105
MHF00.1169645161266114943357.8106210790.7015000
MHFL0.11519681434733496951205.41043501481.14202262.4x1065.0x105
M0000.52170732071630101439832.01061400850.446106400
MH000.5189010817976802611111315.81051300600.6182013000
MH0L0.518522617506819.11072348.21061500270.64950302.0x1062.0x105
MHF00.5155736146572927730656.361051300551.0130019000
MHFL0.5142064132878324539866.210314001001.521005601.2x1064.4x105
M0000.92226672141614191526831.01081600290.406505600
MH000.92011501925655111261318.61071600300.528303600
MH0L0.919111918426781211543211.21061800710.591000509.1x1052.6x105
MHF00.9155044146073119724647.61051600561.0160023000
MHFL0.9147731138974915634357.01041700581.220002105.0x1051.1x105
MHFL0.991439741338760185731094.61031800841.125007205.8x1052.6x105
MHFLx1Shelter1461851365743426161406.110312009401.3170014002.2x1068.2x105
MHFLx2Shelter14431201369747706151907.010215208101.4210012001.9x1066.4x105

avgpop: average population
avgqol: average quality factor for all agents


Table 3: Results of simulations for sharing agents

ScenarioasharingSharing Popqfshqfsh
std dev
strshcommcomm
std dev
shareshare
std dev
MHFL0.0116301605204.20.210.00540.0056
M0000.110.61100388008.00.1800
MH000.110.8920467907.00.110.000790.00018
MH0L0.19.712001208106.60.200.00230.00039
MHF00.110.51000808407.10.100.00190.00040
MHFL0.110.513001808606.20.220.0044.00041
M0000.552.815001108107.60.1800
MH000.553.01500688306.30.160.00200.000082
MH0L0.552.71700208505.30.0760.00570.00019
MHF00.551.01400688605.80.150.00360.00019
MHFL0.550.416001108704.70.230.00750.0011
M0000.998.11600278107.10.1500
MH000.995.81600388305.20.0900.00610.00044
MH0L0.995.01800778404.10.170.0110.0016
MHF00.993.61600638504.50.520.00980.00050
MHFL0.992.41700628703.80.110.0130.0015
MHFL0.991021800828803.50.300.0250.012
MHFLx 1By Shelter37.114003007002.90.780.00750.0035
MHFLx 2By Shelter44.315004006903.11.50.0140.0093

qfsh: average quality factor of sharing agents
strsh: average strength of sharing agents
comm.:communication rate for sharing agents
share:sharing rate for sharing agents


Table 4: Results of Simulations for Non-sharing agents

ScenarioasharingNon-sharing Popqfnsqfns
std dev
strnsstealsteal
std dev
MHFL0.01105-740498600.00350.00012
M0000.198.0-588882000
MH000.197.5130808300.00200.000035
MH0L0.197.4180888400.00280.000044
MHF00.195.2120778600.00270.000055
MHFL0.194.02501408700.00340.00014
M0000.554.913006383000
MH000.552.51200538500.00260.000053
MH0L0.553.51300178600.00300.0030
MHF00.553.91100488700.00330.000053
MHFL0.552.61200868800.00370.00012
M0000.910.215006381000
MH000.911.41400268500.00460.00018
MH0L0.911.21500578500.00360.00027
MHF00.911.21500278900.00520.00019
MHFL0.911.71500708800.00440.00023
MHFL0.991.111002856000.00280.00081
MHFLx 1By Shelter66.12404207930.00360.00064
MHFLx 2By Shelter55.13305677460.00350.00085

qfns: average quality factor of non-sharing agents
strns: average strength of non-sharing agents
steal.: stealing rate for non-sharing agents

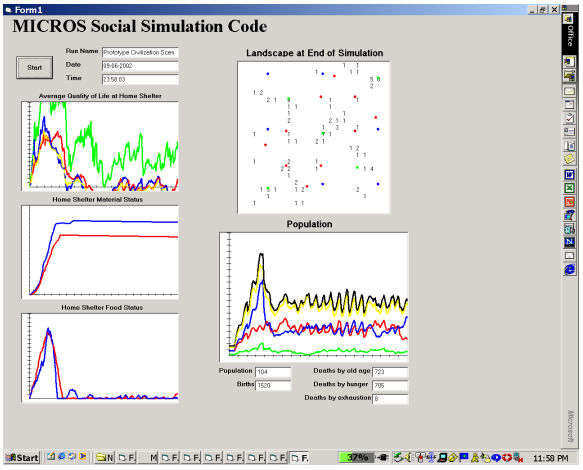
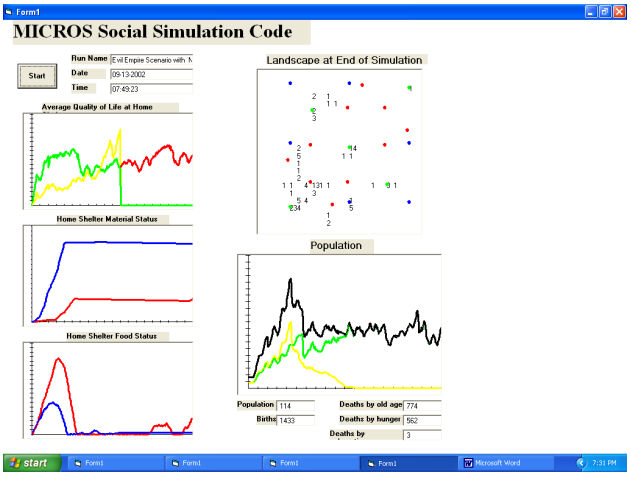
Figure 2. Output screen for MHFL run 83 with asharing=0.1. Red curves correspond to the home shelter at 5,5 and blue curves correspond to the home shelter at 15,15. Green signifies sharing agents and yellow non-sharing agents. The black curve is the total population. The home shelters have equal populations. Note the buildup of food surpluses during the population buildup phase. The population increases until the surplus is depleted and then collapses to a sustainable level. Stability is achieved after about three generations. Material collection is done mainly during the food surplus phase. Note the erratic nature of the quality factor for this low value of asharing.

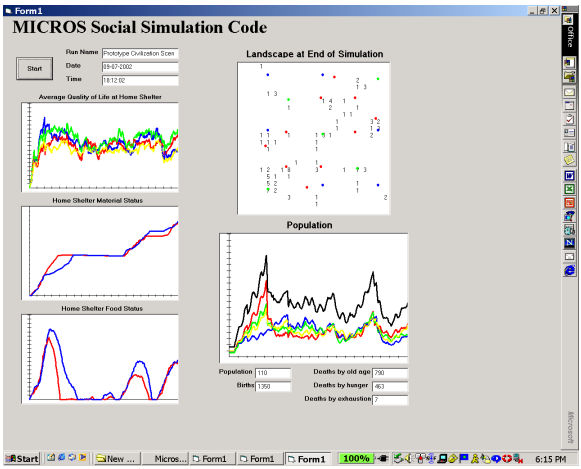
Figure 3. Output screen for MHFL run 88 with asharing=0.5. Red curves correspond to the home shelter at 5,5 and blue curves correspond to the home shelter at 15,15. Green signifies sharing agents and yellow non-sharing agents. The black curve is the total population. The home shelters have equal populations. There are several peaks in the total population corresponding to peaks in the food supply. Since the food replenishment rate is constant, this is due to a series "feast and starve" cycles wherein the population exceeds the ability for the food supply to sustain and then drops below that level. Material collection is done when there are food surpluses at the home shelters, as the leader must first ensure that the agents are fed before he or she can issue orders for material collection. The quality factor for all subpopulations follows the same temporal trend.

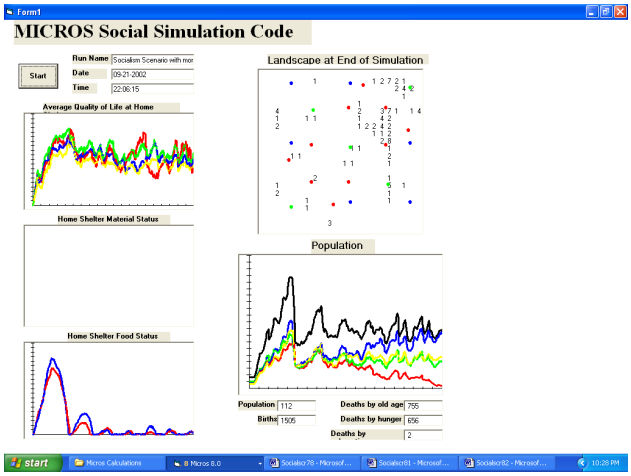
Figure 4. Output screen for MHF0 scenario run 83 with asharing=0.5. Red curves correspond to the home shelter at 5,5 and blue curves correspond to the home shelter at 15,15. Green signifies sharing agents and yellow non-sharing agents. The black curve is the total population. The home shelter at 5,5 (red) experienced a continuous decline in population in the latter half of the run. There is no material collection in the MHF0 Scenario.

Figure 5. Output screen for MHFLx scenario run 39. Red curves correspond to the sharing agent home shelter at 5,5 and blue curves correspond to the non-sharing agent home shelter at 15,15. Green signifies sharing agents and yellow non-sharing agents. The black curve is the total population. The population of the non-sharing shelter declines to zero by the middle of the run. The sharing agent shelter accumulated more food during the initial phase of the run but the non-sharing agent shelter accumulated more materials. Note the clustering of agents near the sharing agent home shelter in the snapshot of the landscape at the end of the run.

4.2
Oscillations in the total population occurred due to cycles of overpopulation followed by starvation and as a result of temporary age demographics affecting procreation. Since food was replenished at a constant rate, when the population decreased below the food replenishment rate a stockpile of food accumulated that enabled a follow-on population increase. The larger population could not be sustained given the fixed food replenishment rate so starvation occurred. Occasionally a late time food surplus at the home shelter led to a strong population peak many generations into the run. Such a peak was typically 1-2 generations wide. A short period oscillation in the total population was due to the simultaneous maturation of groups of agents. It was, in effect, a series of "baby booms".

4.3
Individual agents only owned the goods that they were carrying. This contrasts with a finders keepers strategy in which an agent need not be present at the location of a resource to claim ownership. Since the first priority of a leader was to assure an adequate food supply at its home shelter, material collection occurred only when food was plentiful - early in the run when the population was first building and later as oscillations in the total population led to temporary food surpluses.

4.4
The greatest material wealth was accumulated by those societies with the largest number of non-sharing agents. This is consistent with the economic analysis of altruism byJaffe (2002). The MHFL scenario with asharing=0.1 had the highest material accumulation. For asharing=0.5 and 0.9 the MH0L scenario exceeded MHFL in material collection. In the MHFLx scenario the non-sharing shelter collected 2-4 times the materials as did the sharing shelter. This economic dominance of non-sharing agents was the result of theft. Sharing agents collected and shared materials, including with non-sharing agents with whom they had not yet had a negative experience. Non-sharing agents collected materials on their own but also stole food and materials collected by others. Food stolen by non-sharing agents accelerated the formation of an adequate reserve at their home shelter, hastening the time when their leader could instruct them to collect materials. The quality factor of non-sharing agents was lower than that of sharing agents, but the material wealth of non-sharers was greater. Material collection in all scenarios exhibited a relatively large standard deviation, in some cases more than 30% of the mean, due to the sensitivity of material collection to food status and leadership parameters. Leaders with larger aggression factors drove their shelter populations harder, resulting in a greater accumulation of materials. Since leadership aggression was set randomly at the start of the run, and changed relatively infrequently, there was a significant variation of material accumulation among the runs within a scenario type.

4.5
Except for the MHFLx and MHF0 scenarios, both home shelters survived in only about half of the runs. When the populations in both shelters did persist until the end of the run, they would trade dominance over time. In the remaining runs, one shelter would die off as a result of a downward oscillation in population combined with the misfortune of agents visiting empty food centers recently depleted by agents from the other shelter. In no case did the total population go to zero. Leadership was both a help and a detriment to shelter continuation. The clustering of agents following leader instructions enhanced agent encounters. However, time spent collecting materials was time taken away from procreation. In the MHF0 scenario (family but no leadership) most runs had only one shelter survive. When family and leadership were both enabled (MHFL) and clustering was maximized, both shelters usually survived.

4.6
Results from the MH000 scenario were very similar in most respects to those from M000. Home shelters, the difference between M000 and MH00, had a small effect on survival. This contrasts with Cecconi and Parisi (1998) who found that a society in which agents contributed to a "central store", roughly the equivalent of the home shelter, had a higher probability of survival than a hunter-gatherer society. However, in Cecconi and Parisi (1998) food appeared randomly on the landscape rather than at predictable locations. This difference in food collection methods may account for the difference in results, but it also demonstrates the sensitivity of social survival to the details of the environment.

4.7
Clustering due to family relationships lowered the number of deaths due to hunger, allowing more agents to live to their maximum lifetime. This was apparent in the ratio (deaths due to old age / deaths due to hunger), given in Table 2, that was a measure of the difficulty of survival. For family scenarios, this ratio was usually greater than 1 indicating that most agents died of old age. For non-family scenarios, the number of deaths due to hunger was twice that due to old age. The highest relative rate of starvation occurred for the M000 scenario, the one with the least clustering of agents and the least social structure. The lowest relative rate of starvation occurred in those scenarios, MHFL and MHFLx, that included both family and leadership. Clustering in families and while following leader instructions enhanced sharing, social equity, and general agent survival rates. The importance of sharing was demonstrated in the variation of starvation rates with asharing. For the MHFL scenario with asharing =0.01 most agents died of starvation. For asharing=0.1 - only 10% sharing agents - most agents died of old age. Only a small fraction of sharing agents was sufficient to raise the survival rate and the quality factor of the entire population. The positive influence of altruistic sharing on social equity, as illustrated here in the lower starvation rate within scenarios that contained social clusters, has been noted by a number of authors. See for example Jaffe (2002).

4.8
Agent strength, usually about 850, varied by only a few percent among the runs of a given scenario. The exceptions were the MHFL scenarios for asharing=0.01 and 0.99 and the MHFLx scenarios.

4.9
Communication rates decreased slightly as asharing increased for sharing agents. (Non-sharing agents did not share information, so their communication rate was zero.) The highest communication rate was for the M000 scenario. The lowest communication rates were found in the MHFL scenario. The opportunity to communicate was increased within large clusters of sharing agents, but there was little "new" information to exchange since all agents in the cluster sensed the same things at the same time. Note that in all cases communication occurred between pairs of agents and not through a leader. The leader influenced communication rates only by causing agents to collocate as they carried out orders. Agents in the M000 and MH00 scenarios were the most independent and the most spatially distributed (least clustered) so that there was the widest variance of knowledge among the agents. In all of the scenarios all of the agents learned the location of all of the features of the (admittedly small) island landscape. Most communication events consisted of updating knowledge of quantities of food and materials at the collection centers.

4.10
The sharing rate increased by a factor of three as asharing increased from 0.1 to 0.9. This was expected since more sharing agents shared with one another. Sharing was highest in the MHFL scenario for all values of asharing. Leadership had a significant effect on sharing since agents were stimulated to collect things that they could subsequently share.

4.11
Stealing rates showed less sensitivity to asharing and to the scenario type than did the sharing rate. The stealing rate increased by less than a factor of two as asharing increased from 0.1 to 0.9 even though the number of potential victims was much greater. Linear dependence on asharing was not expected since there was a maximum rate at which theft could occur for a stealing agent. Once a non-sharing agent stole goods, it had to return them to its home shelter before stealing again. The highest stealing rate was observed in the MHF0 scenario with asharing=0.9. The lowest stealing rate varied for different asharing. For asharing=0.1 and 0.5 the MHFL scenario had the highest stealing rate, indicating that neither family nor leadership had a mitigating effect on stealing. In fact, the clustering associated with those two structures increased opportunities for theft. Non-sharing agents stole from any agents present at the same location - even family members.

4.12
The average quality factor for all agents in the simulation was relatively insensitive to the scenario (social structure) but strongly dependent on asharing. This was a key observation of these simulations - the agent quality factor was influenced more by the normative behavior of the individual agent than the social structure in which the agent acted. For the MHFL scenario with asharing=0.01, the quality factor was -730. Increasing asharing to 0.1 in the MHFL scenario erased the negative value and yielded a quality factor of 360. It took only a small number of sharing agents to significantly increase the average quality factor of the entire population. For asharing=0.5 the quality factor increased to 1400 and for asharing=0.9 it increased further to 1700. Note that after asharing=0.5 the net increase in quality factor was smaller, indicating that saturation was occurring. The importance of sharing in the quality factor was implicit in the definition of the latter. Points were added for goods shared and received, while points were subtracted when goods are stolen. Communication occurred only from sharing agents. More sharing agents meant that more events occurred that contributed positively to the quality factor. For asharing=0.5 and 0.9 the average quality factor for all agents was greatest for the MH0L scenario. For asharing=0.1 the highest quality factor was for the MHFL scenario. The lowest quality factor occurred in the M000 scenario. Leadership had a stronger influence on the quality factor than did family. This was because leaders directed agents to collect goods that could then be shared. Family units without leadership collected food only when it was required to satisfy hunger, so there fewer opportunities to share and contribute to their member's quality factor.

4.13
While social structure, as represented by the scenario type, did not have a major effect on the agent quality factor for asharing=0.5 and 0.9, it was an important determinant of agent death rates. The product of the average quality factor for all agents and the ratio (deaths due to old age / deaths due to hunger) represented a "social welfare factor". It followed the same upward trend for all asharing: M000 - MH00 - MH0L - MHF0 - MHFL. Figure 6 illustrates that when leadership was added to a society in which family structure was already present the increase in social welfare was much greater than when it was added to a non-family society. This is suggestive of the non-additive nature of behavioral norms. It also suggests that the degree of clustering, which was stimulated more by the collocation of family members than by leadership's issuance of orders for common goals, was an important mechanism for achieving social equity and hence in the overall "success" of the society.

4.14
For the sub-population of sharing agents the quality factor was always positive and ranged from 920 for the MH00 scenario with asharing=0.1 to 1800 for the MH0L scenario with asharing=0.9. The highest value for sharing agents was found in the MHFL and MH0L scenarios and the lowest in the MH00 and MHF0 scenarios. The difficulty for sharing agents in an environment dominated by non-sharing agents was evidenced by large oscillations in the quality factor of the sharing agents when asharing=0.1. (See Figure 2.) Such oscillations were due to the high frequency of stealing from the sharing agents, which occasionally resulted in the quality factor of non-sharing agents temporarily exceeding that of the sharing agents. Still, for the MHFL runs with asharing=0.01 and 0.1 the sharing agents had a quality factor which, while highly variable with time, was consistently positive. It was not uncommon for entire generations of non-sharing agents to exist with negative quality factor factors.

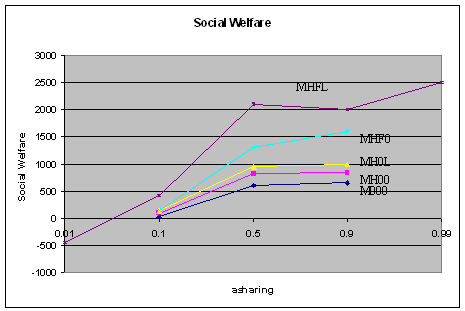
Figure 6. Social welfare factor, defined as the product of the quality factor times the ratio (agent deaths due to old age / agent deaths due to hunger).

4.15
In no case did the time averaged quality factor of the non-sharing agents exceed that of the sharing agents. With no benefits derived from sharing and communication, the non-sharing agents had lower quality factor factors. There was no clear preference of scenario for the quality factor of non-sharing agents.

4.16
The MHFLx scenario was of particular interest in that it put spatially segregated but interacting sharing and non-sharing societies in the same landscape. Mating was not allowed between members of the sharing and the non-sharing shelters. Two sets of ten simulation runs were done with the assignment of sharing and non-sharing agents to home shelters reversed between sets. The results of the two sets were comparable. In five out of the twenty simulations the population of the non-sharing shelter went to zero whereas the population of the sharing shelter attained a stable equilibrium. In thirteen cases the population of the sharing shelter went to zero, indicative of the inability of the sharing agents to endure the abuses of the non-sharing agents. In only two cases out of twenty did both subpopulations persist. This contrasts with the MHFL scenario in which both shelters survived in more than 80% of the runs. For the sharing shelter, the quality factor, communication, and sharing parameters were comparable to those of the MHFL scenario with comparable asharing. The quality factor of the non-sharing shelter was higher than that for an all-non-sharing total population and lower than that for a fully mixed population. However, the non-sharing shelter quality factor was positive only while the sharing shelter population survived. Segregation affected the quality factor of non-sharing agents much more than it did the sharing agents. More deaths occurred as a result of old age than hunger, consistent with the MHFL scenario that had the same rules of behavior but an integrated society. The non-sharing shelter accumulated several times the material wealth of the sharing shelter. The sharing shelter collected more food than the non-sharing shelter. In analyzing the cause of the collapse of the sharing shelter, it was found that most agents died of old age rather than starvation. In some cases a food surplus existed at the sharing shelter while the population steadily declined to zero over a period of several generations.

4.17
As a test, eight MHFLx simulations were performed with the food replenishment rate increased to supply 200 agents. The results of these larger runs were consistent with the smaller ones. In five of the large runs the sharing shelter population went to zero. In two cases the non-sharing shelter population went to zero. In one case both sub-populations survived until the end of the run. Similar large population runs were made for the MHFL with results comparable to those for the smaller MHFL runs. These results should be treated cautiously since more agents in a fixed size environment resulted in a higher agent density with associated higher agent interaction rates.

4.18
Results from runs within a specific scenario type were generally similar, with the standard deviation of most quantities less than 10%. The exception was for asharing =0.1 where the quality factor and social welfare factor were smaller and the relative variations greater. The large standard deviations for these quantities in the MHFLx scenario was due to the bimodal nature of the resulting population - it tended either to all sharing, with high quality factor and social welfare, or an all non-sharing population, with lower values.

* Summary and Discussion

5.1
There are four main results from this work.
  • The strongest influence on the specific formulation of the culture-dependent quality factor used here was the fraction of sharing agents in the population. Only a small admixture of sharing agents was required to create a reasonable quality factor for the entire population.
  • Clustering in family units significantly increased the fraction of agents who survived into old age.
  • Leadership increased the agent quality factor and increased the fraction of agents who survived into old age.
  • Material collection was greatest for populations with large fractions of non-sharing agents.

5.2
In all of the scenarios the most important determinant of the quality factor of the agents was asharing, the fraction of sharing agents relative to the total population. It was the behavioral norms of the individual agent rather than the social structure (family and leadership) that was most important for individual development as measured by the quality factor. Only a relatively small number of sharing agents was required to significantly raise the agent quality factor. Even with half of the population exercising non-sharing behavior, the non-sharing agents still attained a reasonable quality factor. Sharing resulted in short term loss to the sharer but it maintained the opportunity to receive goods and information from the agent being shared with. The contribution of sharing to the interaction matrix element and the quality factor represented an unconscious expectation of future behavior on the part of the other agents. It was a form of non-economic payment for the goods shared. Stealing from a sharing agent produced a short term economic gain but eliminated any future opportunity of receiving good from that agent. Again, the composition of the quality factor used here represents one only possible choice for the social value structure. Other value structures, such as ones that reward acts of violence over acts of sharing, will yield different results.

5.3
The second major result of this study was the benefit of clustering in family units on the fraction of agents who survived into old age. This was due to efficiencies in the distribution of food. Individual agents in the absence of a family unit would eat at a food center and carry as much as they could back to their home shelter. This would result in rapid depletion of the center and concentration of food at one location - the home shelter. A family unit could easily empty a food center but family members would share the food. In this sense family units were more effective at food distribution than was the central storage site represented by the shelter. This is an extension of the conclusions of Cecconi and Parisi (1998) who studied the benefits of central storage on social performance. It is suggests that individual normative behavior, resource strategies, and social structures are not independent influences on society but interrelate in a complex fashion.

5.4
The third observation of interest was the positive effect of leadership on the quality factor. The MHFL and MH0L scenarios, both of which had leadership, had higher quality factor factors than the corresponding MH00 and MHF0 scenarios that lacked leaders. This was due to the larger probability of agents having goods to share as they followed the collection orders of their leader. Simply put, sharing agents could not share if they were not carrying anything. Leadership promoted the clustering of agents conducive to sharing, as indicated by the higher sharing rates found in scenarios with leadership. The importance of clustering was further demonstrated by the fact that leadership had a much greater effect on social welfare when it was combined with family than when it was applied to a non-family society.

5.5
The final observation, that material collection was anti-correlated with asharing, was true in all scenarios. This was due to the ability of non-sharing agents to take goods from other agents. Non-sharing agents had the same requirement as sharing agents to create a food surplus at their home shelter prior to material collection. Being able to collect food from other agents as well as from food centers increased the rate at which such a food surplus could be assembled and allowed the non-sharing agents to begin material collection sooner. Non-sharing agents also stole material points directly from sharing agents. The improved economic performance of non-altruistic (non-sharing) agents is consistent with the results of Jaffe (2002).

5.6
Several parallels with real-world hunter gatherer societies can be draw from these results. In a resource constrained environment a central store has a beneficial effect on population dynamics by providing a safety net for agents, a known position where there is a high probability of food. The M000 scenario, the only one that lacked central storage in home shelters, had the highest starvation rate of any scenario studied.

5.7
Sharing resulted in a greater degree of social equity, as evidenced by the reduced starvation rates for groups with a larger number of sharing agents. And, placing the individuals in social structures that optimized the collection of goods and the opportunity to share them further reduced starvation rates. Hunter gatherer societies use sharing as a means of assuring survival of the group in the face of uncertainties of individual success at procuring food. Sharing by an individual represents an investment in and expectation of future social equity. For this to occur most members of the group must agree even when it is not in their immediate self interest - in essence a forced norm-abidance rather than a situation-dependent implementation of rules.

5.8
Note that storage itself is a form of sharing, even though it does not involve an agent to agent transfer. If the central store is available to all, as it is in these simulations, it enhances rather than detracts from social equity. An interesting question is whether the advantages of a central store might outweigh the benefits of inter-agent sharing. The age/hunger death ratio, given in Table 2, suggests that, within the limited confines of our simulation, this is true. For the non-storing scenario M000 age/hunger=0.40 for asharing=0.9, compared to the range 0.41 to 0.52 found when central storage is added in the MH00 scenario. This is consistent with the observation of Testart (1982) that the importance of sharing decreases in primitive societies with significant storage capabilities. In effect, storage replaces reliance on other members of the society. However, our study also found that increased clustering due to social structure increases the age/hunger ratio by more than a factor of two. It is not merely sharing, but the social environment in which that sharing occurs that is important. Behavioral norms, socio-economic structure, and the environment are not independent but are synergistic in the development of societies.

5.9
A possible counter argument to the benefits of sharing arises in the finding that the age/hunger ratio peaks at asharing=0.5 even through the sharing rate monotonically increases with asharing. While goods are shared and social equity is presumably enhanced for larger asharing, the resulting food is insufficient to consistently sustain as many members of the population. At the same time, the average quality factor of the agents increases suggesting that the non-material rewards associated with sharing continue to accumulate even though the survival stress on the individual increases. The present simulations did not include any calculation of utility factor on the part of the agents. Agents acted according to a fixed set of rules with survival their highest priority. They did not seek to maximize their quality factor. The result was that altruistic behavior led to an optimization of quality factor rather than an optimization of physical survival. This is consistent with the importance of non-economic reward structures found in some primitive societies. It would be interesting to use the MICROS model to simulate a specific society, adjusting the construction of the quality factor to match the social values of that culture. Candidates for such a study include semi-isolated peoples such as the natives of the Southwestern United States Dean et al. (1999), the island cultures of Hawaii and Polynesia, among others.

5.10
The quality factor and interaction matrix were intended to monitor non-economic payment for sharing and another activities within one plausible social value structure. One can and should investigate other reward structures, but it is clear from studies of primitive societies that non-economic payment is important in establishing social balance. While altruism increases equity in terms of physical goods, significant inequity can occur in prestige and social standing, leading to complex power structures among otherwise physically indistinct individuals. One should also investigate other social structures and the effect of different leadership styles. For example, some hunter gatherer societies reward the successful hunter with multiple spouses in contrast to the single mate family modeled here. Also, the effects of leader charisma and administrative talent are not modeled here but are important factors in the development of some societies.

5.11
The model used here could be extended in several ways. Communication of normative reputations, found to be important by Castelfranchi, Conte and Paolucci (1998) could be included, as could models for aggression. Evolution, lacking in the present model, might provide important insights into the adaptation of individual and social structures to changing environmental factors. And, the segregation of sub-populations, combined with their exploitation by other groups, would provide insight into the effects of discrimination.

* Government Report Disclaimer

This report was prepared as an account of work sponsored in part by an agency of the United States Government. Neither the Regents of the University of California, the United States Government nor any agency thereof, nor any of their employees make any warranty, express or implied, or assume any legal liability or responsibility for the accuracy, completeness, or usefulness of any information, apparatus, product, or process disclosed, or represent that its use would not infringe privately owned rights. Reference herein to any specific commercial product, process, or service by trade name, trademark, manufacturer, or otherwise does not necessarily constitute or imply its endorsement, recommendation, or favoring by the Regents of the University of California, the United States Government, or any agency thereof. The views and opinions of authors expressed herein do not necessarily state or reflect those of the Regents of the University of California, the United States Government, or any agency thereof.

* Acknowledgements

The author wishes to thank the several reviewers who provided valuable suggestions for the improvement of this paper.


* References

CASTELFRANCHI C (1998), Modeling social action for AI agents. Artificial Intelligence 103, 157-182.

CASTELFRANCHI C, Conte R and Paolucci M (1998), Normative Reputation and the Costs of Compliance. Journal of Artificial Societies and Social Simulation 1(3).

CECCONI F and Parisi D1998), Individual versus Social Survival Strategies. Journal of Artificial Societies and Social Simulation 1 (2).

DANIELSON P (1998) Modeling Rationality, Morality, and Evolution. New York: Oxford Press.

DEAN JS, Gumerman, GJ, Epstein, JM, Axtell, RL, Swedlund, AC, Parker, MT, and McCarroll, S (1999) "Understanding Anasazi Culture Change Through Agent-Based Modeling". In Kohler T and Gumerman, G (Eds.), Dynamics in Human and Primate Societies, New York: Oxford University Press.

JAFFE K (2002) An Economic Analysis of Altruism: Who Benefits from Altruistic Acts? Journal of Artificial Societies and Social Simulation 5 (3).

MACY MW and Willer W (2002) From Factors to Actors: Computational Sociology and Agent-Based Modeling, Annual Review of Sociology 28, 143-166.

SAAM N J and Harrier A (1999) Simulating Norms, Social Inequality, and Functional Change in Artificial Societies. Journal of Artificial Societies and Social Simulation 2, (1).

TESTART A (1982) The Significance of Food Storage among Hunter-Gatherers: Residence Patterns, Population Densities, and Social Inequalities, Current Anthropology 23, 523-537.

YOUNGER S M (2002) Discrete Agent Modeling as a Tool For the Study of Individual and Social Development: The MICROS Code (Version 8.0), Los Alamos National Laboratory Report LA-UR-02-7009http://lib-www.lanl.gov/cgi-bin/getfile?00852082.pdf.

----

ButtonReturn to Contents of this issue

© Copyright Journal of Artificial Societies and Social Simulation, [2003]