© Copyright JASSS

  JASSS logo ----

Rob Stocker, David G Green and David Newth (2001)

Consensus and cohesion in simulated social networks

Journal of Artificial Societies and Social Simulation vol. 4, no. 4
<https://www.jasss.org/4/4/5.html>

To cite articles published in the Journal of Artificial Societies and Social Simulation, please reference the above information and include paragraph numbers if necessary

Received: 4-Jul-01      Accepted: 30-Sep-01      Published: 31-Oct-01


* Abstract

Social structure emerges from the interaction and information exchange between individuals in a population. The emergence of groups in animal and human social systems suggests that such social structures are the result of a cooperative and cohesive society. Using graph based models, where nodes represent individuals in a population and edges represent communication pathways, we simulate individual influence and the communication of ideas in a population. Simulations of Dunbar's hypothesis (that natural group size in apes and humans arises from the transition from grooming behaviour to language or gossip) indicate that transmission rate and neighbourhood size accompany critical transitions of the order proposed in Dunbar's work. We demonstrate that critical levels of connectivity are required to achieve consensus in models that simulate individual influence.

Keywords:
Artificial Societies; Cohesion; Communication; Complexity; Connectivity; Influence; Simulation; Social Networks

* Introduction

1.1
Social structures depend on connectivity and information exchange. The formation of social structures in a population is a complex process. Hogeweg and Hesper (1983) have demonstrated, through simulation studies, that social structure and group behaviour can emerge from simple interactions between individuals. Recent studies by Gilbert and Troitzsch (1999), Iwanaga & Namatame (1999), Kubo et al. (1999) and Uno et al. (1999) extend these findings to human societies. Fundamental to the investigation of social structures are the patterns of relationships, defined by connections between inter-dependent individuals and the flow of information, that provide for opportunity or constraint on individual and group action (Wasserman and Faust 1995). Recent studies of social systems have explored the relationship between the structure and dynamics of social systems (Klüver and Schmidt 1999).

1.2
One important issue in studies of social phenomena is to determine what patterns emerge as a consequence of a society's structure and dynamics, as distinct from the detailed nature of its individual members. Is it therefore possible to relate particular properties of social groups to the nature of their structure? Several studies indicate that this is possible (for example: Dunbar 1996; Klüver and Schmidt 1999).

1.3
Classical approaches to analysis of social structures include those that are explicitly relational although many sociologists often focus on the individual level attributes and ignore the dynamics of linkages between them (Wellman and Berkowitz 1988). However, social structures arise from regularities or patterns of relationships based upon the interactions of interdependent individuals (Wasserman and Faust 1995). This view describes social structure as an emergent phenomenon based on two types of rules. General (or qualitative) rules describe local actions of individuals independent of their capacity to interact, and topological (or quantitative) rules describe the possibility of interactions through connections between individuals (Klüver and Schmidt 1999). Here we address how patterns of communication and connectivity in societies affect the spread of ideas and group opinion or consensus.

Grooming, language and group size

1.4
Dunbar (1992, 1995 and 1996) has argued that language (in particular social gossip) evolved as an alternative to grooming. Grooming behaviour in primate species is the principal means of forming relationships between individuals. Humans, however, form relationships through social gossip. Language permitted greater communication and cohesion within social groups by allowing each individual to keep better track of alliances within the group. Language proved a more effective and efficient tool (Campbell 1984) to form mutually supportive coalitions. Language enabled humans to sustain larger group sizes. Broad social community boundaries suggest that humans are linked to around 1000 - 2000 others, with routine and intimate contact amongst 100 - 160 (Wellman et al. 1998). Primates, on the other hand, appear to have mean core group sizes of 1 - 15 whilst variation up to 65 is evident (Dunbar 1992). Dunbar's hypothesis is that the greater social interaction permitted by speech allowed social groups to grow from a mean natural size of 30-40 individuals in primate groups to a mean natural size of 100-150 individuals in human groups.

Simulation and social networks

1.5
Improved computational resources have provided social network researchers with the means to develop flexible models of non-linear, adaptive systems. These social network models accommodate different relationships between actors by structuring connections that are dependent upon each actor's behavioural characteristics (Liebrand 1998). Social network simulation research is therefore useful in testing current theory and exploring new possibilities, where real-life experimentation is impossible (Conte, Hegselman and Terna 1997). Troitzsch (1998) supports the value of qualitative results from such simulations, buts cautions against placing reliance on quantitative results.

1.6
In this study, we use simulation models of social structures to investigate a number of emergent phenomena. These include mechanisms of growth in the size of social groups, the effects of connectivity, individual influence and information exchange and consensus over time for a number of social structures, the effects of connectivity, transmission rate and group size on spread of a new idea, and phase change in connectivity within random graphs that represent social structure. In Section 2, we describe a number of general network models and the properties of social structures. Section 3 explains our simulation models of social systems and Section 4 describes the results obtained from them. Finally, in Section 5 we discuss the wider implications of this study.

Properties of social structures and general models

2.1
In human social systems, interactions between individuals occur through associations in various situations that include family, work, recreation, sports, and the like. Common to these interactions is the establishment of relationships that rely on patterns of connection and information exchange processes. Simulation models provide a systematic means of investigating patterns that emerge from the interaction of explicitly defined states of individual actors and the causal processes that change these states over time (Hanneman 1995).

Social structures

2.2
Patterns of connections and information exchange in society are varied. Social structures respond to many influences (Scott 1991; Wellman and Berkowitz 1998). For example, connections between individuals and the influence of an individual over others are critical to establishing and maintaining a social structure or network. Individuals within a network, who control and distribute resource information, affect the collective behaviour of the network (Marsden 2000). For example, in family groups parents influence their children and community leaders are regarded as influential over the rest of the community. In any society, communication pathways and patterns of influence take on characteristic patterns.

General models

2.3
Simulation models of social networks are used for both explanatory and predictive purposes. Such models, that can be based on cellular automata (CA), artificial worlds and others, describe patterns that arise from the interaction of individual agents or actors (Troitzsch 1997). In the models described below, we relate social networks to graphs where the nodes represent individuals in a population and edges represent communication pathways.

2.4
Social networks have various structural forms. Social networks, as modelled here, are homomorphic to other structures that include spin-glass (Ising 1925; Heisenberg 1928; Peierls 1936; Bak and Bruisma 1982), Potts model (Potts 1952), CA (Nowak and Lewenstein 1996) and random graph (Erdös and Rényi 1960).

2.5
Network parameters include: the number of nodes in the network (size); the number of connections per node (connectivity); the template for the neighbourhood of each node (neighbourhood); function(s) that describe the interaction between nodes (rule scheme); and the method for changing the state of each node (updating) (Wuensche 1998).

2.6
CA are regular networks where nodes are connected according to a fixed template and take input from nearest and next nearest neighbours according to the same logical rule (Fig 1a). Updating is usually synchronous.

2.7
A.random boolean network (RBN) is a random lattice with a finite state automaton at each site of the lattice. Each node's state can take a value of 0 or 1. Links between nodes located in the spatial array are specified at random (Fig 1b) and the number of links to each node may vary. How each node is wired relative to its neighbourhood is called the wiring. An update rule or function is applied at each node and any node's updated or new value depends on the values of the nodes to which it is directly connected. Thus the neighbourhood of a node is the set of connected nodes at arbitrary locations within the system. Although each of the nodes is randomly connected, the network is statistically homogeneous with most nodes having the same number of connections (Fig 2a) (Jeong et al. 2000). Work on RBNs has focussed on their dynamics - we are also concerned here with their basic topological properties.

Figure 1: Network wiring: (a) 1-D cellular automata with a neighbourhood of three - all nodes are connected to left, right and centre nodes; (b) 1-D random boolean network - each node is randomly connected to three other nodes to form a pseudo-neighbourhood.

2.8
While some network models are random, others are heterogeneous scale-free networks (Fig 2b) in which the topology is characterised by "a few highly connected nodes linking the rest of the less connected nodes to the system" (Albert, R et al. 2000; Jeong et al. 2000). Here the rate that information spreads throughout the network depends on whether the source node is highly connected or not. The network is therefore sensitive to the removal of highly connected nodes.

2.9
Hierarchical networks are also evident in social structures, for example, organisational structures for commercial, government and military establishments and genealogical trees (Fig 2c). The topology is characterised by a "tree" structure. Information flow in hierarchical network structures is vertical and the spread of information throughout the network depends on that information being passed to the node located at the top of the tree.

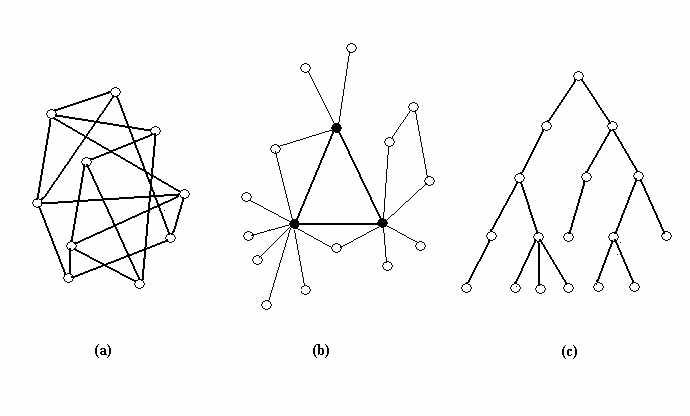
Figure 2: Visual representations of the structure of (a) random, (b) scale-free (Albert, R et al. 2000) and (c) hierarchical networks.

Topological properties

2.10
Patterns of connectivity between individuals in a society provide the topologic rules that define a graph. Communication pathways, in which individual influence directs the flow of information, form a directed graph. "Small-world networks" (Watts and Strogatz 1998; Barrat and Weigt 2000) provide valid models of many real-world systems. For instance, the length of the shortest path connecting two nodes in the network grows slowly (usually logarithmically) in relation to the size of the network (Bollobás 1985). Thus phase changes, from disconnected to fully connected, as the number of links between individuals increases, can be anticipated as with many other complex systems (Green 1993).

2.11
One significant property of random graph structures is criticality (Erdös and Rényi 1960). This occurs as the random addition of connections between nodes form connected sub-graphs. Initially the sub-graphs (groups) formed are small. However, as the number of edges reaches N/2 (where N is the number of nodes) a percolation process (Stauffer 1979) results in critical behaviour where the small groups rapidly merge into a single large group containing most of the nodes in the graph (Fig. 3). Large changes in the size of groups (of connected nodes) and path length (between any two nodes) occur in response to small changes in connectivity close to the critical number of edges. This complex behaviour is sensitive to initial conditions at the critical point.

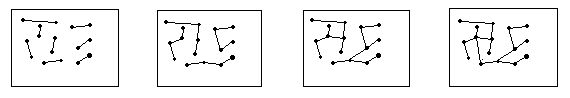
Figure 3: Increasing connectivity shown during the formation of a random graph, as edges are added to join pairs of vertices. Notice the formation of groups (connected sub-graphs) that grow and join as new edges are added.

Cooperation, cohesion and spread of ideas

2.12
The importance of cooperation (Macy 1998) and cohesion as an evolutionary strategy (Dunbar 1996), imply that individuals in a social group develop common goals, based on patterns of interaction and exchange of information, that is, on connectivity and communication. Yet communication does not necessarily guarantee cooperation. What affects cooperation and cohesion? We argue that there is cohesion if social group members reach common ground, share common ideas or agree on important issues and share a sense of group identity. For communication to occur individuals must be connected. Levels of connectivity and individual influence play a key role in social cooperation and cohesion. We investigate the spread of ideas and change of opinion in an artificial society by introducing a new idea via one member of the population. This individual communicates the idea, via its connections, to other individuals who in turn communicate the idea to other connected individuals in an iterative process. Each individual is able to make a decision to agree or disagree with the "invading" idea based on levels of influence and susceptibility of interacting connected individuals.

2.13
Ideas spread throughout a community from person to person. From relatively small numbers of adherents, through the intervention of influential individuals, media promotion, social gossip, etc., an idea can become accepted across a significant proportion of society. The number of individuals who accept an idea grows exponentially once a critical "tipping point" is passed (Gladwell 1999; Furman and Gallo 2000) clearly resembling the criticality property of random graph structures (Erdös and Rényi 1960). Patterns that resemble epidemics also emerge. These are dependent upon individual influence and the strength and contextual relevance of ideas (Marsden 2000). Burt (1982), in studies of "highly trained technical professionals", suggests that diffusion of ideas through social structures depends on cohesion (a function of member's advisors and discussion partners) and personal preferences. More importantly, structural equivalence (a function of member's position in the social structure), is more likely to generate social pressure. In general populations, structural equivalence and individual influence can be equated.

2.14
Recent studies (Harvey and Bossomaier 1997) question the validity of synchronous updating in Random Boolean Network models. In real communities, the interactions between individuals occur pair-wise (or in small groups). The process of changing opinions depends on the relationship between an individual and its connections to others. That is, the states of individuals do not all change synchronously, but a few at a time. In the models used in this study, we therefore process state changes via asynchronous updating.

Simulation models of social network structures

3.1
In this study we develop models that represent individuals in a social network by nodes in a graph. Connections (or edges) between the nodes represent the pathways through which information exchange can occur. We establish general rules to describe the behaviours of nodes and topological rules to describe connectivity patterns.

3.2
Each node can be in a number of states, in the basic model proposed here, limited to two. These two states represent an individual's opinion on a particular issue. The most fundamental opinion is whether or not an individual regards him/herself as part of the social group. Opinion is expressed as either agreement (represented by 1), or disagreement (represented by 0) following Boolean idealisation (Kauffman 1992).

3.3
General Rules - each individual is represented as a threshold automaton.

  • Each node's state or "opinion" influences the state of neighbouring nodes to which it is directly connected. Likewise, each node's state is influenced by the state of the neighbouring nodes that are directly connected to it.
  • Each node is initially seeded (randomly) with a starting state (0 or 1) and a level of influence (expressed as a value between 0 and 1) that represents the strength by which a given node communicates its current state.
  • Each node is initially seeded (randomly) with a susceptibility (expressed as a value between 0 and 1) that it will change from its current state.
  • Change in current state depends upon relative influence and relative susceptibility during interaction between connected nodes.

3.4
Topologic Rules

  • Connections between nodes are established randomly as the edges through which communication can take place.
  • The average number of connections per node (expressed as a percentage of the population) can be varied to investigate its effect on agreement.

3.5
The model provides each node with the ability to change state depending on:
  • comparisons between the starting state of connected nodes,
  • the relative influence between nodes, and
  • the relative susceptibility between nodes.

Results

Spread of ideas and opinions

4.1
We begin by examining the spread of a new idea through a community. This model simulates the process in which a new idea, as represented by a new state, invades a community that is in some "old" state. We assume that the invasion process is relatively fast, so we treat it as an epidemic process. That is, an "infected" node exposes its neighbours, which in turn either become infected, or remain "immune" for the rest of the run. There is no subsequent interaction between infected nodes afterwards. We examine changes in group size, (represented by the number of nodes that end up in the invading state - "infected") when the probability of infection (transmission rates) is varied between 0.01 and 1.0 and the number of directly connected neighbours (connectivity) is varied between 1 and 10. The epidemic is started at the centre of an array (population) of 2500 nodes and the number of infected nodes recorded. Results were averaged over 10 runs.

4.2
The resulting dependency of average group size on transmission rates and neighbourhood size is shown in Figure 4. For small neighbourhoods (connectivity value up to 2), agreement is limited to groups no larger than 30, especially where transmission rates were less than 1.0. However, for neighbourhood sizes of greater than 3 and transmission rates greater than 0.5, the size of infected groups rapidly approaches the population size.

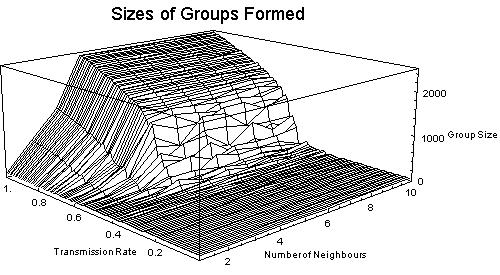
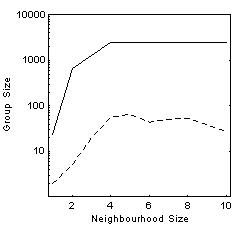
Figure 4: The effects of neighbourhood size and transmission rates on the formation of groups in a simulated landscape (within a universe of 2500 individuals. Average group size dependency on transmission rates and neighbourhood size.

4.3
The above observations are illustrated more clearly in Figure 5, which extracts some of the key data about group size from Figure 4. With a perfect transmission rate (1.0), group size increases rapidly with the number of directly connected neighbours (Fig. 5a - solid line). The curve levels off only because the group encompasses the entire population. In an infinite model, the group size would increase without limit. With an imperfect transmission rate (e.g. 0.5) the group size increases more slowly and on average settles down at around a group size of slightly under 100 (Fig. 5a - dashed line). These results imply that transmission rate - the extent of individual influence - plays a major role. So, we plot the average transmission rates that were required to produce groups of 30 (Fig. 5b - dashed line) and 100 (Fig 5b - solid line). These are the critical groups sizes alluded to by Dunbar. The curves show that the group size is highly sensitive to transmission rate with an increase of only 0.1 in the average accounting for the change.

(a)(b)
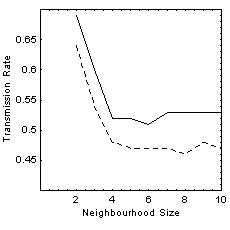
Figure 5: The effects of neighbourhood size and transmission rates on the formation of groups in a simulated landscape (within a universe of 2500 nodes). (a) Average group size for transmission rates of 1.0 (solid line) and 0.5 (dashed line). (b) Transmission rates required to form a group of over 100 nodes (solid line) and over 30 nodes (dashed line).

Agreement and influence, connectivity and communication

4.4
Above, we looked at the initial spread of a new idea. However, social cohesion depends on whether or not the group can remain in agreement over the long term. To examine dynamic changes in a community over time we simulate the effects of influence, connectivity and communication on consensus (agreement expressed as the number of yes ideas) within various social structures of 100 nodes. We examine the model's behaviour around the region of critical connectivity. The model was set up with connectivity levels of 0.1, 1.0, 3.0, 3.5, 5.0 and 10 percent of the population, for 5 iterations of 500 time steps. Results of the five iterations were averaged. The level of influence was varied as follows:
  1. all nodes are randomly assigned a level of influence (0 - 1),
  2. all nodes are assigned a fixed level of influence (0.1, 0.25, 0.5, 0.75, 1.0),
  3. one selected node is assigned a high level of influence (1.0), at specific positions in the social group (1, 25, 50, 75, 100), the remaining nodes are all assigned a level of influence of 0.1,
  4. all nodes are randomly assigned a level of influence, with different population size (100, 500 and 1000) and connectivity (0.1, 1.0, 3.0, 3.5, 5.0 and 10)

Randomly assigned level of influence (0 - 1)

4.5
Results (Fig 6a-c) show the accumulation of yes ideas (consensus) for the 100 nodes over time. For direct connectivity (social network diameter of 1) greater than 5%, polarisation (complete agreement or disagreement) occurred within 100 - 150 time steps (Fig 6a). For connectivity below 3.0%, the model settled into an oscillatory pattern of between 45 - 65% agreement after a transient period of about 50 time steps (Fig 6b). At between 3.0 and 4.0% connectivity the model exhibited complex behaviour (Fig 6c).

(a)(b)(c)
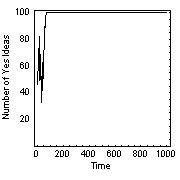
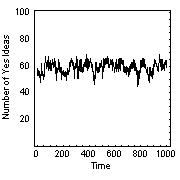
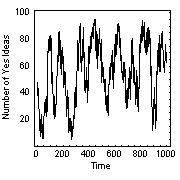
Figure 6: Levels of agreement (number of "yes" ideas) in a simulated society of 100 nodes. (a) demonstrates rapid polarisation (either complete agreement or disagreement) at 5% connectivity or above. (b) shows oscillatory behaviour at less than 3.0% connectivity. (c) demonstrates the region of critical behaviour for connectivity levels of 3.0 to 4.0%.
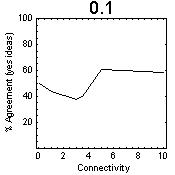
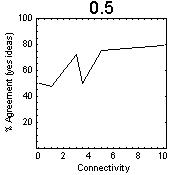
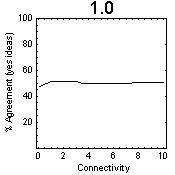
All nodes assigned a fixed level of influence (0.1, 0.25, 0.5, 0.75,1.0)

4.6
Above, we have considered heterogeneous populations with random social order, where different levels of influence are randomly assigned to each node. Here, we examine what effect assigning the same level of influence to all nodes will have on homogeneous populations. We assume the simplification, that for societies in which clearly defined class distinctions (castes) are evident, all members of that caste have the same level of influence. With all nodes having the same high level of influence (1.0), the population maintains a "status quo" (Fig 7c) of around 50% agreement. At the 0.5 level of influence, quite dramatic changes in consensus occur around the region of criticality, where connectivity is 3.0 - 5.0%. Past this region, consensus increases slowly (Fig 7b) from around 75% to 80% agreement. At the 0.1 level of influence (Fig 7a), consensus plateaus out at 60% agreement after the region of critical connectivity. It is clear from Figure 7, that levels of influence and connectivity (average number of connections per node expressed as a percentage of the population) affect consensus in a homogeneous population. The results suggest that better levels of consensus are more readily reached in class groups with mid-range levels of influence.

(a)(b)(c)
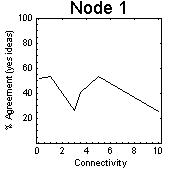
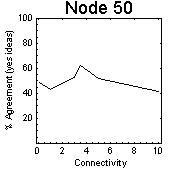
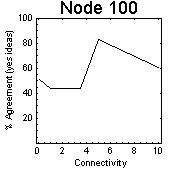
Figure 7: Effects of fixed levels of influence assigned to each node in the population showing critical behaviour at 3.0 to 5.0% connectivity (average number of connections per node as a percentage of the population), and change in agreement after the region of critical connectivity. One node at a specific position with high level of influence (1.0)

4.7
Above, we introduced populations where social order was constrained or highly structured. We continue by looking at a simple dictator model in which one node is assigned a level of influence of 1 and the remaining nodes are assigned a level of influence of 0.1. For different experimental runs the "dictator" node is placed in various positions in the population. This model is sensitive to group size and connectivity, regardless of the position of the dictator node. The most obvious effects are that there is a broader region of critical connectivity (1.0% - 5.0%), and consensus declines after the region of critical connectivity (Figure 8a-c). This suggests that in controlled societies, a higher level of critical connectivity is required to maximise consensus.

(a)(b)(c)
Figure 8 (a-c): Effects of varying the position of a node (with maximum influence) on agreement in the population, showing the region of criticality occurring between 1.0% and 5.0% connectivity.

Effect of population size and connectivity on the rate of consensus

4.8
Finally, we examine how the rate of consensus (expressed as the percentage of nodes in the population that changed state to agreement) is related to increases in population size and connectivity. Does a small population with high connectivity (e.g. a small rural town or primate group) have a higher rate of conversion to consensus than a larger population (e.g. larger town or human social group) with similar connectivity? In Figure 9, a population size of 1000 (dashed line) is compared with a population size of 100 (solid line). It is clear that as the population and connectivity increases, the percentage of nodes that change states increases. However, note that significant change for larger population sizes occurs across all ranges of connectivity, and particularly around the region of critical connectivity (3.0% - 4.0%). Note also that, at the region of critical connectivity, group sizes that reach consensus are 3 - 5 (3% - 5% of population) for population size of 100, and 160 - 170 (16% - 17% of population) for population size of 1000, approximating the values proposed by Dunbar.

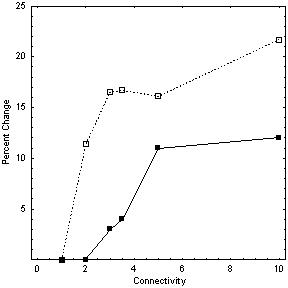
Figure 9: The effects of increases in connectivity for population sizes of 1000 (dashed line) and 100 (solid line), on the percentage of nodes in the population that changed state to consensus.

Discussion

5.1
The results from the simulation experiments - initial epidemic spread of an idea (Fig 4, 5), and achieving consensus (Fig 9) - support Dunbar's hypothesis. The results imply that natural group sizes in social groups are a consequence of changes in connectivity (particularly at the region of criticality), rates of transmission and levels of influence. The results also suggest that elite social structures reinforce cohesion by ensuring connectivity. For example, in caste systems (Fig 7), class groups with mid-range levels of influence are able to reach better levels of consensus than those with very low or very high levels of influence, whilst in dictatorships (Fig 8), a maximum consensus is reached at the higher end of the region of critical connectivity.

5.2
We recognise that the models and results are based on a simplification of personal relationships that complex interactions between pairs of individuals can be represented as a simple link. We argue this assumption is valid for the spread and discussion of any single idea. It is obvious that social networks are dynamic structures and different networks (eg. family, workplace, neighbours, etc.) may be operating at the same time and in different contexts. In addition, details about the structure of interactions and communication will be of significance. Group survival, in fact, relates to cohesion over many issues and, in society a variety of communication structures is needed to encourage diversity. Consequently, calibration of a model with such a wide range of parameters would be difficult. Thus, making quantitative predictions about group size from these results would be inadvisable (Troitzsch 1998).

5.3
In other communications networks connectivity and cohesion are also important. Information networks rely on every site in the network being kept up to date and that all sites are provided with consistent data. Our results suggest that it is possible for such systems to be self-organizing. That is, updates passed from node to node will saturate the entire network providing that the connectivity of links is sufficiently high and above a critical level. On the other hand, it is not essential for every node to be directly connected to every other node. This has wider implications in network synchronization and VLSI problems (Grefenstette 1983; Feynman 1996; Mead and Conway 1980).

5.4
Real societies have well-defined structures. We have considered mainly networks with random patterns of communication. Other network structures, such as scale-free and hierarchical networks, need to be considered, as do combinations of these network structures. Modelling the spread of opinion in social networks where actors and their connections represent structural equivalence and cohesion (Burt 1982) also needs to be considered. Further research is therefore necessary to address questions raised by this study. In future studies we will examine other processes and effects that arise from patterns of social structure.


* References

ALBERT, R, JEONG, H and BARÃBASI, A-L (2000), Error and attack tolerance of complex networks. Nature. 406: 378-382.

BAK, P and BRUISMA, R (1982), One-dimensional Ising model and the complete devil's staircase. Phys. Rev. 49: 249-251.

BARRAT, A and WEIGT, M (2000),. On the properties of small-world network models. Eur. Phys. J. B. 13: 547-560.

BOLLOBÁS, B (1985), Random Graphs. New York: Academic Press.

BURT, R S (1982), Social contagion and innovation: Cohesion versus structural equivalence. American Journal of Sociology. 88: 1287-1335.

CAMPBELL, J (1984), Grammatical man - information, entropy, language and life: The story of the modern revolution in human thought. Middlesex, England: Penguin Books Ltd.

CONTE, R HEGSELMANN, R and TERNA, P (1997) Introduction: Social simulation - A new disciplinary synthesis. In Conte, R et al. (Eds) Simulating social phenomena. Heidelberg: Springer-Verlag: 1-17.

DUNBAR, R I M (1992), Neocortex size as a constraint on group size in primates. Journal of human evolution. 20: 469-493.

DUNBAR, R I M (1995), Neocortex size and group size in primates: a test of the hypothesis. Journal of human evolution. 28: 287-296.

DUNBAR, Robin (1996), Grooming, Gossip and the Evolution of Language. London: Faber and Faber.

ERDÖS, P and RÉNVI, A (1960), On the evolution of random graphs. Mat. Kutato. Int. Kozl. 5: 17-61.

FEYNMAN, R P (1996), Feynman Lectures on Computation. Perseus Books.

FURMAN, M E and GALLO, F P (2000), The neurophysics of human behaviour. London: CRC Press.

GILBERT, N and TROITZSCH, K G (1999), Simulation for the social scientist, , Buckingham, UK: Open University Press.

GLADWELL, M (1999), The tipping point, London: Little Brown.

GREEN, D G (1993), Emergent behaviour in biological systems. In Green, D G and Bossomaier, T R J (Eds) Complex Systems - From Biology to Computation, Amsterdam: IOS Press: 24-35.

GREFENSTETTE, J J (1983), Network structure and the firing squad synchronization. Journal of computer and system sciences. 26: 139- 152.

HANNEMAN, R A (1995), Simulation modelling and theoretical analysis in sociology. Sociological Perspectives. 38 (4): 457-462.

HARVEY, I and BOSSOMAIER, T R J (1997), Time out of joint: Attractors in asynchronous boolean networks. In P Husbands and I Harvey (Eds) Proc. Fourth European Conference on Artificial Life: 67-75.

HEISENBERG, W (1928), "Zur Theorie des Ferromagnetismus." Zeitschr. f. Physik.49: 619-636.

HOGEWEG, P and HESPER, B (1983), The ontogeny of the interaction structure in bumblebee colonies: a MIRROR model. Behav. Ecol. Sociobiol. 12: 271-283.

ISING, E (1925) "Beitrag zur Theorie des Ferromagnetismus." Zeitschr.. f. Physik.31: 253-258.

IWANAGA, S and NAMATAME, A (1999), Evolutionary properties of collective decisions. In McKay, et al. (Eds) Proceedings of the third Joint Australia-Japan Workshop on Intelligent and Evolutionary Systems (AJJWIES). Canberra, Australia: 175-182.

JEONG, H, TOMBOR, B, ALBERT, R, OLTAVI Z N and BARÃBASI, A-L (2000), The large-scale organisation of metabolic networks. Nature. 407: 651-654.

KAUFFMAN, S A (1992), The Origins of order: Self- organization and selection in evolution, Oxford: Oxford University Press.

KLÜVER, J and SCHMIDT, J (1999), Topology, Metric and dynamics of social systems. Journal of Artificial Societies and Social Simulation. 2: 3.

KUBO, M, KUROKI, S, SATOH, H, MIKAMII, S, NAMATAME, A and WADA M (1999), Prediction based agent promotes cooperative behaviour. In McKay, et al. (Eds) Proceedings of the third Joint Australia-Japan Workshop on intelligent and evolutionary systems (AJJWIES). Canberra, Australia: 1- 7.

LIEBRAND, Wim B G (1998) Computer modelling and the analysis of complex human behaviour: Retrospect and prospect. In Liebrand, et al. (Eds) Computer Modelling of Social Processes: New Technologies for Social Research. London: Sage Publications: 1-19.

MACY, M W (1998), Social order in artificial worlds. Journal of Artificial Societies and Social Simulation. 1: 1.

MARSDEN, P (2000), Mental epidemics. New Scientist, 2237: 46-47.

MEAD, C and CONWAY, L (1980), Introduction to VLSI systems, Reading Mass: Addison-Wesley.

NOWAK, Andrzej and LEWENSTEIN, Maciej (1996), Modelling social change with cellular automata. Hegselmann, R (Eds) Modelling and simulation in the social sciences from the philosophy of science point of view. 249-285 Netherlands: Kluwer Academic Publishers.

PEIERLS, R (1936), "On Ising's Model of Ferromagnetism." Proc. Cambridge Phil. Soc. 32: 477-481.

POTTS, R B (1952), Some generalized order-disorder transformations. Proc. Camb. Phil. Soc. 48: 106.

SCOTT, J (1991) Social network analysis: A handbook, London: Sage Publications.

STAUFFER, D (1979), Percolation. Physics Reports, 54: 1-74.

TROITZSCH, Klaus G (1997) Social science simulation - Origins, prospects, purposes. In Conte, R et al. (Eds) Simulating social phenomena. Heidelberg: Springer-Verlag: 40-54.

TROITZSCH, Klaus G (1998) Multilevel process in the social sciences: Mathematical analysis and computer simulation. In Liebrand, et al. (Eds) Computer Modelling of Social Processes: New Technologies for Social Research. London: Sage Publications: 20-36.

UNO, K, SATO, H and NAMATAME, A (1999), Social evolution with imitation. In McKay, et al. (Eds) Proceedings of the third Joint Australia-Japan Workshop on Intelligent and Evolutionary Systems (AJJWIES). Canberra, Australia: 33- 40.

WASSERMAN, S and FAUST, K (1995), Social network analysis: Methods and applications. Cambridge, Cambridge University Press.

WATTS, D J and STROGATZ, S H (1998), Collective dynamics of 'small world' networks. Nature 393: 440.

WELLMAN, B and BERKOWITZ, S D (1998), Introduction: studying social structures. In Wellman, B and Berkowitz S D (Eds), Social structures: A network approach, Cambridge: Cambridge University Press: 1-18.

WELLMAN, B CARRINGTON, P J and HALL, A (1998), Networks as personal communities. In Wellman, B and Berkowitz S D (Eds), Social structures: A network approach, Cambridge: Cambridge University Press: 130-184.

WUENSCHE, Andrew (1998), Discrete dynamical networks and their attractor basins. In Standish, et al. (Eds) Complex systems '98, Complexity between the ecos: From ecology to economics. Sydney, Australia: 3-21.

----

ButtonReturn to Contents of this issue

© Copyright Journal of Artificial Societies and Social Simulation, 2001