
 Abstract
- This paper focuses on the collective design and immediate execution of an agent-based model (ABM) by dynamically interpreting the activity diagrams of agent behaviours. To reach this objective, we have implemented an ABM of livestock producers facing drought conditions in Uruguay. The first step consists in implementing a standard ABM with pasture growth, herd dynamics and simple agents roughly imitating farmers' strategies. The second step is more participative since it consists in assessing the model with the real cattle farmers. As with most modelling processes, this evaluation phase requires feedback on model design. In order to make this assessment more lively and efficient, we have conceived a tool for drawing diagrams that can be immediately interpreted by the agents. Thanks to this new editor, the actors have quickly understood how the model worked and were able to criticize and modify it. Thus, this innovative modelling tool enables the involvement of stakeholders in co-designing ABM for participatory foresight studies. We hope it will facilitate the emergence of new and more efficient practices for farm management that can account for climate changes.
- Keywords:
- Participative Modeling, Collaborative Modeling, Executable UML, Activity Diagram Interpretation, Rangeland Management, Livestock
Introduction
- 1.1
- Prospective analysis has been developed to explore possible futures (Perez & Dragicevic 2011). Initially dedicated to assist corporations in their strategic management (see example of Shell's Planning Department, Alcaras & Lacroux 1994), prospective analyses have been subsequently applied to land use issues and agricultural development over the last few years. The prospective approach encompasses many tools such as operational research or management sciences. The resulting simulation models are increasingly used by building various land use scenarios and simulating their mid to long-term consequences on agricultural and natural stakes.
- 1.2
- In recent years, several modelling approaches have emerged with the purpose of involving the stakeholders in model design and assessment. In the case of simulation models, some experiments seek to collectively build scenarios where actors play a key role in defining the desired scenarios and the sustainability indicators. As indicated for the Companion Modelling approach (ComMod, see Barreteau et al. 2003; Etienne 2011), model design is a way to support and confront viewpoints (Bousquet et al. 2002; Gaudou et al. 2011), while simulation allows articulating their projection in time. The objective of such a participatory approach is to help people reach collective decisions and to improve the actors' adaptive capabilities.
- 1.3
- Within the scope of Serious Games (Abt 1970), some ground-breaking initiatives seek to generate exploratory scenarios through interactive simulations (Badler 1997 ; Guyot & Honiden 2006, see also Le Page et al. 2011 for a description of a continuous gradient of hybrid agents, from autonomous agent to an avatar which is fully controlled by humans). As they are centred on the individual, agent-based models (ABM) enable the user of a simulation to assume the role of an agent and, for example, to "think like a wolf, a sheep or a fly" (Wilensky & Reisman 2006).
- 1.4
- But few modelling approaches integrate stakeholders at both the conception stage (identification of the problem, design and parameter setting) and the assessment stage (scenario building and collective exploration). If participative simulation is increasingly commonplace (Voinov & Bousquet 2010), the earlier phase during which the conceptual model is designed, remains more challenging and, so far, little work has been performed dedicated to the process of participatory modelling.
- 1.5
- In their literature review on collaborative modelling, Renger, Kolfschoten, & De Vreede (2008) found 22 papers with only one linked to the environmental domain. Thus our paper describes a new experiment that involves the stakeholders more heavily in the collective design of a scientific model. This design was facilitated thanks to a new UML editor that enables the participants to modify the behaviour of the agents. This experiment is thus a further step towards participatory modelling.
Why involve stakeholders?
- 2.1
- Simulation models are useful when exploring, explaining and assessing the complex interactions between ecosystems and human activities. Usually, they are mostly used to enhance the scientific understanding or to recommend corrective policy actions (Parker et al. 2003). In such cases, stakeholders are only contacted during the primary data gathering phase and are frequently bypassed in the transfer of knowledge between researchers and policy makers (Becu et al. 2008). As underlined by Pretty (1995), the term "people's participation" is now part of the normal language of many development agencies. But this so-called people's participation is often just a catchy expression often used to justify the process of extracting information from local people by the scientist when looking to satisfy their own data requirements. We, on the other hand, consider that sustainable development cannot be imposed through top-down regulations only.
- 2.2
- In recent years, several modelling approaches have emerged that seek to involve the stakeholders in the model design and evaluation (see Voinov & Bousquet 2010 for a literature review on participatory modelling dedicated to resources management). In the field of complex system science, this approach is known as the "post-normal" scientific posture (Funtowicz & Ravetz 1993). In a situation where "facts are uncertain, values in dispute, stakes high and decisions urgent", the authors explain that the decision should not be only based on expert knowledge and model results. Although there is still a great faith in the performance and efficiency of computers models, "what comes out at the end of a program is not necessarily a scientific prediction; and it may not even be a particularly good policy forecast" (ibid.). Decisions regarding renewable resources depend on evaluations of future states of the natural environment, resources and human society, all of which are unknown and unknowable. Beyond the lack of knowledge, it may be also argued that the experts have their own form of bias.
- 2.3
- It is now recognized that the beliefs and feelings of local people must be respected and taken into account. The ComMod approach affirms that participatory process of a decision is even more important than the decision itself. It also implies that scientific expertise is just one element in the political process. Scientific contributions can help to set the range of possible outcomes but, alone, they cannot develop adequate solutions. When complex socio-environment problems are concerned, seeking new alternatives requires the involvement of the stakeholders.
- 2.4
- Thus, we support the principle of unambiguous modelling where the stakes are clear and shared. But, as a model is just one representation of the world, it is also urgent to give up the naive view, which consists in thinking that a model is objective. On the contrary, a model is inevitably a subjective representation, as stated by J. Piaget and the Constructivist epistemology in the sense of E. Von Glasersfeld (1999) and J.L. Le Moigne (1995). It is thus necessary to clarify the modellers' choices and to present them in the most comprehensible way so that they can be understood, shared or criticized.
- 2.5
- The renewable resources management requires that all those who influence the global dynamics by their behaviour, participate actively in the decision-making. Indeed, better involvements in the stakes as well as the appropriation of a decision lead to a greater implication of the actors. Thus, we do not restrict the stakeholders solely to the decision makers. It is also essential to involve more anonymous actors such as smallholder farmers who take part in the process of development. Indeed, better involvements in the stakes as well as the appropriation of a decision improve the process of the decision and lead to a greater implication of the actors. Therefore, the purpose of ComMod is not to propose some expert's solutions, but rather to enrich the decision-making process, as much on its technical aspects as on its social aspects (dialogue, strengthening of the actor's role in the decision).
The case study: adaptation of producers to droughts provoked by climate change
- 3.1
- The Sequía project aims at understanding the drought phenomena in Uruguay and at developing a participatory methodology to improve the adaptation capacities of livestock farmers (Bartaburu n.d.).
- 3.2
- Agriculture plays a central role in Uruguay's economy, mainly due to the large livestock sector. The producers are essentially extensive cattle ranchers on natural grasslands. With a cattle herd of 12 million head, Uruguay has the world's highest number of cattle per capita (3.8) and produces about 600 thousand tons of beef a year. This production is mainly for export. In 2010, 65 per cent of total beef production was exported. Based on extensive systems with outdoor grazing in natural pastures, Uruguay produces premium quality beef and targets high value markets.
- 3.3
- The Sequía project was initiated because of severe droughts that affected the north Uruguayan region in the last decades. The basaltic shallow soils of this region make them more sensitive to drought. The severity and frequency of the droughts has jeopardized the sustainability of ranches. In the late 1990s, livestock breeders experienced severe droughts and millions of animals died or had to be slaughtered prematurely. This led to a weakened beef production sector causing numerous bankruptcies.
- 3.4
- Even certain farmers were less affected by these extreme situations, it was unclear how they worked exactly and which strategy was better in the long run. This also evidenced the need for new methodological tools to work with, which would also facilitate the communication on strategies among farmers and members of the extension and support services for rural and agricultural development.
A need to collectively design a simulation model
- 4.1
- To evaluate the efficiency of different management strategies, we built an ABM to simulate the evolution of farmers using different drought strategies. The purpose of the ABM was to build prospective scenarios under the assumption that future conditions (climate, prices) will be similar to previous ones during the 2000-2009 decade. The model design consisted in defining the most relevant elements and concepts that should be taken into account to describe the consequences of drought on herd growth. For that purpose, several modelling workshops were conducted with the interdisciplinary research project team, including producers.
- 4.2
- The first version of the model has been collectively designed with several members of the project including researchers and technicians. In order to share a common vision of the model, we made an exclusive and intensive use of UML (Le Page & Bommel 2005; Bersini 2012). Implementation on Cormas was performed at the end of this long process.
- 4.3
- Several participatory workshops (photo 1) were organized with livestock farmers from the Basalt region of Uruguay, who were seriously affected by drought. The objectives were to present the project's purpose and to clarify the management difficulties due to climate changes. As an ABM may be seen as black box, it was also essential to present and to explain the contents of the model (Barreteau et al. 2001; Edmonds 2000). From there, the stakeholders can assess the accuracy of the representation. But they can also criticize certain parts and participate in redesigning the model. Due to criticisms levelled at the agents' behaviour, which were considered overly caricatural, changes were made on a collective basis.
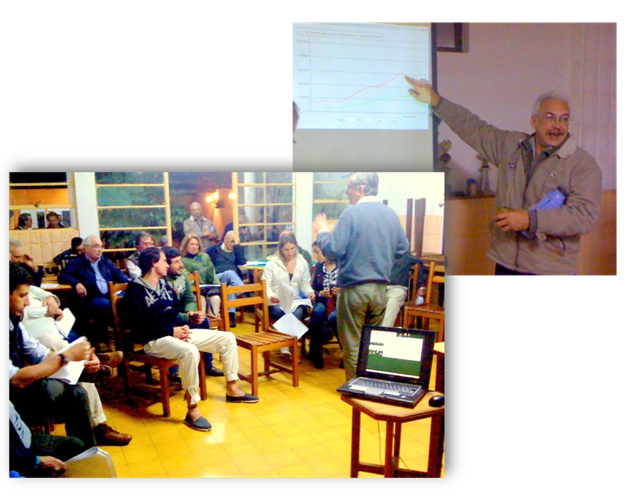
Photo 1. One of the workshops with producers in the city of Artigas
Overview of the basic model
- 5.1
- The first model is a standard ABM for which no interactive simulation was planned. In that version, agents are strong simplifications of farmers' behaviours. For simplicity sake, two kinds of producers were considered depending on their corresponding drought strategies: a "CC" Producer who focuses on cattle health (also called Corporal Condition score) and a "Pasto" Producer who makes drought-related decisions by assessing grass availability and climate.
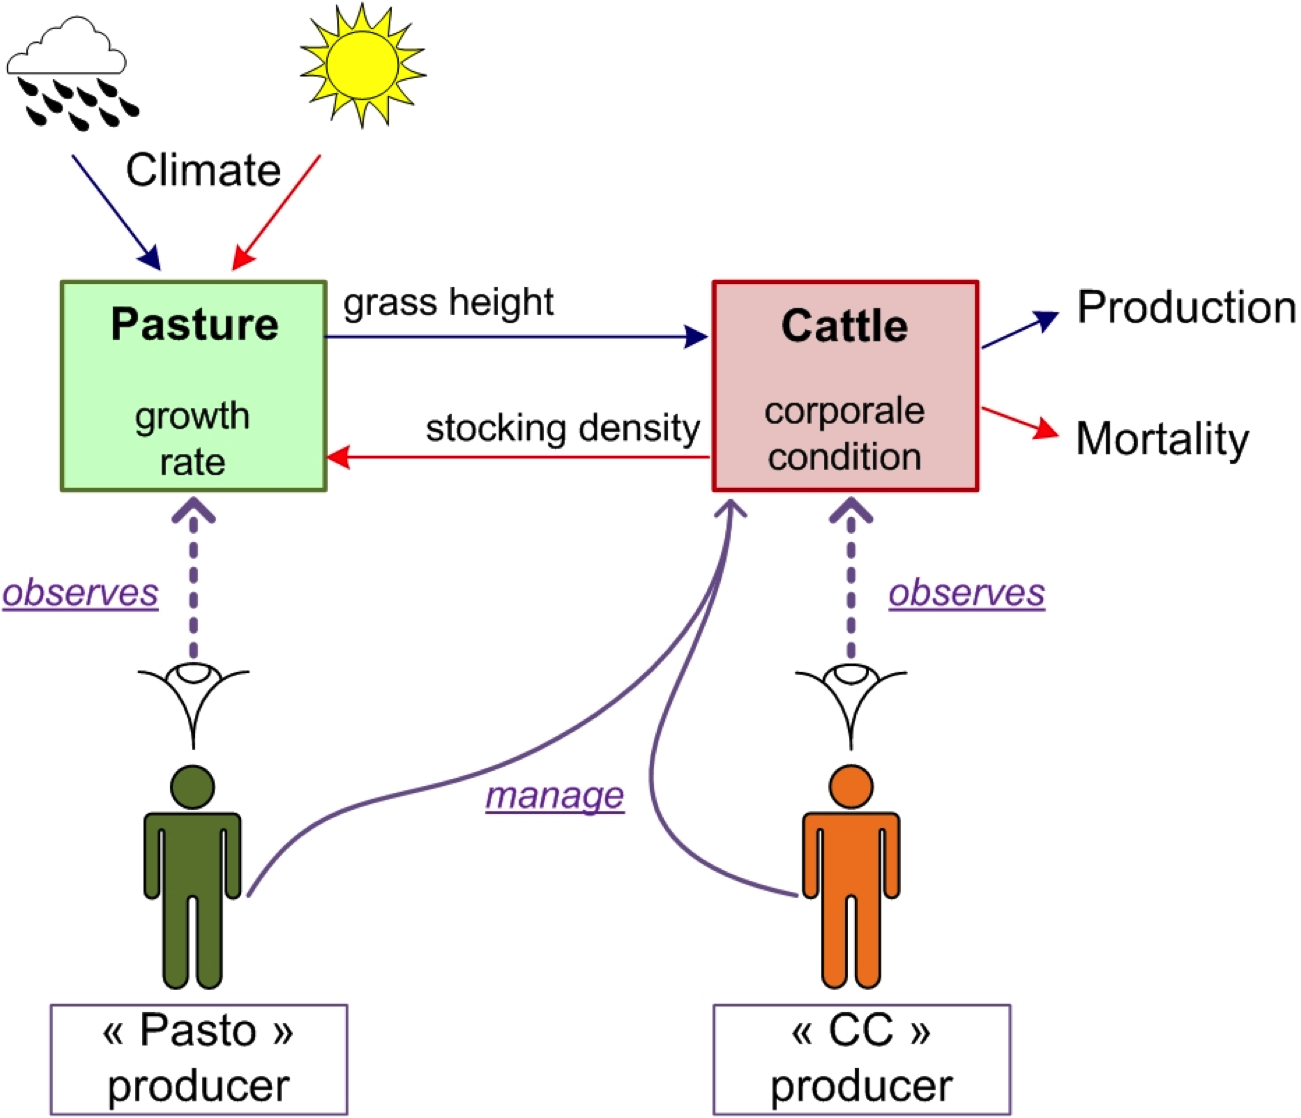
Figure 1. Simple diagram explaining the principle of the model: the "Pasto" Producer makes decisions by assessing grass availability when the "CC" Producer focuses on the corporal condition score of the cattle. - 5.2
- Whatever his strategy, a producer owns a 500 ha farm composed of one single pasture (without spatial dimension). The grass grows according to the logistic equation which parameters change according to seasonal and climatic conditions. Two herds are grassing on the farm: sheep that are not affected by drought (they are able to survive even in extreme conditions) and for which the dynamics is very simple, and cattle, which are impacted by grass height and which lifecycle is more finely modelled.
- 5.3
- The following UML class diagram (Figure 2) represents a simplified view of the model structure.
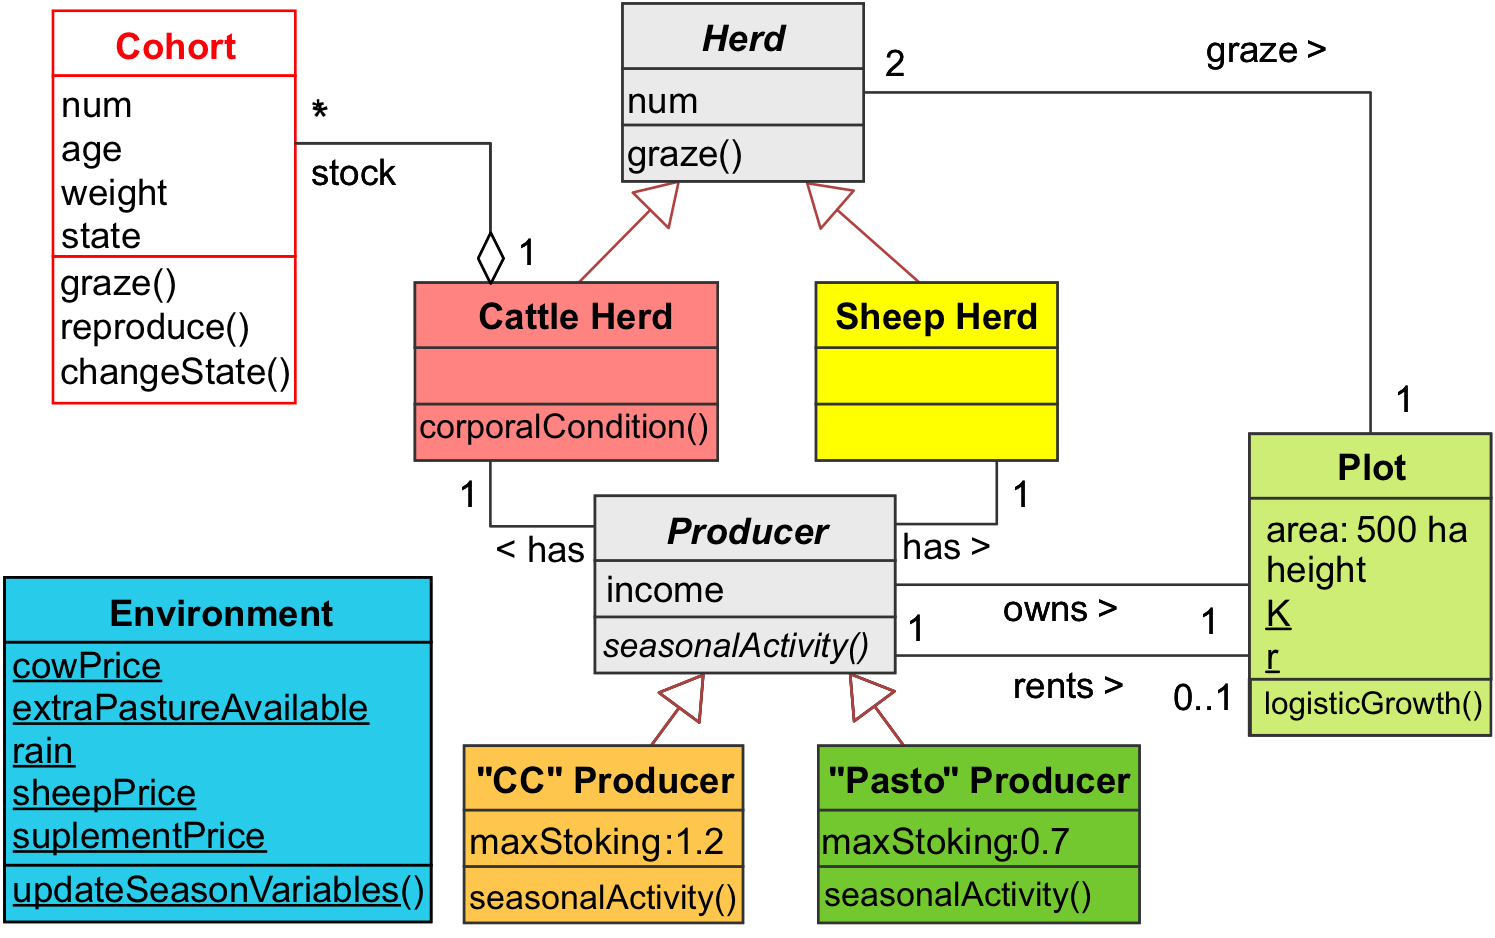
Figure 2. UML Class diagram presenting a simplified view of the model (for clarity sake, the hierarchy of the cohorts' states is not displayed). - 5.4
- As the farmers have distinct seasonal activities, the time-step for the simulations corresponds to one season. But a one-day sub-step is needed to more accurately represent the interactions between grass growth and herds grazing (cattle and sheep). The task scheduling order (i.e. order in which the behaviours of agents and resources are called upon at every time step) is shown on Figure 3. The model is deterministic but some input parameters (climate data, meat prices, availability and prices of extra farmland leasing) have been added as "forcing variables". These time series gathered during the 2000-2009 decade influence the simulations: they play the role of one climatic and market scenario for which various farmers' management strategies will be examined.
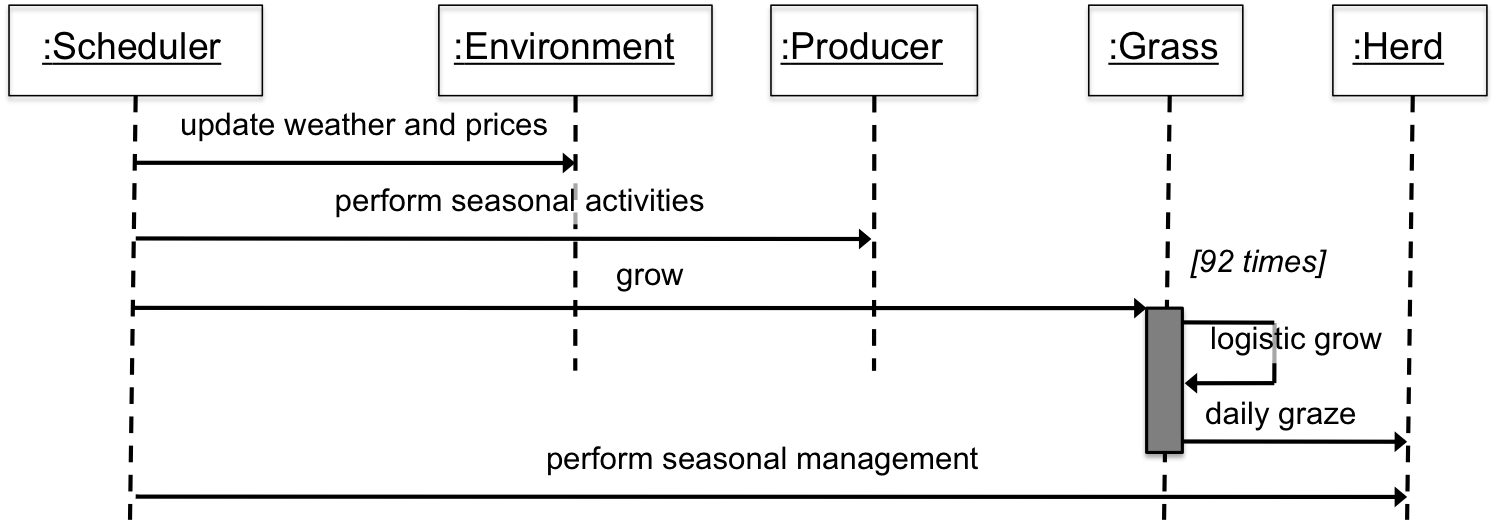
Figure 3. UML Sequence diagram representing task scheduling of a seasonal step - 5.5
- Eight farmers' behaviours were defined (one per season and per strategy). They consist mainly in managing the farm and the herds. Even if, for a given season, the strategies are roughly similar, differences exist on the decision points for each one: while the "CC" producer surveys the physical condition of his cattle to guide his managing choices, the "Pasto" producer chooses his activities according to the grass height and by trying to stay under a low stock threshold. The following animated figure describes the behaviour of both producers during the spring season: even if they behave in the same way, the guards (squared brackets) of the main decision points concern the priority of each agent.
Figure 4. (animated gif). UML Activity diagram showing the spring activities of a "Pasto" Producer (green) and a "CC" Producer (orange) - 5.6
- The "CC" agent considers that the conditions are bad when the state of health of the herd is degraded. In this case, he will execute the right part of the diagram in order to try to rent extra pastures, to supplement his herd, or to sell more cows when the prices are good. In contrast, the "Pasto" agent thinks that the situation is unfavourable when the grass height is less than 3 cm, regardless of the health of his cows.
- 5.7
- Several output parameters were defined, like producer's income and cattle mortality so that system evolution can be monitored. The model has been implemented on Cormas, a framework dedicated to ABM for renewable resources (Bousquet et al. 1998 ; Cormas n.d. ). Three successive versions were implemented: first, a "grass only model" in order to validate grass growth as a function of climate; the second "wild model" introduced cattle and is focused on grass-animal interaction; and finally, the "management model" includes the producers and their different behaviours (drought strategies).
- 5.8
- The first results show that during drought phases, "Pasto" Producers are generally better equipped to face these stressful periods than "CC" producers; they succeed in reducing the mortality rates and they are faced with less serious economic problems. But, outside these specific periods, they are less economically efficient. Since this paper is not intended to describe the model and its results, the reader can find more information here: http://cormas.cirad.fr/en/applica/sequia.htm.
Executable activity diagrams to further involve local stakeholders in participatory modelling
- 6.1
- The first version of the model was presented and discussed with livestock breeders during several workshops. The main criticism concerned the over simplistic behaviours of the agent that makes his decision by looking solely at the pasture height or at the cattle health. It was therefore requested to revise the strategies of the agents.
Executable activity diagram editor
- 6.2
- To facilitate the collective design of the model, it was necessary to immediately assess the consequences of changes. For that purpose, we created a new tool that enables the drawing of simple activity diagrams and to execute them without any need for translation into code. Indeed, this editor allows the creation of new activity diagrams (or re-opening formers) that are interpreted "on the fly" by Cormas. Then it is possible to redesign the behaviour schema of an agent without coding. Even if it is not the main purpose, it is also possible to modify the simulator while it is running, without stopping or restarting the simulation.
- 6.3
- The available notations are a subset of UML 2.0 activity diagrams (OMG 2005). For simplicity sake and user friendliness in the scope of the project, the elements available on the diagram editor are restricted to initial and final nodes, decision points, simple activity nodes (without parameters nor ability to handle an activity output) and transitions (Figure 5). The decision point has also limitations in the sense that only two transitions come out of it, indicating the fulfilment (true) or the negative answer (false) of a test (the UML notation offers the possibility to have more output transitions as kind of case-statement of a switch).
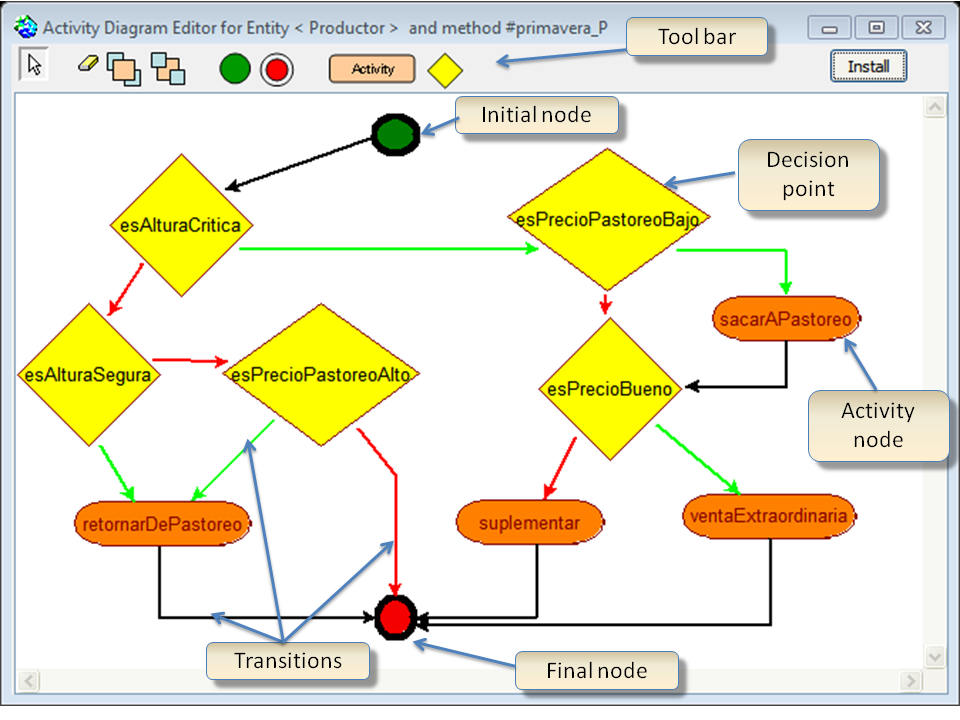
Figure 5. The executable Activity diagram editor showing the collectively designed strategy of a Producer in spring season. Note that this diagram is equivalent to the one presented in the previous figure - 6.4
- By selecting an activity node or a decision point on the tool bar, the user can add a new element on the diagram. Thereafter, he can choose the operation to be performed by this element. Each element proposes a drop-down menu to display an activity setter from which the user may choose the method that will be associated with the selected node (Figure 6).
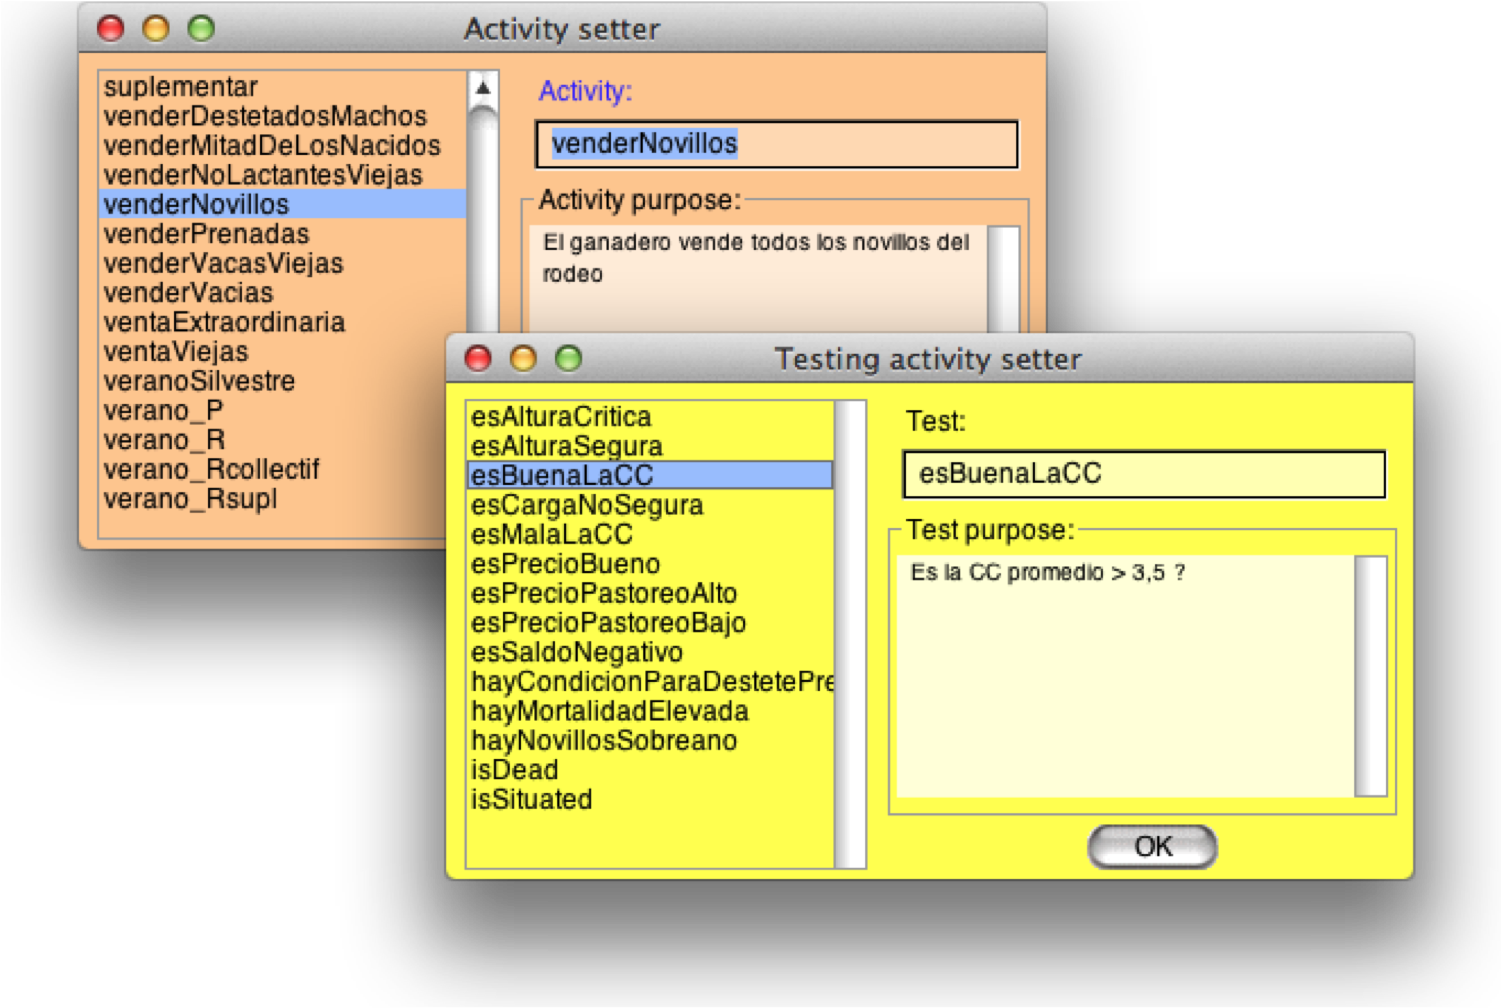
Figure 6. Two examples of activity setter, for activity node (orange) and for decision point (yellow) - 6.5
- The activity setter displays a list of methods belonging to the target class (i.e. Producer). This list is set up automatically by Cormas that inspects all the simple methods (without argument) defined within the class and its super-classes[1]. By clicking on a name, the purpose of the associated method is displayed. It is also possible inspect the method's code by right clicking on it.
- 6.6
- The design is incremental: saving a new diagram generates a new method of the agent that is immediately available and can be called in turn (i.e. future activity setter will display this new method name). A right-click on an activity or a decision point opens either a code editor targeting the selected operation, or another diagram editor displaying the previously saved activities.
- 6.7
- Therefore, the user can draw a transition from the given node to another. When starting from a decision point, he will create two transitions: one for which the answer of the test is true (green) and one for false (red). When saving the new diagram, Cormas checks if the graph is coherent, then it generates two operations in the target class: one to store the diagram and one to execute it (see appendix for further explanations).
- 6.8
- Thus, from basic operations already defined by the modeller, anyone may generate new upper level behaviour without any programming skills.
Discussion
-
Diagram editor limitations
- 7.1
- As a sub-type of executable Data Flow (Waheed et al. 2008), the executable activity diagram editor does not avoid the modeller to program his ABM. As for the majority of ABM platforms, programming is unavoidable. At this time, the objective of this UML editor is not to generate an entire simulator, which eliminates the coding phase. Currently, its principal aim is to facilitate the collective modification of a model by organizing plug-and-play activity nodes. These activities contain pieces of code (software bricks or components) that were previously coded by the developers.
- 7.2
- Because it is intended for non-specialists, the editor has been designed to be as simple as possible in order to not discourage potential participants of a modelling session. This is the reason for which it does not contain sophisticated features such as swimlane, iteration and concurrency notations that are nowadays specified by UML 2.0 (OMG 2005). In return, this simplicity enables anyone to participate more actively in the modelling process with greater efficiency thanks to the immediate assessment of his/her modelling changes or proposals.
Modifying agent behaviour while the simulation is running
- 7.3
- The executable editor operates differently than the standard "Executable UML" proposed by Mellor & Balcer (2002) and adopted by OMG (2003), which specifications require the translation of UML diagrams into code by executable UML compilers. Conversely in Cormas, after being checked and saved, an activity diagram is not compiled into programming language but is directly interpreted by the simulation, without an intermediate stage. In other words, the new activity diagram is saved as part of the source code of the ABM (see appendix for additional explanation). As it belongs to the executable code, it can be reopened at anytime, modified and performed without compilation.
- 7.4
- By taking advantage of the Smalltalk facilities (Cormas is based on Smalltalk, a reflective programming language, that is dynamically typed), it is possible to modify the diagram of an agent while the simulation is running. As soon as the modified diagram is saved, the agent remains activated and begins to perform his new behaviour. Even if it is not the main objective (the major utility is to design and execute diagrams), this specificity can be useful when a model user observes a trend of a simulation. He can then test how a change of the agent behaviour could modify the direction towards where the simulation is going.
Experimental results and benefits of the executable editor
- 7.5
- Even if the project is still ongoing, the use of the executable editor revealed two interesting behavioural features. First of all, by being able to modify the agents' behaviour, anybody could play with the model and therefore better understand its logic. The immediate response obtained after any modification of the model often acts as a stimulus for participants and increases their awareness of its underlying mechanisms. This leads to new questions about how the model operates, but also this has triggered discussions and debates about on how best to address climate crises. In conclusion, although the agent's strategies proposed by the first version of the model had often seemed too simplistic initially, many farmers afterwards categorized themselves as "CC" Producers.
- 7.6
- The second feature concerns the collective debugging of technical aspects of the model such as time management difficulties. By testing alternative strategies with the executable editor, the participants identified some model biases: they realized that in drought conditions, the agents always reacted too late. For instance, in case of poor health of the herd or in case of lack of grass, the decision to feed the herd with supplement did not apparently prevent it from collapsing. The participants understood that during crises, the agents had to act more frequently than only once per season as stated by the first model version (see sequence diagram, Figure 3). The consequence was that we had to correct the model by repeating the seasonal activities of the agents every week rather than just once per season.
- 7.7
- Therefore, this new tool enables greater involvement of the stakeholders. Its immediate response allows rapid assessment of changes in the model. Consequently, the participants are more likely to understand how the ABM works and to take part in the adaptive modelling process. This kind of recursive design allows meaningful feedback and reveals model weaknesses and strength.
Opening the black box and facilitating participative foresight
- 7.8
- As stated by (OMG 2005), the primary design goals of the UML are to provide an "expressive visual modelling language to develop and exchange meaningful models" that are independent of particular programming languages. It is specified that UML is not intended to replace programming languages.
- 7.9
- Even if UML diagrams are used to design an ABM, they are also useful when attempting to explain a model. They act as media for discussions to share points of view and to facilitate communication among scientists, modellers and development actors. Based on simple graphic notations, a diagram should be understandable even for non-computer scientists (Le Page & Bommel 2005). It has to be independent from any platform or programming language and should not display technical features (interface, buffer, database, etc.). The displayed items should only belong to the targeted thematic. The stakeholders need to understand them in order to assume ownership of the model and to criticize it. As K. Popper has explained for theories (Popper 1963), a good model should be refutable. Criticizing a model is not negative; it is rather a means to encourage the questioning of existing knowledge and stimulating new learning loops.
- 7.10
- In the case of descriptions of land use strategies or cattle management, activity diagrams can be used to explain complex practices. In experiments conducted by (Morales et al. 2010), such diagrams have been used very effectively to interview many Uruguayan breeders as they facilitate communication, thus enabling clear and unambiguous explanations.
- 7.11
- The executable editor tool we have developed reflects the same rationale. It does not seek to prevent the members of a modelling project from programming the simulator. But the consequences of new practices devised by the actors can be more quickly assessed. We conceived it as a collective and recursive design tool to enhance self-organization capacities and to facilitate adaptive management.
- 7.12
- Our experiment with the executable editor is a step towards more transparent and adaptive modelling that fits with the guidelines for good practice in participatory modelling proposed by Korfmacher (2001) and confirmed by Jonhson (2009) in the domain of water management. It is consistent with Voinov and Bousquet (2010) recommendations that call for a standard in a truly adaptive natural resource management including "a transparent modelling process, continuous, appropriately representative involvement, influence of participants on modelling decisions and a clear role of modelling in management" (ibid.).
Comparison with graphical editors of other ABM platforms
- 7.13
- In their survey of ABM platforms, Nikolai and Madey (2009) examine various characteristics of 53 platforms. Among them, they enumerate 10 toolkits supporting visual programming (VP). These platforms propose graphical-based programming capabilities which "are much more simple to learn and use than traditional programming languages" (ibid.). This is the purpose of StarLogo TNG (Begel & Klopfer 2007), the most famous platform in this area, which has an educational goal for children. StarLogo TNG as well as EToys (Kay 2005) and Modeling4All (Kahn & Noble 2009) propose a way to code the behaviour of an agent via VP editor that operates as pseudo-code: users manipulate puzzle blocks that represent pieces of code. By stacking from top to bottom a sequence of blocks that fit together, users build a program (Figure 7A).
- 7.14
- But, as noted by Michel et al. (2011), the programmer's mindset is still needed when using such VP editors because "users have to deal with concepts such as if-then-else statements, loops, variables usage and so on". When they are intended to teach computer programming, the VPs have great advantages. But this way to design of a model, very close to computer code, may not be appropriate for a wide audience not interested in computational aspects. For our study, we felt that the use of such VP editor would not have been relevant regarding the stakeholders' involvement.
- 7.15
- 'Thinking by diagrams' (Blackwell 2001) offers more efficiency than stack of instruction blocks. In line with the work of C. S. Pierce (1839–1914) on semiotics, B. Morand has worked on cognitive properties of diagrams. He explains that diagrams led to focus the cognitive processes on perception. They have special virtues such as visualization, immediacy, spatiality, creativity, compliance with intuition (Morand 2000). Based on experiments in psychology and neurology, he concludes that the diagram is at the heart of the cognitive process and not at the periphery. Extending this logic further, we may even say that a conceptual model is necessarily a diagrammatic model, as stated by Pierce. Diagram is thus a suitable instrument for qualitative, causal or temporal reasoning (Anderson & McCartney 1995).
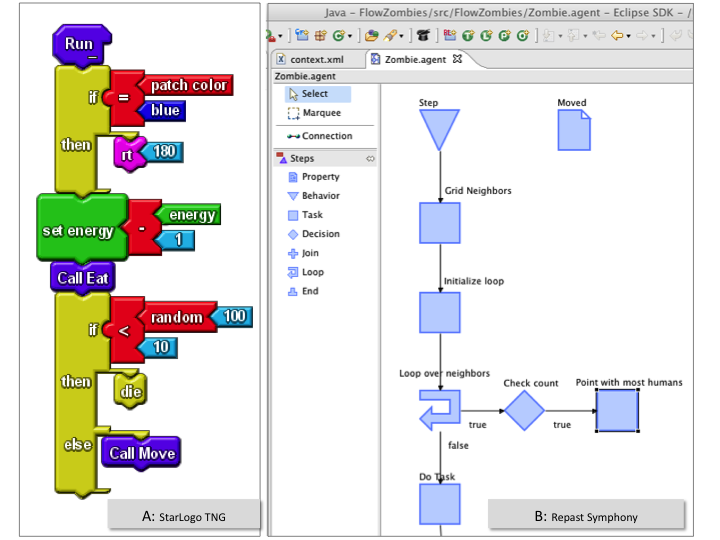
Figure 7. Two examples of graphical-based programming and designing editors: A: the visual programming language in StarLogo TNG, B: the flow chart editor in Respast Symphony. - 7.16
- In our opinion, SeSAm (Klügl et al. 2006) and Repast Symphony (RS) (North et al. 2007) seem the most advanced freeware toolkits to graphically design ABMs. They both offer Activity Diagram editors. For example, RS encapsulates the Flow4J Eclipse plug-in that enables to model process flows in a drag and drop manner (Figure 7B). After designing a diagram, the java source code is automatically created and ready for compilation.
- 7.17
- The diagram editors of both platforms are more sophisticated because their graphical components are more numerous and more complex than those of our editor. So, we believe they are more difficult to use in context of participatory approach. A brief search on bibliographical databases does not return any reference on the topic of participatory modelling with stakeholders using these graphical tools. As far as we know, our study seems to be a first experiment in designing and exploring an ABM with farmers using activity diagram editor.
Conclusion
- 8.1
- Within a project dedicated to assisting Uruguayan livestock farmers facing frequent and destructive droughts due to climate warming, we have designed an ABM made up of three interacting compartments: the grass growth depending on climatic conditions, the natural lifecycle of the herd and the management of the whole by a breeder.
- 8.2
- To foster the stakeholder involvement in the model design and assessment, we have created a new modelling tool. This executable editor is used to modify or create activity diagrams that are immediately executed during runtime simulation. This design support tool does not eliminate the need for programming, but it allows the organization of predefined activities and conditions in order to graphically describe and simulate new up level behaviours.
- 8.3
- For our case study, the use of this tool has significantly facilitated communication with and between farmers on the drought phenomenon. It has also enabled a better understanding of the model by opening the black box (Barreteau et al. 2001) and has even allowed the identification of model biases. In reference to the social validation of scientific models (Castella et al. 2005), the executable editor facilitated end-user acceptance of decision making model thanks to the collective learning process involved.
- 8.4
- Finally, it has contributed to the identification of better adaptive strategies so that the resilience of livestock producers can be improved. Indeed, enabling the actors to modify the behaviours of the agents and immediately assess the consequences, allows the readjustment of inherent concepts to better match the stakeholder perceptions. The direct feedback response facilitates a recursive design that can lead to significant changes in the conceptual model. This executable editor can be seen as a new generation of "programming in UML".
- 8.5
- The results of the first collective exercises exceeded our expectations. Beyond discussions and debates they triggered, the majority of the farmers and technicians who participated in the workshops would like to continue the collective experience with the model. They also want to use the tool individually to seek for more effective management strategies under normal climatic periods as well as during drought events. But before to release it, it is still necessary to analyze the biophysical sub-models (grass and cattle dynamics) in order to check their coherency and their reliability. Beside the verification work, we continue our field interventions and we provide training courses on livestock issues. Consequently, we stopped temporary the use of the full simulator (ABM + UML Editor) with the stakeholders. It will be tested again with the farmers when the biophysical models will be more reliable. Thus, the next stage will be to distribute the full simulator to the farmers via the technical assistance.
- 8.6
- Now available in Cormas (version 2012), we wish that the executable diagram editor would be a promising tool since it can be used to strengthen the collective ABM design. So, new sustainable practices can be identified in a truly collaborative manner.
Appendix
- 9.1
- The executable editor does not require translation of UML diagrams into code by executable UML compiler: the diagram is not compiled as a new algorithm that would be a translation of the diagram. When saving a diagram, Cormas verifies if it is coherent, then it generates a new method containing just a single instruction to perform the target diagram. For example, when saving the activity diagram from Figure 5, the modeller can decide to call it "primavera_P". Thus, Cormas generates the following method into the Producer class (the language used by Cormas is Smalltalk):

- 9.2
- During the simulation run-time, when an instance of Producer receives a diagram name as message (i.e. the primavera_P message), it executes directly the target diagram: after having found the initial dot (StartFigure), it goes to the next dot by following the transition. Then, it gets the method name of this activity and executes it. Accordingly, it performs each activity of the diagram, following the path of the transitions, until the stop dot (EndFigure). For example when he reaches the first executable node of Figure 5, a decision point called "esAlturaCritica" ("is height critical?"), the agent executes the target method: this testing operation is a concrete method already implemented by the modeller that should return True or False. Depending on the Boolean value that is returned, the next operation executed by the agent will be "esAlturaSegura" ("is_height_safe?", in case of False answer) or "esPrecioPastoreoBajo" ("is_rental_price_of pasture_cheap?", in the opposite case). This process is repeated until the stop dot (Final Node). By following the sequence of encountered transitions and actions, the agent performs its seasonal behaviour depending on its current state. In other words, the "primavera_P" method does not contain any translation of the diagram into a new compiled algorithm but it simply executes the diagram. Therefore, it is possible to design recursive transition from a node to a previous one without any problem (UML compilers have difficulties to identify loops and to translate them in code, see Hauser & Koehler (2004) and Ammarguellat (1992) for "derecursivation" explanation). Some videos explaining how to use the editor are available on Cormas web site: http://cormas.cirad.fr/en/applica/diffuse.htm.
- 9.3
- In order to keep the diagram when saving the model, Cormas also creates a second method (called activity_primavera_P). It contains a translation of the diagram into Smalltalk code as the list of all the diagram components: their type, their name (operation's name that should be performed), their input and output transitions, their position in the editor, their size and their colour. This list is ordered from the starting point figure to the stop point figure and each element knows the next element it is linked to (according to output transition). This translation method is useful when reopening a model but is hardly readable. To understand its content, it is much easier to display the diagram itself with the editor.
Acknowledgements
-
The "sequía" project has been funded by INIA (National Agricultural Research Institute of Uruguay), a governmental institution that develops and fosters agricultural research nation-wide. It is now supported by the French project ANR 2010 STRA 005 MOUVE. The model presented here has been collectively designed by researchers and technicians of the IPA (Instituto Plan Agropecuario), the Uruguayan institution dedicated to agricultural extension mainly to small and mid-sized livestock farmers. We want to thank the numerous producers of the Basalt region of Uruguay who were willing to devote some of their precious time to participating in project workshops and who were highly involved in the modelling process. We also thank Jarlath Slevin from the Awan Language Institute for his corrections and his extensive review of English.
Notes
-
1 For instance, thanks to Smalltalk code organization in categories (also called "protocols" for which the included methods share a close semantic), the methods of a decision point are collected by inspecting the "testing" protocol.
References
-
ABT, C. C. (1970). Serious games. New York: Viking Press.
ALCARAS, J.-R., & Lacroux, F. (1994). Planifier c'est s'adapter (No. GRASCE-NR--94-03 - FR_1996:300): CNRS.
AMMARGUELLAT, Z. (1992). A Control-Flow Normalization Algorithm and Its Complexity. Software Engineering, 18(3), 237–251. [doi:10.1109/32.126773]
ANDERSON, M., & McCartney, R. (1995). Inter-diagrammatic reasoning. Paper presented at the IJCAI (1).
BADLER, N. I. (1997, 16 Jun 1997). Virtual humans for animation, ergonomics, and simulation. Paper presented at the Nonrigid and Articulated Motion Workshop. [doi:10.1109/NAMW.1997.609848]
BARRETEAU, O., Antona, M., D'Aquino, P., Aubert, S., Boissau, S., Bousquet, F., et al. (2003). Our Companion Modelling Approach. Journal of Artificial Societies and Social Simulation, 6(2), 1. https://www.jasss.org/6/2/3.html
BARRETEAU, O., Bousquet, F., & Attonaty, J.-M. (2001). Role-playing games for opening the black box of multi-agent systems: method and lessons of its application to Senegal River Valley irrigated systems. Journal of Artificial Societies and Social Simulation, 4(2), 5. https://www.jasss.org/4/2/5.html
BARTABURU, D. (n.d.). FPTA Project: Desarrollo, Aplicación y Evaluación de una metodología de modelación y simulación participativa para contribuir a la comprensión y comunicación del fenómeno de la Sequía y mejorar la capacidad de adaptacion. [On line] last accessed May 15, 2012. http://www.inia.org.uy/busqueda/proy_detalle.phtml?id=186&origen=1.
BECU, N., Neef, A., Schreinemachers, P., & Sangkapitux, C. (2008). Participatory computer simulation to support collective decision-making: Potential and limits of stakeholder involvement. Land Use Policy, 25(4), 498–509. [doi:10.1016/j.landusepol.2007.11.002]
BEGEL, A., & Klopfer, E. (2007). Starlogo TNG: An introduction to game development. Journal of E-Learning.
BERSINI, H. (2012). UML for ABM. Journal of Artificial Societies and Social Simulation, 15(1), 9. https://www.jasss.org/15/1/9.html
BLACKWELL, A. F. (2001). Thinking with diagrams: Springer. [doi:10.1007/978-94-017-3524-7]
BOUSQUET, F., Bakam, I., Proton, H., & Le Page, C. (1998). Cormas: Common-pool Resources and Multi-Agent Systems. Lecture Notes in Artificial Intelligence, 1416, 826–837. [doi:10.1007/3-540-64574-8_469]
BOUSQUET, F., Barreteau, O., D'Aquino, P., Etienne, M., Boissau, S., Aubert, S., et al. (2002). Multi-agent systems and role games: collective learning processes for ecosystem management. In M. A. Janssen (Ed.), Complexity and ecosystem management. The theory and practice of multi-agent systems (pp. 248–285): Edward Elgar Publishing.
CASTELLA, J. C., Trung, T. N., & Boissau, S. (2005). Participatory simulation of land-use changes in the Northern Mountains of Vietnam: the combined use of an agent-based model, a role-playing game, and a geographic information system. Ecology and Society, 10(1), 27.
CORMAS. (n.d.). Cormas web site, [On line] last accessed May 15, 2012: http://cormas.cirad.fr/indexeng.htm. Retrieved May 15th, 2012.
EDMONDS, B. (2000). The use of models - making MABS more informative. Lecture Notes in Artificial Intelligence, 1979, 15–32.
ETIENNE, M. (Ed.). (2011). Companion Modelling. A participatory approach to support sustainable development. Versailles: Quae.
FUNTOWICZ, S. O., & Ravetz, J. R. (1993). Science for the post-normal age. Futures, 25(7), 739–755. [doi:10.1016/0016-3287(93)90022-L]
GAUDOU, B., Marilleau, N., & Vinh Ho, T. (2011). Toward a Methodology of Collaborative Modeling and Simulation of Complex Systems. In F. X. Santi Caballé, Ajith Abraham (Ed.), Intelligent Networking, Collaborative Systems and Applications (Vol. 329, pp. 27–53 ): Springer. [doi:10.1007/978-3-642-16793-5_2]
GUYOT, P., & Honiden, S. (2006). Agent-based participatory simulations: merging multi-agent systems and role-playing games. Journal of Artificial Societies and Social Simulation, 9(4), 8. https://www.jasss.org/9/4/8.html
HAUSER, R., & Koehler, J. (2004). Compiling Process Graphs into Executable Code. In G. Karsai & E. Visser (Eds.), Generative Programming and Component Engineering (Vol. 3286, pp. 317–336): Springer Berlin Heidelberg. [doi:10.1007/978-3-540-30175-2_17]
JONHSON, M. S. (2009). Public Participation and Perceptions of Watershed Modeling. Society and Natural Resources, 22, 79–87. [doi:10.1080/08941920802220347]
KAHN, K., & Noble, H. (2009). The Modelling4All project a web-based modelling tool embedded in Web 2.0. Paper presented at the Proceedings of the 2nd International Conference on Simulation Tools and Techniques. [doi:10.4108/icst.simutools2009.5576]
KAY, A. (2005). Squeak etoys, children & learning. online article, 2006. ftp://debian.ofset.org/speeches/jrfernandez/malaga08/doc/etoys_n_learning.pdf
KLÜGL, F., Herrler, R., & Fehler, M. (2006). SeSAm: implementation of agent-based simulation using visual programming. Paper presented at the AAMAS. [doi:10.1145/1160633.1160904]
KORFMACHER, K. S. (2001). The politics of participation in watershed modeling. Environmental Management, 27(2), 161–176. [doi:10.1007/s002670010141]
LE MOIGNE, J.-L. (1995). Les épistémologies constructivistes. Paris: Presses Universitaires de France.
LE PAGE, C., Abrami, G., Barreteau, O., Becu, N., Bommel, P., Botta, A., et al. (2011). Models for sharing representations. In M. Etienne (Ed.), Companion modelling: A participatory approach supporting sustainable development (pp. 69–96). Versailles: Ed. Quae.
LE PAGE, C., & Bommel, P. (2005). A methodology for building agent-based simulations of common-pool resources management: from a conceptual model designed with UML to its implementation in CORMAS. In F. Bousquet, G. Trébuil & B. Hardy (Eds.), Companion modeling and multi-agent systems for integrated natural resources management in Asia (pp. 327–349). Los Baños, Philippines: International Rice Research Institute.
MELLOR, S. J., & Balcer, M. J. (2002). Executable UML : a foundation for model-driven architecture. Boston; San Francisco; New York: Addison-Wesley.
MICHEL, F., Ferber, J., Laur, P.-A., & Aleman, F. (2011). Situational Programming: Agent Behavior Visual Programming for MABS Novices. In T. Bosse, A. Geller & C. Jonker (Eds.), Multi-Agent-Based Simulation XI (Vol. 6532, pp. 1–15): Springer Berlin Heidelberg. [doi:10.1007/978-3-642-18345-4_1]
MORALES Grosskopf, H., Arbeletche, P., Bommel, P., Burges, J. C., Champredonde, M., Corral, J., et al. (2010). Modéliser le changement dans la gestion des terres de parcours en Uruguay. Cahiers Agricultures, 19(2), 5.
MORAND, B. (2000). Le diagramme: à la périphérie ou au cœur de la cognition? Paper presented at the Actes—xix—des 9e Journées de Rochebrune, Rencontres interdisciplinaires sur les représentations graphiques dans les systemes complexes naturels et artificiels, Rochebrune, France.
NIKOLAI, C., & Madey, G. (2009). Tools of the trade: A survey of various agent based modeling platforms. Journal of Artificial Societies and Social Simulation, 12(2), 2. https://www.jasss.org/12/2/2.html
NORTH, M. J., Tatara, E., Collier, N. T., & Ozik, J. (2007). Visual agent-based model development with repast simphony: Tech. rep., Argonne National Laboratory.
OMG. (2003). MDA Guide Version 1.0.1, Overview and guide to OMG's architecture. Framingham, Massachusetts: Object Management Group.
OMG. (2005). The Unified Modeling Language Specification v2.0. http://www.omg.org/spec/UML/2.0/
PARKER, D. C., Manson, S. M., Janssen, M. A., Hoffmann, M. J., & Deadman, P. (2003). Multi-agent systems for the simulation of land-use and land-cover change: A review. Annals of the Association of American Geographers, 93(2), 314–337. [doi:10.1111/1467-8306.9302004]
PEREZ, L., & Dragicevic, S. (2011). ForestSimMPB: A swarming intelligence and agent-based modeling approach for mountain pine beetle outbreaks. Ecological Informatics, 6(1), 62–72. [doi:10.1016/j.ecoinf.2010.09.003]
POPPER, K. (1963). Conjectures and Refutations: The Growth of Scientific Knowledge. New York: Harper Torchbooks.
PRETTY, J. N. (1995). Participatory Learning For Sustainable Agriculture. World Development, 23(8), 1247–1263. [doi:10.1016/0305-750X(95)00046-F]
RENGER, M., Kolfschoten, G. L., & De Vreede, G. J. (2008). Challenges in collaborative modelling: a literature review and research agenda. Int. J. Simulation and Process Modelling, 4(3/4), 248–263. [doi:10.1504/IJSPM.2008.023686]
VOINOV, A., & Bousquet, F. (2010). Modelling with stakeholders. Environmental Modelling & Software, 25(11), 1268–1281. [doi:10.1016/j.envsoft.2010.03.007]
VON GLASERSFELD, E. (1999). Le Moigne's Defense of Constructivism. Entre Systémique et Complexité, Chemin Faisant: Mélanges en Hommage à Jean-Louis Le Moigne., 85–90. Retrieved from http://www.vonglasersfeld.com/225
WAHEED, T., Iqbal, M., & Malik, Z. (2008). Data Flow Analysis of UML Action Semantics for Executable Models. In I. Schieferdecker & A. Hartman (Eds.), Model Driven Architecture – Foundations and Applications (Vol. 5095, pp. 79–93): Springer Berlin / Heidelberg. [doi:10.1007/978-3-540-69100-6_6]
WILENSKY, U., & Reisman, K. (2006). Thinking Like a Wolf, a Sheep, or a Firefly: Learning Biology Through Constructing and Testing Computational Theories - An Embodied Modeling Approach. Cognition and Instruction, 24(2), 171–209. [doi:10.1207/s1532690xci2402_1]