
 Abstract
- This paper presents a multi-agent simulation of the production of step-level public goods in social networks. In previous public goods experimental research the design of the sequence ordering of decisions have been limited because of the necessity of simplicity taking priority over realism, which means they never accurately reproduce the social structure that constrains the available information. Multi-agent simulation can help us to overcome this limitation. In our model, agents are placed in 230 different networks and each networks’ success rates are analyzed. We find that some network attributes -density and global degree centrality and heterogeneity-, some initial parameters of the strategic situation -the provision point- and some agents’ attributes -beliefs about the probability that others will cooperate-, all have a significant impact on the success rate. Our paper is the first approach to an explanation for the scalar variant of production of public goods in a network using computational simulation methodology, and it outlines three main findings. (1) A less demanding collective effort level does not entail more success: the effort should neither be as high as to discourage others, nor so low as to be let to others. (2) More informed individuals do not always produce a better social outcome: a certain degree of ignorance about other agents’ previous decisions and their probability of cooperating are socially useful as long as it can lead to contributions that would not have occurred otherwise. (3) Dense horizontal groups are more likely to succeed in the production of step-level public goods: social ties provide information about the relevance of each agent’s individual contribution. This simulation demonstrates the explanatory power of the structural properties of a social system because agents with the same decision algorithm produce different outcomes depending on the properties of their social network.
- Keywords:
- Public Goods, Collective Behaviour, Decision Making, Social Networks
Introduction
- 1.1
- Since individual rationality can lead to a suboptimal outcome, a collective action problem emerges in the production process of public goods (Taylor 1987). Several characteristics of public goods explain why their production takes the form of a "social dilemma" (Hardin 1982; Olson 1965; Taylor 1987): a) the good is jointly produced by the contributions of the individual group members, but typically not every single member's contribution is required; b) contributions are costly even when the value that is obtained from the public good is higher than the individual cost of the contribution; c) once the good is produced, it will be available to all members of the group since excluding non-contributing members from its enjoyment is difficult or costly; d) a member's usage of the good does not diminish its availability to other members (non-rivalness). This last characteristic is very infrequent, and here we will consider that the good provides an equal benefit to all members of the group.
- 1.2
- The production of public goods has been studied extensively through the following experimental design: a) a group of individuals receive an endowment of (e) units and have to decide, anonymously, how much (x) they wish to contribute to a common pool; b) the share of the endowment that is not contributed to the common pool (e-x) retains its original value, while the share that is contributed is multiplied by a factor c; c) the common pool (∑x*c) is divided in equal parts among all the members of the group; d) factor c is determined such that it would be better for each player to keep rather than contributing a unit, but it would be worse for each player if no one contributes rather than if everybody contributes all their endowments.
- 1.3
- This experimental design allows for countless variations: subjects can have equal or unequal endowments, decisions on how much to contribute to the common pool can be binary –to contribute all or not to contribute– or discrete –to contribute a fraction of e–, etc. The variant we are interested in specifies a different production function; production functions make the level of production of a good dependent on the contributions. The main distinction is between continuous and step-level functions (León 2010)[1]. In economic terms, we can stipulate that either the good has a price by unit (continuous good) or it has a unique price that has to be reached (step-level good).
- 1.4
- In the experimental design presented above, the production function is continuous. Each contribution adds to the production of the good, and all contributions add the same (it is a linear function). However, in this article we focus on public goods with a step-level production function. These "step-level goods" (SLG) or "lumpy goods" are characterised by the existence of a provision point: a minimum of contributions is needed to produce the public good. If the provision point is reached, the good is produced; if the point is not reached, the good is not produced at all. The basic SLG model states that once the provision point is reached additional contributions do not generate a higher level of production. [2]
- 1.5
- In the early 1980s, Marwell and Ames (1980), Hardin (1982), Taylor (1987) and Taylor and Ward (1982) highlighted the distinction between continuous and step-level goods. It is now widely accepted that public goods analysis is not possible without explicitly stating the kind of good we are referring to (Kollock 1998: 189; Komorita and Parks 1995; Ledyard 1995; Marwell and Oliver 1993: 24).
- 1.6
- The variation of the production function we introduce in our MAB experimental design is one of the most interesting possible variations, mainly because the inclusion of a provision point completely changes the logic of the situation. In truth, the variation of other design elements, such as the endowment –equitable/inequitable–, the type of distribution –equitable/inequitable–, the type of decision –binary/discrete– can have a significant impact on the results, but do not make a public goods game any different to an n-person prisoner's dilemma. The introduction of a provision point does achieve the difference: since there is a provision point, defection is no longer a dominant strategy in a one-shot game.[3]
- 1.7
- Collective action in the form of producing a step-level public good is rather frequent. For example, the case presented by Taylor (1987) regarding an election with two options, A and B, on a committee or a volunteer assistance parliament in which there are two parties: a majority and a minority. The largest party prefers option A to B. Which majority group members will attend the session? To the extent that attendance is voluntary and costly, each member from the majority group would prefer that other members of his group attends and help with their vote to elect option A. Moreover, in this situation, a greater number of majority members than minority members attending is enough, but beyond that point further attendees of the majority group are not required to produce the "good": winning the election. Note that in this case it is not strictly necessary for A to be a public good, but the logic of the situation is exactly what we model in this paper. Another real example of scalar public goods would be the following: in some universities and colleges, the department's budget partially depends on the productivity of their members, measured as the total number of journal papers produced by the department. If there is a minimum threshold of articles to obtain the additional budget, this may be considered a scalar public good. Apart from any other personal benefit of publication, each member of the department has to establish its contribution at a level of effort, knowing that only if the cumulative efforts reach the required level the department will get an additional amount in the annual budget.
- 1.8
- An experimental design for studying SLG production could start from the simple model outlined above, and then modify the third characteristic by adding a minimum amount or "provision point" required for the good to be produced. The first experiments with this type of design were conducted by van de Kragt et al. (1983) and Rapoport (1985, 1987, 1988, 1993). In this paper we aim to computationally replicate a variant of these experiments. The paper is organised as follows. First, we present different types of sequential running ordering of the agents' decisions and our proposal of a network-dependent sequence formalisation. Second, we briefly review the literature on social networks and experimentation in public goods. Third, we present an agent-based model that replicates the experimental setting (Miguel 2011). Fourth, we present the results of different simulations and the discussion.
A Network-Dependent Sequence Ordering Rule for the Production of Public Goods
- 2.1
- The literature on the subject suggests that the decisions of experimental subjects in SLG experiments are very sensitive to the sequence of the decisions (Abele and Ehrhart 2005; Erev and Rapoport 1990) because different sequencing implies different information available at the decision moment. Four different rules for determining the order of agents' decision sequencing can be found in experimental research (Budescu et al. 1997): (1) the "simultaneous protocol", where subjects have no information about the one another's decisions; (2) the "sequential protocol", where subjects have complete information about all previous decisions; (3) the "positional protocol", where a subject has information about her position in the sequence but not about previous decisions; and (4) the "cumulative protocol", where the subject knows the quantity of the contributions made before her, but not her own position in the sequence.
- 2.2
- In laboratory experiments, all these sequencing –or running order– rules have been limited in their design by the necessity of simplicity taking priority over realism, and can therefore result in unrealistic assumptions about the available information when people make their choices. This simplification implies a higher capacity to control for variables, generating cumulative knowledge about factors that influence behaviour. The lack of realism inherent in these sequencing rules does not necessarily imply a lack of value or heuristic utility. Our proposal aims to elaborate and apply a new rule to complement the existing ones.
- 2.3
- A more realistic sequence ordering rule should represent a decisional situation where individuals are embedded in a relational structure that constrains the available information. In a non-artificial situation of public goods production, individuals typically have certain local knowledge about the dimensions of their group, but they are not in direct contact with all members. In other words, it is the network structure that determines available information in terms of what others think, say or do. That is why, with the exception of experiments by Suri and Watts (2001), it is commonly accepted in existing literature that a social network's topology, or more specifically, the structural properties of a social network have an effect on the level of contribution to collective action. Co-operative behaviour can spread in a network due to such mechanisms as mimicry (Fowler and Christakis 2010) or social comparison (Zschache 2012), but in this paper we focus on the role played by the use of local information on the decisions of adjacent nodes.
- 2.4
- An experimental set-up aimed at reproducing this situation would be too complex to be executed in a laboratory, so we instead test this new sequence ordering rule within a computational multi-agent simulation model. This solution allow us to avoid the trade-off between simplicity and realism typical for laboratory experiments, and substitute it for a trade-off between realism in some aspects –agents will be embedded in a network– and realism in others –decisions will be made by software agents not by real people. In addition to the aim to computationally replicate some experimental set-ups of the reviewed literature, other considerations such as the relative advantage in terms of costs, resources and time, or the fact that the simulation can predict when there are differences in the parameters that describe a given environment, play in favour of the use of ABM research methodology.
The Formal Model Description
- 3.1
- In this section we outline the formal model to be computationally implemented:
- A group of agents N = {1, …,n} participates in a public goods game.
- Agents know the size of the group –the network– they belong to.
- Each player i (i ∈ N) receives an endowment of ei units (ei>0). The value of all endowments is equal.
- Each agent i ∈ N decides about the quantity (xi) from the set X={0, ei} that she wishes to contribute to the production of the public good. Agent i must make a binary decision: to either contribute all her endowment (xi=ei) or contribute nothing (xi=0).[4]
- The position of each agent in the sequence of decisions is randomly determined.
- Agents are placed in a network, g, where they only interact with some members of N. Network g is constituted by symmetrical links: gij=gji.
- Each agent i ∈ N faces a set of adjacent nodes or neighbours Ni ⊂ N with which she is connected. Ni={j∈N | gij=1}. The number of i's neighbours is ki –i's node degree centrality–.
- If gij=1 agent j will know xi if in the randomly decided sequence (see point 5) xi has taken place before xj, and vice versa.
- Agents know their ki, but not that of their neighbours. They also do not know their position in the sequence of decisions of N, although they know their position in the sequence of decisions of Ni.
- At the decision moment t, each agent has three pieces of information about other agents' decisions: a) how many neighbours have made decisions previously –B, for "Behaviours" –; b) ∑j∈Nixj,t-1, that is, how many adjacent nodes have contributed their endowment to the production of the public good in t-1 –C, for "Cooperators"–; c) how many agents participate in the network about whom she has no information, n-ki.
- There exists a provision point (m) known by all agents, 0<m<∑i∈Nei.
- If ∑i∈Nxi ≥ m, each agent receives a payoff r. If ∑i∈Nxi < m, the good is not produced and all the contributions are lost.
- The payoff i receives if the group reaches the provision point is r = mc/n, where c is a factor known to all agents, such that ei < r.
- The final payoff (πi) that agent i receives is determined by the following payoff function:
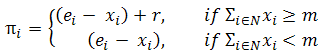
(1) - 3.2
- In our model, called "NetCommons", people are located in a socio-matrix that constrains the available information, conditioning the decision process. Let us illustrate two different decision sequencing orders in this network –the sequence of decisions in the matrix follows an alphabetical ordering–.
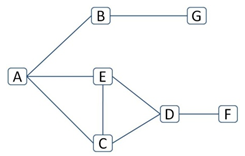
Diagram 1. A typical decision ordering in a N=7 network - 3.3
- Agent B decides knowing the decision of A and knowing that G has not decided yet. Since she knows her position in the sequence of decisions of NB but she does not know her position in the sequence of N –see point 9–, agent B cannot know whether C, D, E, or F have already decided. Similarly, agent C decides knowing the decision of A and knowing that E and D have not decided yet. Since she knows her position in the sequence of decisions of NC but she does not know her position in the sequence of N, agent C cannot know whether B, F, or G has already decided. Each individual has access to information about part of the decisions already taken, but faces uncertainty with respect to the rest of the past and future decisions.
Networks and Experimentation on Public Goods
- 4.1
- Moreno's work (1951) is often referred to as the starting point of social network analysis. Only in the last 20 years has network analysis been applied in experimental economics –for a review, see Kosfeld (2004). These studies have focused mostly on coordination networks, buyer-seller networks and network formation.
- 4.2
- Concerning experimental research on public goods, lab experiments considering the role of networks are scarce –some exceptions are Bonacich 1990; Cárdenas and Jaramillo 2009; Sonnemans et al. 2006; Fowler and Christakis 2010– and available research usually considers networks to be the outcome of a generative process rather than a precondition for interaction. Knigge and Buskens (2010), for example, presented an experiment in which subjects seek to establish relationships with others that share access to the good produced, so that the network emerges from the interactions. This paucity of network analysis in the context of laboratory research on public goods is surprising as the consensus is that overcoming the free-rider problem requires establishing some form of interdependence between decisions (Marwell et al. 1988). The relevance of social ties in determining participation in collective action was pointed out a long time ago (Tilly 1978; Oberschall 1973). The explanation for this is most likely the technical difficulties of reproducing countless specific configurations of networks in a laboratory context.
- 4.3
- Consistent with this, the main contributions to understanding the relation between networks and public goods have been realised outside the lab, through mathematical models and simulations. Novak and May (1992) were the first to study the dynamics of the prisoner's dilemma when agents are placed in a two dimensional space that constrains them to interact with their neighbours. Since then, the social location of the agents has been considered a key element to be modelled in theories of collective action, thus opening the door to the study of the relationship between networks and public goods. Bramoullé and Kranton (Bramoullé 2007) were the first to present a network model of public goods, while other authors use an evolutionary approach to public goods without paying attention to the social structure (e.g.,Ye et al. 2011). In the field of mathematical and computational modelling, as in experimental research, the analysis of the relationship between networks and public goods has emphasised the analysis of reticular dynamics, i.e. the processes of networks emergency. Thus, for example, Takács et al. (2008) and Skyrms and Pemantle (2000) presented models in which the participants in collective action can strategically review their relationships, thus generating reticular dynamics, and Bravo et al. (2012) claimed that the endogenous formation of the network is even more important for cooperation than the network topology. In general, these models are part of a broader tradition, studying the emergency of complex networks from local interactions, such as models in Sutcliffe et al. (2012) and Pujol et al. (2005).
- 4.4
- Table 1 summarises the differences between our simulation model and the leading models on networks and collective action in literature. As can be seen, NetCommons is the first simulation model of SLG production. To the extent that the logic of the situation is completely different when the good has a provision point, we understand that the original contribution of this article is that it will be the first to explore the role of reticular topology on the success of collective action which aims to produce a step-level public good.
Table 1: NetCommons compared with leading models of networks and public goods Marwell (1988) Gould (1993) Chwe (1999) NetCommons Method Simulation and mathematical model Mathematical model Mathematical model Simulation Agents Motivation and decisional mechanism Expected utility maximisation
Rationality and justice norms
Probability of reaching the threshold
Expected utility maximisation
(criticality)Decision cost Considered Irrelevant Not considered Considered Endowment Different for each agent Not considered Not considered Equal for all agents Reward Different for each agent Not considered Not considered Equal for all agents Unconditional contribution Impossible Possible Impossible Impossible Threshold No threshold No threshold Endogenous and precondition Exogenous and objective Individual efficacy Dependent on the decision of the group Dependent on previous decisions Not Dependent on previous decisions Dependent on previous decisions Networks Links Asymmetrical and direct Symmetrical and direct Asymmetrical, direct and indirect Symmetrical and direct Use of the links Costly Not costly Not costly Not costly Agent's knowledge of the network Agents know the structure
Agents know their neighbours
Agents know the structure
Agents know their neighbours and n Information obtained in the network
Perfect information Behaviours and predispositions Others' personal thresholds Others' behaviours Output Main result Sum of contributions Sum of contributions Sum of contributions Success rate
The Simulation Model Description
- 5.1
- The simulation was conducted through the Netlogo platform. The code is available at "CoMSES Computational Model Library", the public repository of OpenABM Consortium, http://www.openabm.org/model/2522/version/1/view (Miguel 2011). This model implements the formal network-dependent decision sequence ordering outlined in the previous section. However, since the model intends to capture the essential traits of SLG productions, we complete here the specification of the formal model by including four elements: (1) the agents' decision process; (2) the initial parameters; (3) the network properties; and (4) the dynamics of the process and its output.
How agents decide in the model
- 5.2
- In the NetCommons model, agents are assumed to be self-interested utility maximisers. Experiments have shown that subjects who repeatedly face a public goods game tend to act in accordance with the predictions of rational choice theory (Ledyard 1995). Theoretical predictions from our simulation can be considered as well-grounded hypotheses of what we reasonably expect to find in real cases (including laboratory experiments). Moreover, our model can offer some practical advice on the most effective way of producing a public good. We could consider prosocial agents, but constructing a model based on the most unfavourable assumptions regarding the production of public goods –with self-interested utility maximiser agents– is the best strategy. Prosocial agents would merely raise success rates –their probability of cooperation is higher–.
- 5.3
- To model decisions we shall use the concept of self-efficacy or criticality, and its formalisation based on probability theory. In the context of the production of SLG, criticality refers to the condition whereby a decision is necessary and sufficient to reach the provision point. In NetCommons, agents have the cognitive capacity to estimate their probability of being critical.
- 5.4
- When an agent decides whether to contribute to the common pool, she will consider the provision point (m), the reward that she expects to obtain if the good is produced (r), the cost of her contribution (x), the number of neighbours that have previously decided (B), and the number of neighbours that have already cooperated (C). Moreover, the decision will depend on her belief that an exact number of m-1 will contribute, making her contribution critical, so the decision ultimately depends on the probability of cooperation agents attribute to each other (p).
- 5.5
- An obvious implication for the NetCommons model is that an agent cannot rationally foresee the decisions of the other agents at the moment of her decision. She does not know the information that others will have at the moment of their decision, since she does not know which other agents are neighbours or what information they receive from their adjacent links. In this situation of uncertainty regarding others' decisions, the rational option would be to attribute to others a certain probability of cooperation, 0≤ p≤1. In our model, we integrate a homogeneity assumption (Rapoport 1985), whereby all agents attribute the same probability to all other agents[5].
- 5.6
- Taking all these factors into account, agents will find themselves in one of the following six exhaustive and mutually exclusive situations:
Situation 1: The number of neighbours who have already cooperated is equal or higher than the provision point. In this case the public good will be produced and the agent's contribution is not strictly required. A rational agent will not cooperate in this situation, for contributions above the provision point have no effect and constitute a pure loss for the agent.
First situation: If C≥m, then DO NOT cooperate.
Situation 2: The number of neighbours that have already cooperated is equal to the provision point minus one, and each agent believes that she is not the last one to decide. As long as the reward is higher than the cost of contributing, we expect the agent's cooperation to ensure the provision point is reached. However, the agent also takes into account the possibility that others will bear the cost of contribution, in which case she can retain the endowment and receive a share of the reward without expending the cost. In this situation, an agent's cooperation depends on her belief that nobody else will co-operate, that is (1-p)n-B-1, because only in this case is her contribution critical.
Second situation: If C=m-1 and n-B>1, then: cooperate if r[1-(1-p)n-B-1]>e DO NOT co-operate if r [1-(1-p)n-B-1]≤e
Situation 3: The number of neighbours who have already co-operated is lower than the provision point minus one, and the number of pending decisions is equal or higher than the number of contributions needed to reach the provision point. In this case, the agent has to calculate her probability of being critical by considering both how many neighbours have not decided yet and how many strangers are in the network.[6] Building on the probabilistic model of Rapoport (1985), which has been widely used as a reference model for calculating "objective" criticality (Kerr 1989), we calculate the probability of being critical, Pm-C-1, as follows:
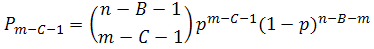
(2) That is, the probability that in each combination of n-B-1 players, exactly m-C-1 will co-operate and the rest (n-B-m) will not. This would make her contribution critical.
Third situation: If C<m-1 and m-C≤n-B, then: co-operate if rPm-C-1>e. DO NOT co-operate if rPm-C-1≤e
Situation 4: The agent's contribution is critical only if it is added to the future cooperation of all the agents about whom she has no information –because they have not decided or because they are not placed in adjacent nodes. This requires a belief that she is not the last one deciding.
Fourth situation: If 1<n-B=m-C, then: co-operate if rpn-B>e DO NOT co-operate if rpn-B≤e
Situation 5: An agent faces a situation in which the number of instances of cooperation needed to reach m is higher than either the number of agents that have not yet decided or those about whom she has no information. In this case, a rational agent will not cooperate, since the goal is unattainable and her contribution would be lost.
Fifth situation: If m-C>n-B, then DO NOT cooperate.
Situation 6: An agent finds herself in a situation where she believes that she is the last one to decide, and only one more contribution is needed to reach m. Given ri>ei, a rational agent will always co-operate.[7]
Sixth situation: If 1=n-B=m-C, then cooperate.
The initial parameters of the simulation
- 5.7
- The initial parameters in NetCommons are almost identical to those used in the pioneering SLG experiments of van de Kragt et al. (1983):
m=3, n=7, p=0.5, e=5, r=15
In the van de Kragt design, there was no p parameter, and our reward (r) is slightly higher than theirs in response to some early testing of NetCommons. However, the quantity of r is not arbitrary. It has been establish inside the margins that leads to a failure in the production of the good when decisions are simultaneous (Rapoport 1985: 151). To illustrate it, in a simultaneous protocol with the parameters m=3, n=7, p=0.5, e=5, rational utility maximisers evaluate their probability of being critical as Pm-1= 0,234. If their decision is to cooperate only when rPm-1>e, only r=22 could lead them to cooperate. The same is also true for a cumulative protocol. If the network-dependent decision sequence ordering leads to success where the simultaneous and the cumulative sequence orderings fail, or if at least does so under certain well-specified conditions, we could conclude that working in a network, or at least in certain networks, facilitates the achievement of the common goal. Under equal conditions of incentives for the production of the good, the network-dependent sequence ordering would not only be more realistic, but also more effective than the simultaneous and the cumulative ordering rules.[8]Input networks properties
- 5.8
- Multi-agent simulation not only allows us to place agents in a network structure and observe the results, but also allows us to compare the results obtained when these agents are placed in different kinds of social networks. For this purpose, we have built –with Ucinet 6.0 and in DL format– a catalogue of symmetrical networks composed by 7 nodes and with different densities and global degree centrality and heterogeneity.
- 5.9
- Density is defined as the ratio of the number of ties over the maximum possible number of ties (Scott 2005).
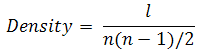
(3) where l is the number of ties in the network. The value of density oscillates between 0, when no node is linked, and 1, when all the nodes are connected with each other. For networks with n=7 and only one component, density ranges between 0.29 –for a network with the shape of a line– and 1. Density is one of the structural properties of networks that existing literature has identified as relevant due to its impact on the success of collective action. This impact, however, is far from clear (Bravo 2008). Authors like Takács et al. (2008), for example, have noted that dense networks involve more information and greater capacity for punishment, which fosters cooperation. However, at the same time, high density can provide tools to resist pressure and even for mutual affirmation of defecting behaviours. Punishment for defection may be reduced precisely because some neighbours anticipate future interactions that they do not want to compromise (Gould 2003). Also, if the decision to contribute depends on observed behaviour in the local neighbourhood, then observing non-co-operative behaviour can stimulate defection (Gould 1993).
- 5.10
- Given a certain level of density, it is possible to build networks with different global degree centrality of heterogeneity. For example, a network with a density of 0.52 can be composed of a set of nodes with degrees 5,5,4,3,2,2,1 or with degrees 5,4,3,3,3,3,1 (among many other possible combinations). We used Blau's index to measure heterogeneity. In symmetrical networks the index is defined as follows:
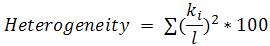
(4) - 5.11
- The networks that we use have just one component; all nodes are directly or indirectly connected forming a single structure. This is for two main reasons. First, as a matter of realism: in small groups (n = 7) the likelihood of more than one component is quite low, and in the case of public goods the population could be seen as belonging to communities that, generally, are more cohesive the smaller they are. Second, because our ultimate interest is in analysing the impact of reticular properties such as density and heterogeneity in the success or failure of collective action. The number of network components affects these indicators and therefore must be experimentally controlled as separate from the set of analysed variables.
- 5.12
- Given these characteristics, the catalogue is composed of 230 different networks.[9] This set is exhaustive: it includes all the possible networks with n=7, symmetrical ties and only one component. This means that the catalogue contains very different network topologies: small-world networks, scale-free networks, random networks, etc. However, the aim of this article is not to compare the differential success of these special types of networks but to explore the impact of reticular properties on the success or failure of the production of SLGs.
Dynamics of the process and outputs
- 5.13
- The previous formal model description section specifies the dynamics of the production of the public good, and corresponds to a single "turn" in the NetCommons simulation model, where all members of the group decide one after another resulting either in the provision point being reached (success) or not (failure).
- 5.14
- The top-level algorithm for the model is:
Create initial network (options: random network OR import-DLfile)
Unless maximum number of time steps (5000) has been reached, do:
    Reset all agents' attributes
    Unless all agents have decided, eavh agent will:
        Scan neighborhood for counting deciders (B) and cooperators (C)
        Estimate the decision situation
        Make a decision about cooperation behaviour
        Record micro-decisional outcomes in a buffer-matrix
        Next agent
    Compute the turn macro-indicators from the buffer-matrix
    Update outputs and plotting
    Next turn
Stop simulation run - 5.15
- The final result of a turn depends on the sequence of decisions, which, as stated before, is randomly decided in each turn. For n=7, the number of all possible sequence ordering is 7!=5,040 for each different network. This means a network has 5,040 different possible results. In our analysis we focus on the success rates (SR) of each network, defined as the number of successful turns –where the provision point is reached– over the total number of realized turns. In the next section we present the results after a simulation of 5,000 turns for each network.
Results and Discussion
- 6.1
- In this section we discuss two different types of results. The first type concerns how the change in certain initial parameters impacts on the success rate (SR). For this analysis we focus on a single network ("18_16.dl") comprising 18 ties and a heterogeneity of 16%. The reason for selecting this particular network was its average success rate (0.63) which allowed us to better analyse the impact of changes in the initial parameters.
- 6.2
- The second type of results relates to the variability in success rates of different networks as a function of their structural properties. For this analysis we used the full catalogue of 230 networks.
The stability of the success rate
- 6.3
- If there exists a finite number of possible sequence orderings for a network, and if the results of a particular turn do not affect the subsequent turns, a success rate that is updated after each turn cannot show an unstable pattern. As the simulation is running turn after turn, the network would asymptotically approach the average success rate (SR) produced by –hypothetically– calculating the result of the 5,040 possible sequences of the network. We can see in Figure 1, with this stabilisation evident, the updated SR after each turn concludes.
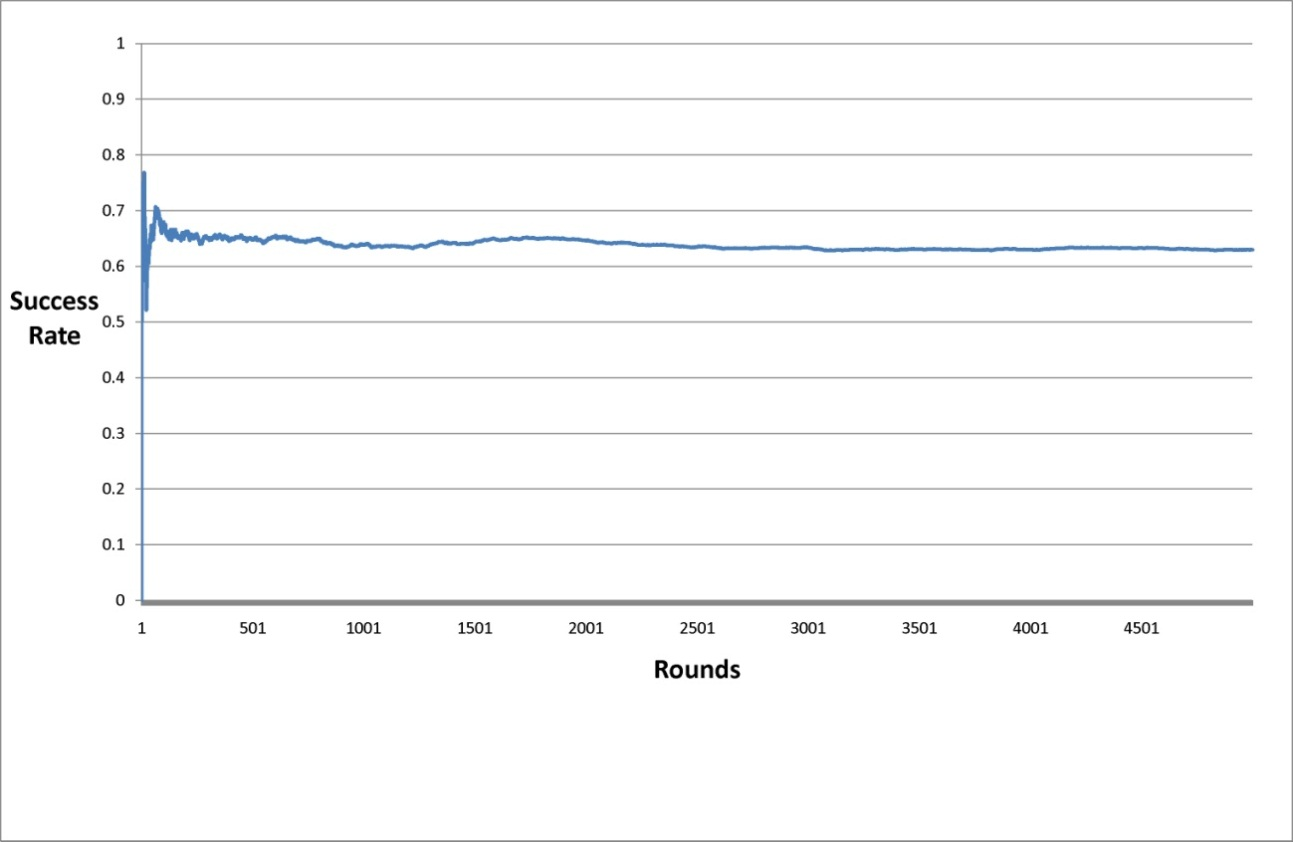
Figure 1. Success rate of the network "18_16" (5000 rounds) - 6.4
- Two remarks should be made here. First, the fact that each network or "social unit" has its own success rate is unsurprising in sociological analysis. Less common is the ability to identify the situational mechanisms –responsible for the macro-micro link–, the action-formation mechanisms –responsible for the micro-micro link– and the transformational mechanisms –responsible for the micro-macro link– that explain how individual actions jointly produce that outcome (Hedstrom and Swedberg 1996, 1998). In our case, the simulation allows us to generate and analyse the 35,000 individual decisions that cause this rate, and moreover specify how this happens.
- 6.5
- Second, we estimate that the "18_16" network needs 212 rounds to stabilise at a rate within a ±3% margin of the rate obtained after 5,000 rounds. If we use a margin of ±5%, it takes the simulation 100 rounds to achieve stability. In both cases, it is an excessive number of rounds to be reproduced in a laboratory experiment with human subjects. This is why the analysis of the network-dependent sequence ordering can only be produced through a multi-agent simulation or a mathematical model.
The effects of the change in the parameters
- 6.6
- In the following sections we present some results of analysing the effects on the SR of different relevant parameters. We will explore three spaces of parameters in turn: the provision point of the public good (m), the probability of cooperation attributed to other agents (p), and two structural properties of the networks (density, and global degree heterogeneity). In all three cases the analytical strategy will be first to present some aggregate or macro-results, and then analyse the detailed records to establish the micro-foundations explaining these results.
Changes in the provision point (m)
Macroresults
- 6.7
- After 5000 rounds, the success rate of the network "18_16", which comprises different provision points while keeping the rest of the parameters constant, presents the following distribution.
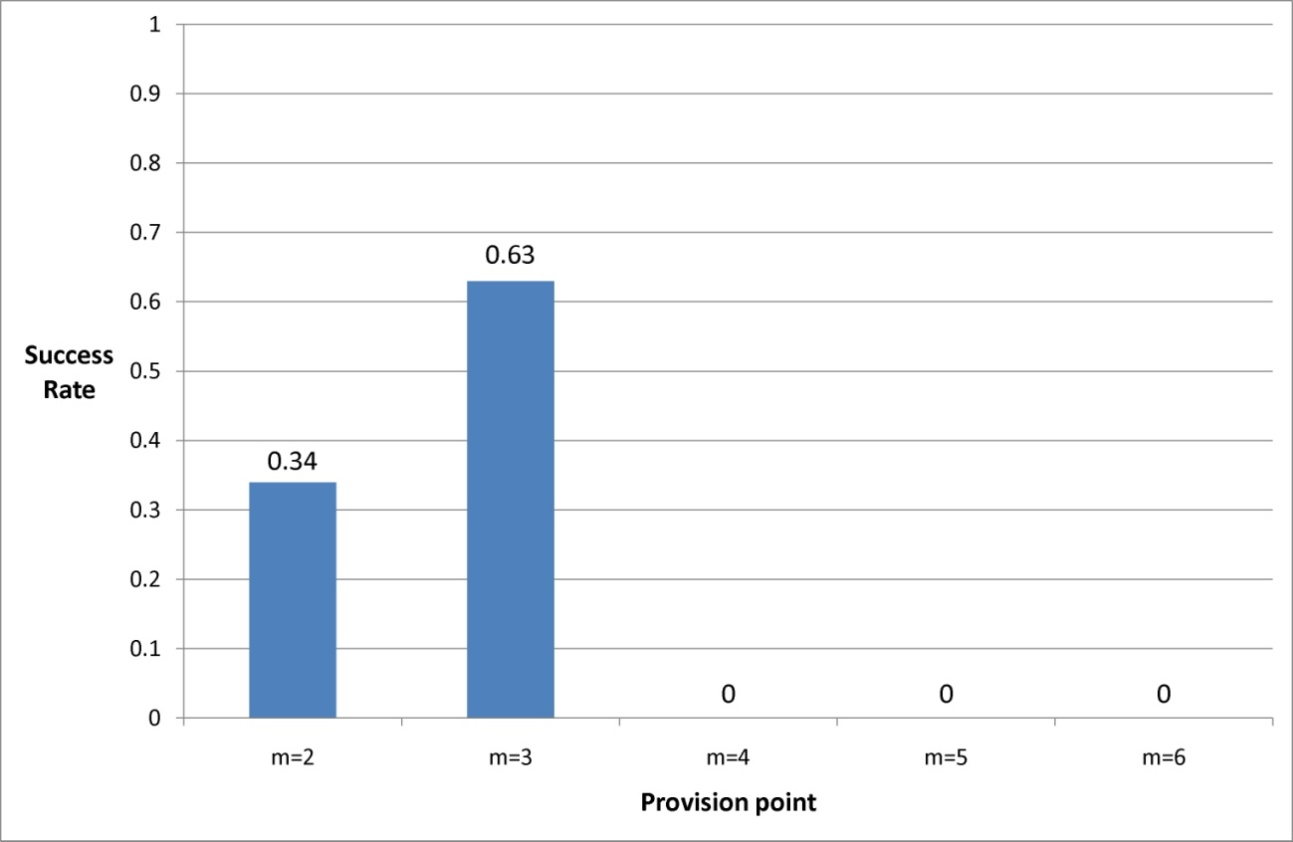
Figure 2. Success rates of the network "18_16" with different provision points - 6.8
- In this analysis we do not consider the possibility of m=1: this particular situation does not constitute a collective action problem. In addition, our formalisation 0<m<∑i∈Nei allows us to dismiss m=7 as well, because this situation excludes the possibility of receiving a benefit without cost.
- 6.9
- As shown by Figure 2, high provision points generate a failure of 100%. The lower provision point m=2 is more successful, but this one in turn is outperformed by the intermediate provision point m=3. To a certain degree (m=3 in our case), higher SRs are achieved the more people collaborate.
Microfoundations
- 6.10
- Table 2 allows us to identify the explicative micro-foundations of the SRs obtained with different provision points.
Table 2: Number of decisions depending on the provision point, the order in the sequence, the situation that the agent faces, and the type of decisions made (network "18_16", 5000 rounds for each provision point) Situation 1
C>=mSituation 2
C=m-1 & n-B>1Situation 3
C<m-1 & m-C=<n-BSituation 4
C=m-n+BSituation 5
m-C>n-Bm Order Def. Coop. Def. Coop. Def. Coop. Def. Coop. Def. Coop. 2 1 5000 2 5000 3 5000 4 4602 398 5 236 3902 862 6 21 838 3181 852 108 7 166 1393 2328 414 699 3 1 5000 2 5000 3 4163 837 4 3171 1829 5 2279 2476 245 6 25 1155 3239 463 118 7 65 4251 222 462 4 1 5000 2 5000 3 5000 4 4590 410 5 4143 624 233 6 3966 370 664 7 3644 665 691 Note: Any network consisting of 7 members represents a total of 7 decisions each round, so that 5000 rounds involve 35000 choices. Each of these decisions (a) has been produced in a sequence order within the round (from first to seventh, the last), (b) has occurred in one of the 5 decision situations, and (c) has been whether to co-operate or not. The table above displays the absolute frequency cross-distribution of 35,000 decisions, accounting for the three variables and controlling by 3 levels of provision point (m). - 6.11
- Table 2 shows that first choices are always produced in Situation 3 and always consist of a defection, independent of the value of m. The explanation of SR requires clarification of how, when and why agents start to cooperate. In Situation 3, PmC1 indicates that (while C=0) with a low B no agent cooperates, but from a certain threshold in B values onwards agents start cooperating. To explain why this happens we have to explore the three components of the criticality calculus (Formulae 2). The first component, the binomial coefficient C(n-B-1, m-C-1), is lower the higher B is. In these first rounds in which nobody cooperates, the second component (p m-C-1) is constant and can therefore be ignored. The last component ((1-p) n-B-m) provides the key to understanding the underlying mechanisms, because here we observe that the higher B is, the higher the possibility that n-m will not cooperate, which in turn increases the probability of the agent's criticality.
- 6.12
- This is a situational mechanism (Hedström and Swedberg 1998), since it explains at which moment and why a pioneering cooperative behaviour –cooperation that is believed to be pioneering by the agent– is triggered. We call this mechanism the pioneering cooperation trigger. Once this mechanism is activated, two situations can occur. In some cases, pioneering contributions establish the conditions for other agents to estimate their probability of being critical as high, and therefore they decide to co-operate. We call this mechanism the speculative cooperation trigger. In other cases, having relevant information concerning previous cooperation directly affects an agent's belief that her contribution means the provision point is reached (although she cannot be sure that her contribution is critical, since other agents could bear the cost of the contribution). We call this mechanism the effective cooperation trigger.
- 6.13
- The only transformational mechanism that explains why a turn concludes successfully is the mechanism of the aggregation of individual choices. However, this mechanism can take different forms depending on the way in which situational mechanisms that trigger pioneering, speculative and effective cooperation are activated. Different cumulative processes that lead to success explain why each case has its SR, and why that rate is different in each case.
- 6.14
- Further, different cumulative processes explain why a network with m=2 achieves a specific SR, and why this SR is lower than the SR produced when m=3. The key to understanding this difference is the fact that the threshold of B values which activate the pioneering cooperation trigger is higher in networks with lower provision points. Keeping C=0, m=2 requires B=3 to co-operate, while m=3 only requires B=2.
- 6.15
- This outcome is explained as the result of a change in the first component of Pm-C-1. Keeping B and C constant, goods with a higher m produce a higher value for the binomial coefficient C(n-B-1, m-C-1), which in turn implies that the criticality estimation favours cooperation. When p=0.5, the probability of a situation with 1 cooperation and 5 defections is equal to the probability of situations with 2 cooperations and 4 defections. However, the latter is more likely than the former because there are more combinations of this outcome. In other words, an agent is more likely to be critical when the number of contributions needed is higher.
- 6.16
- When m=2, starting from the fourth player it is possible that someone may have knowledge of B=3 and then decide to cooperate. When m=3, the same process starts earlier, but now it only takes B=2 for the agent to co-operate. This means that when m=3 pioneering cooperation is triggered earlier than when m=2, which in turn induces the earlier triggering of speculative and effective cooperation. In the case of m=3, previous cooperation leads either to speculative cooperation or to the agents finding themselves in Situation 4 characterised by no cooperation. However, since the balance is positive, the increase in speculative cooperation is responsible for the increasing success rate. The case of m=3 implies an early triggering of pioneering cooperation, which allows a subsequent triggering of speculative cooperation sufficiently high for the provision point to be reached. When m=2, pioneering cooperation is triggered at a later point, which means speculative and effective cooperation can emerge too late for the provision point to be reached.
- 6.17
- SR grows from m=2 to m=3, but falls from m=3 to m=4. This is explained because, while with these parameters B≤3 leads to a defection, in contrast to when m=3 the pioneering cooperation trigger is not activated. In this situation, agents with ki≤3 never cooperate, while those with ki≥ 3 either face Situation 3, with a criticality estimation that discourages cooperation, or else face Situation 4, where the criticality calculus always leads to defection. The conditions that lead to cooperative behaviour are never met.
- 6.18
- In short, the explanation of the different success rates for each value of m resembles an instance of path-dependence, because of the way in which the cumulative process of contributions takes place. Where the conditions for an early triggering of pioneering cooperation are met, the subsequent triggering of speculative and effective cooperation may take place early enough for the provision point to be reached. High (m=3) provision points trigger pioneering cooperation earlier, thus generating an earlier cascade of decisions that lead to the production of the public good. However, provision points that are too high (m>3) have the opposite effect, since the accumulation of defections reduces the possibility of reaching a very demanding goal. In general, agents do not expect to be critical when the goal is easy, because they believe other agents will likely bear the cost, nor when the goal is very demanding, because they think there will not be enough other agents contributing.
Changes in the probability of cooperation attributed to other agents (p)
- 6.19
- As we have discussed and argued, we start from the assumption of homogeneity as raised by Rapoport (1985), i.e. all agents attribute to others the same probability of cooperation (p). When we focus on analysing the role of the structural properties of the network, we must set this parameter to a specific value to run simulations. This poses a problem, because for a rational and maximising-utility agent, there is no reason whatsoever to set this parameter to any value. Therefore, if all possibilities are equally likely –and the agent has no reason to believe otherwise–, the Principle of Insufficient Reason suggests that we set the parameter to p=0.5. There are other possibilities, such as fixing the value of p as a function of observed behaviours by the agent in his neighbourhood, but to attribute to those who have not yet decided a cooperative probability dependent on the behaviour of those who have already decided seems an exercise more unreasonable than attributing to all agents an equal likelihood. However, ABM allows us to explore the breadth of possibilities by testing for possible values of p, and that is precisely what we do in the next section.
Macroresults
- 6.20
- Figure 3 shows that the belief in a high probability that other agents will cooperate has the same effect as a low probability (they both generate a low SR), while intermediate levels of trust or distrust in other agents' cooperation produce a higher SR.
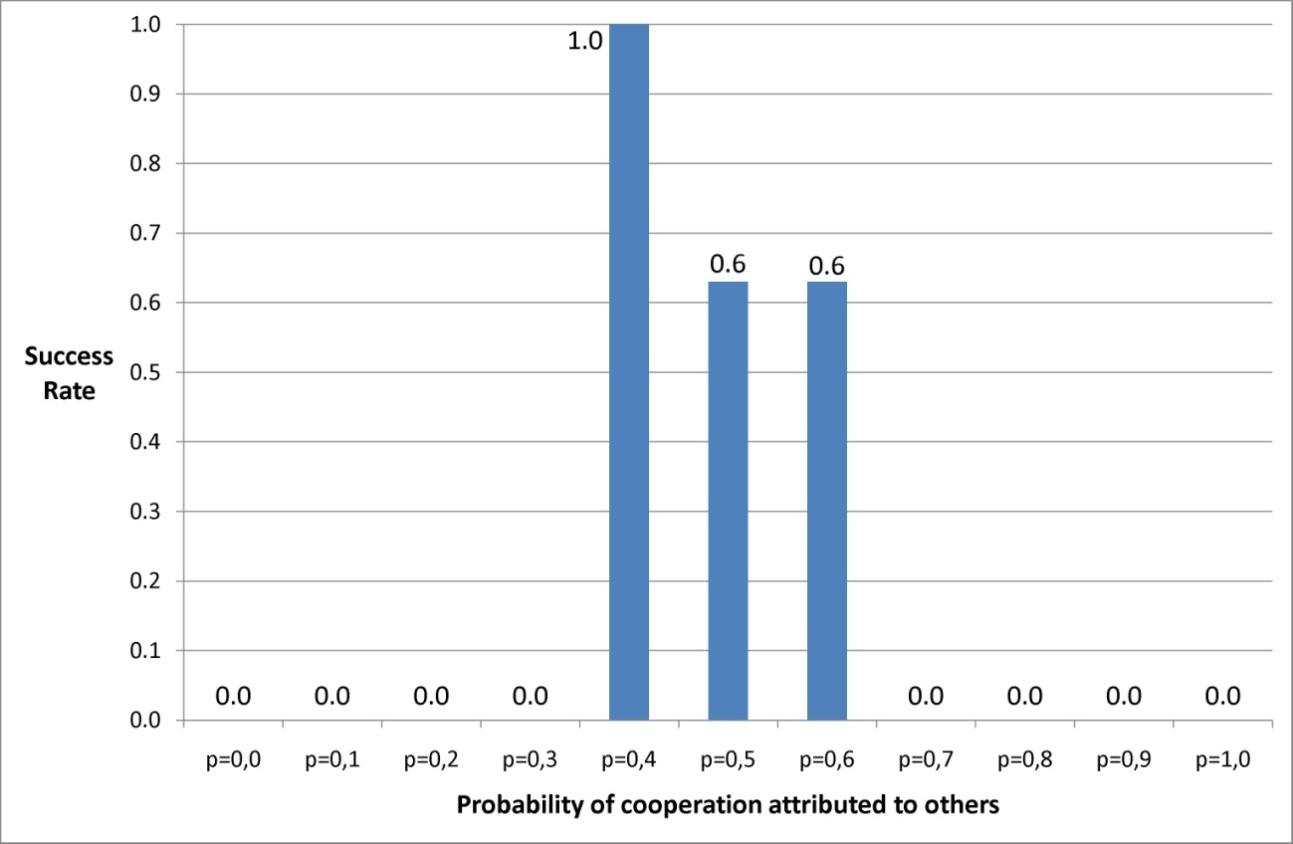
Figure 3. Success rate of network "18_16" depending on beliefs about the probability that other agents will co-operate (5000 rounds for each value of p) Microfoundations
- 6.21
- Table 3 helps us to identify the explanatory mechanisms of these results.
Table 3: Number of decisions depending on the probability of cooperation attributed to other agents, the order in the sequence, the situation that the agent faces, and the type of decisions made (network "18_16", 5000 round for each value of p) Situation 1
C>=mSituation 2
C=m-1 & n-B>1Situation 3
C<m-1 & m-C=<n-BSituation 4
C=m-n+BSituation 5
m-C>n-BP Order Def. Coop. Def. Coop. Def. Coop. Def. Coop. Def. Coop. 0.3 1 5000 2 5000 3 5000 4 5000 5 4765 235 6 4275 610 115 7 4274 726 0.4 1 5000 2 2835 2165 3 1579 3421 4 113 899 3988 5 15 575 302 4108 6 106 1343 3551 7 506 1875 2619 0.5 1 5000 2 5000 3 4131 869 4 3287 1713 5 2307 2432 261 6 29 1183 3194 480 114 7 72 4210 247 471 0.6 1 5000 2 5000 3 4200 800 4 3164 1836 5 2303 2508 189 6 19 1182 3186 485 128 7 69 4208 252 471 0.7 1 5000 2 5000 3 5000 4 4617 383 5 4148 626 226 6 3927 367 598 108 7 3551 742 707 Note: Any network consisting of 7 members represents a total of 7 decisions each round, so that 5000 rounds involve 35000 choices. Each of these decisions (a) has been produced in a sequence order within the round (from first to last, the seventh), (b) has occurred in one of the 5 decision situations, and (c) has been to co-operate or not co-operate. The table above displays the absolute frequency cross-distribution of 35000 decisions, accounting for the three variables and controlling by 5 levels of cooperation probability attributed to others (p). - 6.22
- Again, the key to explaining the differences in the SR lies in the conditions that activate the trigger mechanisms of pioneering cooperation, the number of previous decisions (B) necessary for an agent to evaluate her own probability of being critical as sufficiently high to cooperate.
- 6.23
- For this explanation, we build on Figure 4. This figure presents the mathematical relation between B (keeping C=0) and the probability of contributing to the collective action. Ordinate axis represents the value of D(p) for each of the possible values of p, where D(p)=rPm-C-1−e denotes the difference between the expected benefit and the expected cost. When D(p) has a positive value the agent decides to cooperate, while she decides to defect when D(p) is negative.
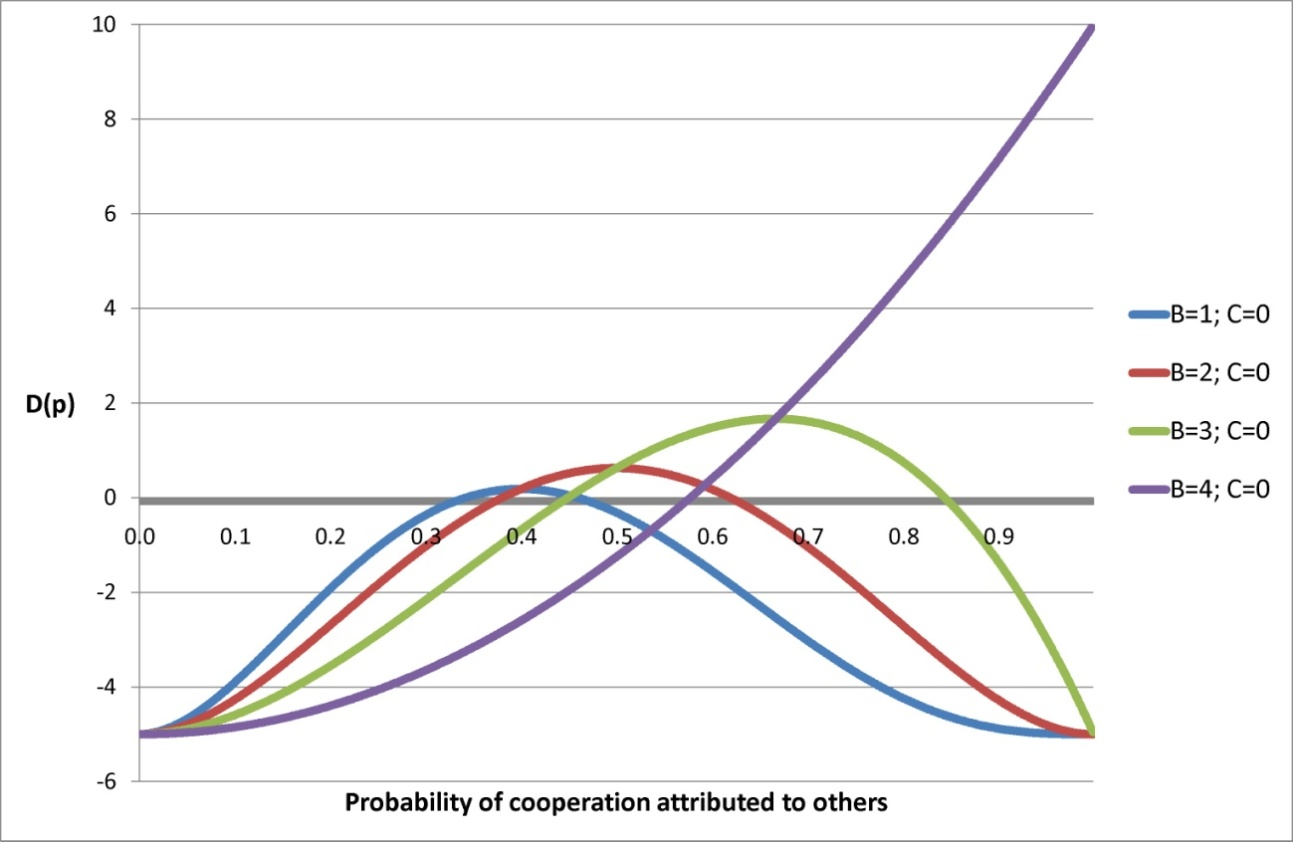
Figure 4. Probability of being critical depending on the probability of cooperation attributed to other agents and the number of previous decisions - 6.24
- Figure 4 shows two important points. First, the criticality calculus necessarily has an inverted U-shape because, while the first component of Pm-C-1 is constant, the remaining two are negatively correlated, such that the increase of pm-C-1 necessarily implies a decrease of (1-p) n-B-m . Second, Figure 4 shows that the values of B that lead to cooperation are dependent on the values of p. In other words, Figure 4 holds the key to identifying the transformational mechanisms that explain the results of Figure 3.
- 6.25
- With p=0.3, there is no possibility for pioneering cooperation to be triggered. With p=0.4, however, cooperation becomes possible even when B=1 and B=2. Once these cooperations are produced, speculative and effective cooperation can be triggered. With p=0.5 and p=0.6 the same process starts at a later point, when some agents know that B=2. This implies that in some cases the round fails because the triggering of speculative cooperation takes place too late (not enough contributions are produced to reach the provision point).
- 6.26
- With p=0.7 the SR falls to 0.0 because here a minimum of B=3 is necessary for the triggering of pioneering cooperation, so only a fraction of those who decide in the fourth or a higher place have the option to cooperate. Moreover, when this happens some of the agents face Situation 4, which again implies that there will not be enough contributions for the provision point to be reached.
- 6.27
- In short, on the one hand, excessive confidence about other agents' cooperation increases the belief that it is improbable that enough defections will be produced for the agent's contribution to be critical. On the other hand, excessive lack of confidence about other agents' cooperation increases the belief that it is improbable that enough contributions will be produced for the agent's contribution to be critical. With intermediate values of p, by contrast, the number of previous defections for triggering pioneering cooperation is low, and the cascade of cooperation starts sufficiently early in a round for the necessary contributions to be accumulated.
Success rates and the structural properties of the networks
- 6.28
- In this section we present the results obtained for the 230 networks of our catalogue and we try to identify some micro-foundations of those results.
Macroresults
- 6.29
- In Table 4 we present OLS regression models to test the influence of two structural properties of the networks on the SR. Since the relations between the independent variables and the dependent variable have an exponential character, all the independent variables are transformed into their base-10 logarithm.
Figure 5. Network density and success rate 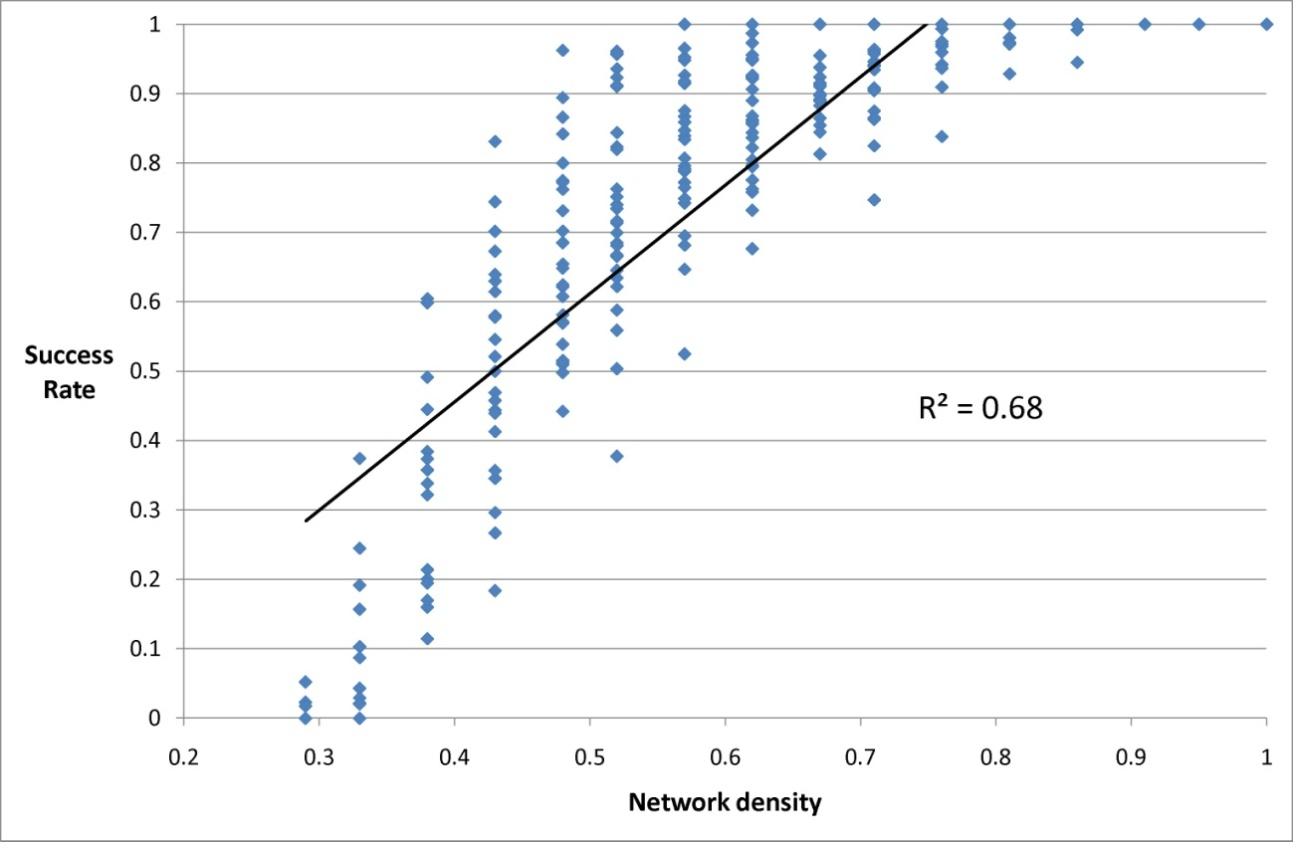
Figure 6. Network global degree heterogeneity and success rate - 6.30
- Table 4 shows that model B, which uses the base-10 logarithm of the density and heterogeneity as independent variables, explains 84% of the SR variability. Density positively correlates with SR and it is the variable with the highest predictive value. Global degree heterogeneity negatively correlates with SR and, although its predictive power is lower, its inclusion results in a model with a better fit.
Table 4: Success rate. OLS regression models (non-standardised coefficients and standard errors) (A) (B) Non-standardised
coefficients and
standard errorsBeta Non-standardised
coefficients and
standard errorsBeta Constant 1.271
(.022)***3.781
(.260)***LOG_DENSITY 2.114
(.076)***.881 1.505
(.090)***.627 LOG_HETEROGENEITY -2.195
(.227)***-.361 N 227 227 Adjusted R-square .775 .841 F 780.461*** 598.051*** R-square change -- .066 F change -- 93.787*** *** Significance lower or equal to 0.001 - 6.31
- Tsukamoto and Shirayama (2010) presented a model on the evolution of cooperation in complex networks, and found that intermediate values of heterogeneity generate maximum cooperation. In the same vein, Fu et al. (2007) presented an evolutionary prisoner's dilemma on a network, and also found that the frequency of cooperation is highest at intermediate levels of heterogeneity, and Yang et al. (2012) reached the same conclusion analysing scale-free networks. It seems, therefore, that much research points to the same conclusion: intermediate values of heterogeneity optimise the levels of cooperation. However, Fu et al. (2007) study the effect of heterogeneity starting from a network with a given homogeneity and then adding links to some selected nodes. Thus, it is not only the heterogeneity which increases, but also the density. Regression model B, presented in Table 4, allows us to assess the net impact for each of the two independent variables. In our case, unlike Fu et al. (2007), Tsukamoto and Shirayama (2010), and Yang et al. (2012), we find that, while controlling for the density, heterogeneity has a negative relationship with the rate of success. The difference between the continuous production of a good, such as that modelled by Fu et al., Tsukamoto and Shirayama, and Yang et al., and a scalar variant –like ours– implies a difference in the impact of the independent variables.
Microfoundations
- 6.32
- To discover the micro-foundations that explain the macro-results outlined in Table 4, we analyse agents' decisions in relation to their nodal degree. After all, networks are distinguished in terms of their relational structures, resulting from the difference in the nodal degree of the agents. Moreover, agents with the same nodal degree behave in the same way, independent of the network in which they are situated.
- 6.33
- For simplicity, we use a subset of 8 networks representatives of different combinations of density and heterogeneity. Figure 7 shows the percentage of cooperation and defections of agents depending on their nodal degree.
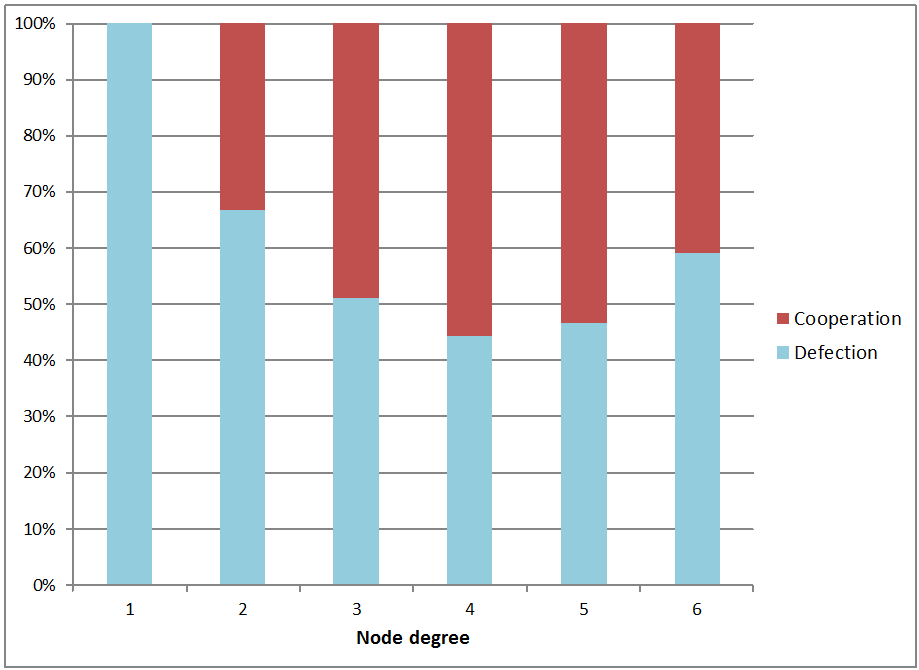
Figure 7. Agents' decisions depending on their node degree for 8 selected networks (5000 rounds for each network, 280000 decisions in total) - 6.34
- The relation between the node degree and the probability of cooperation has an inverted U-shape, although the probability of cooperation generally increases for higher node degrees. The higher the density of a network, the higher the probability that a sufficient number of agents contribute to the production of the public good.
- 6.35
- At the same time, the higher the global degree of heterogeneity, the higher the dispersion in the nodal degrees of the agents. In this case we can find more agents with extremely high or extremely low nodal degrees and those are precisely the nodal degrees that correspond with a lower probability of cooperation. The effect of heterogeneity is not as clear as the effect of density: while a high heterogeneity leads to fewer contributions, a low heterogeneity leads either to fewer or more contributions depending on the mean nodal degree of the network.
- 6.36
- These effects of density and heterogeneity are represented in Figures 5 and 6 above. Given that the influence of density outweighs that of heterogeneity, the reduction in SR that is produced by an increase in heterogeneity will be lower when density is high; this explains the decelerative shape of the point cloud in Figure 5.
- 6.37
- The influence of the structural properties of a network can be explained by the different probabilities of cooperation of agents with different nodal degrees. However, we still need to make explicit why agents with different nodal degrees have different probabilities of cooperation.
Table 5: Number of decisions depending on agents' node degree (k) and the situation at the moment of decision, for 8 selected networks. k Situation Defect Cooperate Total % row % col. % row % col. % row % col. 1 Situation 3 100% 100% 100% 100% Total 100% 100% 100% 100% 2 Situation 2 100% 8.7% 100% 2.9% Situation 3 68.7% 100% 31.3% 91.3% 100% 97.1% Total 66.7% 100% 33.3% 100% 100% 100% 3 Situation 1 100% 1.9% 100% 100% Situation 2 100% 17.6% 100% 8.6% Situation 3 55.3% 98.1% 44.7% 82.4% 100% 90.4% Total 50.9% 100% 49.1% 100% 100% 100% 4 Situation 1 100% 4.8% 100% 2.1% Situation 2 100% 17.7% 100% 9.9% Situation 3 46.5% 90.1% 53.5% 82.3% 100% 85.7% Situation 4 100% 5.1% 100% 2.3% Total 44.3% 100% 55.7% 100% 100% 100% 5 Situation 1 100% 15.5% 100% 7.2% Situation 2 100% 25.6% 100% 13.7% Situation 3 45.6% 71.6% 54.4% 74.4% 100% 73.1% Situation 4 100% 100% 100% 4.7% Situation 5 100% 2.8% 100% 1.3% Total 46.6% 100% 53.4% 100% 100% 100% 6 Situation 1 100% 6.6% 100% 3.9% Situation 2 100% 10.3% 100% 4.2% Situation 3 46.1% 48.8% 53.9% 82.3% 100% 62.5% Situation 4 81.1% 21.9% 18.9% 7.4% 100% 16,0% Situation 5 100% 22.7% 100% 13.4% Total 59.1% 100% 40.9% 100% 100% 100% Note: A set of 8 selected networks consisting of 7 members with one decision each per round and 5000 rounds involves a total of 280000 choices. Each of these decisions (a) has occurred in one of the 5 decision situations and (b) has been to co-operate or not to co-operate. The table displays both the row and column percentage cross-distribution of 280000 decisions, accounting for the two variables and controlling by 6 levels of agents' node degree (k). - 6.38
- Table 5 presents behavioural differences as a function of agents' node degree (k). In the case of agents with ki =1, the effective cooperation trigger is not activated because m=3. Pioneering and speculative cooperation will not be triggered either, since for these agents B and C only have values 0 or 1 and no combination of these values leads to a criticality calculus favourable to cooperation. Table 5 shows that agents with ki=1 are always in the same situation and decide in favour of defection. Given the large number of agents about whom they have no information, agents consider the probability of their contribution being critical to be very low.
- 6.39
- For agents with ki>1 the range of possible situations is broader, which favours cooperation in some cases. For example, agents with ki=2 who face Situation 3 do not always defect, as agents with ki=1 do. In fact, the combinations B=2 & C=1 and B=2 & C=0 favour cooperation, while combinations B=1 & C=1, B=1 & C=0 and B=0 & C=0 lead to defection. This explains why agents with ki=2 in Situation 3 co-operate only in some cases (Table 5). However, agents with this nodal degree may also face Situation 2, in which the agent believes that only one contribution is needed to reach the provision point and cooperation is the rational decision. In other words, agents with ki=2 face a situation where both speculative cooperation –when the combinations of B and C hold– and effective cooperation can be triggered –when the number of previous cooperations is 2, that is m-1. An increase in the nodal degree produces a broader range of possible situations that the agent faces, some of which favour cooperation.
- 6.40
- However, the case of ki=6 is an exception. Figure 7 shows that the probability of cooperation decreases for these agents. Table 5 suggests that this reduction is explained by the relation between a higher ki and an increased proportion of occasions in which agents face Situation 4 (C=m-n+B). With our parameters this situation is produced when C=B-4. This occurs in three situations: with C=0 & B=4, with C=1 & B=5, and with C=2 & B=6. An agent with ki=4 faces only one of these situations (C=0 & B=4). Agents with ki=5 and ki=6 face situations C=0 & B=4 and C=1 & B=5, but the latter has a higher probability of encountering a combination C=1 & B=5 because she has more neighbours. Defection is chosen in all these combinations of C and B. As long as the majority of possible combinations of C and B in Situation 4 lead to defection, a higher ki increases the relative weight of these combinations in these situations.
- 6.41
- In short, agents that are linked in a way that allows them to obtain significant information about other agents' behaviour are aware of the low probability that the provision point will be reached, and therefore decide not to contribute. On the other hand, the lack of information that characterises the less connected networks favours speculative contributions. When ki=6 is reached the possibility for triggering speculative cooperation decreases. Paradoxically, in this case we found that constraining the level of information generates larger social benefits –as Elster claims ( 1979, 2000) –, and these mechanisms could be examined at a detailed level by means of computational simulation.
Conclusions and Further Work
- 7.1
- We conclude this paper by highlighting several results that we consider especially relevant. Our simulation bears witness to the explanatory power of the structural properties of a social system. Rational agents with an identical decision algorithm can generate very different social outcomes depending on the relational structure in which they are embedded.
- 7.2
- The topology or structure of a social network is not the only relevant factor; the decision sequence ordering is also essential. An important aspect of the decision is the quantity of information available to the agent at the moment of decision, and in a social network this variable depends on the nodal degree of the agent and on the sequence position of her decision. These issues can be addressed through the analysis of dynamic networks, through observation or simulation.
- 7.3
- We tend to think that the lower the required effort level, the higher the probability for a public good to be produced. However, our research suggests that, in some cases, institutional designers should balance the effort level; not too high to discourage, nor too low to stimulate a defection grounded on the confidence that others will bear the cost.
- 7.4
- The results of our simulation runs also suggest that both high and low confidence about other agents' cooperation can have a negative effect on the probability of success of a collective action. Intermediate levels of confidence seem to stimulate more cooperation because they support the agent's belief that her contribution is relevant.
- 7.5
- Social groups with a dense structure have a higher probability of success in the production of step-level public goods because neighbours provide useful information about the relevance of the agent's contribution. However, if the links are costly, the highest number of links does not necessarily make a more cohesive group: from a certain degree of density onwards, the probabilities of success in collective action do not change significantly.
- 7.6
- Groups with a horizontal structure have a higher probability of success in the production of step-level public goods. Poorly connected agents have little useful information about the relevance of their decision, while well-connected agents may have an excess of information such that they may be aware of difficulties that cannot be perceived from other positions. A limitation of information stimulates agents to co-operate because they ignore certain difficulties, therefore generating a socially optimal aggregate effect. In other words, more information for an individual does not always generate a better result for the group. This conclusion is in line with recent findings according to which limited information, cognitive or social, can favour the evolution of cooperation; for example, Horváth et al. (2012) have shown how the number of rounds remembered by an iterated game agent does not monotonically increase the likelihood of reaching a co-operative state.
- 7.7
- The same agents that fail to produce the public good in a simultaneous or cumulative decision sequence ordering could succeed when they are situated in certain networks, with relevant implications for institutional design and formulation of more effective social policy alternatives.
- 7.8
- Once we have proceeded with the computational replication of previous laboratory experiments, our next goal is to extend the model and the study with further ABM possibilities. For instance, in future versions of NetCommons we plan to include a new agent heterogeneity assumption regarding expectations of others' behaviour; to overcome the hypothesis of homogeneity we focus on certain network topology types and we introduce network size as a parameter under scrutiny.
Acknowledgements
- This work has benefited from a MICINN R&D project grant (reference number CSO2009-09890), from a MINECO R&D project grant (reference number CSO2012-31401) and from a CONSOLIDER-INGENIO 2010 project grant (reference number CSD 2010-00034). Part of this research has been carried out during a research stay of F. León's at the Equality Studies Centre, University College Dublin.
Notes
-
1 Among the continuous functions there are also important differences between accelerating, decelerating and linear functions (Heckathorn 1996;Linares 2007).
2 Taylor (1987) writes that when we are interested in the construction of a bridge, more money does not imply more bridges. However, extra contributions can be dedicated to making a better bridge (use of superior materials or better designs) In this case, we would have a "mixed" form public good, in which the first part takes the form of a SLG followed by a continuous function once the provision point is reached. In experimental terms, this has been made concrete in different "rebate rules" (Marks and Croson 1998).
3 Taylor has argued (1987: 46) that lumpy goods are often best modelled by the Chicken Game: depending on the expectations regarding the contributions of other gamers, cooperation may be the preferred option for a rational maximizing utility agent.
4 Some models have demonstrated the positive effect on cooperation of heterogeneity with regard to decisions about how much to invest (see, e.g.,Cao et al. 2010; Santos et al. 2008). In our model, however, and for reasons of outcome tractability, all agents have the same endowment and face a binary decision (fully contribute it or not to the common pool).
5 According to the formalisation of our model, the same distribution of values of p between agents of a given network would entail different outcomes depending on which values of p are associated with agents having different nodal degrees. Incorporating the assumption of heterogeneity will exponentially increase the number of combinations necessary to obtain a realistic assessment of its impact on the success rate. Considering also that our ultimate goal is to test the relevance of the structural properties of the network, and that as discussed below we will work with a catalogue of 230 networks, it seems reasonable to choose the hypothesis of homogeneity to assure the analytical tractability of the model outputs.
6 Regarding the latter, this situation is strategically equivalent to a simultaneous decision.
7 In NetCommons this sixth situation has been subsumed in Situation 4, because in decisional terms the result is the same.
8 Comparing the "sequential protocol" ordering and our network-dependent sequence ordering is beyond the scope of this paper. In sequential protocol ordering there is no necessity for a p parameter, because agents know which information others have at the moment of their decision.
9 To gain access to the full catalogue of networks used as input, please contact the authors directly.
References
-
ABELE, S. & Ehrhart, K.M. (2005). The timing effect in public goods games. Journal of Experimental Social Psychology, 41, 470–481. [doi:10.1016/j.jesp.2004.09.004]
BONACICH, P. (1990). Communication Dilemmas in Social Networks: An Experimental Study. American Sociological Review, 55(3), 448–459. [doi:10.2307/2095768]
BRAMOULLÉ , Y. & Kranton, R. (2007). Public goods in networks. Journal of Economic Theory, 135, 478–494. [doi:10.1016/j.jet.2006.06.006]
BRAVO, G. (2008). Imitation and cooperation in Different Helping Games. Journal of Artificial Societies and Social Simulation 11(1), 8 https://www.jasss.org/11/1/8.html.
BRAVO, G., Squazzoni, F. and Boero, R. (2012). Trust and partner selection in social networks: an experimentally grounded model. Social Networks, 34, 481–492. [doi:10.1016/j.socnet.2012.03.001]
BUDESCU, D.V., Wing Tung, A. and Chen, X.P. (1997). Effects of protocol of play and social orientation on behavior in sequential resource dilemmas. Organisational behavior and human decision processes, 69(3), 179–193. [doi:10.1006/obhd.1997.2684]
CAO, X., Du, W. and Rong, Z. (2010). The evolutionary public goods game on scale-free networks with heterogeneous investment, Physica A, 389, 1273–1280. [doi:10.1016/j.physa.2009.11.044]
CÁRDENAS, J. C. & Jaramillo, C. R. (2009). cooperation in large networks: an experimental approach. http://wwwprof.uniandes.edu.co/~chjarami/ cardenas_jaramillo_cooperation_in_large_networks_CEDE200706_20070430.pdf. Archived at http://www.webcitation.org/67w5FhNia.
CHWE, M.S.Y. (1999). Structure and strategy in collective action. American Journal of Sociology, 105(1), 128–156. [doi:10.1086/210269]
ELSTER, J. (1979). Ulysses and the Sirens: Studies in rationality and irrationality. Cambridge [Eng.]; New York: Cambridge University Press.
ELSTER, J. (2000). Ulysses unbound: Studies in rationality, precommitment, and constraints. Cambridge; New York: Cambridge University Press. [doi:10.1017/CBO9780511625008]
EREV, I. & Rapoport, A. (1990). Provision of step-level public goods. The sequential contribution mechanism. Journal of Conflict Resolution, 34(3), 401–425. [doi:10.1177/0022002790034003002]
FOWLER, J. H. & Christakis, N. (2010). co-operative behavior cascades in human social networks, PNAS, 107(12), 5334–5338. [doi:10.1073/pnas.0913149107]
FU, F., Liu, L.-H. and Wang, L. (2007). Evolutionary Prisoner's Dilemma on heterogeneous Newman-Watts small-world network, Eur. Phys. J. B, 56, 367–372. [doi:10.1140/epjb/e2007-00124-5]
GOULD, R.V. (1993) Collective Action and Network Structure. American Sociological Review, 58(2), 182–196. [doi:10.2307/2095965]
GOULD, R.V., (2003). Why do networks matter? Rationalist and structuralist interpretations. In M. Diani & D. McAdam (Eds.), Social Movements and Networks (pp. 233-257). Oxford University Press. [doi:10.1093/0199251789.003.0010]
HARDIN, R. (1982). Collective action. Baltimore: Johns Hopkins University Press.
HECKATHORN, D. D. (1996). The dynamics and dilemmas of collective action. American Sociological Review, 61(2), 250–277. [doi:10.2307/2096334]
HEDSTRÖM, P. & Swedberg, R. (1996). Social Mechanisms, Acta Sociologica, 39, 281–308. [doi:10.1177/000169939603900302]
HEDSTRÖM, P. & Swedberg, R. (eds.) (1998). Social Mechanisms: An Analytical Approach to Social Theory. Cambridge, Cambridge University Press. [doi:10.1017/cbo9780511663901]
HORVATH, G., Kovárík, J. and Mengel, F. (2012). Limited memory can be beneficial for the evolution of cooperation. Journal of Theoretical Biology, 300, 93–205.
KERR, N. (1989). Illusions of efficacy: the effects of group size on perceived efficacy in social dilemmas. Journal of experimental social psychology, 25(4), 287–313. [doi:10.1016/0022-1031(89)90024-3]
KNIGGE, A. & Buskens, V. (2010). Coordination and cooperation problems in network good production. Games, 1, 357–380. [doi:10.3390/g1040357]
KOLLOCK, P. (1998). Social dilemmas: the anatomy of cooperation. Annual review of sociology, 24, 183–214. [doi:10.1146/annurev.soc.24.1.183]
KOMORITA, S. S. & Parks, C. D. (1995). Interpersonal relations: mixed-motive interaction. Annual review of psychology, 46, 183–207. [doi:10.1146/annurev.ps.46.020195.001151]
KOSFELD M. (2004). Economic Networks in the Laboratory: A Survey. Review of Network Economics, 3(1), Berkeley Electronic Press. [doi:10.2202/1446-9022.1041]
LEDYARD, J. O. (1995). Public goods: a survey of experimental research. In J. Kagel & A. E. Roth (Eds.). The handbook of experimental economics. Princeton: Princeton University Press.
LEÓN, F. J. (2010). La lógica de la acción colectiva en la producción de bienes públicos escalares. Papers. Revista de sociología, 95(2), 363–387.
LINARES, F. (2007). El problema de la emergencia de normas sociales en la acción colectiva: Una aproximación analítica. Revista Internacional de Sociología, 46, 131–160.
MARKS, M. & Croson, R. (1998). Alternative rebate rules in the provision of a threshold public good: An experimental investigation. Journal of Public Economics, 67, 195–220. [doi:10.1016/S0047-2727(97)00067-4]
MARWELL, G. & Ames, R.E. (1980). Experiments on the provision of public goods. II. Provision points, stakes, experience, and the free-rider problem. American journal of sociology, 85(4), 926–937. [doi:10.1086/227094]
MARWELL, G. & Oliver, P. (1993). The critical mass in collective action. A micro-social theory. Cambridge: Cambridge University Press. [doi:10.1017/CBO9780511663765]
MARWELL, G., Pamela, E. and Prahl, R. (1988) Social networks and collective action: a theory of the critical mass. American Journal of Sociology, 94, 502–534. [doi:10.1086/229028]
MORENO, J. L. (1951). Sociometry, Experimental Method and the Science of Society. An Approach to a New Political Orientation. Beacon House, Beacon, New York.
MIGUEL, F. J. (2011). NetCommons (code). Archived at: http://www.webcitation.org/67w5ftehr.
OBERSCHALL, A. (1973). Social conflict and social movements. Englewood Cliffs, Prentice-Hall.
OLSON, M. (1965). The logic of collective action. Cambridge, MA: Harvard University Press.
PUJOL, J. M., Flache, A., Delgado, J. and Sangüesa, R. (2005). How can social networks ever become complex? Modelling the emergence of complex networks from local social exchanges. Journal of Artificial Societies and Social Simulation, 8(4), https://www.jasss.org/8/4/12.html.
RAPOPORT, A. (1985). Provision of public goods and the MCS experimental paradigm. American Political Science Review, 79(1), 148–155. [doi:10.2307/1956124]
RAPOPORT, A. (1987). Research paradigms, and expected utility models for the provision of step-level public goods. Psychological Review, 94, 74–83. [doi:10.1037/0033-295X.94.1.74]
RAPOPORT, A. (1988). Provision of step-level public goods: Effects of inequality in resources. Journal of Personality and Social Psychology, 45, 432–440. [doi:10.1037/0022-3514.54.3.432]
RAPOPORT, A. (1993). Incremental contribution in step-level public goods games with asymmetric players. Organisational behavior and human decision processes, 55, 171–194. [doi:10.1006/obhd.1993.1029]
SANTOS, F. C., Santos, M. and Pacheco, J. M. (2008). Social diversity promotes the emergence of co-operative behavior. Nature, 454, 213-216. [doi:10.1038/nature06940]
SCOTT, J. (2005). Social network analysis: A handbook. London: Sage.
SKYRMS, B. & Pemantle, R. (2000). A dynamic model of social network formation. PNAS, 97(16), 9340–9346. [doi:10.1073/pnas.97.16.9340]
SONNEMANS, J., van Dijk, F. and van Winden. F. (2006). On the dynamics of social ties structures in groups. Journal of economic psychology, 27, 187–204. [doi:10.1016/j.joep.2005.08.004]
SURI, S. & Watts, D. J. (2011). cooperation and contagion in web-based, networked public goods experiments, PLoS ONE, 6(3), 1–18. [doi:10.1371/journal.pone.0016836]
SUTCLIFFE, A., Wang, D. and Dunbar, R. (2012). Social relationships and the emergence of social networks. Journal of Artificial Societies and Social Simulation, 15(4), 3, https://www.jasss.org/15/4/3.html.
TAKÁCS, K., Janky, B. and Flache, A. (2008). Collective action and network change, Social Networks, 30, 177–189. [doi:10.1016/j.socnet.2008.02.003]
TAYLOR, M. (1987). The possibility of cooperation. Cambridge: Cambridge University Press.
TAYLOR, M. & Ward, H. (1982). Chickens, whales and lumpy goods: alternative models of public-goods provision. Political studies, 30, 350–370. [doi:10.1111/j.1467-9248.1982.tb00545.x]
TILLY, Ch. (1978). From mobilisation to revolution. Reading: Addison-Wesley.
TSUKAMOTO, E. & Shirayama, S. (2010). Influence of the variance of degree distributions on the evolution of cooperation in complex networks, Physica A, 389, 577–586. [doi:10.1016/j.physa.2009.10.002]
VAN DE KRAGT, A. J. C., Orbell, J. M. and Dawes, R. M. (1983). The Minimal Contributing Set as a solution to public goods problems. The American political science review, 77(1), 112–122. [doi:10.2307/1956014]
YANG, H., Wu, Z. and Du, W. (2012). Evolutionary games on scale-free networks with tunable degree distribution. EPL, 99, 10006. [doi:10.1209/0295-5075/99/10006]
YE, H., Tan, F., Ding, M., Jia, Y. and Chen, Y. (2011). Sympathy and Punishment: Evolution of cooperation in Public Goods Game. Journal of Artificial Societies and Social Simulation, 14(4), 20 <https://www.jasss.org/14/4/20.html>.
ZSCHACHE, J. (2012). Producing public goods in networks: Some effects of social comparison and endogenous network change. Social Networks, 34, 539–548. [doi:10.1016/j.socnet.2012.05.003]