© Copyright JASSS

JASSS logo ----

Wim Westera (2007)

Peer-Allocated Instant Response (PAIR): Computational Allocation of Peer Tutors in Learning Communities

Journal of Artificial Societies and Social Simulation vol. 10, no. 2, 5
<https://www.jasss.org/10/2/5.html>

For information about citing this article, click here

Received: 02-Jan-2007    Accepted: 24-Feb-2007    Published: 31-Mar-2007

PDF version


* Abstract

This paper proposes a computational model for the allocation of fleeting peer tutors in a community of learners: a student's call for support is evaluated by the model in order to allocate the most appropriate peer tutor. Various authors have suggested peer tutoring as a favourable approach for confining the ever-growing workloads of teachers and tutors in online learning environments. The model's starting point is to serve two conflicting requirements: 1) the allocated peers should have sufficient knowledge to guarantee high quality support and 2) tutoring workload of peers should be fairly distributed over the student population. While the first criterion is likely to saddle a small number of very bright students with all the tutoring workload, the unconditional pursuit of a uniform workload distribution over the students is likely to allocate incompetent tutors. In both cases the peer support mechanism is doomed to failure. The paper identifies relevant variables and elaborates an allocation procedure that combines various filter types. The functioning of the allocation procedure is tested through a computer simulation program that has been developed to represent the student population, the students curriculum and the dynamics of tutor allocation. The current study demonstrates the feasibility of the self-allocating peer tutoring mechanism. The proposed model is sufficiently stable within a wide range of conditions. By introducing an overload tolerance parameter which stretches the fair workload distribution criteria, substantial improvements of the allocation success rate are effected. It is demonstrated that the allocation algorithm works best at large population sizes. The results show that the type of curriculum (collective route or individualised routes) has only little influence on the allocation mechanism.

Keywords:
Distance Learning, Computational Simulations, System Dynamics, Education and Application, Peer Support, Peer Allocation

* Introduction

1.1
Electronic learning environments are appreciated for their flexible and immediate access to various resources and services. Besides the availability of appropriate learning materials students' expectations comprise high quality, quick and personalised support through direct communication with their teachers. Frequent one-to-one communication with students, however, strongly raises the workloads of tutors and teachers or, alternatively, is likely to erode the support of learners. The teachers' workload is also amplified by current constructivist pedagogies (Brown 1989; Gergen 1995; Westera 2001) that suggests complex, open learning tasks requiring intensive, tailored tutoring rather than standardised support. This paper addresses this problem by developing a computational model for the arrangement of instant, tailored peer support in a community of learners. The proposed model is called the PAIR model, which refers to "Peer-Allocated Instant Response". Several authors report that peer tutoring indeed has positive effects on motivation, reflection, self-esteem and commitment (Fantuzzo 1989; Anderson 2000). A number of researchers found peer tutoring to produce higher learning outcomes (Fantuzzo 1989; Gyanani 1995; King 1998; Wong 2003). The proposed model comprises a sensible mechanism to link students who ask for support directly to the most appropriate fellow students that may provide the support. The PAIR-model thereby aims to contribute to preserving appropriate and affordable online tutoring services within a population of students.

Educational context

1.2
The PAIR-initiative, aiming at a mechanism for the allocation of remote peer tutors, was launched by the Open University of the Netherlands in 2006 and was supported by Fontys University (Eindhoven) and SURF, the national organisation in the Netherlands that co-ordinates ICT in higher education. The Open University of the Netherlands provides study programmes in higher distance education. Students are lifelong learners that study primarily at home, using learning tasks and self-instructive materials that are increasingly distributed through the internet. The population of learners is quite heterogeneous: students are very different with respect to their individual ambitions, age, motives, prior knowledge, study tempo and the moment of studying. The learning at the Open University of the Netherlands is highly individualised and students are assumed to be largely responsible for their own learning process, be it that support is available when necessary to warrant effective learning and sufficient learning progress. Face to face contacts between students are very rare, because of the context of distance education. Occasionally, computer-supported collaborative work is provided in order to train teamwork; also, virtual communities of learners are supported in various domains. Yet, the learning remains quite independent and distributed and the learners are highly empowered to decide upon their own learning strategies. Within this distributed learning context students may often ask for some support through the internet when they encounter problems that they cannot solve themselves. This is when normally teachers should be available to provide help. But at large communities of learners this consequently tends to increase the teachers' workloads to unworkable and unacceptable levels. This problem is not only apparent in distance education but also at regular universities that increasingly apply blended learning modalities with online support. In fact, the workload problem is a self-generated flaw of online education: easy online access overloads the system of online support. The PAIR-model intends to counteract this flaw.

Positioning of the PAIR-approach

1.3
Rather than letting learners post their request in forums or shared workspaces, the PAIR model opts for self-organised peer tutor allocation. When a learner asks for assistance, the PAIR model selects the most appropriate peer candidate from the student population: the model creates fleeting "pairs" of students by taking into account the nature of the request and the expertise and past performance of peer candidates. Such mechanism would be highly self-regulating and would reduce the teachers' workloads. In contrast with common user groups or forums, where students would have to make a public call for support, the active allocation of peer tutors suggests a number of advantages:

1.4
The computational model rests on straightforward logging data of current and past activities of learners. It does not include the semantics of the calls for support, for instance by using technologies like latent semantic analysis (Van Bruggen 2004; Van Rosmalen 2005), in order to arrive at the best peer tutor. The generality of the model, however, doesn't obstruct the use of semantic tools per se. Rather than applying ontologies for the representation of the domains and teaching strategies to traverse the domains, this first version of the PAIR-model uses only simple navigational data to decide whether a particular peer should be selected to address a particular call for support, or not. In fact, while a course or a curriculum is assumed the consist of a well-defined set of learning tasks, chapters, exercises, modules or other components, the PAIR model only takes into account at which component a student is located in the curriculum and what components the student has completed already, without going into the domain knowledge or the contents of the components. This reduces the model's complexity substantially. Also, for reasons of simplicity, the PAIR-model will not go into the nature (social, pedagogical, domain-related, etc.) and quality of the peer tutoring. Quality assurance is an important issue though. This will be covered in field experiments with real student populations by allowing students to rate and annotate the significance of each support event. By feeding back such quality data to the allocation algorithm a self-regulating social networking community emerges that corrects for low quality support. Field experiments in real student populations of the Open University of the Netherlands and Fontys University are anticipated in fall 2007. These field experiments are beyond the scope of this paper.

1.5
For two important reasons the PAIR-model has been implemented in a simulation program: The first reason is risk management: the intended arrangement of field experiments with hundreds of students requires sufficient a priori evidence for the viability of the approach. If the allocation mechanism would fail, break down or show severe biases during the field experiment, large groups of students would be let down and the project would strand. The simulation program has been used to investigate the model's efficacy and stability under various conditions. In particular, the simulation has been used for identifying the relevant system parameters and for investigating the effects of population size, learning module grain size, filtering conditions and curriculum structure on the allocation success rate and the distribution of workload over students. The second reason is methodological in kind: simulation routines have been used from the start to build the model following a rapid prototyping approach. While applying short iteration cycles new ideas could be checked in preliminary tests and eventually be adopted, elaborated or removed from the model. This approach has warranted convergence to a stable and reliable allocation mechanism.

* General model description

Starting points

2.1
We will consider a (fixed) population of students that are individually working on a number of domain tasks (learning modules, assignments, domain nodes or learning units) that make up the curriculum. It is assumed that individual learning routes and progress of students are logged by the system, that is, each time a student completes a learning module and starts with a new one the learner positioning data are updated. When a student posts a call for support, an event record is created that contains the relevant data of the call. These include the name of the calling student, the time of the call, the type of the call, the allocated peer tutor, the time of call completion and quality judgements about the provided support. The quality judgement may cover various dimensions of the support (response time, involvement, communication, effectiveness, reliability and the like).

System parameters

2.2
The domain is assumed to contain a number of domain components (modules) that may be combined in various curriculum routes. Each of the modules is described by: The individual characteristics of each student are described by

System dynamics

2.3
Students that are working on their module may experience problems and may decide to ask for support. Such a request triggers a process that comprises several stages, which will be described below.
Event trigger

2.4
In a real population students will post their calls at will. Exclusion rules may be necessary to prevent that one and the same student would create an avalanche of requests. For example: a pending request of a student would prohibit a new request of the same student. Also, students that fail to post requests may be stimulated to participate.
The call

2.5
At the launch of a request a new event record is created that logs the relevant data. The requesting student has to articulate and classify the request. Several variables are defined to describe the support event. These include location, time and type of the request.
Communication

2.6
When the allocation has been established (see below) a communication session will start between the requester and the allocated tutor to sort out the problem. Contents of the communication may be recorded.
Feedback

2.7
When the duo has decided to terminate the dialogue, both will assess the helpfulness of the dialogue in order to provide feedback to the system. Such feedback may be needed as input in the allocation algorithm and is necessary for monitoring the support quality and the student's satisfaction with the support. One might also want to check if allocated tutors indeed provide any support (response times).
Tutor allocation

2.8
An allocation algorithm will be running in order to select the most appropriate peer tutor from the population. Various status data will be retrieved from the system to feed the algorithm. The allocation algorithm is assumed to meet the criteria in two separate dimensions:
  1. Quality: Select a competent tutor. The peer tutoring system would fail when incapable tutors are assigned.
  2. Economy: Achieve a fair workload distribution. The peer tutoring system would fail when only the sub group of highly qualified students are involved as a tutor.

* The tutor allocation algorithm

3.1
Obviously, the quality criterion and the economy criterion may conflict. Indeed, the unrestricted allocation of the most competent tutors would probably saddle a small number of very bright students with all the tutoring workload. Gradually, this group is likely to display obstruction or omission. In contrast, the unconditional pursuit of a uniform workload distribution over the students is likely to allocate incompetent tutors. In both cases the peer support mechanism is doomed to failure.

Filter transmission rate and filter performance

3.2
In order to be successful the allocation algorithm should serve both criteria to the same extent. To express the balance between these two filter types we introduce the transmission rate T of a filter which selects Nout items out of Nin by:

T = Nout/Nin (1)

In order to ideally produce one tutor out of a cohort of n students, the transmission rate of the allocation filter would be 1/n. While the allocation algorithm rests on two separate filter types, subsequently the quality filter and the economy filter, a balanced filtering mechanism would assign each filter an equal transmission rate of 1/√ n.

3.3
To assess the performance of each filter as compared to this preferred reference value, we would need an mathematical expression to describe deviations from this value. For instance, one might want to determine whether the transmission of 5 students out of 64 reflects a better filtering performance than the transmission of say 12 students out of 64. Because of the asymmetric position of √n at the interval [0, n], linear solutions are not appropriate. For this purpose we treat the filtering mechanism as a statistical trial following the binomial process of being transmitted by the filter or rejected. Sample size is assumed to correspond with the number of candidates n, the number of positive outcomes reflects the number of transmitted students and the chance of a positive outcome is set to the reference value 1/√n. Application of the associated binomial distribution enables us to assign performance values to the various outcomes. Although this statistical procedure essentially does not per se describe the functioning of a particular filter it provides an indicator of a filter's performance as compared to the reference filter.

Figure
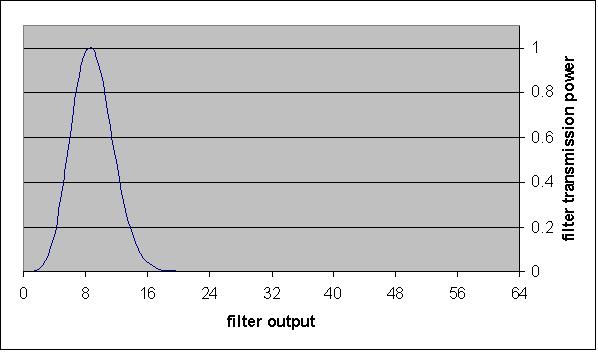
Figure 1. Primary filtering power as a function of transmission, in case of two serial filters (n=64)

3.4
Figure 1 displays the filter performance curve for n = 64. For example, it assigns a performance score of 1.0 if 8 students pass the filter (which indeed corresponds with the reference value 1/√n (cf. 8/64 = 1/√64); transmitting 5 students produces a performance score of 0.59, transmitting 12 students produces a performance of 0.31. Below, we will first specify different types of allocation filters and subsequently describe how these can be combined in a sensible and substantiated way.

Quality filters

3.5
Various quality filters can be designed in order to select the most appropriate candidates out of the student population.
Proximity filter: a problem-sharing pedagogy

3.6
This filter would select all students i that are currently working on the same module m as the requesting student. A matching score may be defined by accounting for the time each student already has been working on the module:

Score(i) = (t - t0(i,m) + 1) / (t - min(t0(i,m)) + 1) (2)

where

t
is the actual time of the call for support,
t0(i,m)
is the time that student i has started working on module m.
The variable Score(i) would indicate the degree of expertise student i has already acquired in module m. The denominator assures a mapping of the score into the interval [0,1]. A cutting score of the filter may be defined by the transmission rate of 1/√n. That is, the filter is applied while decrementing the variable (t - t0(i,m)) until the number of selected candidates approximates the desired cross-over value (√n).
Completion filter: a problem-solving pedagogy

3.7
This alternative procedure selects recent completers of the relevant module. That is, the selected peer candidates have mastered the module and thus may be assumed to have acquired the relevant expertise. While recency assures the freshness or applicability of the expertise a matching score may be defined by:

Score(i)= tc(i,m) / t (3)

where

tc
is the time of completion.
Just like the proximity filter, the value of Score(i) is in the interval [0,1]. Note that the completion filter and the proximity filter are mutually exclusive: the proximity filter selects students that are working on the same module, while the completion filter finds students that have completed the module already. Again, a cutting score may be defined by the desired transmission rate of 1/√n.

Economy filters

3.8
Two distinct types of economy filter will be described.
Favour in return: the direct-benefit principle

3.9
This filter holds that support activities are allocated to frequent callers for support, as to let them "pay" for previous benefits. Such a mechanism would discourage students to post many futile calls for support and thus would reduce the number of plain "profiteers". Likewise, students that seldom call for support themselves have to be protected from calls by other students. In principle, one might choose the number of tutoring activities for each student to never exceed the number of calls for support. To allow some flexibility in the system, we introduce the overload tolerance Of, which indicates how much the number of tutoring acts of each student is allowed to outnumber the number of requests. We distinguish two approaches:
Favour in return: absolute overload tolerance

3.10
The overload tolerance is now expressed as an absolute number to indicate the allowed ceiling of the deficit between the number of supports S(i) by student i and the number of calls for help C(i) of student i.

Score(i)= (Of - S(i) + C(i)) / (Of + C(i)) (4)

where

Of
is the absolute overload tolerance
S(i)
is number of supports by student i
C(i)
is the number of calls for help of student i
The variable Score(i) represents the distance to the overload ceiling relative to the maximum allowed distance. Consequently the formula yields scores at [0,1]; it would sink below zero when the overload ceiling is crossed.
Favour in return: relative overload tolerance

3.11
The overload may also be expressed as a percentage of the tutoring load. This would take into account a gradually growing ceiling when the number of tutoring acts increases. To calculate a normalised score equation(4) can be used while replacing Of with Ofr . S(i):

Score(i)= ((Ofr - 1) . S(i) + C(i)) / (Ofr . S(i) + C(i)) (5)

where

Ofr
is overload tolerance relative to the number of tutoring acts.
Uniformity: the solidarity principle

3.12
The uniformity filter selects students with the lowest number of supports acts so far. In contrast with the "favour-in-return" filter it procures that support activities are evenly distributed over the students. As in the case of the favour-in-return model one may define the overload tolerance Ou, which defines the tolerance of deviating from a uniform distribution of tutoring tasks over the students. Similarly to the favour-in-return filters we distinguish an absolute overload method and a relative overload method.
Uniformity: Absolute overload tolerance

3.13
Here the overload tolerance defines how much the number of tutoring acts of student j is allowed to exceed the average of tutoring acts per student. A normalised score of such filter can be expressed as the relative distance to the overload ceiling:

Score(i)= (Ou - S(i) + <S(i)>i) / (Ou + <S(i)>i) (6)

where

Ou
is the overload tolerance, indicating how much the individual student's number of tutoring acts is allowed to exceed the average tutoring load
Uniformity: Relative overload tolerance

3.14
The overload tolerance may also be expressed as a percentage of the tutoring load. This would take into account a gradually growing tolerance when the number of tutoring acts increases. To calculate a normalised score the previous formula can be used while replacing Ou with Our.S(i):

Score(i)= ((Our -1) . S(i) + <S(i)>i) / ((Our + 1) + <S(i)>i) (7)

where

Our
is the relative overload tolerance, indicating the percentage that the individual student's number of tutoring acts is allowed to exceed the average tutoring load.

Allocation through a balanced combination of filter types

3.15
Each of the filter types described above, however, may fail by either lacking transmission power (<<√n) or by a transmission overshoot (>>√n). For instance, the completion filter may fail at the start of a run, because none of the students will have completed any modules yet. Or, the proximity filter may fail while at the time none of the other students is working at the relevant module. In both cases alternative filters have to be considered. Below we will define a generic filtering procedure that assures an effective and balanced combination of quality filters and economy filters. The filtering routine is a diverse and integer set of combined quality and economy filters which includes various fall-back routes to produce the most appropriate peer candidate. Figure 2 represents the proposed tutor allocation algorithm

Figure
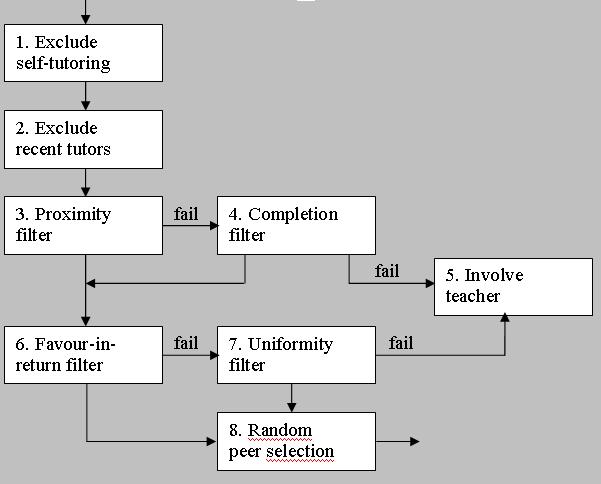
Figure 2. The allocation procedure combining various filter types

3.16
The allocation procedure comprises the following steps:
  1. Exclude self-tutoring
    Naturally, the student that calls for support is excluded from the group of peer candidates. When the total number of students is n, this step produces (n-1) candidates.
  2. Exclude recent tutors
    In order to assure a spread of tutoring activities over time, students that have been deployed recently as a tutor are excluded from the group of peer candidates. The time span that defines the recency, the tutor dead-time, may be varied in order to adjust the overall filter performance. When a number of nr additional students would be excluded by this recency filter, the number of peer candidates reduces to (n - nr -1).
  3. Quality: Proximity filter
    The proximity filter is applied by incrementing the variable (t - t0(i,m)) until the transmission rate T, cf. equation(1), has reached a value of 1/√(n - nr -1). The filter produces a set of candidates which number may vary between 0 and √(n - nr -1). Selected candidates may have different matching scores according to equation(2).
  4. Quality: Completion filter
    If the proximity filter fails to produce any candidates, that is, no other students are working on the relevant module, the completion filter is put in place. The completion filter is applied by decrementing the occurring values of tc(i,m) until the transmission rate T has reached a value of 1/√(n - nr -1). The filter produces a set of candidates which number may vary between 0 and √(n - nr -1). According to equation(3), candidates may have different matching scores.
  5. Quality: Teacher allocation
    When all quality filters fail, that is, no candidates are selected by the previous filters, the tutoring role is forwarded to the teacher. From the objective to produce a self-regulative peer tutoring allocation mechanism it follows that this situation should have little occurrence.
  6. Quality and Economy: Favour-in-return filter
    This filter combines the quality matching scores as defined above with the economy matching score by multiplication to produce a total score for each candidate j. The filter selects students with highest scores. Occasionally, the rank of high-quality candidates may sink because of low economy scores. Also the opposite may occur.
  7. Quality and Economy: Uniformity filter
    If the favour-in-return filter fails, that is, no candidates are left to select a peer tutor, the uniformity filter is put in place. The filter selects students with the highest product of the quality score and the economy score.
  8. Quality and Economy: Random selection filter
    In case the previous filtering steps produce two or more equally qualified candidates the random selection filter finalises the allocation procedure by randomly selecting one candidate.

3.17
This allocation procedure involves 11 different routes. These are specified in table 1 below.

Table 1: Specification of filtering routes

Route IDFILTERSQuality criterionEconomy criterionOutcome
I1-2-3-4-5Completion failsnoneTeacher
II1-2-3-6Proximity succeedsFavour succeeds =1Student
III1-2-3-6-8Proximity succeedsFavour succeeds >1Student
IV1-2-3-6-7Proximity succeedsUniform succeeds =1Student
V1-2-3-6-7-8Proximity succeedsUniform succeeds >1Student
VI1-2-3-6-7-5Proximity succeedsUniform failsTeacher
VII1-2-3-4-6Completion succeedsFavour succeeds =1Student
VIII1-2-3-4-6-8Completion succeedsFavour succeeds >1Student
IX1-2-3-4-6-7Completion succeedsUniform succeeds =1Student
X1-2-3-4-6-7-8Completion succeedsUniform succeeds >1Student
XI1-2-3-4-6-7-5Completion succeedsUniform failsTeacher

* The simulation program

4.1
In order to investigate the sensitivity, efficacy and stability of the allocation model under various conditions a computational simulation has been developed. The model has been implemented in Scilab-4.1 open source software (http://www.scilab.org). The source file and instructions are available at http://www.open.ou.nl/wim/paircode.txt. Graphics have been produced through imports in Excel.

Creating curricula and student populations

4.2
In the simulation, curricula with modules of different size and complexity are defined by generating random trials from a normal distribution. Figure 3 shows a specimen of 20 modules of different size, expressed in units of time (average module size=50; σ =50/3)

Figure
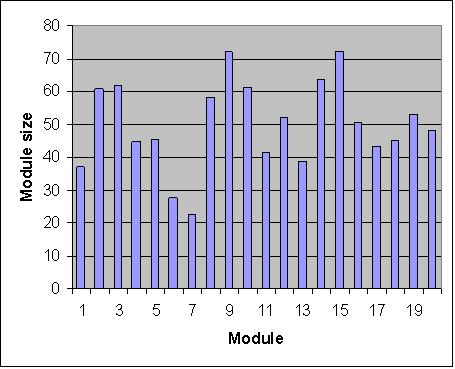
Figure 3. Specimen: module size generated by a random trial from a normal distribution

4.3
Likewise, the complexity of modules is generated. For the student populations various properties have to be predefined: learning capabilities, predisposition for requesting support, time available and prior knowledge. Here also random trials from a normal distribution have been applied. In addition, for each student the calculated overall prior knowledge has been randomly distributed over the modules .

Creating module transitions

4.4
For each student a personalised learning route along the modules is calculated. In a linear curriculum all students share the same route. To decide whether a transition between modules is likely, learning progress of student i in a module m is calculated by:

Progress(i,m) = (t - t0(i,m)) / M1(m) / M2(m) . X1(i) . X2(i) . X3(i) (8)

where

t
is time
t0(i,m)
is the time that student i has started working on module m
M1(m)
is the size of module m
M2(m)
is the complexity of module m
X1(i)
is the speed of learning of student i
X2(i)
is the prior knowledge of student i
X3(i)
is the Time available for student i
Indeed, study progress may assumed to be proportional with time spent and the performance factors describing learning speed, prior performance and time available, and it will be hampered by module size and module complexity. When progress exceeds a threshold value the module is set to the status "completed" and the student is routed to the subsequent module in the personalised learning route.

Creating support requests

4.5
Students working on a learning module may post a call for support anytime, that is, time and time-dependent variables like learning progress are assumed irrelevant. To express the students' urging to post a call for support we use the formula

Eventtrigger(i) = Random[0,1] . X4((i)/ X1(i) / X2(i) (9)

where

X1(i)
is the speed of learning of student i
X2(i)
is the prior knowledge of student i
X4(i)
the predisposition of student i for requesting support
Random[0,1]
is a random generator in the interval [0,1]
By setting a trigger threshold the rate of support requests can be controlled.

Basic parameters

4.6
Basic parameter values for the simulation are given by table 2.

Table 2: Typical values of simulation parameters

Population sizetypically 100
Average module sizetypically 15
Number of modulestypically 20
Evaluation timetypically 200
Average prior knowledge fractiontypically 0.10
Request rate
typically 0.3 requests per student per unit of time
Overload (absolute)typically 0-200
Tutor dead-timetypically 2
Standard deviation of normal distributionstypically 1/3 - 1/6

4.7
Some 500 simulation runs have been carried out. If one unit of time in the model would be equated with 1 hour of study load, the model has simulated some 100.000 hours of study. Runs have been frequently repeated in order to check reproducibility and reduce statistical noise. Spread of aggregate results, while applying typical values of table 2, was always below 3%.

* Results and discussion

5.1
Various filter settings and conditions have been evaluated. Table 3 shows four main allocation types (A, B, C, D) that have been investigated.

Table 3: Overview of investigated allocation types


Allocation typeABCD
Filters
Proximity filtertransmission ceiling (√n)x x
no transmission ceiling x x
Completion filtertransmission ceiling (√n)x x
no transmission ceiling x x
Favour-in-return filterrelative overload tolerance xx
absolute overload tolerancexx
Uniformity filterrelative overload tolerance xx
absolute overload tolerancexx

Allocation success rate against overload tolerance

5.2
Figure 4 shows the allocation success rates for each of the allocation types of table 3. For reasons of simplicity the assigned values of overload tolerance are chosen identical for the Favour-in-return filter and the Uniformity filter. The horizontal scale represents the absolute tolerance; relative overload values (cf. C and D) are converted into absolute values.

Figure
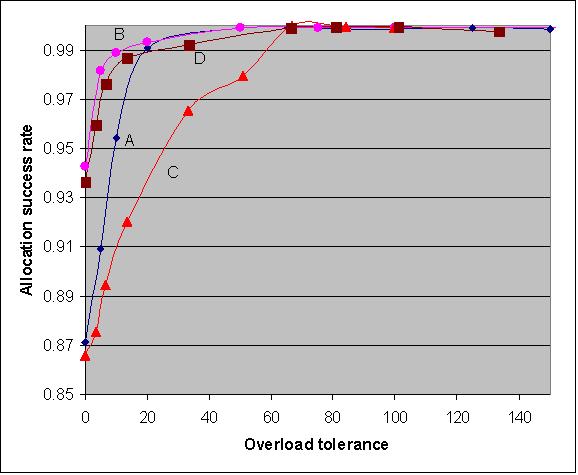
Figure 4. Allocation success rates as a function of overload tolerance (conditions A, B, C and D, n = 100)

5.3
Apparently, the call for an evenly distributed student load or a individual balance between requests and supports (overload tolerance = 0) strongly reduces the number of peer candidates. As a consequence, frequent dead ends occur in the allocation and these oblige to redirect the calls to the teacher, which obviously counteracts the objectives of the peer allocation mechanism. By raising the overload tolerance the success rate of the allocation procedure increases substantially.

5.4
From figure 4 it can be also concluded that the lowest success rates occur at conditions A and C, both featuring a transmission ceiling (√n). By applying a transmission ceiling the quality filter's output is reduced to a maximum of √n candidates of sufficient quality. While this procedure implies the probable exclusion of suitable candidates one may indeed expect a negative effect on the allocation mechanism. When the transmission ceiling is omitted (cf. B and D), it also follows that the success rates rise substantially. By omitting the power ceiling lower quality students become available for the economy filter.

5.5
Also, it turns out that the absolute overload ceiling method (cf. A and B) produces better success rates than the relative method (C and D). This can be explained by the fact that in the case of an absolute method it will take some time before the transmission ceiling is reached and dead ends occur, while in the relative method the transmission ceiling will be low at the start and thus cause the early exclusion of peer candidates. As a consequence the relative method may be expected to cause the teacher load to spread more evenly over time, while the absolute method would progressively show more teacher load. This explanation cannot be confirmed, however. Over a wide range of conditions the distribution of teacher load over time appears to be quite similar for both methods.

Dynamics of the allocation success rate

5.6
Figure 5 shows the instantaneous allocation success rate, that is the number of successful allocations at time t relative to the number of calls at time t. For (absolute) overload = 20 the success rate is always close to one. For lower values of overload, serious problems occur, with success rates occasionally below 50% or even worse. Note that mirroring the curves horizontally (y → 1-y) yields the teacher load as a fraction of total tutoring load.

Figure
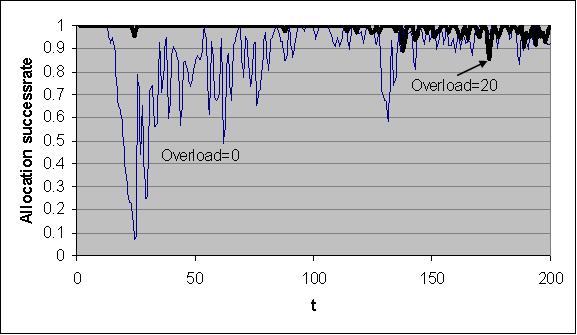
Figure 5. Instantaneous allocation success rates as a function of time (condition A, n=100).

Matching scores

5.7
As for the transmission ceiling (√n) one might conclude that it should be omitted (cf. B and D). However, the drawback of this omission is that many poorly qualified learners are allowed to pass the quality filter and ultimately may be selected to give support. This effect can be read from figure 6, which shows quite lower matching scores when the transmission ceiling are omitted (conditions B and D as compared to conditions A and C, respectively).

Figure
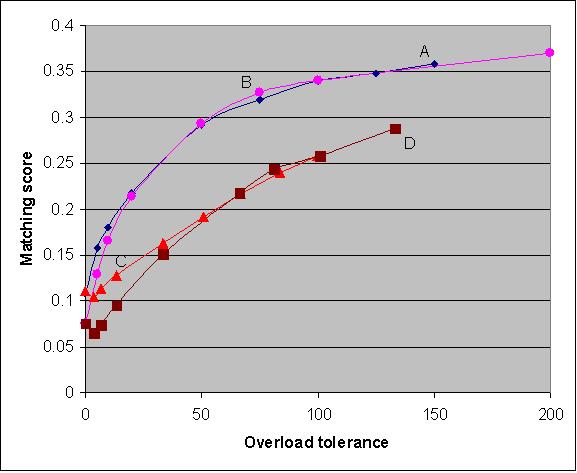
Figure 6. Matching scores as a function of overload tolerance (conditions A, B, C and D, n=100)

For all conditions the matching score increases with higher overloads. Indeed, raising the overload value allows more frequent allocation of the highest scoring tutor candidates. As a consequence the distribution of workload over the students shows larger deviations from uniformity: increasingly only part of the students provide most of the tutoring.

Workload distribution

5.8
Figure 7 displays an example of workload distribution over students. The workload is expressed as a fraction of the average workload.

Figure
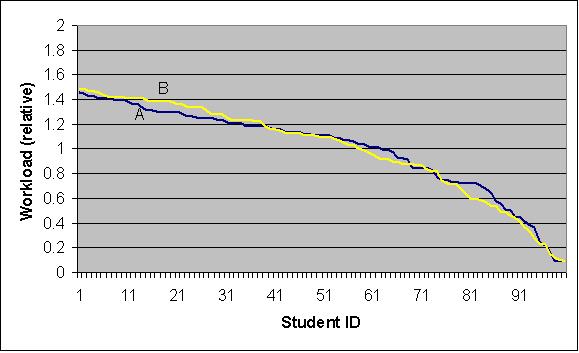
Figure 7. Distribution of workload over students (conditions A and B, n=100)

Conditions A and B show quite similar outcomes. While students will only be involved with one call at the time no accumulation of workload occurs. Also defining a dead time in order to recover from a tutoring activity counteracts accumulation.

5.9
A measure for the spread of peer tutoring load over students is the standard deviation σ. Figure 8 shows how σ changes relative to the average load as a function of overload tolerance.

Figure
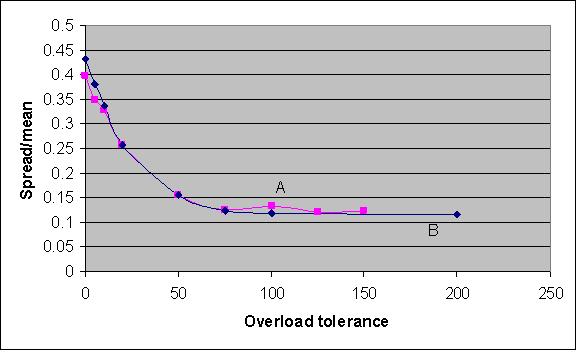
Figure 8. Spread of tutoring load (conditions A and B, n=100)

Note that the curves for condition A and B nearly coincide. Clearly, at increasing overload tolerance the spread decreases, which means that the distribution of workload becomes less uniform. Indeed, at higher values of overload tolerance there are hardly any restrictions for repeatedly selecting the best quality tutors. This is in accordance with the higher matching scores as displayed in figure 6.

The effects of tutoring dead time

5.10
The application of a tutoring dead time, that is the exclusion of candidates for a certain period of time after they have been working on a tutoring task, hampers the allocation procedure and will increase the number of re-directs to the teacher. Naturally, while increasing the dead time, the number of candidates decreases and thus reduces the allocation success rate (figure 9).

Figure
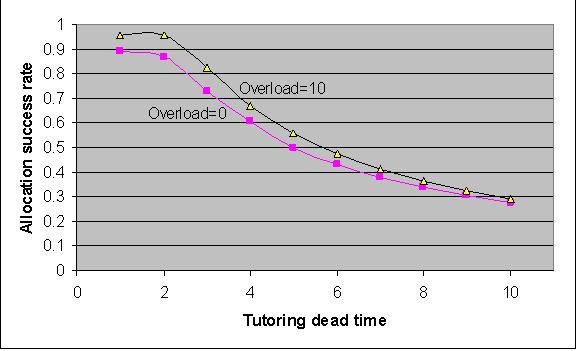
Figure 9. Allocation success rate against tutoring dead time (condition A, n=100)

The effects of population size

5.11
The premise of the model is that an allocation algorithm is needed to create the appropriate match. At low population sizes the same duo's are likely to occur more often, which would make the allocation mechanism superfluous. Figure 10 shows the allocation success rate at different population sizes

Figure
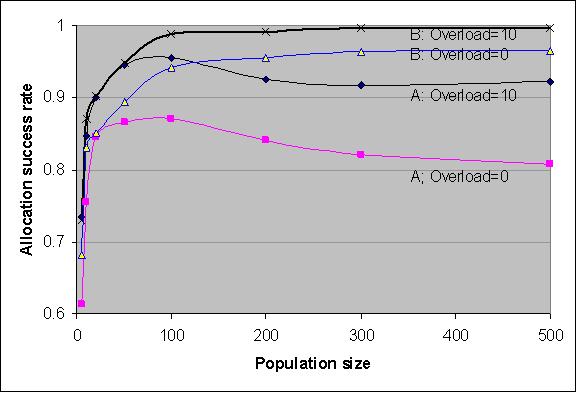
Figure 10. Success rates at various population sizes (condition A and B)

For condition A the allocation success rate shows a peak at moderate population sizes, while it slowly decreases at larger populations. The effect is significant and reproducible. It has has turned out that this effect is due to the cross-over mechanism that restricts the transmission power of the quality filter. Because of the nonlinear nature of the filter transmission ceiling (√n) the quality filter tends to select an increasingly smaller fraction of high quality candidates at larger populations. Indeed, at n=100 the transmission ceiling allows the 10% highest qualified candidates to pass; at n=500 this is reduced to the 4.4% (=1/√500). While these elite candidates are more likely to become eliminated in the economy filter, the cross-over mechanism work adversely. Therefore, at large populations one should be cautious with the cross-over ceiling mechanism. At larger populations omitting the cross-over mechanism produces higher allocation success rates.

Random curricula

5.12
So far, all results refer to a linear sequence of modules that is equal for all students. Similar simulation runs have been carried out with a random curriculum, providing each student with an individual learning path. Figure 11 displays a success rate comparison between a linear and a random curriculum.

Figure
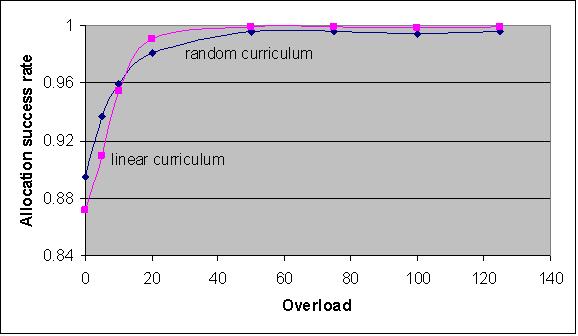
Figure 11. Allocation success rates for a linear and a random curriculum (condition A, n=100)

The results for the various curriculum types coincide within a few percents. Curriculum structure is thus concluded to be of little importance as a determinant.

* Conclusions

6.1
The simulation results support the feasibility of the self-directing peer tutor allocation mechanism. The proposed model is sufficiently stable within a wide range of conditions. For the economy filters to function properly it is necessary to use overload tolerances up to 10 or 20 supports on a total load of 60 - 70 per student; this suggests an overload of about 30%. At lower values of the overload tolerance, the allocation success rates drop dramatically. At higher values the success rate approaches 100%, but the tutoring load is carried by only part of the students. It also turns out that the absolute overload tolerance method produces higher success rates than the relative method.

6.2
In order to achieve a balanced filtering of quality criteria and economy criteria a cross-over transmission ceiling has been introduced for the quality filter. This measure excludes low quality tutors and produces better matching scores. The drawback of this transmission ceiling is, however, that often the same high quality elite is selected, which causes increased failures of the subsequent economy filter. Higher success rates are achieved by omitting the transmission ceiling. Yet, this goes at the expense of the matching scores, which sink substantially.

6.3
The application of long tutoring dead times ensures the fair spread of student load over time. Yet, it also hampers the peer allocation procedure, because students that have completed their consults are not available right away. Consequently, the number of re-directs to the teacher will increase and the success rate drops.

6.4
The allocation algorithm works best at large population sizes. However, for populations above some 100 students (within the constraints of table 2) the cross-over ceiling produces an unwanted side effect by repeatedly producing the same fraction of high quality elite candidates that gradually will be rejected by the economy filter. While omitting the cross-over ceiling allows many low quality candidates to be allocated - indeed the matching scores drop substantially -, one might consider to define the cross-over ceiling somewhere in the interval (√n, n) rather than the extremes √n (conditions A and C) or n (conditions B and D).

6.5
Simulations have been carried out for both the same linear curriculum for all students and for a randomised curriculum for each student individually. The results show that curriculum structure has little influence on the allocation mechanism.

6.6
A simple extension of the current model would be the use of various support types: by labelling the requested type of support into predefined categories an additional quality criterion becomes available to select the best candidates. In addition, this can be combined by a self-scoring of the peer tutoring events. Self-scoring by the fleeting pairs of students provides relevant data to feedback tot the system in order to improve system stability, to apply remedial measures and to improve the fit between requester and supporter. These topics will be subject of future research.

* References

ANDERSON, A, Cheyne, W, Foot, H, Howe, C, Low, J, and Tolmie, A (2000) Computer support for peer-based methodology tutorials. Journal of Computer Assisted Learning, Vol. 16, pp. 41-53.

BROWN, J.S., Collins, A. & Duguid, S. (1989). Situated cognition and the culture of learning. Educational Researcher, Vol. 18(1), pp. 32-42.

FANTUZZO, J W, Riggio, R E, Connelly, S and Dimeff, L A (1989) Effects of reciprocal peer tutoring on academic achievement and psychological adjustment: A component analysis. Journal of Educational Psychology, Vol. 81, pp. 173-177.

GERGEN, K (1995) "Social construction and the educational process". In Steffe L and Gale J (Eds.). Constructivism in education, (pp.17-39), Lawrence Erlbaum Associates,Inc.: New Jersey.

GYANANI, T C and Pahuja, P (1995) Effects of peer tutoring on abilities and achievement. Contemporary Educational Psychology, Vol. 20, pp. 469-475.

KING, A, Staffieri, A and Adelgais, A (1998) Mutual peer tutoring: Effects of structuring tutorial interaction to scaffold peer learning. Journal of Educational Psychology, Vol. 90, pp. 134-152.

VAN BRUGGEN, J, Sloep, P, Van Rosmalen, P, Brouns, F, Vogten, H, Koper, R and Tattersall, C (2004) Latent semantic analysis as a tool for learner positioning in learning networks for lifelong learning. British Journal of Educational Technology, Vol. 35 (6), pp. 729-738.

VAN ROSMALEN, P, Brouns, F, Tattersall, C, Vogten, H, van Bruggen, J, Sloep, P and Koper, R. (2005) Towards an open framework for adaptive, agent-supported e-learning. International Journal of Continuing Engineering Education and Lifelong Learning, Vol. 15 (3-6), pp. 261-275.

WESTERA, W (2001) Competences in Education: a confusion of tongues. Journal of Curriculum Studies, Vol. 33 (1), pp. 75-88.

WONG, W K, Chan, T W, Chou, C Y, Heh, J S and Tung, S H (2003) Reciprocal tutoring using cognitive tools. Journal of Computer Assisted Learning, Vol. 19, pp. 416-428.

----

ButtonReturn to Contents of this issue

© Copyright Journal of Artificial Societies and Social Simulation, [2007]