© Copyright JASSS

  JASSS logo ----

Gérard Weisbuch and Guillemette Duchateau-Nguyen (1998)

Societies, cultures and fisheries from a modeling perspective

Journal of Artificial Societies and Social Simulation vol. 1, no. 2, <https://www.jasss.org/1/2/2.html>

To cite articles published in the Journal of Artificial Societies and Social Simulation, please reference the above information and include paragraph numbers if necessary

Received: 17-Jan-1998      Accepted: 11-Feb-1998      Published: 31-Mar-1998

----

* Abstract

Cultures can be viewed as sets of beliefs and techniques allowing societies to cope with their environment. We here propose simple and explicit schemes showing how fishermen could encode beliefs about a renewable resource, fish. We then discuss the dynamics of the society, represented by economic and cultural variables, coupled to the fishery represented by fish abundance. According to different coding schemes and sets of parameters, several dynamical regimes are observed, including one with endogenous crises.

Keywords:
Fisheries, learning, institutions, beliefs, dynamics, environment

* Introduction

1.1
Natural resource management has been a challenge for all human societies, from hunter-gatherers to the present. Societies' organisation and culture are strongly dependent upon environmental constraints. Although fisheries have been modeled by economists from an integrated perspective since the 30s, the influence of cultural constraints on resource exploitation is seldom taken into account (Bousquet et al 1993), while the reverse influence of the state of the environment on culture and institutions is never discussed. The standard economic approach to fishery management considers rational economic agents able to optimize their catch in the long term (see for instance Clark, 1990). But this view is in contradiction with the many instances when modern fleets were able to exhaust local fisheries, such as cod in Newfoundland. On the other hand, ethnology rather supposes that societies have developed, as part of their culture, simple practices, including taboos, that allow a sustainable use of their resources.

1.2
The present paper is an attempt to bridge the gap between these opposite views by proposing, and modeling, cognitive mechanisms leading to the emergence of "world representations" or beliefs which condition agents' fishing practices. Its motivations are two-fold: we want to get some insight

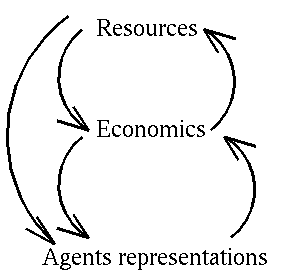
Concerning the second motivation, the role of cultural, social and political factors in economic and technical choices concerning the environment is now well established (Descola, 1996). Most schemes describing the loops of interactions among climatic, natural and economic variables include control terms due to these factors, see for instance figure 1. Economic models consider these factors as exogenous and treat them as constant parameters of a choice function; this is the case for instance when economic agents are supposed to maximize a given utility function. Another view from the integrated assessment literature is that the scientist's task ends when choices of possible measures, including the analysis of their potential costs and benefits, are presented to the political authority which requested the assessment to be performed. The authority then chooses one of the proposed actions according to how it weights cultural, political and social factors. Within this framework, human factors are made even more exogenous to the modeling effort and are, supposedly, entirely taken into account by the political authority. This is the view of a number of scientists who are very much in favor of the neutrality of science; for them, the political level should be entirely responsible for the decision process.

1.3
These views make assumptions about the rationality of either the economic agents in the first case or of the political authority in the second case. Most often, economic agents are supposed to be supposed perfectly rational or the political authority "perfectly honest". Such assumptions are not common in political philosophy, and furthermore they are not very reasonable for long term issues such as sustainable development or the evolution of societies.

1.4
The present modeling effort deals explicitly with the dynamics of the fishermen's cognition and behavior, coupled to ecological and economic dynamics. It is partly based on neural nets and concerns the following issues which are seldom addressed in the standard bio-economics literature (Charles, 1989):


1.5
We will use a minimal dynamic model of the coupling between biological, economic and cultural variables to understand some of the features of fisheries as socio-economic systems and to answer questions such as:

* Resource And Capital Dynamics

2.1
A diagram of the model is presented in figure 2.

2.2
Fish resources, N, are renewed at a constant proportional rate r, but their growth is limited by the carrying capacity M of the environment. In the absence of harvesting they would obey the logistic difference equation known as the Verhulst-Pearl model:


2.3
We have chosen a difference equation formalism rather than differential equations to take into account the annual periodicity of fish renewal and of fishing campaigns. Difference equations are also well adapted to numerical simulations.

2.4
Resources are depleted because of harvesting by the fishermen. In this model the harvest P obeys a generalized Cobb-Douglas expression:


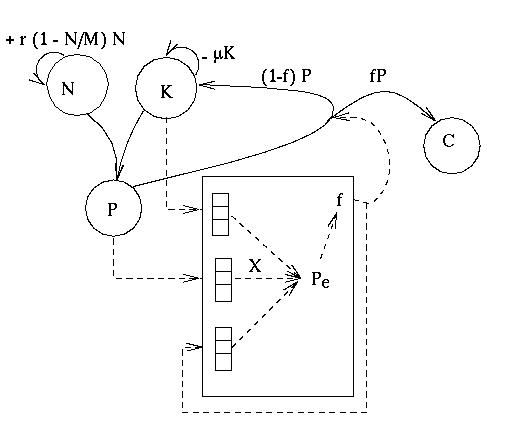
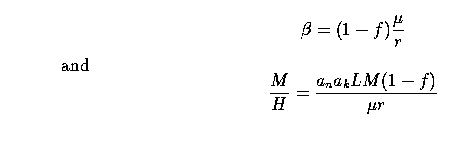
where P, the production function, has decreasing returns in terms of the labour force, L, and the invested capital, K. This simple Cobb-Douglas expression, with half powers on K and L and a unitary power on N, was chosen to allow simple algebraic computations rather than to be realistic. We further distinguish between Pk, the size of the harvest in monetary units, and Pn, the size in number of fish, by multiplying P by coefficients ak and an respectively. ak/an can be thought of as a price. The labour force is assumed to be constant in time2.

2.5
The complete difference equation for the resource is then:


Capital K is decreased at the capital depreciation rate µ, (representing, for instance, the inverse mean life time of the boats and fishing gear). It is also increased by some investment proportional to the harvest. Capital then obeys equation:


f(t) is the fraction of production in value that the agents choose to consume; the rest of the production is reinvested in capital. Fraction f(t) is chosen by the agents according to their internal representation of the environment and according to their economic interest.

2.6
Equations 3 and 4 are strong simplifications with respect to all the aspects of natural and economic processes that can interfere: age structured populations and the dynamics of other species for equation 3 and market mechanisms concerning fish prices and labour for equation 4. These simplifications were made in order to facilitate the understanding of the effects of agents' internal representations.

* A Simplified Analytic Approach

3.1
Our main objective is the numerical study of the differential system equations 3 and 4 when consumption fraction f is adjusted by the agents. But in order to compute optimal performance of perfectly rational agents - in the present case, agents knowing the dynamics of fish and capital - a preliminary analytical study (Weisbuch et al., 1997) of the differential system when f is constant is both possible and instructive.

3.2
Setting both left hand sides of equations 3 and 4 equal to zero gives one non-degenerate equilibrium. By differentiating the analytical expression of equilibrium consumption with respect to f, one obtains the optimal consumption fraction and the corresponding values of the variables 3. We will use these values, to be called optimal or theoretical, as references for the simulations where f is adjusted by the agents. We will then be able to figure out how well agents with bounded rationality are able to perform with respect to perfectly rational optimisers.

3.3
Dimensional analysis allows us to reduce the number of parameters and to distinguish between those parameters that simply change the time scale or the magnitude of variables N, K and P at equilibrium, and the two reduced parameters which change the dynamic regime of the system from a limit cycle to a stable attractor with or without oscillations towards equilibrium. The two reduced parameters are:

(5)(5)

H, defined by the above equation, is called the harvest limited resource (in the limit of large M, the environment's carrying capacity, the resource N goes to H). An important result of the formal analysis is that attraction toward equilibrium is slow with large oscillations when is small, which is true for most fisheries (except whales for which lifetime is larger than inverse capital depreciation rate), and when M>>H, i.e. when the fishery is exploited well below its carrying capacity. In other words, these are the conditions when we can expect difficulties in controlling the fishery, and this is indeed what is observed in simulations.

3.4
When f varies with time, other time parameters have to be taken into account such as sampling, learning and discount rates. All these analytical results are important to interpret simulation results and to simplify the systematic search in the space of parameters: rather than doing a "blind" sensitivity analysis, we can look for regions in the reduced parameter space where identical attractors are obtained. When necessary, interpretation of the results in terms of the original biological, economical or cognitive parameters can require a proper re-scaling (Weisbuch et al., 1997).

* Agents' Internal Representations And Optimization Criterion

4.1
We suppose that agents do not know equation 3: as we said in the introduction, they neither know directly the level of the resource nor its exact dynamics. But, because they (or other fishermen) have practiced fishing, they have some idea on how to predict, with some limited precision, future catches from the past catches and investment levels.

4.2
Of course, we do not really know the algorithms by which agents learn their representation of the world, nor how they use them to compute f. Several classes of learning and choice processes have been proposed in the literature such as Bayesian learning, standard AI learning and neural nets. We have chosen to use linear predictors, which can be considered as one instance of neural nets well adapted to a real output variable, here f. This choice is motivated by two reasons:
4.3
In order to establish the linear predictor model of the agents, let us suppose that estimated future catches Pe depend linearly on np past catches, capital and fractions of consumption:


Vector X is the vector of linear predictors.

4.4
Since the agents know the size of past catches, they can compute the linear predictors (X) by using expressions equivalent to 6, written with previous actual catches P(t') on the left hand side at times t' = t, t-1, t-2, .... We have used this representation for the agents and computed vector X with a set of equations larger than the set of unknowns. This is equivalent to a least square fit of experimental data (the previous series of catches, capital amounts and fractions of consumption) by equation 6 with vector X components as parameters of the fit. This first method of computation of the linear predictors will be called the inversion method.4

4.5
The choice of data to be used for the prediction, P, K, f has some arbitrariness. For instance we could have used only two variables, e.g. P and K: f is redundant, but this redundancy facilitates the prediction process. We can think of the series of catches, capital amounts and fractions as the only information available to the agents. We will also give simulation results with rather than K as the data used in expression 6. This corresponds to some partial knowledge about the production function by the agents, but still ignorance of the resource stock and its dynamics. The idea is that the agents have "local" knowledge about the consequences of their choice on their own capital and harvesting efficiency, but no knowledge of the "global picture", apart from their internal predictor representation.

4.6
The linear predictors can also be interpreted as a neural net that allows the computation of an output, the future production, from inputs which are the previous P, K and f (Kohonen, 1988, Weisbuch, 1991) . Incremental learning techniques can then be applied, such as the Widrow-Hoff rule based on a gradient descent to decrease a measured error. Each time the prediction is applied, the agents obtain an error signal at the next time step by comparing the previously predicted Pe to the actual production P during that period.
4.7
The error function is simply the square of the difference between the actual and predicted productions. The predictors can then be updated according to:

where is a constant small decay factor along the gradient of the error function with respect to the predictor vector X

.
4.8
Since some initial representation is necessary before Widrow-Hoff updating, the first (the pseudo-inversion) method is used to start our program: it can be interpreted as the gradual build-up of an internal representation of the dynamics of the fishery by the agents. The second (Widrow-Hoff learning) method can be interpreted as periodical tuning of the representation according to the last available data. We will see in the results section that the two methods can have different consequences for the behaviour of the agents.

4.9
The representation described above can be used by the agents to tune the consumption fraction f. From a set of possible aims, such as ensuring a minimal sustainable consumption, we have chosen an optimisation scheme5. We then suppose that consumptions are comparable to those which would be obtained if agents iterate expression 4 to choose an optimal consumption scheme


where the nf consumption fractions f(t + i) are chosen to maximize the sum of consumptions discounted with discount rate during the nf future time periods following time t. We will use the notation to present simulation results.

4.10
These learning and choice mechanisms were chosen as boundaries of a large set of possible information processing mechanisms. The linear predictor algorithm probably extracts most of the information available in the time series of catches, and the consumption optimisation is a convenient way to take into account variable concerns about the future, e.g. differences between offshore industrial and local small scale fisheries.

* Simulation Results

5.1
A very large number of simulations were done and all relevant parameters were changed to observe dynamic patterns and compare performances of the present model with bounded rationality to optimal performance which were computed as described in the above section.

5.2
The plots given in the results section illustrate the dynamics of "external" variables such as resource level, capital, production, consumption, etc. One issue concerns the internal dynamics of an agent's internal representation. Since there are so many linear predictors, up to 18 (corresponding to 3 variables taken at 6 time steps), we have chosen to follow their dynamics by measuring the overlap between successive internal representations:


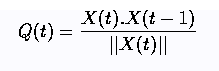
The dot stands for the scalar product of the two representations. If the two successive representations are the same, the overlap is 1. This measure is often used to compare attractors in configuration space in the statistical mechanics of spin glasses or neural nets (Mezard et al 1987). Monitoring Q shows whether the agents keep stable representations that are simply updated by new information or whether they experience strong changes in opinion.

5.3
The following sections gives a selection of some of the stylized facts that were observed during the simulations. Unless otherwise mentioned, we used the following "standard" set of parameters for the time plots and the results described below. Since the agents' representation uses the experience gained over the last 70 time steps, a somewhat degraded representation has to be used during the initial 70 steps of the simulation.6


Table 1: Standard parameters and variables at optimum consumption.
Parameter Value

initial value of resource N

5

initial value of capital K

0.1

capital decrease rate

0.2

reproduction rate r

0.5

carrying capacity M

5.0

production coefficient in capital

0.5

production coefficient in fish units

0.2

discount rate for the future

0.7

learning parameter

0.05


Variable Value at optimum consumption

consumption fraction

0.86

resource

2.92

capital

1.08


* Updating The Linear Predictors By The Inversion Method

Predictor Model, Linear In Capital


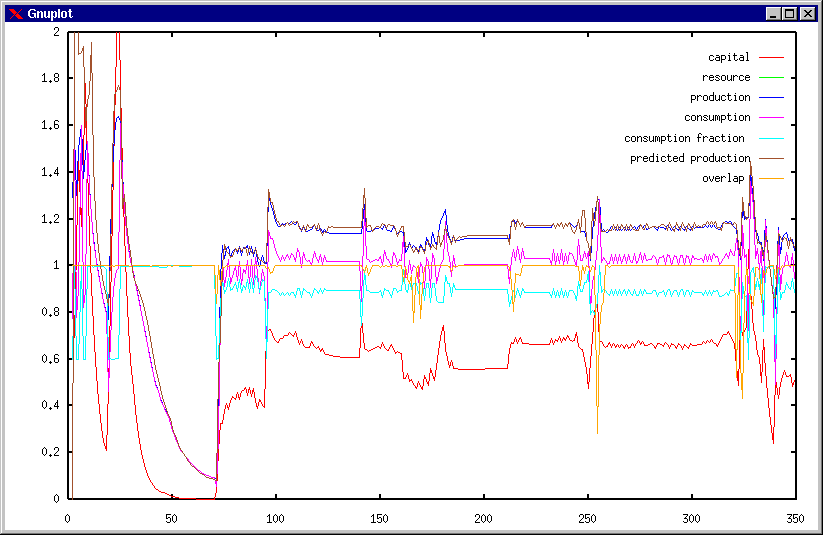
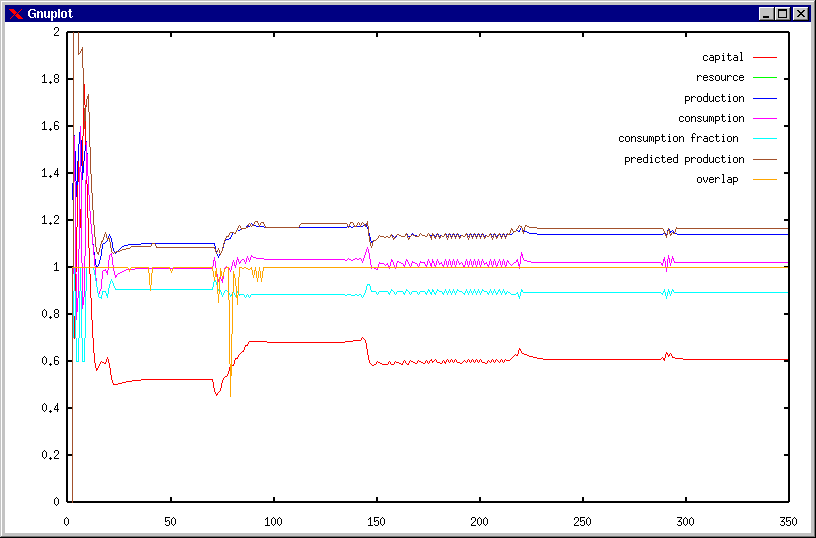
Figure 3: Simulated performance of agents using predictors linear in capital. Time plots of capital, actual and agents' predicted production, consumption, fraction of consumed production and overlap. The overlap between consecutive agents' representations is an indication of the stability of representations when it stays close to one. After 70 initial time steps, agents use knowledge about previous performance to adjust consumption and investment. Although performance fluctuates as seen on the time plot, average consumption remains only a few percent lower than maximal sustainable consumption.
6.1
Figure 3 was obtained with a predictor model linear in capital as described in equation 6. The first 70 steps correspond to the build-up of the agents' internal representation. After that, a comparison between predicted production and actual production shows that agents are reasonably good predictors. Average consumption measured from the simulated results (1.275) is not much smaller than the optimal equilibrium consumption (1.30). One also observes downward peaks of the overlap, indicating that the agents' internal representations quite often undergo drastic changes. Those drastic changes make agents' performance fluctuate.

Predictor model, linear in the square root of capital


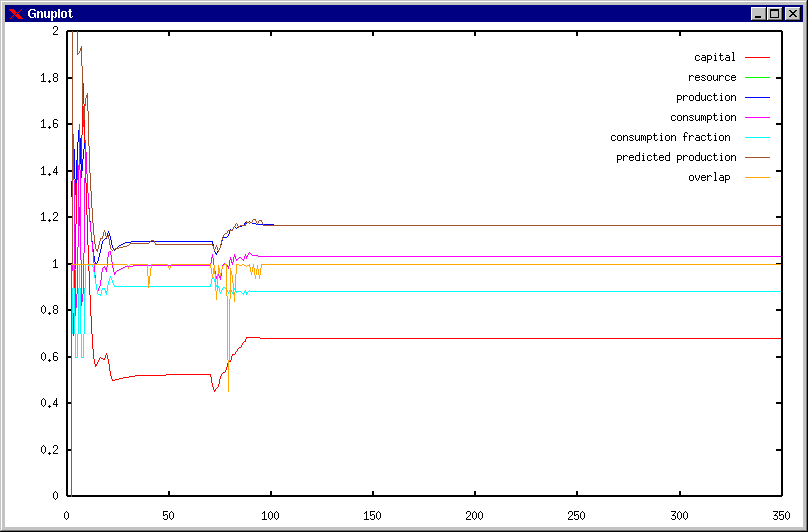
Figure 4: Time plot of predicted and actual production, consumption and overlap of representations, when agents use predictors linear in the square root of capital, thus using some knowledge about the form of the production function. The amplitudes of the oscillations are strongly reduced, and the intermittent dynamics with a quasi-period of 70 steps is more clearly visible.

6.2
As discussed above, using predictors based on the square root of capital implies that the agents have some idea of how they perform individually. Figure 4 is characteristic of the behavior commonly obtained with predictors linear in the square root of capital for a wide range of parameters. After a short adaptation period of 30 time steps, agents become good predictors as can be seen from the comparison of their predicted consumption with the consumption actually achieved. They are also good optimizers: the average consumption is not far from optimal. The most striking feature is the periodic succession of stasis and crisis: stasis periods are separated by crisis at times t = 70, 140, 210, and 280. A period of 70 time steps separates successive crises. This period is exactly the memory size of the data used to compute the linear predictors 7. The interpretation is straightforward: during a crisis, the system explores some part of variable space, which allows the agents to build a valid interpolation model of the external dynamics. Agents become good optimizers and remain in the neighborhood of the optimum, but in doing so they do not acquire knowledge about external dynamics. After 70 time steps of stasis they have lost any information they could have had about regions away from the optimum. Their interpolation based on a small region in variable space is very poor, and they become bad optimizers. The system enters a crisis phase, it shifts away from equilibrium, and then starts regaining some knowledge and predictive capacity, which leads to a new stasis in the neighborhood of equilibrium. The alternation of stasis and crisis is clearly related to the finite memory of the system. It also evokes intermittency dynamics observed in turbulence (Bergé et al., 1979) or the so called exploration/exploitation strategies described in behavioral sciences (Marsh, 1991).
6.3
The picture with internal representation in is not qualitatively different from the previously described representation in K: in both cases the dynamics is intermittent, but instability is larger for the latter case. Numerous simulations showed that instability increases when:

* Widrow-Hoff Updating Of The Linear Predictors

7.1
The relation between finite memory and intermittency dynamics suggests one should look for an updating mechanism which incorporates old knowledge about crises and new knowledge to react appropriately to any change of the dynamics due to new perturbations. This is done in the simulations by first learning the predictors by the pseudo-inverse method which allows the use of the information available during the early crises periods and then updating the predictors in proportion to the error function (Widrow-Hoff equations). As long as the predictors are adapted to the environment, i.e. as long as the error is negligible, the predictors remain unchanged, and memory of the past crisis is retained.


Figure 5: "Widrow-Hoff updating": Time plot of predicted and actual production, consumption and overlap of representations, when agents use Widrow-Hoff incremental updating of the linear predictors. The amplitude of the oscillations is strongly reduced.

7.2
When Widrow-Hoff updating is used after the first 100 time steps, we do not observe any more crises, nor model change: the overlap curve is flat at one. The system is not completely stable: one observes small amplitude oscillations around equilibrium. But the predictor driven dynamics is sufficient to ensure robustness of the attraction: the system never moves far away from equilibrium.

* Influence Of The Simulation Parameters

8.1
A systematic study of influence of the parameters of the dynamics shows that agents are fairly good controllers and average consumption is most often very close to optimal consumption. In summary:


* Discontinuities And Noise In The External Dynamics

9.1
A series of questions concerns the robustness of the cognitive model we are using with respect to dynamics of the resource more complex and more realistic than equation(3). Is the cognitive compartment "clever" enough to deal with sudden catastophies or noisy dynamics? Two series of tests answer the question.

Recovery of control after a catastrophe

9.2
Natural systems can undergo large and sudden changes: for instance the carrying capacity of the environment can have very large and unexpected variations (e.g the El Niño 1973 effect on anchovy fisheries (Idyll, 1973)). How can the agents adapt their internal model to sudden changes of the external dynamics?

9.3
We were surprised to find that adaptation is very fast (around 10 time steps) even for a 50 per cent. decrease of the carrying capacity M (figure 6). It is also reasonably efficient: measured consumption is 0.474, (when is equal to 0.05) instead of 0.558 in theory (after the decrease in carrying capacity).


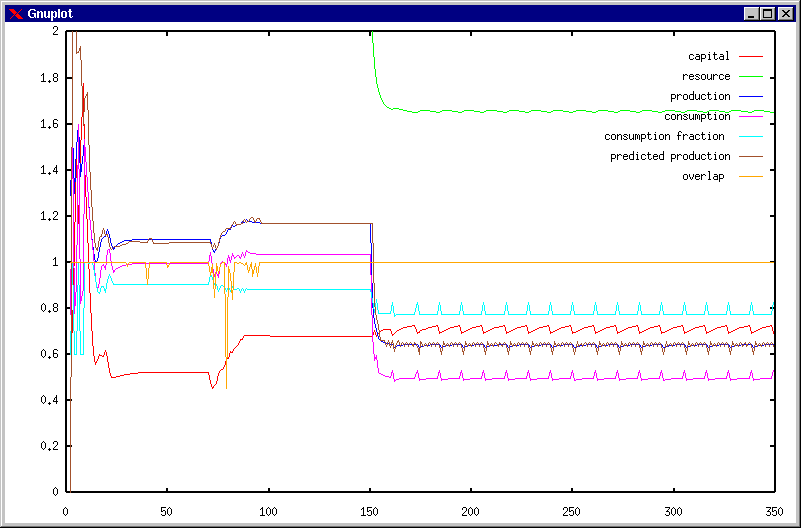
Figure 6: "El Niño effect": the system is able to readjust to a new resource dynamics after the carrying capacity decreases by a factor of 2.

Effect of noise

9.4
Because of multiple interactions, a "real" ecosystem is far more complicated than the one described by equation 3. One way to take into account the influence of this complexity on the predictive capacity of the agents is to introduce some noise into equation 3. Noise simply reflects "hidden" variables or the randomness of certain processes such as boats finding schools of fish or price fluctuations on the market. Carrying capacity can also fluctuate because of climatic conditions and the varying interactions of fish with other species such as plankton, other competing species or predators. We started by introducing multiplicative noise into the result of equation 3.

9.5
With a 10 per cent uncorrelated noise on the resource, the performance of the system slowly decreases when a standard learning parameter is used: after 1500 time steps, average consumption is only 0.44 (instead of 1.30) while capital has plummeted to 0.040 (instead of 1.08). The Widrow-Hoff method is based on a linear readjustment between prediction and actual performance, but the error in the presence of a high frequency noise has little correlation with the deterministic dynamics of the system. The linear predictor matrix is not actually updated by the readjustments, it is rather destroyed by the noise, hence the observed decrease in performances.

9.6
On the other hand, when the inversion method is used during the whole simulation, stability of consumption is maintained, at a level which slightly decreases with noise: 1.26 (compared with 1.16) at 10% (compared with 20%) noise level. Noise suppresses intermittencies by forcing the system to permanently explore larger regions of the phase space. The internal representation of the agents, although never the most accurate, is still always robust enough to avoid strong crises.

* Different Agents

10.1
In real life, agents have different views and understanding of their environment. Differences in interest in the future, for instance between traditional societies and multi-national firms, have direct consequences on political divergences and often result in conflicts. A simple way to study such effects with our model is to consider two populations of agents with different discount rates for the future. Both populations exploit the same resource, and we suppose that they only differ in discount rate. We have studied the influence of this difference on their performance. In figure 7 , one population with index 1 has a constant discount factor while the other population discount factor varies between 0.5 and 0.9. The divergence in performance observed in the figure is typical of these simulations. The agents with the largest discount factor 2 invest more and have larger consumptions. The other agents, with low , under-invest and perform badly. The performance of the short-sighted agents (those with ) is strongly reduced by the existence of agents with longer time horizons. We have supposed in most simulations that agents only have access to information concerning their own past performance. But the dynamics and performance do not change in those simulations when they get extra information about the capital invested by the other population.

10.2
Such results about the better performance of those agents that care more for the future might be considered as comforting and perhaps predictable. On the other hand, they are in oppposition to those derived from other paradigms such as game theory. Environmental issues are often interpreted in terms of the tragedy of the commons (Hardin, 1968), and a number of modelers are applying game theory approaches, such as the repeated prisoner's dilemma (Axelrod 1984). A central issues then concerns the adoption of cooperation or defection behavior by players, including the issue of the best strategy to adopt by one player in view of the other player's strategy. In our model, the two kinds of agents remain steadily investing at two different levels and they never adopt classical strategies of game theory such as TIT for TAT. Understanding why these two very different methods predict different results is easy: game theory is based on strategic thinking about the moves of the other agents with constant pay-off matrices while our method is only based on procedural rationality in a varying environment. The fact that we have different results with our approach raises questions about the often assumed universal validity of game theoretic reasoning in human relations.


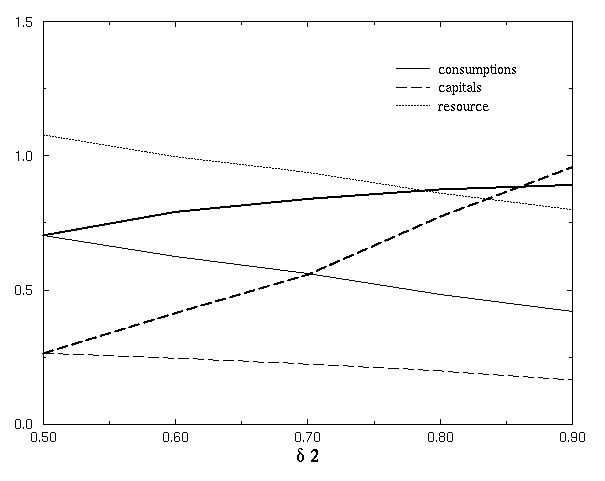
Figure 7: Variation of equilibrium resource, capital and consumptions in the case of two populations of agents with different discount rates for the future. Population 1 has a constant discount factor while the other population discount factor varies along the x axis between 0.5 and 0.9. Thinner lines are the performance of the short-sighted population 1, thicker lines those of population 2. The dotted line represents the ratio of equilibrium resource to optimal equilibrium resource.

* Conclusion

11.1
Let us now see where we stand with respect to our initial aim, to gain some insight about the influence of "cultural traits" on technical and economic choices concerning the environment as opposed to standard bio-economic modeling based on unbounded rationality. After sumarising the results, we will discuss them from the perspectives of comparison with empirical data and with what we know about cognition.
11.2
The results demonstrate that simple and standard cognitive science techniques permit the coupling of the dynamics of agents's internal representations to bio-economic system dynamics. These internal representations can be considered as beliefs allowing agents to cope with their environment by adjusting their investment and thus their harvesting effort. For "simple" environmental dynamics (little noise, no abrupt transitions), agents are able to cope with the changes they induce on their environment as shown by the comparisons between their performance and analytical results for optimal performance. Of course, the sampling time for data collection has to be smaller than the characteristic time of the bio-economic system. Small oscillations around equilibrium are observed, and interest in the more distant future increases performance and the amplitude of the oscillations.

11.3
Different formal learning procedures can be proposed which differ in their consequences on the dynamics of the fishery.

11.4
The present model is straightforwardly generalized to take into account the dynamics of prices and demand, and the possibility of more choices for the agents such as leaving or entering the fishing activity, saving money for the future, investing in other activities...

Let us now come to the question of comparing the model predictions with empirical data. In fact, we have in real life a number of examples of fisheries in situations which do not seem to be (perfectly) rationally managed: consider fish depletion in Newfoundland, Iceland, the Northern Pacific or the Peruvian coast. A number of explanations have been proposed based on biological, climatic or economical mechanisms, all based on full rationality of the actors. But no single mechanism is unanimously accepted as the explanation for the depletion of a specific fishery. What we have discussed here is how the lack of information about fish stock and dynamics can also play a role in observed fish dynamics. Trying to work out which mechanisms are most relevant for a given fishery is outside the scope of this paper.

11.5
Our model does not pretend to present a fully developed model of a society and its culture: culture is much more than beliefs. But we have a dynamics of belief in relation with a varying environment represented by the fishery. No a priori knowledge of the agent was assumed, and the beliefs are learnt from experience, which we consider as an example of the emergence of an institution (namely the beliefs). By using a learning approach inspired from human cognition and a vectorial representation of belief, we went along avenues very different from the standard evolutionary approach of cultural transmission8 as described for instance in Cavalli-Sforza and Feldman 1981. The slow incremental pace of the Widrow-Hoff mechanism evokes the slow adaptation of tradition to new knowledge. On the other hand, the inversion method based on a fixed set of data coupled with optimisation (and thus relying on insufficient information) evokes technocratic planning which does not take into account the lessons of the past. Although agents interact indirectly by sharing the resource and common information, they do not have direct interactions through social structures. Such structures as common stores redistributing fish among fishermen and agencies controlling capital investments and fishing regulations can easily be integrated within the framework of the present model to describe the role of social institutions other than beliefs.

* Acknowledgements

We thank J.P. Aubin, V. Gremillion, D. Herreiner, A. Kirman, and J.P. Nadal for helpful discussions. The Laboratoire de Physique Statistique is associated with CNRS (URA 1306) and Paris 6 and 7 Universities. Parts of this work were done during or inspired by GW's stays (with the help of a NATO Collaborative Research Grant CRG 95 1261) in the Santa Fe Institute which we thank for its hospitality.

Supplementary material Computer programs and supplementary materials, with more simulation results and references to halieutics, can be retrieved in a tar format file.

----

* Notes

1 Because we are using such a minimal model of a fishery, we cannot pretend to represent a real fishery to the point where we could compare numerical predictions with empirical data. By contrast, the nature of the attractors of the dynamics is a robust property which is independent of modeling details. This level of description is then relevant to the minimal model that we are using.

2 Maintaining a constant labour force is only an approximation done in order to keep the model simple. An economist might be tempted to suppose that agents enter or leave fishing activity according to available profits. A constant labour force is reasonable for artisanal and traditional fisheries when other economic activities are not readily available. But this assumption is not crucial to the model which can be easily generalised by supposing the existence of a competitive labour market with minimal profit.

3 In fact, we have no formal proof that a constant f regime is optimal in term of consumption. It is possible than some oscillatory regime gives higher average consumption. But for all the simulations that we have done, the constant f optimal consumption appeared as an upper limit of observed average consumptions, and we therefore took it as the reference for comparison of the agents' performance.

4 Linear predictors can be "learnt" using algorithms that are closer to human cognition than the matrix inversion algorithms we use in the present paper, for instance the Rescorla Wagner algorithm inspired from classical conditioning in behavioural psychology. We use here the most classical inversion algorithm for the sake of simplicity and availability, since anyway the resulting linear predictors are equivalent after learning. To be more specific, the linear predictors are directly computed by inverting the matrices in previous P K and f by the singular value decomposition method and multiplying the pseudo-inverse matrix by the previous production vector according to the algorithms given in Numerical recipes (routines svdcmp and svbksb).This does not mean that we imagine that fishermen would invert matrices using singular value decomposition as we do here! We only imply that the best they can do with the limited information that they posess corresponds to the algorithm we use.

5 There are many modelling options for the way agents choose f. Consumption optimisation, equivalent in the present case to profit optimisation, was chosen here in order to depart from economics modelling only on the issue of available information. Such a way of adjustment would make more sense in the case of industrial than artisanal fishery. In the numerical computations, rather than optimising on the series of consumptions, we supposed that the fraction of consumption evolves in the future according to:

This smooth adjustment of f(t) has two advantages:

  1. It avoids pathological under-investment during the last periods of the future due to the finiteness of the horizon at t + nf: otherwise agents would not invest during the last period because they do not expect any further return. From the modelling point of view, there is nothing special about nf: we do not view it as a finite time of exploitation after which the agents no longer care, but simply as an upper limit supposed to be large with respect to , the range of the agent's interest in the future.
  2. Instead of optimizing Cfuture over nf variables, we only have to do it for the three variables and .
We then used the simplex algorithm as described in Numerical recipes (routine amoebae) in order to optimize Cfuture with respect to and at each time step. During the iteration procedure of the simplex the algorithm might go too far from the finally selected values of f(t), generating negative K values which would stop execution. We therefore used in the numerical simulations a "pseudo square root" production function given by:

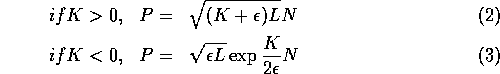
which is continuous and has a continuous derivative at the origin. was taken as 0.001.

6 A constant f = 0.5 is used during steps 0 and 1. Linear extrapolation from the two previous steps are then used to adjust f during the first ten steps of the simulation. The linear predictors model with an increasing number of predictors and memory size is used thereafter. np is increased by 1 and memory size increased by 10 whenever time is a multiple of 10, until np = 6 and memory size = 70.

7 The equality between memory size and intermittency period was checked by using different memory sizes such as 40 and 50.

8 Most standard models of cultural evolution draw from epidemiology, and represent cultural evolution by the change of one attribute through an "infection" mechanism. Such models then suppose that the most appropriate value of the attribute is known a priori and fixed, and that cultural traits are independent. Models based on mutation mechanisms such as genetic algorithms might look promising, but they are certainly further from human cognition than the neural net approach to learning described here.

----

* References

AXELROD, R. 1984. The evolution of cooperation. Basic Books, New York.

BERGÉ, P., Dubois, M., Manneville, P., and Pomeau, Y. 1979. Intermittency in Raleigh-Bénard convection. J. Physique Lettres, 40:L--505.

BOUSQUET, F., Cambier, C., Mullon, C., Morand, P., Quensiere, J., and Pave, A. 1993. Simulating the interaction between a society and a renewable resource. Journal of biological systems, 1:199--214.

CAVALLI-SFORZA, L. and Feldman, M. 1981. Cultural Transmission and Evolution: A Quantitative Approach. (Princeton University Press).

CHARLES, A. T. 1989. Bio-socio-economic fishery models: labour dynamics and multiobjective management. Canadian journal of fisheries and aquatic sciences, 46:1313--1322.

CLARK, C. W. 1990. Mathematical bioeconomics: The optimal management of renewable resources (2nd edition). (Wiley-Intersciences, New-York).

DESCOLA, P. and Gisli, P. eds. 1996. Nature and Society: Anthropological Perspectives. European Association of Social Anthropologists. (Routledge, New York).

HARDIN, G. 1968. The tragedy of the commons. Science, 162: 1243-1247.

IDYLL, C. P. 1973. The anchovy crisis. Scientific American, 228:22--29.

KOHONEN, T. 1988. Self-organization and associative memory. (Springer-Verlag, Heidelberg).

MARSH, J. 1991. Exploration and exploitation in organizational learning. Organization Science, 2(1):71--87.

MÉZARD, M., Parisi, G., and Virasoro, M. 1987. Spin glass theory and beyond. (World scientific, Singapore).

PRESS, W. H., Flannery, B. P., Teukolsky, S. A., and Vetterling, W. T. 1989. Numerical recipes. The art of scientific computing. (Cambridge University Press, Cambridge).

RESCORLA, R. and Wagner, A., 1972. A Theory of Pavlovian Conditioning: The Effect of Reinforcement and Nonreinforcement, In Classical Conditioning II: Current Research and Theory. Eds. Black A. and Prakasy W., 64--69, Appleton-Century- Crofts, New York.

WEISBUCH, G. 1991. Complex systems dynamics. (Addison-Wesley, Redwood City).

WEISBUCH, G., Stanley, E. A., Duchateau-Nguyen, G., Antona, M., and Clément-Pitiot, H. 1997. Influence of capital inertia on renewable resource depletion. Theory Bioscienc., 97--117.

----

ButtonReturn to Contents of this issue

© Copyright Journal of Artificial Societies and Social Simulation, 1998