Polarization on Social Media: Micro-Level Evidence and Macro-Level Implications

,
and
aInstitute for Advanced Study in Toulouse, France; bKarlsruhe Institute of Technology, Germany; cUniversity of Groningen, Netherlands
Journal of Artificial
Societies and Social Simulation 27 (1) 7
<https://www.jasss.org/27/1/7.html>
DOI: 10.18564/jasss.5298
Received: 06-Jan-2023 Accepted: 01-Nov-2023 Published: 31-Jan-2024
Abstract
We formally introduce and empirically test alternative micro-foundations of social influence in the context of communication on social media. To this end, we first propose a general theoretical framework allowing us to represent by different combinations of model parameters of influence-response functions whether and to what extent exposure to online content leads to assimilative or repulsive (distancing) influence on a user's opinion. We show by means of an agent-based model of opinion dynamics on social media that these influence-response functions indeed generate competing predictions about whether personalization (defined as the extent to which users are shielded from foreign opinions) increases or decreases polarization. Next, we conducted an online experiment with respondents recruited on Facebook to estimate model parameters empirically, using Bayesian models for censored data. In the experiment, participants´ opinions were measured before and after exposure to arguments reflecting different ideological positions and moral foundations in a within-subject design. Our findings support that exposure to foreign opinions leads to assimilation towards those opinions, moderated by the extent of (perceived) ideological similarity to the source of influence. We also find weak evidence in support of repulsion (distancing), but only for very large disagreement. Feeding estimated parameter values back into the agent-based model suggests that reducing personalization would not increase, but instead reduce the level of polarization generated by the opinion dynamics of the model. We conclude that the naive interpolation of micro-processes to macro-predictions can be misleading if models are not sufficiently empirically calibrated.Introduction
How can we explain the persistence of opinion diversity in settings where individuals exert social influence on each other and should, thus, grow identical in the long run (Axelrod 1997)? Bounded-confidence models provide one of the most surprising solutions. If influence is limited to those interaction partners who do not disagree too much, then opinions converge only locally. Internally, local clusters grow increasingly homogeneous but, at the same time, differences between clusters are preserved. A large literature has demonstrated intriguing complexities of this seemingly simple solution, for example, that only small changes in micro-assumptions of the model can translate into complex and unexpected dynamics on a macroscopic level, and has inspired researchers to propose other modifications and elaborations of assumptions about social influence. Models assuming repulsion, for instance, added that individuals may tend to grow more dissimilar to interaction partners they disagree with too much, dislike too much, or both (Flache & Mäs 2008; Jager & Amblard 2005; Macy et al. 2003). Reinforcement models suggested that opinions can become more extreme when individuals with similar opinions interact (Mäs & Flache 2013). Twenty years after the introduction of the bounded-confidence model in the Journal of Artifical Societies and Social Simulation (Hegselmann & Krause 2002), there is a rich literature showing how small changes to the micro-assumptions can relate to a host of different collective opinion dynamics in subtle and sometimes unexpected ways (Flache et al. 2017).
The discovery of the sensitivity of opinion dynamics models to small changes in micro-level assumptions points to the need for empirical research on social influence processes. Yet, recent overviews of the field expose a dearth of empirical research that allows connecting theoretical model assumptions to empirical evidence (Flache et al. 2017). In this paper, we go beyond the predominantly theoretical nature of the social influence literature, empirically calibrating micro-level assumptions embedded in an ABM of online social influence dynamics, to falsify hypotheses and extrapolate to possible real-world dynamics. We seek to highlight two important future avenues for research on social influence modeling. First, we demonstrate how one can empirically test competing assumptions about social influence proposed in the literature, and how one can study the macro-implications of empirically observed social-influence patterns. Second, in order to demonstrate how models of social influence can help address important societal challenges, we feed empirical results of a social influence experiment back into an computational model assessing the effects of “bursting” filter bubbles on opinion polarization in online social media.
There is growing concern that online social networking services might be responsible for the polarization of political opinions and could have contributed to disruptive political events such as Brexit, the Yellow vest movement, and the Capitol riots (Allcott & Gentzkow 2017; Anspach 2017; Keijzer & Mäs 2022; Lazer et al. 2018; Obama 2017; Pariser 2011; Sunstein 2002). Social media users would exclusively communicate in echo chambers exposing them mainly to content supporting their own opinions. Such segregated communication networks, scholars and pundits warn, can contribute to processes of opinion polarization. However, different formal models of opinion dynamics make very different predictions about how exposure to online content in segregated communities influences user opinions (Keijzer & Mäs 2022; Mäs & Bischofberger 2015). At the heart of this difference lie assumptions about individual responses to counter-attitudinal information. Is influence assimilative in that it decreases opinion differences between users? Do individuals sometimes reject opposite views and generate growing differences? Are opinions reinforced to become more extreme when users with similar opinions communicate? Empirical research on social influence has been conducted predominantly in offline settings, yet computer-mediated interaction differs in important ways from offline face-to-face communication (Keijzer et al. 2018; Lin & Tian 2019; Postmes et al. 2001). As a consequence, research still leaves us in great uncertainty about the effects of online communication on users’ opinions. Accordingly, in the present study, we tested competing assumptions about social influence in online settings and studied the effects of empirically observed patterns of social influence on opinion dynamics in personalized social networks.
The lack of empirical knowledge on how users adjust their opinions online is problematic for two reasons. Firstly, responding to the public attention to potentially polarizing effects of filter bubbles, various initiatives have been employed to pop filter bubbles (Bozdag & van den Hoven 2015). There are, for instance, tools that quantify the degree to which users’ information diets are biased and motivate them to search for alternative sources (e.g., Bobble, OpinionSpace). Other initiatives match for interaction individuals with opposing political orientation (e.g., MyCountryTalks, Echo Chamber Club). These initiatives—albeit well intended—have the potential to foster rather than decrease opinion polarization, because it is unclear whether exposure to individuals with opposing political views promotes opinion convergence or divergence. The assumption of distancing from foreign opinions is central in prominent theories of intergroup relations (Tajfel & Turner 1986), social differentiation (Bourdieu 1984; Mark 1998), and opinion polarization (Macy et al. 2003; Salzarulo 2006) and found, at least some, empirical support (Bail et al. 2018). Secondly, in the face of lacking knowledge on the actual microprocesses of online social influence, social-media companies can easily reject claims that their services affect opinion dynamics in undesired ways. While in a 2018 interview, Twitter CEO Jack Dorsey appeared to be on the side of the bubble bursters, stating “I think Twitter does contribute to filter bubbles. And I think that’s wrong of us. I think we need to fix it.” (Thompson 2018), the CEO of Meta, Mark Zuckerberg, in contrast, expressed disbelief in the merit of connecting people with distant positions. He claimed “[...] some of the most obvious ideas, like showing people an article from the opposite perspective, actually deepen polarization by framing other perspectives as foreign” (Zuckerberg 2017). So far, research does not provide unequivocal evidence for or against either of the arguments. In order to understand how polarization emerges from a complex system of individuals selectively linked to exert influence upon each other, we need to understand the influence events themselves: the micro-foundations of polarization.
We aim to contribute to a long-standing tradition of experimental research, a field that generated ample evidence for social influence but failed to provide guidance on which of the many models of social influence is most accurate (Petty et al. 1997; Wood 2000). What is more, contextual factors for the interactions under study and feedback loops between selection of information and influence will affect predictions at both the micro- and macro-level. To make the micro-macro-link, the present study differs in three aspects from existing empirical tests of social-influence assumptions. First, we tailored our empirical study to the context of personalized social networks. In particular, we recruited participants on Facebook, refraining from convenience samples or general population samples using in earlier work. Likewise, the issues that our participants were confronted with were carefully chosen to balance how much individuals care about the discussed topic and how open they were to new information. Second, we designed the experiment and the method of data analysis in such a way that we could directly test competing models of social influence. This is a challenging exercise due to the complex nature of modeling opinion shifts on bounded scales. Third, the findings of our vignette experiment are contextualized using an agent-based model (ABM), in order to draw conclusions about macro-level outcomes resulting from the observed micro-level patterns of social influence. We thus showcase the potential of ABM as a tool to connect patterns observed in large-scale, macro-level data to theory-testing rigor that can only be achieved in micro-level experiments (Flache et al. 2022).
A central analytical tool we are using to test the competing models of social influence are so-called influence response functions (López-Pintado & Watts 2008; Mäs 2021). Models of social influence are often based on markedly different assumptions about the social and cognitive processes underlying influence. Influence can, for instance, result from rational responses to others’ behavior (Young 1993) or from the communication of persuasive arguments (Mäs & Flache 2013). Influence-response functions abstract from these cognitive processes and boil down influence to its consequences, an opinion change. Rather than formally describing the intricate processes of influence, influence response function describe only how the opinion of an agent changes as the result of exposure to another person’s views. Bounded-confidence models, in fact, already were formulated with abstract influence-response functions. What we add here is an influence-response function that captures competing models of influence and contains parameters allowing us to switch on and off competing model assumptions. With the empirical study, we estimated these parameters and fed them back into the model to study the macro-consequences of the empirically observed influence-patterns.
In the next section, we introduce the research problem with an ABM illustrating the complexity of the link between filter bubbles and opinion polarization. Section 3 discusses the various models of social influence which are thereafter generalized into one formal model and translated to hypotheses in Section 4. Sections 5 and 6 summarizes the empirical methods and results of two survey experiments we ran, testing individual responses in an isolated, single-argument exchange. We investigate the implications of these findings for the conjecture that filter bubbles promote polarization in Section 7. The paper concludes with a discussion of the study’s findings and an outlook on future research in Section 8.
Social Influence in Filter Bubbles
Online media have become an integral part of people’s information diets. With this trend has come the fear for the algorithms governing public life on the Internet. In particular, algorithmic filtering of information on social media platforms like Facebook, Twitter or YouTube has attracted concern for its potential to contribute to the polarization of political opinions—a prediction that has been called the “personalization-polarization hypothesis” (Keijzer & Mäs 2022). Users, interacting in their own bubble, are exposed only to content supporting their interests, products close to their desires, and opinions close to their beliefs. According to the personalization-polarization hypothesis this can give rise to a feedback-loop in which diminishing exposure to diverse and balanced information will lead to ever-increasing confidence in our own worldview, or even radicalization, further limiting exposure to foreign opinions in the process (Bruns 2019; Keijzer & Mäs 2022; Pariser 2011).
Models of social-influence dynamics in networks have demonstrated that alternative assumptions about how individuals adjust their opinions after exposure to online content generate markedly different predictions about the emergence of opinion polarization (Mäs & Bischofberger 2015). Though there are many subtly different models of social influence, they can roughly be categorized into two families: models of assimilative influence, and models with repulsive influence (Flache et al. 2017).1 Both families have a long tradition in the theoretical and in the empirical literature and are also not necessarily mutually exclusive (see Section 3). The models do differ, however, in their predictions about opinion dynamics when users are exposed to others with divergent opinions.
To illustrate the difference between models of assimilative and models of repulsive influence, consider the following simple agent-based model.2 Fifty agents are assigned a random opinion between 0 and 1. At any point in time, one agent is randomly picked from the population and marked as the receiver of information, much like logging onto a social media website. Next, the sending agent is picked by the personalization algorithm. To do so, we create a bubble around the receiving agent containing a certain subset of the agents in the population. These are the agents whose opinions are most similar to the receiver as viable candidates. The size of this subset is the size of the filter bubble in our model. From the set of agents within the bubble, a sending agent is picked who emits their opinion position to the receiver. The receiver updates their current opinion position, taking the difference to the sending agent into account. If sender and receiver agree, the receiver will be open to influence and adjust their opinion in the direction of the sender’s opinions. The more sender and receiver disagree, however, the less the receiver will be open to influence. When the two disagree too much, the receiver will even be repelled by the sender’s opinion and adjust their own view away from the sender’s view. This process is repeated until all agents completely agree on the discussed topic or are unable to exert influence on each other any further.
Using this model, we can determine the effect of different bubble sizes on the emergence of opinion polarization. What is more, we can vary the maximum acceptable opinion difference between the updating agent and the source of information, before influence turns from positive to negative. This will give us a good intuition about the relationship between filter bubbles, repulsion, and opinion polarization. The opinion of the receiving agent after interaction is a function of the opinion difference to the sender, guided by parameter that varies the maximum acceptable difference. As the opinion difference at which repulsion is triggered becomes smaller, more interactions will result in interaction events where agents distance themselves from each other.
The outcome of 320 independent simulation runs of the model described by three measures of polarization (Bramson et al. 2016). Spread reports the distance between the minimum and maximum observed opinion in the graph. Dispersion refers to the absolute average deviation from the mean. Coverage considers the distribution of agent positions over the entire spectrum by reporting the proportion of unique positions on the opinion scale as covered by the agents.
The plots in Figure 1 illustrate the counter-intuitive effect of the size of the filter bubble. When bubbles are small (i.e., agents live in a highly personalized information system), varying the repulsion threshold hardly affects the spread and dispersion of opinion positions. Agents converge to one position with the neighbors in their own bubble, and the bubbles co-exist relatively closely to each other on the scale. Only when repulsive influence is triggered already by relatively small disagreement, and thus occurs at a high rate, the figure shows that the opinions start to cover larger shares of the spectrum. In the mid-range of repulsion values we see that the rise in spread of opinions precedes the rise in dispersion. This suggests that there is within-bubble convergence of opinions, but the rare between-bubble interactions of agents (e.g., in the early stages of the run), result in repulsion, pushing the bubbles apart slightly. At the extreme, repulsive interactions overpower the dynamics of within-bubble convergence, and two clusters are formed at the poles of the opinion scale. The difference between the two most extreme opinions is maximal (indicated by the maximum value of spread), and coverage drops slightly, meaning that there are less opinion positions occupied in the middle range of the scale.
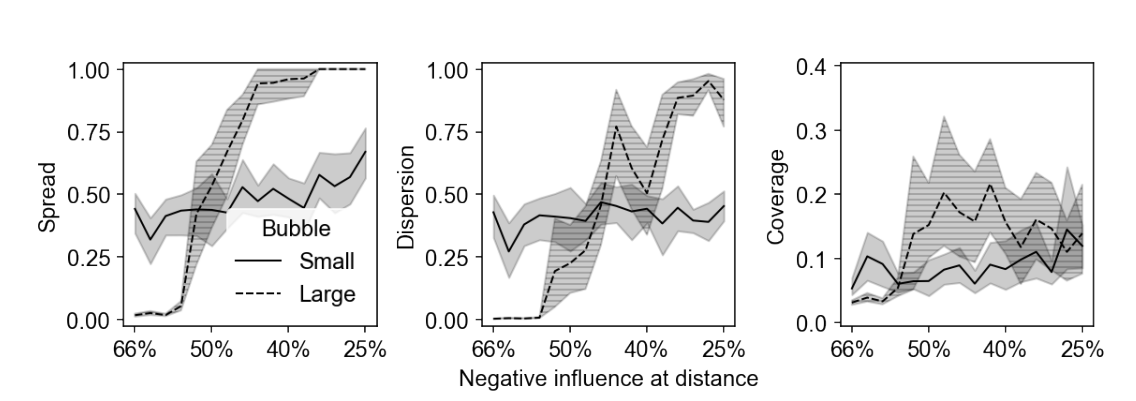
When agents live in very large bubbles and can communicate with about 80 percent of all other agents, a different pattern emerges. When the repulsion threshold is high, interacting with distant others is relatively harmless. Ultimately, agents find consensus, even with those agents who have not (always) been in their bubble. As the threshold for repulsion lowers, there is a point at which the agents find a radically different equilibrium: polarization, a state in which the population falls apart into two subgroups with maximally distant opinions. In between these two equilibria is a phase that could be characterized as diversity—illustrated by the spiking values of coverage—but the transition between the two extremes happens much faster than in the small bubble case.
The simulation experiment conveys an important insight. While small filter bubbles are often considered problematic, our results illustrate that social media without personalization may not always help to prevent polarization. In fact, removing personalization completely might lead to more negative-influence events and, as a consequence, growing polarization. To find out when and under what conditions filter bubbles contribute to polarization, one needs to know more about how opinion disagreement affects how individuals adjust their opinions after interaction. In the next section we review the literature for the various ways in which people might respond to others’ opinions.
Micro-Foundations of Polarization
Assimilation
When discussing a political issue, individuals communicate information, potentially exerting assimilative influence (or positive influence) upon each other. According to classical models of social influence, after communication of opinion position or arguments, interaction partners are assumed to move closer to each other (French 1956; Friedkin & Johnsen 2011). There are many explanations for why people display such behavior (for a review, see Wood 2000). For example, social exchange theory posits that people are reward seeking, and are sensitive to positive reinforcements that arise from complying to the opinion position of the interaction partner (Blau 1964; Homans 1958). This reward seeking behavior can arise from either learning, operant conditioning (Akers et al. 1979; Homans 1958), or forward-looking rational behavior (Blau 1964). The positive reinforcements from compliance appear in the form of between-individual social cues or as within-individual rewards for resolving cognitive dissonance (Festinger 1964; Groeber et al. 2014).
Others have stressed the importance of uncertainty about the individual’s initially held belief (Bikhchandani et al. 1992; Koslin et al. 1967). Individuals learn from information communicated during social interaction and feel that they are approaching true judgement, hence adjusting their opinion towards a given argument. The more uncertain an individual is about their position in the opinion spectrum, the more one will rely upon social cues (Denrell 2008). These cues may, in turn, co-vary with the attractiveness of the source based on ex-ante opinion difference or knowledgeability/status of the interaction partner (Bikhchandani et al. 1992; Koslin et al. 1967). Initially held beliefs thus feed back into the individual inclination to adopt the other’s position (Byrne 1961). This assumption is known as the moderated assimilative influence hypothesis: the larger the ex ante opinion difference between a source and a receiver, the smaller the portion of disagreement that the receiving party wants to minimize (Takács et al. 2016).
Various studies reported empirical support for assimilative influence (for reviews, see Falk & Scholz 2018; Cialdini & Goldstein 2004; Wood 2000). Tests of the moderated assimilative influence hypothesis are scarce and also yielded mixed results (Koslin et al. 1967; Takács et al. 2016).
In an attempt to understand the opinion dynamics and cultural clustering observed in many modern societies, scholars wondered “If people tend to become more alike in their beliefs, attitudes, and behavior when they interact, why do not all such differences eventually disappear?” (Axelrod 1997 p. 203). For models assuming only assimilative influence between nodes integrated in a well-connected graph, consensus is the only attainable outcome (Abelson 1964; DeGroot 1974; French 1956; Friedkin & Johnsen 2011; Harary 1959). Therefore, many micro-level assumptions have been developed that impede or alter interpersonal influence. Generally, they fall apart in mechanisms of distancing (discussed in Section 3.1), and of bounded confidence.
Bounded confidence is the notion that people tend to accept information that is more or less in line with their initially held belief, and ignore information that deviates too much from their own view. It follows from social judgment theory (Sherif & Hovland 1961) and the notion of confirmation bias (Nickerson 1998). Like moderated assimilative influence, the probability of accepting an argument decreases with opinion difference on the outset, but these theories assume a (strict) maximally tolerated opinion difference. Once the foreign opinion falls into the distant latitude of non-commitment, the receiver’s opinion remains unchanged (Perloff 1993). This idea has been operationalized predominantly as a strict threshold after which there is no influence possible at all (Deffuant et al. 2000; Hegselmann & Krause 2002), but versions of this model with smooth, arguably more realistic, non-linear influence decrements (Deffuant et al. 2004, 2023; Kurahashi-Nakamura et al. 2016) or noisy interaction (Mäs et al. 2010; Steiglechner et al. 2023) have been proposed as well.
Even though the discussed theories are based on different psychological mechanisms, their prediction is the same: opinions of similar interaction partners converge. They are therefore subsumed into the mechanism of conditional assimilation in Section 4.
Distancing
In addition to the proposed mechanisms of assimilative influence, under certain circumstances discussants may increase their opinion distance. We discuss here the most prominent distancing mechanism: repulsion (or negative influence / rejection).
When two discussants hold too dissimilar opinions, interaction may result in divergence rather than assimilation or stability. This mechanism is know as repulsion (Macy et al. 2003). Along similar lines as the arguments for bounded confidence, it has been reasoned that an individual may encounter arguments that are so different from their opinion such that the argument falls in their latitude of rejection (Jager & Amblard 2005; Perloff 1993; Sherif & Hovland 1961). One will not only reject the given argument, but values it so low that it is taken as indicative for the validity of the initially held belief, strengthening commitment to this belief.
Empirical evidence for repulsion is not unequivocal since some studies do (e.g. Berscheid 1966; Bail et al. 2018; Liu & Srivastava 2015) and others do not (e.g. Lemaine 1975; Takács et al. 2016; Van Knippenberg et al. 1990) find support for distancing effects from interactions between strongly dissimilar discussants. A couple of (methodological) issues have been raised that might explain this inconsistency (an extensive discussion of the critique can be found in Krizan & Baron 2007; Takács et al. 2016). Some studies do not allow for separating positive from repulsive influence, either because they use an in-group/out-group block design (Hogg et al. 1990; Lemaine 1975)3 or because they use a statistical method not suitable for explicitly testing the repulsive influence hypothesis (Levendusky 2013; Takács et al. 2016). Repulsion should only occur amongst very dissimilar discussants, so studies that use convenience samples of, for example, college students might not observe repulsion because of a lack of opinion heterogeneity in homogeneous populations. Lastly, what issue is chosen for the manipulation could also bias the results. Issues that the respondents find too trivial could be unable to trigger repulsion because the respondent simply does not care enough.4 On the other hand, issues that respondents are highly engaged in might not be suited to measure influence at all, since the respondent experiences a high level of certainty about their initial opinion. Recent studies on political polarization in the context of online social networks however did provide indications for divergence resulting from argument exchange between people that identify with dissimilar political parties (conservatives and republicans) in the US (Anspach 2017; Bail et al. 2018).
But not only studies that did not find repulsion are prone to methodological biases. Berger & Heath (2008) showed that conformity as well as nonconformity to an outgroup may occur as a result of social desirability, but leaves the actual ‘private’ opinion untouched. Moreover, opinion shifts may be observed in an immediate pretest-posttest design, but are not always long-lasting or stable (Mazen & Leventhal 1972).
Alignment
Observing opinion shifts away from an information source does not necessarily imply that individuals are influenced by the position of their interaction partner on the given topic. An alternative processes of influence is possible: an interaction partner may convey a signal about the state of opinion coherency in the world. This line of reasoning argues that opinion shifts in either direction result from a tendency to align (dis-align) with in-group (out-group) members (e.g. Baldassarri & Gelman 2008; Banisch & Olbrich 2019).
People generally strive for coherence in terms of beliefs, preferences and opinions and in doing so strive to belong to a distinct social group (Bourdieu 1984). Adapting behavior and beliefs, a social mimicry, has been identified as mechanism through which individuals aim to affiliate themselves with certain others or social groups (Cialdini & Goldstein 2004). We therefore expect a stronger tendency to conform to, or diverge from, the opinion of the sending actor once the social group that the sending actor belongs to is known.
In online settings, identity signals may disappear, alleviating discussions from argument attribution to social identities and distancing from a source through a mechanism of alignment. The web is an environment celebrated for liberating interactions from clear group or status signals (Postmes et al. 2001). On forums or open social media platforms, identity signals are often reduced to merely a (nick)name and perhaps a profile picture. The content of the argument can be judged independently of prejudice about the sender’s beliefs or credibility.
However, there is a powerful tool in argumentation that signals identity through argument wording: the moral foundations theory of political argumentation (Haidt 2007). In the absence of a ground truth, political opinions form based on judgements rooted in intuition and reasoning (Graham et al. 2013). Between individuals, however, there is considerable heterogeneity when it comes to the particular moral foundation they regard as most important and will use to source their convictions (Graham et al. 2009). Moral foundations theory (or five foundations theory of intuitive ethics) distinguishes five dimensions along which people tend to argue: harm/care, fairness/reciprocity, ingroup/loyalty, authority/respect, and purity/sanctity (Haidt 2007). The relative importance that people tend to attribute to each of these dimensions correlates with the omnipresent single dimensional representation of political position ranging from left-progressive to right-conservative (Graham et al. 2009). In an attempt to explain opinion differences between conservatives and liberals in the United States, Graham et al. (2009, p. 1040) conclude that “[...] liberal morality was primarily concerned with harm and fairness, whereas conservative moral concerns were distributed more evenly across all five foundations.”
To understand opinion dynamics through mechanisms of alignment, we employ moral foundations theory in this research. We investigate whether given the same argument, people from different political ideologies may still increase their opinion distance on a given topic more than people from similar political ideologies. What is more, we assess whether in exchanges between two individuals, the moral root of an argument may serve as an identity signal of the sender and elicit a response of opinion alignment.
An Integrated Model of Social Influence
If one seeks to link the macroscopic outcomes of polarization or consensus formation to their potential micro-level causes covered in Section 3, competing micro-models need to be integrated into a single framework where empirically calibratable parameters allow one to capture the alternative models.
Establishing a connection between (formal) theory and empirical settings is not an easy task for two reasons. First, the fact that opinions are limited to maximums on both sides of a continuous opinion scale creates non-linearity or even non-monotonicity that is hard to account for elegantly. In fact, this is perhaps where the theoretical ideal type deviates from the crude empirical reality. Does extremity of beliefs truly have a maximum? Do people who place themselves on a maximum of an opinion scale hold the most extreme opinion possible? Here, we assume that they do not, and model the opinion shifts even beyond the scale’s measurable boundaries.
The second issue with calibrating formal models of opinion change on empirical data has to do with the distance that the receiver in an exchange perceives to the source of influence. This distance is a function of the self-perceived opinion position and the receiver-perceived position of the sender, and, given a specific combination of assumptions about micro-level processes of social influence, should regulate the influence direction as experienced by the receiver. To complicate matters even more, both positions remain subject to censoring. Data containing own and others’ opinion position and perceived distance and dissimilarity to a source of influence is hard to find in the field, and thus all positions need to be gathered through asking respondents directly. Because self-assessment will produce considerable measurement error, the statistical test needs to be suitable for testing small effects from complex influence response functions.
The model
The model is inspired by Flache (2018a), but variations on the same idea have appeared elsewhere in the social simulation literature as well (e.g. Mäs et al. 2014; Flache 2018b; Jager & Amblard 2005). The model deviates from its predecessors in its capacity to disentangle the influence weight and threshold for repulsion, as we will see later in this section.
Consider a population of \(N\) agents, in which each individual \(i\) at timepoint \(t\) holds an opinion \(o_{i,t}\) in the opinion spectrum \([0,1]\). When presented with the opinion \(o_j\) of any alter or source \(j\), \(i\) forms the new, updated opinion \(o_{i,t+1}\):
| \[ o_{i,t+1} = o_{it} + \Delta o_{it} = o_{it} + \alpha w_{ijt} (o_{j}-o_{it})\] | \[(1)\] |
Where \(\alpha\) is the rate of opinion change (i.e., the persuasiveness of the presented argument) expected to be \(0\leq\alpha\leq1\), and thus assumed to be intrinsic to the argument independent of perceived distance to that opinion. The direction and strength of the opinion shift is determined by the weight function \(w_{ijt}\). The weight is separated from the argument’s intrinsic persuasiveness. Thus, we can vary its persuasiveness independently from a term that reduces the strength of influence with increasing opinion distance. To create a model that is able to transition smoothly between pure assimilative, moderated positive, and repulsion, the following weight function is introduced:
| \[ w_{ijt} = 1-\gamma|o_{j}-o_{it}|\] | \[(2)\] |
Equation 2 defines the influence weight as a monotone function of opinion distance. The moderating effect of opinion distance is captured by \(\gamma\), which can adopt any real number. It is likely, however, that the value in many real life settings is positive and in the single digit range, representing a reduction of influence strength with opinion distance. Figure 2 a shows how different values of \(\gamma\) affect the influence weight as a function of initial opinion distance, assuming \(o_j=0\) and \(\alpha=1\). To test for the type of social influence, \(\gamma\) offers a straightforward interpretation. When \(\gamma=0\), there is only assimilative influence—the expected opinion shift is proportional to the size of disagreement at the outset. This encompasses, for example, dynamics of averaging (when \(\alpha=0.5\)) and copying (when \(\alpha=1\)). When \(0<\gamma<1\) we speak of moderated assimilative influence—the expected opinion shift is weaker the larger the a priori opinion difference. When \(\gamma>1\) we can observe moderated positive influence and repulsion. In this case, the expected opinion shift is weaker the larger the opinion difference, until the critical value of \(1/\gamma\), where after social influence becomes negative.
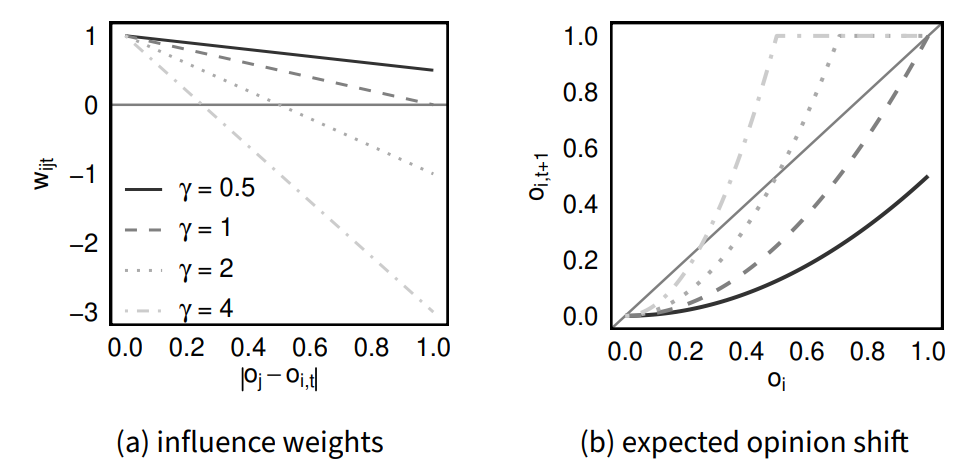
Finally, \(o_{i,t+1}\) is truncated such that it does not exceed the opinion bound \([0,1]\):
| \[ o^T_{i,t+1} = \begin{cases} 1, & \text{if } o_{i,t+1} \geq 1\\ 0, & \text{if } o_{i,t+1} \leq 0\\ o_{i,t+1} & \text{otherwise} \end{cases}\] | \[(3)\] |
Notice that for convenience we henceforth use \(o_{i,t+1}\) as shortcut for the truncated result \(o^T_{i,t+1}\). This truncation is a necessary step for two reasons. First, non-truncation could create runaway dynamics where the agents who diverge become inaccessible early on in the process. Second, and perhaps more importantly, there is a clear relation to opinion measurement. When opinions are measured (e.g. in a survey) or inferred (e.g. from text analysis) they will have to be expressed on a scale with an upper and a lower bound. As such we cannot observe a strong persuasive ‘pull’ when opinions are similar, nor a strong ‘push’ when opinions are (almost) maximally different.5 Figure 2 b shows the predicted opinion \(o\) at time \(t=t+1\) as a function of \(o_{it}\), for different values of \(\beta\).
Model extensions for social influence and moral foundations
Equation 1 expressed the minimal model for describing within-individual opinion change. It is possible to extend this model for individual heterogeneity in responses as a result of some characteristic of the individual or stimulus. When extending the model, it is important to decide what part of Equation 1 is affected by the added information: the persuasiveness of the argument or the shape of the weight function for opinion distance. Let’s illustrate this by using two different examples: modeling social influence and moral foundations.
As argued in Section 3, individuals might be more inclined to adjust their opinion towards the source \(j\) when \(i\) perceives \(j\) as close on the social distance dimension.6 This idea is operationalized in Equation 4, as a term that affects the influence weight \(w_{ijt}\) through separation of the parameter \(\gamma\) into \(\gamma_0\) (for the general effect of distance) and \(\gamma_1\) (for the effect of out-group influence). A negative \(\gamma_1\) term lifts the slope of the influence function upwards, making individuals more susceptible for influence from in-group members regardless of their a priori opinion difference. In other words, individuals will consider the social distance to the source in the shape of the response function, but not in the persuasiveness of the argument. The weight function—using the Kronecker Delta function on the agents’ group membership \(e \in \{0,1\}\)—thus becomes:
| \[ w_{ijt} = 1-\gamma_0|o_{j}-o_{it}| + \gamma_1(1 - \delta_{e_i e_j} ) |o_{j}-o_{it}|\] | \[(4)\] |
The moral foundations literature suggests that arguments built on certain moral foundations are more persuasive for some than for others. In particular, individuals who identify as politically more liberal are more responsive to arguments rooted in fairness and harm. To model the difference in perceived persuasiveness of the argument, we separate the persuasiveness parameter into a general term (\(\alpha_0\)), and one that uses the agent’s group membership \(e\) (\(\alpha_1\)):
| \[ o_{i,t+1} = o_{it} + \alpha_{0} w_{ijt} (o_{j}-o_{it}) + \alpha_{1} ( 1 - \delta_{e_i e_j} ) w_{ijt} (o_j - o_{it})\] | \[(5)\] |
Equation 5 uses the same weight term twice, but for both levels of persuasiveness as modeled by \(\alpha_0\) and \(\alpha_1\).
Hypotheses
The classification of behavioral responses from the micro-foundations discussed in Section 3, and the subsequent integration of those foundations into a single formal model in Section 4 allows the formulation of a series of hypotheses that describe the shape of the response function. In other words, the values of \(\alpha\) and \(\beta\) as described in our model allow us to differentiate between the types of influence experienced by the actors subject to influence. For models that separate the values of our parameters for different groups (e.g. when \(\alpha\) is split into \(\alpha_0\) and \(\alpha_1\)), the hypotheses refer to the combined value for the respective group. All but Hypothesis 4 have been pre-registered with the Open Science Framework: https://osf.io/dy2z6/.
- H1
- Individuals decrease distance between their own opinion and the opinion of the source of influence, such that \(\alpha>0\) and \(\gamma\geq0\) (assimilative influence)
- H2
- An individual’s distance between their own opinion and the opinion of the source moderates the degree of social influence such that \(\gamma>0\) (moderated assimilative influence)
- H3
- If an individual’s distance between their own opinion and the opinion of the source is sufficiently large, influence is negative, such that \(\gamma>1\) (assimilative and repulsive influence)
- H4
- Argument persuasiveness is increased by alignment of the moral foundation of the given argument with ideological orientation, such that \(\gamma\) for arguments of a moral foundation aligned with an individual’s political ideology is larger (moral foundations)7
- H5
- If an individual belongs to the same opinion cluster as the source, the individual proves more receptive to the message, such that \(\alpha\) is larger in interactions with others who are perceived to be ideologically closer (social influence)
The Empirical Tests
Study 1 – Standardized arguments and moral foundations
Using targeted advertisement on Facebook we recruited 199 participants residing in the Netherlands who had a particular interest in politics.8 There are two major advantages of this approach. Firstly, we sought to sample a high number of pairs with a high pre-interaction opinion difference. Repulsive influence is pivotal to the predictions of society level polarization models, but proved hard to observe empirically. In order to test whether repulsion actually occurs we need to look at those interactions where one would expect it to be strongest. A random draw from the general population would have to be huge in order to find a sufficient number of pairs where repulsion can be tested (see the power analysis in the online supplementary materials on Open Science Framework: https://osf.io/dy2z6/), and would create an unacceptable amount of redundancy and burden on the side of the respondents. Targeting social media users who have expressed interest in politics will likely over-sample opinionated individuals. Furthermore, theoretical studies show that actors with strong opinions can have a more profound impact in the network at large (Deffuant et al. 2002). Secondly, sampling through Facebook ensures a high level of ecological validity. In the Netherlands, 10.8 million people actively use Facebook (of which 7.6 milion people pay a visit to the platform on a daily basis), which amounts to about 63% of the Dutch population (Newcom 2018). Sampling through Facebook thus ensures high applicability of our findings to actual participants of discussions in online social networks.
We aimed to measure respondents’ opinions and their shifts on two topics: government spending on development aid, and tax-deals between the government and multinationals. These topics were chosen for various reasons. Opinion directions on both topics are generally aligned with political identity, but are not too divisive such that they prohibit opinion shifts in either direction. Moreover, government spending on development aid is a topic for which pro and contra arguments can be formulated for either political position and the arguments for tax-deals can be varied along both leftist and rightist moral foundations.
For each topic, two short texts were constructed of between 100 and 200 words: one arguing in favor and one arguing against government action on that topic. Each argument was infused with words from the moral foundations dictionary (Graham et al. 2013) that should appeal more to either liberals or conservatives. The arguments were posted to Facebook, and screenshots of those arguments were shown to the participants. Participants were randomly assigned to one of four conditions: pro or contra argument with liberal-appealing moral foundations, or a pro or contra argument infused with words from the conservative-appealing moral foundations dictionary. All original stimuli and English translations are available in the online supplementary materials on Open Science Framework: https://osf.io/dy2z6/.
To measure the respondent’s stance on the two topics, we included a measure of self-reported opinion following the question: ‘what is your stance on government spending on development aid / tax-deals with multinationals?’ Answers were recorded using a slider scale ranging from strongly against to strongly in favor. The respondent’s opinion was measured before and after the stimulus. To mitigate effects of social desirability bias, we gave the respondents a short task in between the first measurement and the stimulus. To test for lasting effects of opinion change, we administered an additional short survey roughly one week after the first survey and using the same opinion measure.
Study 2 – Peer-influence and social distance
The arguments in Study 1 were constructed by us rather than participants, which may have affected how believable the arguments appeared to the respondents. Furthermore, we were unable to vary social distance either, to avoid deception. We therefore asked all our respondents from Study 1 to express their opinion as a short Facebookpost-like statement. These statements—in combination with the expressed party-identification of the respondent—were then used as stimuli for participants in Study 2. In order to measure the perceived social distance between the sender and receiver of the argument, we asked the receivers to indicate where they believe the sender of the argument would place themselves on an ideological identification scale, between ‘Very leftists’ and ‘Very rightist’. Social distance was calculated by taking the absolute difference of self-reported ideological identification of the receiver and perceived ideological identification of the sender.
The same sampling procedure was used as in Study 1. This time, a subset of the respondents was routed to a control condition in one of the two topics, to quantify the accuracy of the opinion measures. In total, 272 respondents took part in the survey. We did not administer a second survey testing for lasting effects.
Data collection and quality
Two diverse sets of respondents were obtained in two recruitment periods in February and October of 2020. Figure 7 in Appendix A provides an overview of the two studies, and the sequence in which respondents were exposed to stimuli and provided their answers.
The recruitment method and the fact that little is known about differences in demographic characteristics between Facebook users and the general Dutch population may pose challenges to the generalizibility of our findings. In our sample, we observe that the age distribution is strongly bimodal, with most respondents being either between 45 and 75 years old, or below 30. Only a few participants were aged between 30 and 45. In both studies, slightly more females than males participated (56.4 percent in Study 1 and 62.9 percent in Study 2), and participants were predominantly highly educated. Participants indicate to be rather active on social media, with 166 minutes spent on social media per day on average in the sample for Study 1 and 149 minutes in Study 2. There was considerable variance in self-reported ideology in both studies, and diversity in terms of party preferences. Both samples contain supporters of 12 different parties, but the most popular party in both samples is the social-democrat green party GroenLinks. Voters of that party are rather over-represented compared to the relative sizes of the electorates among the general public. It is unclear whether this over-representation is caused by this particular group being more active on social media, participation in our study appealing to particular people, or some arbitrary decision in the advertising market algorithm. It is likely to be the result of the combination of all of those factors.
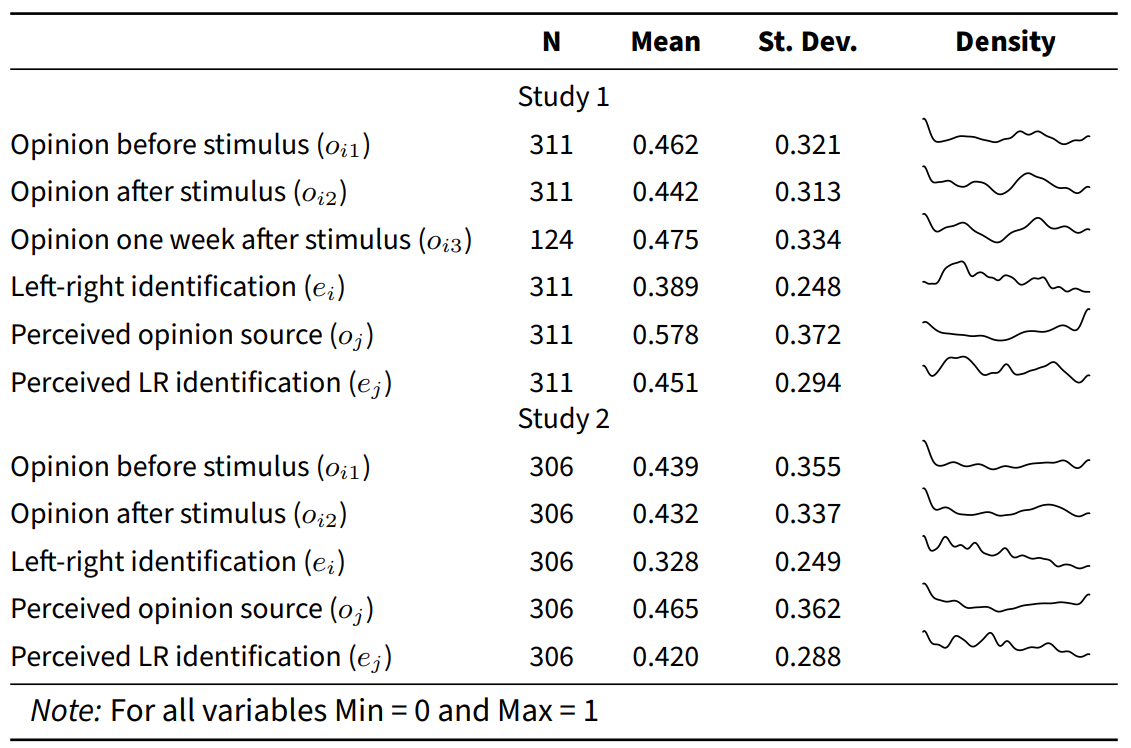
The demographic characteristics of two samples deviate slightly but noticeably. The respondents in Study 2 were older (48 and 56 years old on average; \(t(298.2)=-4.249\), \(p<.001\)), and did not spend significantly less time on social media (\(t(264.48)=1.353\), \(p=0.177\)). Their political preferences were comparable, but Study 2 contained more individuals who described themselves as leftist than Study 1 (\(t(334.94)=2.361\), \(p=0.019\)). Because the two samples were gathered with the same recruitment procedure, the between-sample differences have a relative interpretation. One interpretation of the differences is that they may reflect actual changes in the population. For example, they could reflect a change in popularity of Facebook among certain groups or a change in the attitudes of the Dutch electorate. Given the short amount of time between administering the two samples, the relative under-representation of young participants is unlikely to be a consequence of decreased popularity of the platform. A more probable explanation is that the algorithm governing which users saw the ad introduced bias and homogenized the potential audience. The differences between the two samples is not problematic to the extent that it prohibits meaningful analyses here, but the introduction of bias illustrates a larger problem that may affect studies using data gathered in similar ways. The advertisement exposure optimization algorithm can introduce an unobserved homogeneity bias in the sample. Descriptive statistics of the cleaned sample, for the variables used in the analysis of Study 1 and 2, are given in Table 1.
When conducting survey experiments online, data quality is a concern. To check whether respondents filled in the survey and paid attention to the texts and directions included in them, we monitored the time they spent in the survey in general, and on the pages with the stimuli in particular. We also included a quiz at the end of the survey that assessed whether they paid sufficient attention and asked the respondents about their enjoyment of the survey. Using a combination of all measures for engagement—timing, enjoyment and the attention quiz—we formulated five criteria for exclusion of responses. We excluded everyone who had (1) completed the survey in less than eight minutes, (2) indicated that they did not enjoy the survey, (3) answered two out of four questions incorrectly, (4) first-clicked something in less than three seconds or more than two minutes on the page of the first stimulus or (5) on the page of the second and last stimulus. In total, 35 (Study 1) and 42 (Study 2) respondents met one of those criteria and were excluded from the final dataset.
Statistical approach
We used a statistical approach that allows for direct testing of the theoretical model on the empirical data obtained in our experiment. In order to do so, we had to solve two issues of measurement and inference: censoring of extreme opinions, and interdependence of persuasiveness and influence weights. First, the theoretical model assumes that there exists a latent opinion dimension that is larger than the measurable opinion dimension (which is bounded by extreme values). In other words, repulsion can be ‘felt’ by agents with large opinion differences, but not expressed due to the bounds of the opinion measurement instrument. Traditional methods will therefore sometimes underestimate the true influence weights. Second, in the theoretical model, the two core parameters, for persuasiveness of an argument and shape of the influence weight, cannot be interpreted independently. The model thus requires reformulation to account for this interdependence. An in-depth description of how to link theoretical models for social influence to empirically estimable models is given in Appendix B.
The statistical models were estimated using Bayesian estimation for censored data and evaluated using the Watanabe–Akaike (or ‘widely applicable’) information criterion (WAIC) and the expected log pointwise predictive density (elpd) of the Leave One Out cross-validation procedure (LOO) (Vehtari et al. 2017).
Results
Study 1
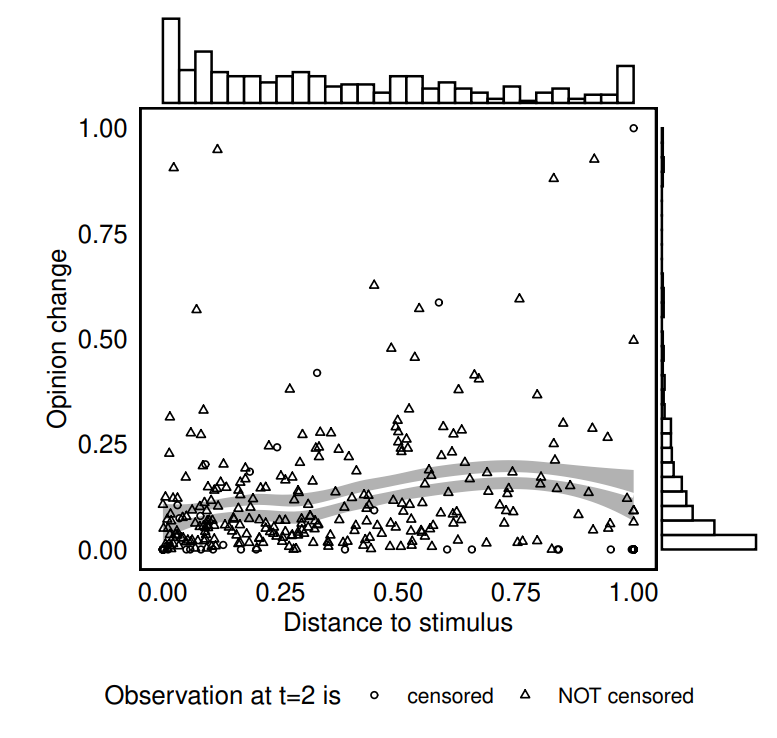
The respondents in Study 1 received arguments infused with words from the moral foundations dictionary belonging to either the foundations harm and fairness, or to loyalty, authority and purity. The recruitment procedure aimed to recruit people with strong opinions, leading to large opinion differences and sufficient opinion change. Figure 3 shows that this approach was successful. The (perceived) opinion distance to stimulus is a bipolar distribution that was slightly right skewed.9 There appeared to be sufficient variance to model the effect of distance. The amount of absolute opinion change was 13 percent on average, but distributed with considerable right skew. The difference between the indicated opinion before and after the stimulus increased slightly at larger distances to the stimulus.
The first model was fitted with the pooled data from the argument exchange on development aid and tax deals where only the general effect of argument distance is considered (see Table 2, Model 1). At most, the predicted opinion shifts in either direction are about 22% of the distance between the opinion position of the receiver before the argument and the perceived position of the argument. The actual observed shift will depend on the perceived distance between the own position and the position of the argument, as modeled by the distance parameter. According to the simple model 1, the distance at which the receiver is unaffected by the argument is at \(\beta / \alpha = 0.221 / 0.276 \approx 80\%\) of the opinion range. Opinion differences beyond that point may have resulted in negative opinion shifts / distancing. This means that only interactions between individuals with rather extreme opinions resulted in opinion adjustments away from the sender.
| Model 0 | Model 1 | Model 2 | ||||
| Estimate | SD | Estimate | SD | Estimate | SD | |
| persuasiveness (\(\alpha\)) | 0.041 | 0.036 | 0.209 | 0.103 | 0.533 | 0.131 |
| distance (\(\beta_0\)) | 0.259 | 0.152 | 0.265 | 0.143 | ||
| moral (\(\beta_1\)) | -0.437 | 0.116 | ||||
| right (\(\beta_2\)) | -0.652 | 0.176 | ||||
| moral \(\times\) right (\(\beta_3\)) | 0.843 | 0.238 | ||||
| \(\sigma\) | 0.212 | 0.011 | 0.216 | 0.012 | -0.203 | 0.010 |
| \(\text{elpd}_{\text{LOO}}\) | 143.402 | 23.428 | 143.282 | 24.266 | 147.872 | 23.300 |
| WAIC | -286.835 | 46.845 | -286.623 | 48.509 | -295.809 | 46.590 |
| N | 311 | 311 | 311 |
Model 1 averages all responses, but the set-up of Study 1 allows to differentiate persuasiveness of an argument as a function of moral foundation of the arguments in relation to the ideological identification of the respondent. As discussed in Section 3, arguments can be used to signal why it is important to support a position, extending beyond a simple piece of ‘objective’ information. By appealing to one of five moral foundations, they present reasons to support a certain position in relation to a value system that the receiver supports. Previous work showed that ideologically leftist individuals are more likely to respond to arguments that appeal to the dimensions harm and fairness. Model 2 was used to test precisely this claim, as one would expect that in this response model, the moral foundation of an argument will affect the perceived persuasiveness. The single \(\alpha\) term for argument persuasiveness is therefore supplemented with three extra terms: rightist-appealing morality of the argument (moral), respondent’s placement on the left-right spectrum (right), and an interaction of the two former terms (moral \(\times\) right).
The goodness of fit statistics from Model 2 in Table 2 indicate that the model is an improvement upon the first. Furthermore, the estimates point in the direction that moral foundations indeed mattered for the subject’s response to an argument. The general persuasiveness of the argument increased substantially, and the \(\beta\)s that define individual responses followed suit.10 The unadjusted value of \(\alpha\) indicates the persuasiveness of an argument with leftist moral foundations (i.e., that appeal to harm and fairness) for someone who identifies as very leftist.11 In relation to the distance term, we see that those individuals are predicted to always adjust their opinion towards the argument (because persuasiveness \(>\) distance), even if their initial distance is maximally large.
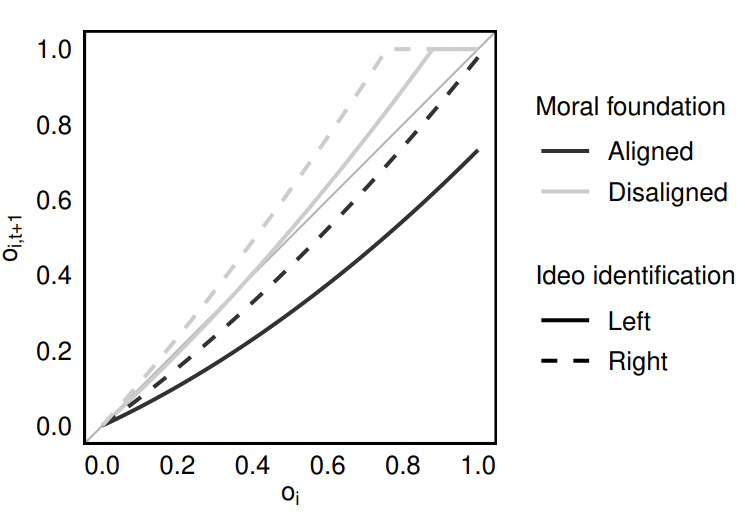
For rightist individuals, the effects are somewhat harder to interpret based on the table alone. Figure 4 aids the interpretation by plotting the predicted response functions based on the estimates from Model 2 in Table 2.12 Respondents who identified as politically right-wing displayed a pattern that is remarkably similar to their left-wing counterparts. When the moral foundation of the argument was aligned with their ideological orientation, the predicted opinion shift remained positive regardless of the distance to the stimulus. When the same argument was presented, but infused with moral foundations that did not align with the ideological identification of the respondent, the opinion was adjusted away from the source. For respondents identifying as maximally right-wing, presented with an argument infused with words that appeal to the harm and fairness foundations from the moral foundations dictionary, the model implies that they will always move away from the source, regardless of the amount of agreement with the argument pre-interaction.
One explanation for the relatively large effects of moral foundations is that they affect the perceived position of the argument. If the infusion of aligned moral foundation actually means that the same argument is perceived as closer to the receiver, their co-variance could bias the results of the model overall. A simple way to test this is by means of a Kolmogorov–Smirnov (KS) test for the equality of two continuous distributions. We checked whether the perceived opinion distance (\(|o_j - o_{i,t=1}|\))—operationalized as the absolute difference between the expressed opinion at \(t=1\) and the perceived opinion of the sender of the argument—differed between respondents whose ideological identification was or was not aligned with the moral foundations infused in the argument. Alignment was decided based on a strict cutoff of the ideological identification continuum at the midpoint of the scale. That is, the respondents were grouped into politically left- or right-wing oriented groups.
Though there was a small numerical difference between perceived distance and the alignment of the moral foundation with ideological identification, the KS-test did not consider this difference significant (\(D(311) = 0.080\), \(p = 0.709\)). Hence, the remarkably strong effects of moral foundation infusion cannot be accounted for through spill-over effects from perceived distance. Rather, it seems as though the morally charged arguments actually provided a signal to the respondents to adjust their opinion away from or towards the source.
In the evaluation of a model fit to censored data, it is wise to look at the amount of censoring that was observed and predicted. What is more, the coincidence of the two gives an indication of the goodness of fit.
Before stimulus, at \(t=1\), 59 respondents (19 percent) placed themselves at the end of the opinion spectrum. This number was reduced to 52 (17 percent) post stimulus. In light of the results from the statistical models, this fits the expectation that most interactions will lead to distance minimization. Model 2 from Table 2, though, is slightly more optimistic and predicts that 14 people would place themselves on one of the extreme ends of the scale. Out of those 14, only one respondent was incorrectly placed on an extreme. Considering all responses, the predictive accuracy for placing an observation on an extreme end of the opinion scale at \(t=2\) is 87 percent.
Based on the low number of censored observations, and the reasonably high accuracy in predicting censoring, censoring did not appear to have introduced a problematic bias that rendered the results unreliable.
Measured right after confrontation with the stimulus, respondents’ change in opinion was small. But will these effects be short lived too? To test for lasting effects of opinion change, we invited the participants of Study 1 to take part in a survey a week after the first where they were asked to complete the very same opinion measures again.13. For this group, we fit two sets of models: (1) a replication of the models reported earlier (in Table 2) to check for respondent selectivity in the follow-up survey, and (2) models where the opinion at time \(t=3\) (the follow-up survey) is predicted with their opinion before stimulus and the perceived position of the stimulus.
The first set of models (reported in Appendix D) reveal no major differences between the group that did and the group that did not participate in the follow-up survey. The smaller sample size affected statistical power of the model, so the standard deviations of the estimates are slightly larger, but directionality of the effects remained unchanged.
| Model 0 | Model 1 | Model 2 | ||||
| Estimate | SD | Estimate | SD | Estimate | SD | |
| persuasiveness (\(\alpha\)) | 0.024 | 0.072 | 0.482 | 0.221 | 0.574 | 0.287 |
| distance (\(\beta_0\)) | 0.663 | 0.321 | 0.449 | 0.379 | ||
| moral (\(\beta_1\)) | -0.216 | 0.214 | ||||
| right (\(\beta_2\)) | -0.256 | 0.197 | ||||
| moral \(\times\) right (\(\beta_3\)) | 0.079 | 0.280 | ||||
| \(\sigma\) | 0.247 | 0.023 | 0.255 | 0.025 | 0.086 | 0.243 |
| \(\text{elpd}_{\text{LOO}}\) | 48.683 | 11.172 | 49.225 | 12.251 | 45.520 | 11.607 |
| WAIC | -97.404 | 22.329 | -98.535 | 24.465 | -91.585 | 23.007 |
| N | 124 | 124 | 124 |
The models testing for lasting change, however, revealed a remarkable pattern. As we see in Table 3, the change in opinion appears to have grown not shrunk, if anything, during the one week incubation period. What is more, the effects of argument morality, and its appeal to respondents of certain ideological identity, were no longer meaningful additions to the model, as suggested by the goodness-of-fit statistics. Model 1, the model with argument persuasiveness dependent on perceived distance to the argument, was the preferred model by comparison of the \(\text{elpd}_{\text{LOO}}\) and WAIC statistics. This model predicts that respondents wanted to halve the distance (at most), and that the persuasiveness of the argument was moderated by distance to the argument. The repulsion threshold is expected to lie at 72.9 percent difference, comparable to the threshold in the non-lagged model 1 of Table 2.
Taking all evidence together, we believe there is sufficient support for opinion distance minimization (Hypothesis 1) and the moderating role of opinion distance (Hypothesis 2). We found weak evidence in support of distancing (Hypothesis 3), but not enough to refute the null hypothesis in that case. The influential role of moral foundations of argumentation is clear, and in line with Hypothesis 4. The lasting effects of (social) influence were perhaps the most surprising in Study 1. It appears that influence effects may amplify over time, though the mechanism responsible for that effect remains unknown.
Study 2
Unlike Study 1, Study 2 used participant-generated arguments as stimuli. The objective was to alleviate the respondents from suspicion that the arguments might be fake, used to provoke a certain response, and hence would trigger answers based on social desirability.14 What is more, the arguments provided by the previous respondents could be used to more accurately measure receiver perceived social distance to the sender.
As a first sanity check for the magnitude of expected opinion shifts, we determined whether any opinion change was induced by the arguments, comparing the average opinion shift among subjects that did and did not receive a stimulus. About a third of the respondents were routed to a control condition where they did not receive an argument on one of the two topics. A KS-test for the equality of continuous distributions revealed no discernible difference between the control and experimental conditions (D=0.087, p=0.393). In absolute terms, the amount of variation observed in the experimental condition was not distinguishable from the amount of measurement error or unsystematic variance produced by the repeated measurement. That is unfortunate, as a discriminatory difference would have provided confidence in our manipulation, but not insurmountable. The response function that we’ll test against the data has at least two points at which we predict no change compared to a control conditions (the extreme values) and a third point of neutral response to the stimulus that may exist on the opinion distance scale: the repulsion threshold. The non-linearity of the response function thus prohibits drawing strong conclusions from a simple analysis of variance between the experimental and control groups.
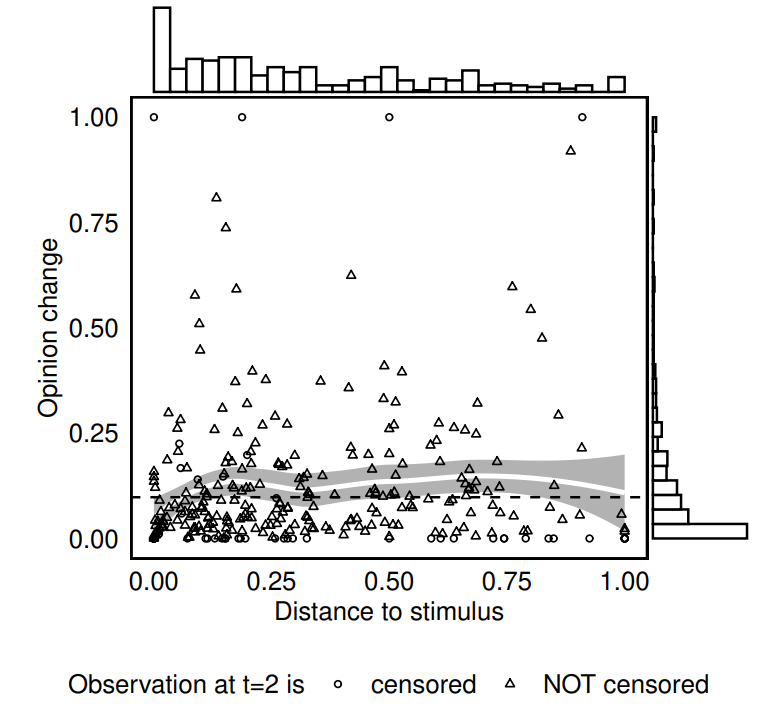
Inspecting the differences in observed opinion change was aided further by plotting the observed shifts by perceived distance to the stimulus. Figure 5 presents such a plot. The distributions of distance to the stimulus and opinion change were, again, skewed in the expected direction, but the amount of change was smaller than in Study 1. The average amount of opinion change seemed to be slightly higher than in the control group (average given with dashed line) for values between 0 and 1, and dipped towards both ends of the distance scale.15
The lack of variation in opinion change between the two conditions provided a first indication that the manipulation might not have been effective, but for a more conclusive analysis we turned to the Bayesian weighted linear influence models for censored data.
The baseline model in Table 4 shows no basic tendency towards distance minimization and a considerable amount of variation around the drawn estimate. The more complex model 1, however, does not appear to improve our fit to the data all too much. Though the average estimates in the posterior distribution take on values that seem comparable to the fitted models from Study 1, their whole distributions have substantial variation around these estimates. The evidence for successful manipulation and distance minimization is too weak to support Hypothesis 1 (\(\alpha > 0\) and \(\gamma\geq 0\)).
| Model 0 | Model 1 | Model 2 | ||||
| Estimate | SD | Estimate | SD | Estimate | SD | |
| persuasiveness (\(\alpha\)) | -0.042 | 0.051 | 0.176 | 0.136 | 0.179 | 0.138 |
| distance (\(\beta_0\)) | 0.356 | 0.212 | 0.441 | 0.238 | ||
| id (\(\beta_1\)) | -0.192 | 0.256 | ||||
| \(\sigma\) | 0.230 | 0.012 | 0.232 | 0.012 | 0.233 | 0.013 |
| \(\text{elpd}_{\text{LOO}}\) | 149.714 | 24.856 | 149.493 | 25.804 | 146.943 | 27.180 |
| WAIC | -299.472 | 49.697 | -299.066 | 51.575 | -294.646 | 54.044 |
| N | 306 | 306 | 306 |
At this point, fitting a model where the distance parameter is further adjusted for perceived ideological distance between the respondent and the author of the stimulus was not likely to result in a much better fit than the previous models. We see from model 2 in Table 4 that this is indeed the case. The model is a slight improvement upon Model 1 and 2, but the estimates remain small and indistinguishable from zero.16
In sum, the analyses presented here did not strengthen our belief in the results from Study 1. Rather, they paint the picture of weak to no influence measured immediately after the stimulus. It appears that the respondents were not persuaded by the more realistic stimuli, but rather remained unaffected by the short arguments of their peers.
A Calibrated Model of Social Influence in Filter Bubbles
The two studies described in the previous section have given us an impression of individual response functions to argumentation in online social media. Using this information about the micro-foundations of influence in filter bubbles, we turn to the model described in Section 2.17
How does the size of the filter bubble in online social media relate to opinion polarization in a micro-level validated model of social influence? To answer this question, we take the estimates from Model 1 in Study 1 (Table 2) and plug them into an ABM with \(N=50\) agents holding random initial opinions \(o_{i0} \in [0,1]\), and put on a complete graph. At each point in time, a random agent is drawn from the population, who interacts with a random neighbor inside their filter bubble. The bubble is defined as the subset of agents with the closest opinion to the focal agent.
Rather than fixing the persuasiveness of the argument (i.e., \(\alpha\)) and the distance parameter (i.e., \(\beta\)) at their mean observed estimates, we use the observed uncertainty about the estimates by drawing from the posterior distribution. At each interaction, we take two independent draws from the distribution and model the opinion change with Equations 1, 2 and 3.
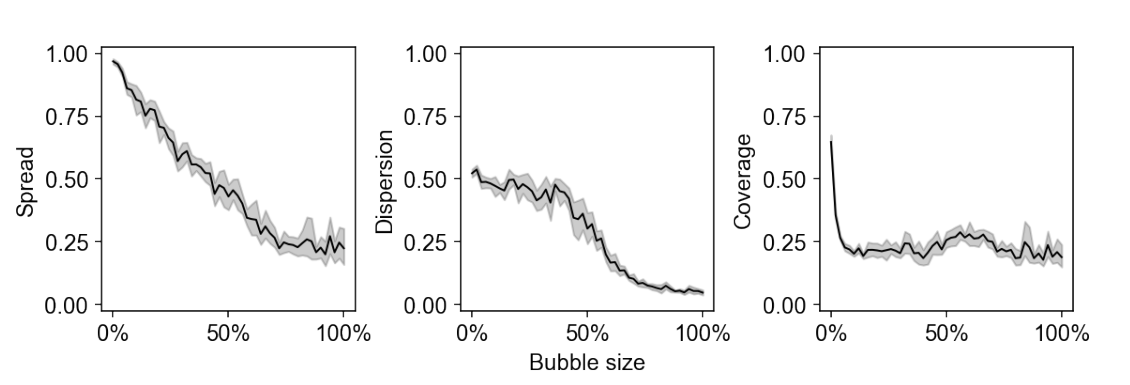
The results from 10,000 independent runs present a clear negative relationship between bubble size and opinion polarization, as summarized by the three indicators of polarization shown in Figure 6. The larger the set of possible interaction partners, the stronger the tendency towards convergence between agents. The few repulsion events that are likely to occur—particularly when filter bubbles are large—between agents with larger disagreement, are too few to overpower the tendency towards convergence in this model.
Interestingly, the stable degree of coverage and the diminishing marginal difference of spread towards the high end of the x-axis, are indicative of sufficient variation in opinion responses to create an oscillating dynamic of coherent diversity. Because the values of argument persuasiveness and shape of the response function are continuously drawn from unbounded distributions, the model does not have absorbing states by definition.18 On average, the attraction of similar others will be strong enough to create clusters of coherent opinions, but the noise introduced by sampling from the distributions causes small deviations from the within-bubble consensus opinion.
Discussion
This study sought to explain the complex link between informational filter bubbles and opinion polarization through investigation of the micro-foundations of social influence. Using a model of interpersonal influence and algorithmic selection of interaction partners, we showed that well-intended attempts to pop the filter bubble may have counterproductive effects, and that these effects critically depend on the shape of the response functions that specify how individuals adapt opinions in response to novel information. An integration of ideas from the social-influence literature yielded a formal model of such individual responses. This model was then calibrated with data from two vignette experiments, building on moral foundations for argumentation and perceived social distance. The observed amount of opinion change was marginal, but the Bayesian models for censored data still provided support for moderated assimilative influence and indicative evidence of repulsion at large opinion distances. The results were fed into the agent-based model, which showed that the amount of repulsion is sufficiently low to avoid polarization in a filter bubble-free world.
One of our most surprising empirical observations was made in the lagged model. Initially, testing for lasting effects was done to check how much the effect diminishes over time. Will any trace of the stimulus still be left after one week? Would people actually change their mind because of a single argument? Remarkably, the effect did not disappear after a week. If anything, the effect seems to have gotten stronger. Surely, this strengthens our confidence in the method. At the time of the third measurement, respondents were less likely to remember their answers from one week ago, alleviating concerns about reactivity and anchoring effects. What is more, the effect of the stimulus persisted, or even strengthened over time. But while the absence of any hypotheses on long-term opinion change effects in this study prevents us from drawing strong conclusions, we believe that the unexpected finding is an interesting one, and might provide an avenue for future research. Not the least because these results reflect the results from Bail et al. (2018), who found that exposure over a longer period to tweets from supporters of the opposite party increased opinion distance. Rather than direct repulsion, it could be that the effect was mediated through motivated reasoning or cognitive dissonance minimization. In other words, the stimulus gave the respondents some food for thought, and that simply some more time was needed to internalize the argument. Perhaps, alerting the respondents to the political themes discussed during the experiment alone was enough to trigger a chain of events, strengthening their opinion in the end.
Relatively large effects were found for the persuasive power of moral foundations. For the same argument, the infusion of adjectives from the moral foundations dictionary—signalling a certain moral foundation—strongly increased the persuasive power of an argument for people to whom the moral foundation is resonant. Alignment alone was enough to predict only assimilative influence for subjects whose ideological identification aligns with assumed preferred moral foundation and high occurrence of repulsion when perfectly dis-aligned. Interestingly, though, the effects largely disappeared towards the measurement of opinion change one week after exposure to the vignette. The results reflect that the vignettes might have induced moralization of a topic in the short term, which is known to trigger attitude extremization (Clifford 2019).
The novel experimental design and method of analysis was not without imperfections that provide interesting avenues for future research. First and foremost, the problem of censoring on opinion scales that this study touched upon is a problem that is not simple to solve, but is ubiquitous in survey research. Out of all studies that investigated repulsion, only few observe such distancing effects, yet all are troubled by the boundedness of opinion scales. Here, we attempted to solve the censoring problem for the dependent variable—the opinion after exposure to the stimulus—but ignored that this problem exists in the measurement of pre-stimulus opinion and perception of the opinion of the argument’s sender too. Future research would benefit broadly from a generalized version of a model that can account for the boundedness in a robust way.
Second, as with any (field) experiment, there are concerns about sample representativity and reactivity effects. Though our sample was collected on Facebook, with maximization of the ecological validity as a primary focus, the differences between the samples for Study 1 and 2 gave rise to the idea that the advertisement optimization algorithm may have biased our results. In a twist of irony, our study on biases through algorithmic selection may have been biased by algorithmic selection as well. It is conceivable that for short running ads like ours, the engagement with the advertisement of particular people early on in the process, triggers a cascade of recommendations to similar others. Between the two samples, we quantify those differences, but the lack of population data for the platform makes it harder to judge the representativity of the two samples overall. Nevertheless, there are no reasons to suspect that the within-individual relationships studied in this paper would be driven by idiosyncrasies of the samples obtained. The potential for reactivity does challenge those types of effects. Ambiguity about the desired response, and the stability of the results in the lagged model, however, challenge the critique that results are simply artefacts of the context. This research would benefit from future efforts at investigating the population of politically engaged and active social media users, as well as from a comparison of their response functions to other individuals and contexts.
The empirically calibrated ABM showed that popping the filter bubble can benefit consensus formation, but there are a few caveats that prohibit readily extrapolating this result to social media. First, the definition of the filter bubble as a strict set of \(n\) agents with an opinion closest to an individual is what creates the ‘positive’ effect of bubbles in our case. While reasonable to assume for a stylized model like our ABM, this assumption may be violated in real life as filtering algorithms are imperfect and may even under the strictest circumstances occasionally expose people to information that is very different to their private, inaccessible opinion. Alternatively, specifications could also assume a threshold level of disagreement beyond which foreign opinions are no longer considered. This could again have different implications, for example if the subset of the \(n\) agents with opinions nearest to the focal agent also contains some with maximal disagreement, potentially triggering repulsive influence. Such agents would be excluded by an alternative specification putting an interaction threshold at less-than-maximal disagreement.
Second, the model assumed a uniform opinion distribution on the outset, which may have made consensus formation too easy. The behavior of opinion systems with a different point of departure—for example, from more polarized distributions—may in fact be quite different (Kacperski & Hołyst 1996; Mäs et al. 2014). Third, that all agents are selected with equal likelihood to voice their opinions is a critical assumption, and driver of consensus. Yet, in reality those with stronger opinions are actually more likely to vocalize than others. In particular, more extreme opinions are prone to trigger opinion distancing in recipients, which could spark cascades of opinion shifts in the general population leading to global polarization. Lastly, the assumed independence of the distributions of the parameters \(\alpha\) and \(\beta\) from each other, but also from the individual whose opinion change they describe may affect the dynamics of the model as well. Here, we assumed that these values were dependent on a particular interaction, but not nested within individuals across different interactions. However, some people may be more receptive to influence than others. Stable heterogeneity between individuals could generate individuals with a particular stubbornness that triggers cascades of distancing from the population mean and deepen polarization. A variation on the experiment introduced here, that uses repeated measurements of within-individual responses on a variety of topics, would grant the statistical power required to reliably model those differences in a multilevel framework (similar to Takács et al. 2016).
This study opened up various potentially fruitful avenues for future research. While we focused on the weighted linear influence function in online social media with social alignment factors, there are more possible response functions, moderating factors or contextual conditions that deserve investigation. In our view, short term polarization through moralization and the cognitive processes triggered by information that challenges one’s view are two directions for psychological science to pursue understanding of the personalization-polarization hypothesis. For computational social scientists, a clean comparison of the bounded confidence paradigm to the weighted linear influence model presented here may be fruitful. A formal implementation of the bounded confidence model in our framework is possible (see Appendix C), but statistical comparison was not valid.
The study presented here provided a perspective on the micro-macro problem in research on opinion dynamics in online social media. The ABM showed that the personalization-polarization hypothesis cannot be understood by looking at the individual parts or characteristics of the system as a whole. Rather, we need a combination of rigorous theory and empirical data analysis to understand the problem. This study was one attempt to do just that. We hope that the dialogue between platform designers and computational social science continues to collaboratively build resilient social media platforms that live up to the virtues of democratic deliberation on the web.
Data availability and ethics
IRB approval for both studies was obtained at the Ethics Committee of the Faculty of Behavioural and Social Sciences at the University of Groningen (EC-BSS), the employer of all three authors at the time of conception of the study. Hypotheses were pre-registered at the Open Science framework, and all data and materials are shared in that same repository, to be found at: https://osf.io/dy2z6/.
Notes
- Here, we consider the third category of ‘similarity-biased influence’ (Flache et al. 2017) a higher-order category as both models of assimilative and repulsive influence can include similarity-bias.↩︎
- The model is presented formally in Section 4.↩︎
- Studies that use such a block design might underestimate repulsive influence effects because they do not take into account the variance in in-group identification, as well as experienced opinion differences, but test for differences in net influence between two blocks (Krizan & Baron 2007).↩︎
- Studies that look at interpersonal influence on political topics with strong (party) identification seem to capture repulsion quite systematically (Levendusky 2013; Liu & Srivastava 2015) whereas studies that use more trivial topics do not (Mäs & Flache 2013; Takács et al. 2016).↩︎
- This of course does not mean that such a shift does not occur on the individual’s latent opinion dimension. The bounded opinion scale, however, makes it unobservable.↩︎
- Group membership can be operationalized as a dichotomous variable that captures whether \(i\) and \(j\) belong to the same group \(e_{i}=e_{j} \in \{0,1\}\). More generally, one could think of \(e\) as being a vector of positions on some dimension that captures social distance. In that case, distance is captured with a single value \(|e_i - e_j| \in[0,1]\).↩︎
- Method and argumentation were explicitly pre-registered, but the hypothesis was not.↩︎
- Facebook’s targeted advertisement feature allows sampling for individual’s interests as inferred from their liked pages and platform usage behavior. The total number of users who fit these criteria and could potentially be targeted was 320,000.↩︎
- Keep in mind that the distribution of the (perceived) distance to stimulus is the product of two distributions and hence not expected to be uniform when constructed completely at random.↩︎
- We included the general, or un-interacted terms of the infused moral foundation and the ideological identification of the respondents to account for any differences that may exist based on those parameters alone, which would spill over into the interacted term of moral foundation with ideological identification.↩︎
- Keep in mind that we experimentally manipulated the moral foundation of an argument to avoid systematic co-variance of perceived distance to an argument and moral foundation.↩︎
- The four groups plotted there are created by taking the predicted responses after exposure to an argument \(o_j=0\) for individuals at the extreme ends of ideological orientation.↩︎
- The response rate to this survey was 39.7 percent (\(N=62\))↩︎
- Please note that both studies were carried out without any form of deception, in line with the code of the IRB that approved this research.↩︎
- This should not be taken as proof for any discernible difference between the control and experimental group. Pure measurement error is expected to reveal a similar pattern, as observations towards the boundaries of the scale have less room for variation. Visual inspection of the amount of opinion change by opinions at \(t=1\) appears to be in line with that expectation.↩︎
- The marginal improvement in model fit as indicated by the \(\text{elpd}_{\text{LOO}}\) criterion should not be over-interpreted in this case. The model has a weak fit, and the elpd as goodness-of-fit criterion is does not discriminate based on model complexity (Gronau & Wagenmakers 2019).↩︎
- All code is publicly available at https://www.github.com/marijnkeijzer/filterBubbles.↩︎
- Strictly speaking, one equilibrium does exist: where all opinions of all agents are equal. In that case, opinion change—based on the opinion difference between sender and source—will always be equal to 0, regardless of the values of \(\alpha\) and \(\gamma\).↩︎
- This does not affect the model fit, as the log likelihood of the predictive model is calculated after constraining the fitted value within the \(\{0,1\}\) range.↩︎
- This model is derived from Equation 5, by substituting the terms for the weight function \(w_{ijt}\) as given by Equation 4, and replacing the parameters \(\alpha \times \gamma_0\) and \(\alpha \times \gamma_1\) with corresponding parameters id and distance.↩︎
Acknowledgements
We thank Marion Hoffman for sharing her insights on statistical modeling of opinion changes in the Bayesian framework. Thanks to Guillaume Deffuant, Kathleen Carley and Arnout van de Rijt for their comments on an earlier version of this paper. We are very grateful to all research subjects for their participation in our study. Funding for participant compensation was provided by the Department of Sociology at the Faculty of Behavioral and Social Sciences, University of Groningen. Marijn Keijzer acknowledges IAST funding from the French National Research Agency (ANR) under grant ANR-17-EURE-0010 (Investissements d’Avenir program). Andreas Flache acknowledges financial support by the Netherlands Organization for Scientific Research (NWO) under the 2018 ORA grant ToRealSim (464.18.112).
Appendix A: Data Collection Stages
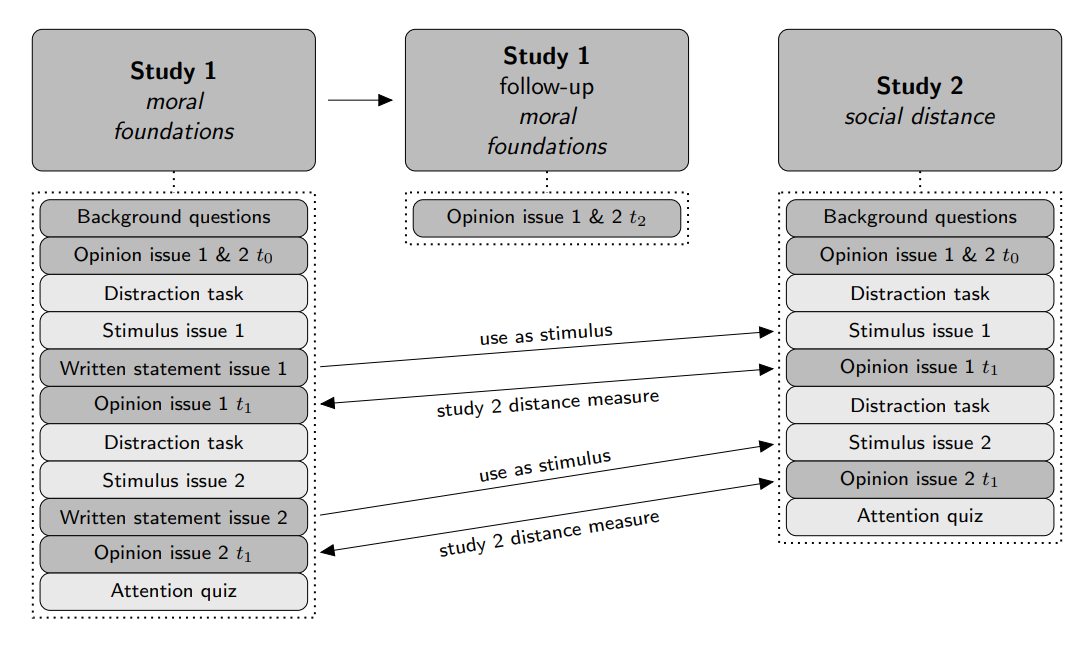
Appendix B: Statistical Approach
Making the theoretical model testable on empirical data requires some adaptations to the model. Broadly speaking, there are two challenges when inferring the theoretical relationship from empirical data: censoring of extreme opinions and the interdependence of persuasiveness the argument and various effects on the influence weight. We solve these issues by using a Bayesian approach for censored data on a slightly rewritten version of the model. Below, we explain in more detail why this is necessary and how we achieved the formulation of a testable model.
Studies that aim to find repulsive influence at large opinion differences have to deal with a pesky problem: censoring of opinions at the extreme ends of the scale. Theories of negative influence almost exclusively presuppose that negative influence is more likely to occur as opinion differences or perceived dissimilarity of the subject to the source is larger. Yet, the empirical reality of opinion measurement will prevent such events from happening. The larger the opinion differences become, the more likely a receiver of an argument already is at an extreme end of an opinion scale or will have little room to move before reaching the end. Where our theory predicts that individuals will want to move away from a source, the measurement instrument prevents them to do so.
We assume here that extreme opinions after interaction \(o_{i,t+1} \in \{0,1\}\) may be expressions of a latent opinion dimension that extends beyond the opinion bounds. As such, we consider those opinions as censored, and allow our predictive model to assume values outside the spectrum.19
The model is estimated using Bayesian methods for statistical inference. The advantage of using Bayesian estimation that it allows us to model the complex relationships between the two opinions of our subject and the perceived position of the source. Furthermore, we expect that the effect of a single argument might not be strong, while measurement error from using continuous opinion scales is likely to be large. These two factors combined will make it hard to estimate robust effects. Bayesian estimation gives us a better lens to look at noisy data, as studying the posterior distribution of parameter estimates conveys information about the accuracy and robustness of the effects.
To estimate the best fit for the model given by Equation 1 using empirical data, the terms \(\alpha\) and \(\gamma\) need to be separated so they can be estimated independently. Combining Equations 1 and 2 we can observe that
| \[ \begin{split} o_{i2} &= o_{i1} + \alpha (1 - \gamma |o_j - o_{i1}|) (o_j - o_{i1}) \\ &= o_{i1} + \alpha (o_j - o_{i1}) - \gamma \alpha |o_j - o_{i1}| (o_j - o_{i1}) \end{split}\] | \[(6)\] |
Let now:
| \[\beta := \gamma \times \alpha\] | \[(7)\] |
Then, Equation 6 can be written as:
| \[o_{i2} = o_{i1} + \alpha (o_j - o_{i1}) - \beta |o_j - o_{i1}| (o_j - o_{i1})\] | \[(8)\] |
The term \(\beta\) thus captures the effect of \(\gamma\) dependent on the observed distance between the stimulus \(o_j\) and pre-stimulus opinion of the respondent \(o_{i1}\). We estimate a model where the opinion after the influence event \(o_{i2}\) is drawn from a normal distribution with a mean \(\mu_{o_{i2}}\) and a standard deviation of \(1 / \sigma^{2}\):
| \[ \begin{split} \mu_{o_{i2}} = o_{i1} &+ \alpha (o_{j} - o_{i1}) \\ &- \beta |o_{i1} - o_{j}| (o_{j} - o_{i1})\\ o_{i2} &\sim \mathcal{N}(\mu_{o_{i2}}, 1 / \sigma^{2}) \end{split}\] | \[(9)\] |
Retrieving \(\gamma\) is done by taking \(\gamma = \frac{\beta}{\alpha}\), which gives us a direct interpretation for the shape of the response function. The value of \(\gamma\) can be interpreted by itself as the shape of the response function to foreign information, and as such, is comparable across interactions with arguments of varying persuasive strength.
To study the effect of varying levels of persuasiveness of an argument by the infusion of different moral foundations and their appeal to subjects with different ideological identity, we extend the model by adding terms that affect only values of persuasiveness (\(\alpha\))—the ‘strength’ of the experienced opinion shift. To account for the main effects of respondent ideology, the main effect of moral foundation of the argument, and the interaction effect of ideology and moral foundation, we have to add three extra terms to the model. The \(\beta\) parameter moral yields the persuasiveness main effect of arguments of leftist (0 = harm and fairness) or rightist (1 = loyalty, authority and purity) moral foundations of the argument. Second, right represents the main effect of rightist political ideology of the respondent. Finally, the interaction term moral \(\times\) right captures the effect of rightist respondent ideology and rightist moral foundation. After estimating the general model, we thus estimate a more elaborate version that takes heterogeneity on the argument characteristics into account:
| \[ \begin{split} \mu_{o_{i2}} = o_{i1} &+ \alpha (o_{j} - o_{i1}) \\ &- \beta_{\text{distance}} |o_{i1} - o_{j}| (o_{j} - o_{i1}) \\ &+ \beta_{\text{moral}} m_j (o_{j} - o_{i1})\\ &+ \beta_{\text{right}} r_i (o_{j} - o_{i1})\\ &+ \beta_{\text{moral} \times \text{right}} m_j r_i (o_{j} - o_{i1})\\ o_{i2} &\sim \mathcal{N}(\mu_{o_{i2}}, \sigma) \end{split}\] | \[(10)\] |
Where \(m_j \in \{0,1\}\) is the moral foundation of argument \(j\) and \(r_i \in [0,1]\) is the degree to which the subject identifies as politically right-wing.
Analogous to the implementation of factors that impact the persuasiveness of arguments, the alignment effects that are believed to affect the shape of the response function alone are modeled as effects that change the value of \(\beta\) for different groups in the data. We thus add a \(\beta\) term identity to the model, to capture the differences in the main distance parameter for a respondent’s perceived distance to the source:20
| \[ \begin{split} \mu_{o_{i2}} = o_{i1} &+ \alpha (o_{j} - o_{i1}) \\ &- \beta_{\text{distance}} |o_{i1} - o_{j}| (o_{j} - o_{i1}) \\ &+ \beta_{\text{id}} |r_{i} - r_{j}| |o_j - o_{i1}| (o_{j} - o_{i1})\\ o_{i2} &\sim \mathcal{N}(\mu_{o_{i2}}, \sigma) \end{split}\] | \[(11)\] |
Where \(r_i \in [0,1]\) is, again, the degree to which the respondent identifies as politically right-wing and \(r_j \in [0,1]\) is the perception of the ideological identification of the source of the argument.
Within studies, the data are pooled to maximize statistical power. Although we could have chosen to account for nesting within subject or topic, the intra-class correlations are sufficiently low to justify the simpler approach (\(\text{ICC}_{\text{subject}} = 0.129\) and \(\text{ICC}_{\text{topic}} = 0.246\) for Study 1, and \(\text{ICC}_{\text{subject}} = 0.020\) and \(\text{ICC}_{\text{topic}}= 0.082\) for Study 2). All analyses have been replicated using the topics separately too, accounting for the nested structure, without any noteworthy differences.
Throughout the modeling, we took conservative priors for all effects with a mean of zero and a standard deviation tuned to the amount of variance in the data. These priors are effectively the null hypothesis, enabling hypothesis testing through falsifying the null in a Bayesian framework (Baig 2020).
The estimation procedure is implemented in R 4.0.3 using the runjags package (Denwood 2016). To assess the goodness of fit for each of the models we estimate log-likelihood values of all responses. In obtaining log-likelihoods, we have to take the truncation of our dependent variable into account. We do so, by considering the likelihood that an observation is censored within the log-likelihood function.
| \[LL = \frac{P(x | \sigma)}{P(0 \leq x \leq 1 | \sigma)}\] | \[(12)\] |
The posterior distribution of all log-likelihood values can be used to estimate the goodness of fit statistics that indicate whether the model is appropriate, and compare model performance across nested models. We estimate the Watanabe–Akaike (or ‘widely applicable’) information criterion (WAIC) and the expected log pointwise predictive density (elpd) of the Leave One Out cross-validation procedure (LOO) (Vehtari et al. 2017).
Appendix C: Alternative Model Inspired by Bounded Confidence
Bounded confidence builds upon the idea that receptivity to foreign opinions decreases with opinion distance (Deffuant et al. 2000; Hegselmann & Krause 2002). When opinions are too different at the outset, individuals ‘do not bother’ to exchange arguments (Deffuant et al. 2000). Often, it is formalized as a (moderated) positive influence model with a sharp threshold called a confidence level (or confidence threshold). If the opinion difference \(|o_{j}-o_{i}|\) exceeds this threshold, social influence is prohibited.
Even though the assumption of a strict threshold for influence is useful in simulation studies, it has been criticized for a lack of realism and artificiality in its implementation of the attraction paradigm (Kurahashi-Nakamura et al. 2016). Formal models of assimilative social influence using a continuous opinion dimension have a strong tendency to move to consensus. Without this sharp confidence level, any structural constraint (e.g. an interaction network graph) or third-party effects (e.g. media influence or exogenous shocks), these models are inadequate at producing (stable) diversity (Flache et al. 2017). We adopt the same qualitative assumption, but model decreasing confidence as gradual decay of exerted influence.
| \[w_{ijt} = 1-|o_{j}-o_{it}|^{\beta} \] | \[(13)\] |
Equation 13 introduces the weight function for bounded confidence referenced in the base influence function of Equation 1. To grasp the idea of bounded confidence, the influence weight function is adapted slightly from the weighted linear influence weight function introduced in Equation 2. As shown in Figure 8, \(\beta\) still defines the shape of the curve, but influence will never become negative. For values of \(\beta>1\), the decrease of the influence weight ‘slows down’ with opinion difference, and for values of \(\beta<1\) the decrease of the influence weight grows as \(|o_{j}-o_{i}|\rightarrow1\).
Similar to the extension for social influence in the weighted linear influence model (Equation 5), we can extend the model here to include this term as well:
| \[w_{ijt} = 1-|o_{j}-o_{it}|^{\beta} + \eta(1 - \delta_{e_i e_j} ) |o_{j}-o_{it}| \] | \[(14)\] |
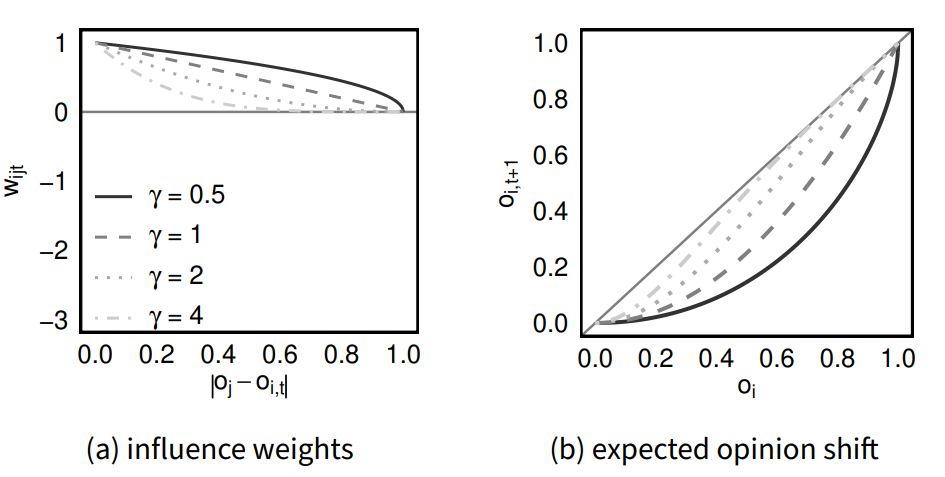
Appendix D: Reference Model for Lagged Opinion Change Model
The models in Table 5 present the estimates from the analysis with a subset of the data in Study 1, namely those respondents who participated in the follow-up survey. The models are thus nested in those presented in Table 2, and are presented here as it needs to be used as the reference model when interpreting the models from Table 3.
| Model 0 | Model 1 | Model 2 | ||||
| Estimate | SD | Estimate | SD | Estimate | SD | |
| persuasiveness (\(\alpha\)) | 0.086 | 0.061 | 0.264 | 0.185 | 0.363 | 0.237 |
| distance (\(\beta_0\)) | 0.255 | 0.251 | 0.215 | 0.306 | ||
| moral (\(\beta_1\)) | -0.142 | 0.187 | ||||
| right (\(\beta_2\)) | -0.179 | 0.180 | ||||
| moral \(\times\) right (\(\beta_3\)) | 0.154 | 0.236 | ||||
| \(\sigma\) | 0.224 | 0.021 | 0.228 | 0.020 | 0.077 | 0.222 |
| \(\text{elpd}_{\text{LOO}}\) | 53.143 | 13.445 | 52.636 | 13.447 | 48.108 | 13.082 |
| WAIC | -106.344 | 26.858 | -105.378 | 26.838 | -96.400 | 26.093 |
| N | 124 | 124 | 124 |
References
ABELSON, R. P. (1964). Mathematical models of the distribution of attitudes under controversy. In N. Frederiksen & H. Gulliksen (Eds.), Contributions to Mathematical Psychology (pp. 142–160). New York, NY: Rinehart Winston.
ANSPACH, N. M. (2017). The new personal influence: How our Facebook friends influence the news we read. Political Communication, 34(4), 590–606. [doi:10.1080/10584609.2017.1316329]
AXELROD, R. M. (1997). The dissemination of culture: A model with local convergence and global polarization. Journal of Conflict Resolution, 41(2), 203–226. [doi:10.1177/0022002797041002001]
BAIG, S. A. (2020). Bayesian inference: An introduction to hypothesis testing using Bayes factors. Nicotine and Tobacco Research, 22(7), 1244–1246. [doi:10.1093/ntr/ntz207]
BAIL, C. A., Argyle, L. P., Brown, T. W., Bumpus, J. P., Chen, H., Fallin Hunzaker, M. B., Lee, J., Mann, M., Merhout, F., Volfovsky, A., & Hunzaker, M. B. F. (2018). Exposure to opposing views on social media can increase political polarization. Proceedings of the National Academy of Sciences, 115(37), 9216–9221. [doi:10.1073/pnas.1804840115]
BALDASSARRI, D., & Gelman, A. (2008). Partisans without constraint: Political polarization and trends in American public opinion. American Journal of Sociology, 114(2), 408–446. [doi:10.1086/590649]
BANISCH, S., & Olbrich, E. (2019). Opinion polarization by learning from social feedback. The Journal of Mathematical Sociology, 43(2), 76–103. [doi:10.1080/0022250x.2018.1517761]
BERGER, J., & Heath, C. (2008). Who drives divergence? Identity signaling, outgroup dissimilarity, and the abandonment of cultural tastes. Journal of Personality and Social Psychology, 95(3), 593–607. [doi:10.1037/0022-3514.95.3.593]
BERSCHEID, E. (1966). Opinion change and communicator-communicatee similarity and dissimilarity. Journal of Personality and Social Psychology, 4(6), 670–680. [doi:10.1037/h0021193]
BIKHCHANDANI, S., Hirshleifer, D., & Welch, I. (1992). A theory of fads, fashion, custom, and cultural change as information cascades. Journal of Political Economy, 100(5), 992–1026. [doi:10.1086/261849]
BLAU, P. M. (1964). Exchange and Power in Social Life. Hoboken, NJ: John Wiley & Sons.
BOURDIEU, P. (1984). Distinction: A Social Critique of the Judgement of Taste. London: Routledge.
BOZDAG, E., & van den Hoven, J. (2015). Breaking the filter bubble: Democracy and design. Ethics and Information Technology, 17(4), 249–265. [doi:10.1007/s10676-015-9380-y]
BRAMSON, A., Grim, P., Singer, D. J., Fisher, S., Berger, W., Sack, G., & Flocken, C. (2016). Disambiguation of social polarization concepts and measures. The Journal of Mathematical Sociology, 40, 80–111. [doi:10.1080/0022250x.2016.1147443]
BRUNS, A. (2019). Are Filter Bubbles Real? John Wiley & Sons.
BYRNE, D. (1961). Interpersonal attraction and attitude similarity. The Journal of Abnormal and Social Psychology, 62(3), 713–715. [doi:10.1037/h0044721]
CLIFFORD, S. (2019). How emotional frames moralize and polarize political attitudes. Political Psychology, 40(1), 75–91. [doi:10.1111/pops.12507]
DEFFUANT, G., Amblard, F., & Weisbuch, G. (2004). Modelling group opinion shift to extreme: The smooth bounded confidence model. arXiv preprint. Available at: https://doi.org/10.48550/arXiv.cond-mat/0410199
DEFFUANT, G., Amblard, F., Weisbuch, G., & Faure, T. (2002). How can extremism prevail? A study based on the relative agreement interaction model. Journal of Artificial Societies and Social Simulation, 5(4), 1. http://cogprints.org/4355/1/1.html
DEFFUANT, G., Keijzer, M. A., & Banisch, S. (2023). Regular access to constantly renewed online content favors radicalization of opinions. arXiv preprint. Available at: https://doi.org/10.48550/arXiv.2305.16855
DEFFUANT, G., Neau, D., Amblard, F., & Weisbuch, G. (2000). Mixing beliefs among interacting agents. Advances in Complex Systems, 03(01n04), 87–98. [doi:10.1142/s0219525900000078]
DEGROOT, M. H. (1974). Reaching a consensus. Journal of the American Statistical Association, 69(345), 118–121. [doi:10.1080/01621459.1974.10480137]
DENRELL, J. (2008). Indirect social influence. Science, 321, 47–48. [doi:10.1126/science.1157667]
DENWOOD, M. J. (2016). runjags: An R package providing interface utilities, model templates, parallel computing methods and additional distributions for MCMC models in JAGS. Journal of Statistical Software, 71(9). [doi:10.18637/jss.v071.i09]
FALK, E., & Scholz, C. (2018). Persuasion, influence, and value: Perspectives from communication and social neuroscience. Annual Review of Psychology, 69(1), 329–356. [doi:10.1146/annurev-psych-122216-011821]
FESTINGER, L. (1964). Behavioral support for opinion change. The Public Opinion Quarterly, 28(3), 404–417. [doi:10.1086/267263]
FLACHE, A. (2018a). About renegades and outgroup-haters: Modelling the link between social influence and intergroup attitudes. Advances in Complex Systems, 21(06n07). [doi:10.1142/s0219525918500170]
FLACHE, A. (2018b). Between monoculture and cultural polarization: Agent-based models of the interplay of social influence and cultural diversity. Journal of Archaeological Method and Theory, 25(4), 996–1023. [doi:10.1007/s10816-018-9391-1]
FLACHE, A., & Mäs, M. (2008). How to get the timing right. A computational model of the effects of the timing of contacts on team cohesion in demographically diverse teams. Computational and Mathematical Organization Theory, 14(1), 23–51. [doi:10.1007/s10588-008-9019-1]
FLACHE, A., Mäs, M., Feliciani, T., Chattoe-Brown, E., Deffuant, G., Huet, S., & Lorenz, J. (2017). Models of social influence: Towards the next frontiers. Journal of Artificial Societies and Social Simulation, 20(4), 2. http://jasss.soc.surrey.ac.uk/20/4/2.html [doi:10.18564/jasss.3521]
FLACHE, A., Mäs, M., & Keijzer, M. A. (2022). Computational Approaches in Rigorous Sociology: Agent-Based Computational Sociology and Computational Social Science. In K. Gërxhani, N.-D. De Graaf, & W. Raub (Eds.), Handbook of Sociological Science. Contributions to Rigorous Sociology. Cheltenham: Edward Elgar Publishing. [doi:10.4337/9781789909432.00011]
FRENCH, J. R. (1956). Formal theory of social power. Psychological Review, 63(3), 181–194. [doi:10.1037/h0046123]
GRAHAM, J., Haidt, J., Koleva, S., Motyl, M., Iyer, R., Wojcik, S. P., & Ditto, P. H. (2013). Moral Foundations Theory: The Pragmatic Validity of Moral Pluralism. Amsterdam: Elsevier. [doi:10.1016/b978-0-12-407236-7.00002-4]
GRAHAM, J., Haidt, J., & Nosek, B. A. (2009). Liberals and conservatives rely on different sets of moral foundations. Journal of Personality and Social Psychology, 96(5), 1029–1046. [doi:10.1037/a0015141]
GROEBER, P., Lorenz, J., & Schweitzer, F. (2014). Dissonance minimization as a microfoundation of social influence in models of opinion formation. Journal of Mathematical Sociology, 38(3), 147–174. [doi:10.1080/0022250x.2012.724486]
GRONAU, Q. F., & Wagenmakers, E. J. (2019). Limitations of Bayesian leave-one-out cross-validation for model selection. Computational Brain & Behavior, 2, 1–11. [doi:10.1007/s42113-018-0011-7]
HAIDT, J. (2007). The new synthesis in moral psychology. Science, 316(5827), 998–1002. [doi:10.1126/science.1137651]
HARARY, F. (1959). A criterion for unanimity in French’s theory of social power. In D. Cartwright (Ed.), Studies in Social Power (pp. 168–182). Ann Arbor, MI: Institute for Social Research.
HEGSELMANN, R., & Krause, U. (2002). Opinion dynamics and bounded confidence: Models, analysis and simulation. Journal of Artificial Societies and Social Simulation, 5(3), 2. https://www.jasss.org/5/3/2.html [doi:10.18564/jasss.5257]
HOGG, M. A., Turner, J. C., & Davidson, B. (1990). Polarized norms and social frames of reference: A test of the self-categorization theory of group polarization. Basic and Applied Social Psychology, 11(1), 77–100. [doi:10.1207/s15324834basp1101_6]
JAGER, W., & Amblard, F. (2005). Uniformity, bipolarization and pluriformity captured as generic stylized behavior with an agent-based simulation model of attitude change. Computational & Mathematical Organization Theory, 10(4), 295–303. [doi:10.1007/s10588-005-6282-2]
KACPERSKI, K., & Hołyst, J. A. (1996). Phase transitions and hysteresis in a cellular automata-based model of opinion formation. Journal of Statistical Physics, 84(1–2), 169–189. [doi:10.1007/bf02179581]
KEIJZER, M. A., & Mäs, M. (2022). The complex link between filter bubbles and opinion polarization. Data Science, 5(1). [doi:10.3233/ds-220054]
KEIJZER, M. A., Mäs, M., & Flache, A. (2018). Communication in online social networks fosters cultural isolation. Complexity, 2018, 9502872. [doi:10.1155/2018/9502872]
KOSLIN, B. L., Stoops, J. W., & Loh, W. D. (1967). Source characteristics and communication discrepancy as determinants of attitude change and conformity. Journal of Experimental Social Psychology, 3(3), 230–242. [doi:10.1016/0022-1031(67)90025-x]
KRIZAN, Z., & Baron, R. (2007). Group polarization and choice-dilemmas: How important is self-categorization? European Journal of Social Psychology, 37(1), 191–201. [doi:10.1002/ejsp.345]
KURAHASHI-NAKAMURA, T., Mäs, M., & Lorenz, J. (2016). Robust clustering in generalized bounded confidence models. Journal of Artificial Societies and Social Simulation, 19(4), 7. http://jasss.soc.surrey.ac.uk/19/4/7.html [doi:10.18564/jasss.3220]
LAZER, D. M. J., Baum, M. A., Benkler, Y., Berinsky, A. J., Greenhill, K. M., Menczer, F., Metzger, M. J., Nyhan, B., Pennycook, G., Rothschild, D., Schudson, M., Sloman, S. A., Sunstein, C. R., Thorson, E. A., Watts, D. J., & Zittrain, J. L. (2018). The science of fake news. Science, 359(6380), 1094–1096. [doi:10.1126/science.aao2998]
LEMAINE, G. (1975). Dissimilation and differential assimilation in social influence (situations of ’normalization’). European Journal of Social Psychology, 5(1), 93–120. [doi:10.1002/ejsp.2420050106]
LEVENDUSKY, M. S. (2013). Why do partisan media polarize viewers? American Journal of Political Science, 57(3), 611–623. [doi:10.1111/ajps.12008]
LIN, T. Z., & Tian, X. (2019). Audience design and context discrepancy: How online debates lead to opinion polarization. Symbolic Interaction, 42(1), 70–97. [doi:10.1002/symb.381]
LIU, C. C., & Srivastava, S. B. (2015). Pulling closer and moving apart. American Sociological Review, 80(1), 192–217. [doi:10.1177/0003122414564182]
MACY, M. W., Kitts, J. A., Flache, A., & Benard, S. (2003). Polarization in dynamic networks: A Hopfield model of emergent structure. In R. Breiger, K. Carley, & P. Pattison (Eds.), Dynamic Social Network Modeling and Analysis (pp. 162–173). Washington, DC: The National Academies Press.
MARK, N. P. (1998). Beyond individual differences: Social differentiation from first principles. American Sociological Review, 63(3), 309–330. [doi:10.2307/2657552]
MAZEN, R., & Leventhal, H. (1972). The influence of communicator-recipient similarity upon the beliefs and behavior of pregnant women. Journal of Experimental Social Psychology, 8(4), 289–302. [doi:10.1016/0022-1031(72)90019-4]
MÄS, M. (2021). Interactions. In G. Manzo (Ed.), Research Handbook on Analytical Sociology. Cheltenham: Edward Elgar Publishing.
MÄS, M., & Bischofberger, L. (2015). Will the personalization of online social networks foster opinion polarization? SSRN Electronic Journal. Available at: https://doi.org/10.2139/ssrn.2553436
MÄS, M., & Flache, A. (2013). Differentiation without distancing. Explaining bi-polarization of opinions without negative influence. PLoS One, 8(11), e74516.
MÄS, M., Flache, A., & Helbing, D. (2010). Individualization as driving force of clustering phenomena in humans. PLoS Computational Biology, 6(10), e1000959.
MÄS, M., Flache, A., & Kitts, J. A. (2014). Cultural integration and differentiation in groups and organizations. In V. Dignum & F. Dignum (Eds.), Perspectives on Culture and Agent-Based Simulations: Integrating Cultures (pp. 71–90). Berlin Heidelberg: Springer.
NEWCOM. (2018). Nationale social media onderzoek 2018. Available at: https://www.newcom.nl/socialmedia2018
NICKERSON, R. S. (1998). Confirmation bias: A uniquitous phenomenon in many guises. Review of General Psychology, 2(2), 175–220. [doi:10.1037/1089-2680.2.2.175]
OBAMA, B. (2017). President Obama’s farewell address. Available at: https://obamawhitehouse.archives.gov/the-press-office/2017/01/10/remarks-president-farewell-address
PARISER, E. (2011). The Filter Bubble: What the Internet Is Hiding From You. London: Penguin.
PERLOFF, R. M. (1993). The Dynamics of Persuasion. Hillsdale, NJ: Lawrence Erlbaum Associates.
PETTY, R. E., Wegener, D. T., & Fabrigar, L. R. (1997). Attitudes and attitude change. Annual Review of Psychology, 48, 609–647. [doi:10.1146/annurev.psych.48.1.609]
SALZARULO, L. (2006). A continuous opinion dynamics model based on the principle of meta-contrast. Journal of Artificial Societies and Social Simulation, 9(1), 13. https://www.jasss.org/9/1/13.html
STEIGLECHNER, P., Keijzer, M. A., Smaldino, P. E., Moser, D., & Merico, A. (2023). Noise and opinion dynamics: How ambiguity promotes pro-majority consensus in the presence of confirmation bias. SocArXiv. [doi:10.31235/osf.io/u2t7r]
SUNSTEIN, C. R. (2002). The law of group polarization. The Journal of Political Philosophy, 10(2), 175–195. [doi:10.1111/1467-9760.00148]
TAKÁCS, K., Flache, A., & Mäs, M. (2016). Discrepancy and disliking do not induce negative opinion shifts. PLoS One, 11(6), e0157948.
THOMPSON, N. (2018). Jack Dorsey on Twitter’s role in free speech and filter bubbles. WIRED.
VAN Knippenberg, D., De Vries, N., & VAN Knippenberg, A. (1990). Group status, group size, and attitude polarization. European Journal of Social Psychology, 20, 253–257. [doi:10.1002/ejsp.2420200306]
VEHTARI, A., Gelman, A., & Gabry, J. (2017). Practical Bayesian model evaluation using leave-one-out cross-validation and WAIC. Statistics and Computing, 27(5), 1413–1432. [doi:10.1007/s11222-016-9696-4]
WOOD, W. (2000). Attitude change: Persuasion and social influence. Annual Review of Psychology, 51(1), 539–570. [doi:10.1146/annurev.psych.51.1.539]
YOUNG, H. P. (1993). The evolution of conventions. Econometrica, 61(1), 57–84.
ZUCKERBERG, M. (2017). Building global community. Facebook. Available at: https://www.facebook.com/notes/3707971095882612/