
Motivation and Objectives
In recent decades, many disciplines have interrogated the themes of complexity science while modeling human- environment interactions, disease transmission dynamics, natural ecosystems, and social and engineered systems (Liu et al. 2007). Given the role of individuals in these (mostly multiscale) systems, scientists often employ entity-based models, referred to as agent-based models (ABMs) in social sciences and engineering, and individual-based models in ecology (DeAngelis & Grimm 2014; Railsback & Grimm 2019) and health research (Auchincloss & Diez Roux 2008; Spicknall et al. 2010). In this paper, we will use ABM to represent both an agent- based and an individual-based model.
ABMs allow for an explicit representation of entities (including cells, organisms, humans, and even organizations) and their relations, distributed in space, and characterized by complex heterogeneous behavior (Parker et al. 2002). They are often constrained by higher hierarchical levels of the systems (O’Sullivan & Haklay 2000), which, in turn, emerge from the behavior and interaction of those agents. Through individual and collective decisions, these entities affect and are affected by their environment. ABMs are both complex (e.g., differential model behavior) and complicated (e.g., difficulties in choosing the adequate model structure) (Sun et al. 2016). Designing, implementing, evaluating, and applying an ABM requires a structured approach, part of which is a comprehensive analysis of output to input variability[1]. Of special importance is the identification of which model inputs, and to what extent, affect the variability of model outputs. This element of the ABM development cycle is called sensitivity analysis (SA) (Saltelli et al. 2004).
Formally, we define SA as the evaluation of the influence of variable model inputs on the variability of a specific model outcome. SA serves two main purposes: (1) it informs about the robustness of findings gained with a model (an overly sensitive model would not be very useful because we will never know all inputs with absolute certainty); and (2) it informs about the relative sensitivity of inputs and hence the processes which are modulated by these inputs. Thus, SA helps to tell the important from the less important processes and thereby facilitates detecting and understanding causality. SA is preceded by uncertainty analysis that provides output distributions, which are the consequence of input distributions (Saltelli et al. 2004).
SA is not constrained to ABMs. It is an element of model evaluation that dates back to operations research and decision making (Alexander 1989; French 1992; Pannell 1997; Wolters & Mareschal 1995). Amongst other applications, it has been widely used in environmental modeling and engineering (Anderson et al. 2014; Baroni & Tarantola 2014; Branger et al. 2015; Cosenza et al. 2013; Vanuytrecht et al. 2014; Zhan & Zhang 2013), in analyzing social systems (Chattoe et al. 2000), in disease transmission modeling (Spicknall et al. 2010), and in ecological and ecosystem models e.g., (Borgonovo et al. 2012; Chu-Agor et al. 2011; Ciric et al. 2012; Makler-Pick et al. 2011; Perz et al. 2013).
Given the complexity of the models emulating the real world, it is important to conduct SA in a systematic way. Saltelli & Annoni (2010) and Saltelli et al. (2019) warn against a perfunctory approach to SA, where SA is done in an ad hoc manner – without considering the specificity of a given method and its applicability to a given problem. Therefore, the recent proliferation of reviews on the different methods of SA is not surprising (Ferretti et al. 2016; Iooss & Lemaître 2015; Lilburne & Tarantola 2009; Norton 2015; Pianosi et al. 2016; Saltelli et al. 2008). Several papers reviewing SA in ABM have also been published (Lee et al. 2015; ten Broeke et al. 2016; Thiele et al. 2014).
The objective of this paper is to assist modelers in choosing the most suitable SA methods for a specific ABM application. To provide this assistance, we review a range of ABMs: from simple (data-poor) abstract models with a single scalar variable, through empirically-rich ABMs with a vast range of output variables, to high-complexity models that produce multidimensional outputs like maps. We advocate a mixed-method approach driven by the purpose of the model. We demonstrate that many ABMs require a comprehensive model evaluation, with multiple SA methods employed.
We start by identifying two overarching purposes of ABM development (Section 2). We reflect upon the place and role of SA in ABM development (Section 3), and briefly summarize the methods of SA that have been used in ABMs, focusing on their advantages and disadvantages (Section 4). We then present a roadmap to purpose-driven mixed-method SA (Section 5). The roadmap identifies pathways for performing SA by combining multiple methods that complement each other. Each pathway is then explained by describing the corresponding best SA practices (Section 6), and substantiated with application examples (Section 7). In the concluding Section 8, we argue that none of the methods identified in the literature is the panacea for performing SA in ABM. As presented in the roadmap, the choice of the SA method should be driven by the purpose of the model and the nature of the target system.
Defining ABM Based on its Purpose
Similar to other modeling approaches, ABM involves an iterative cycle of development and simulation: from a research question formulated based on target system observations, through model conceptualization, data collection, model design and implementation, to model verification, validation, and application (Augusiak et al. 2014; Grimm & Railsback 2005; North & Macal 2007; Parker et al. 2003; Robinson 2014; Shannon 1975; Trucano et al. 2006). Sensitivity analysis is just one of the many elements of model evaluation, where developers can increase or lose credibility (Grimm et al. 2014).
The development of a specific ABM is dependent on its purpose (Parker et al. 2002). We distinguish between applied (empirical) models that are developed to support solving practical problems in the real world, for example, the design of energy grids, and abstract models that have a more theoretical focus and aim primarily at exploring ideas and concepts, for example, opinion dynamics (Figure 1).
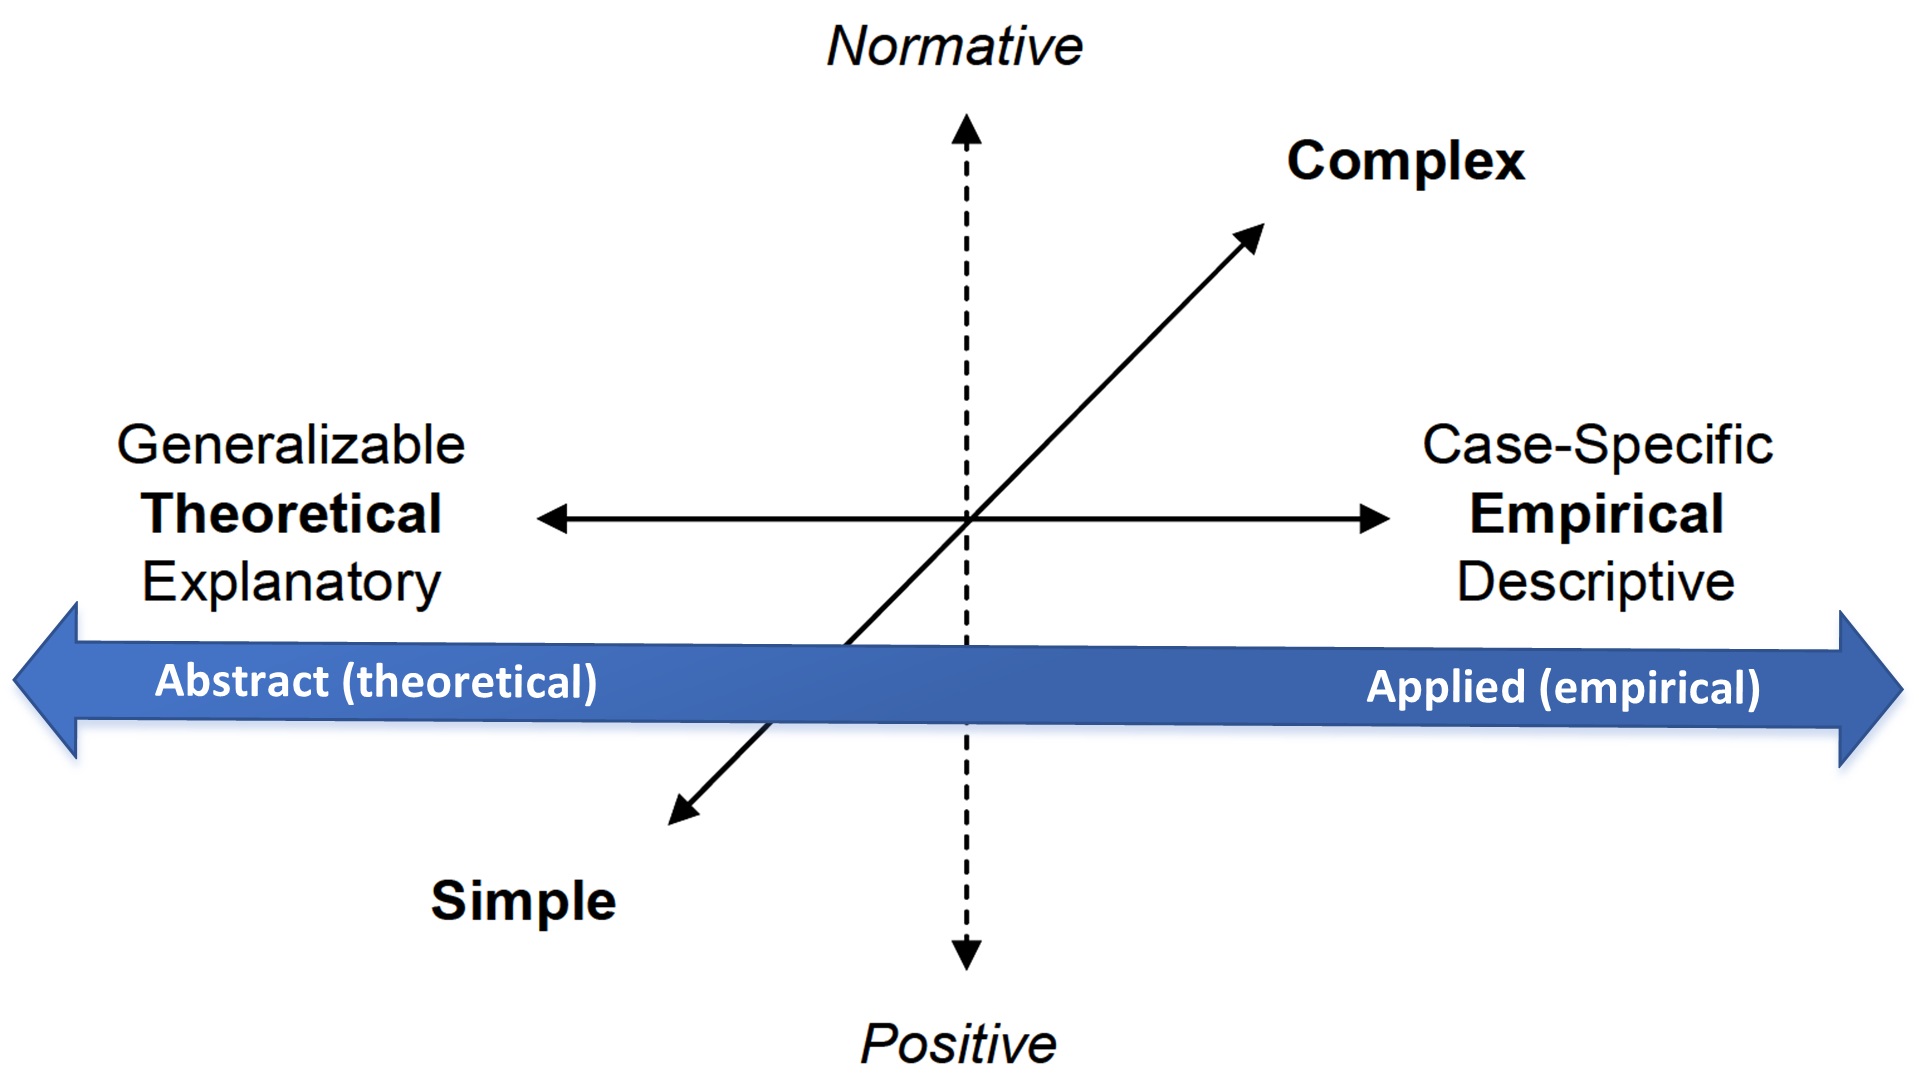
Abstract theoretical models aim at defining new relationships and discovering the fundamental principles of phenomena. The departure point and the center of interest is model formulation, which implies that the criteria for matching data and observations are much less restrictive than for applied (empirical) models. Sometimes these models are utilized without data and are used to demonstrate a concept or general principle driving a complex system. Developers of theoretical models are less interested in the structure of the observed data than the parsimonious construction of the model (Parker et al. 2002). ‘The model comes first, then comes the data’ (Du & Ligmann-Zielinska 2015). The ultimate goal is a deeper understanding of the target system and the processes operating within it (Robinson 2010).
Application-driven ABMs aim at explaining the specifics of the target system. Models are ‘designed to closely match the details of a particular case study’ p. 6 (Parker et al. 2002). With application-driven ABMs, key questions associated with their evaluation include: why should we trust the model (Grimm et al. 2014)? Can inferences from the model be transferred to the real world? Are the proposed policies feasible? For these types of models, data-matching becomes the center of attention (Du & Ligmann-Zielinska 2015). Frequently, application-driven ABMs become empirically-rich and are used in scenario analysis. The ultimate outcome of the simulation study is generative –we want to derive findings that can be implemented in the form of system or policy changes (Robinson 2010).
The Roles of Sensitivity Analysis
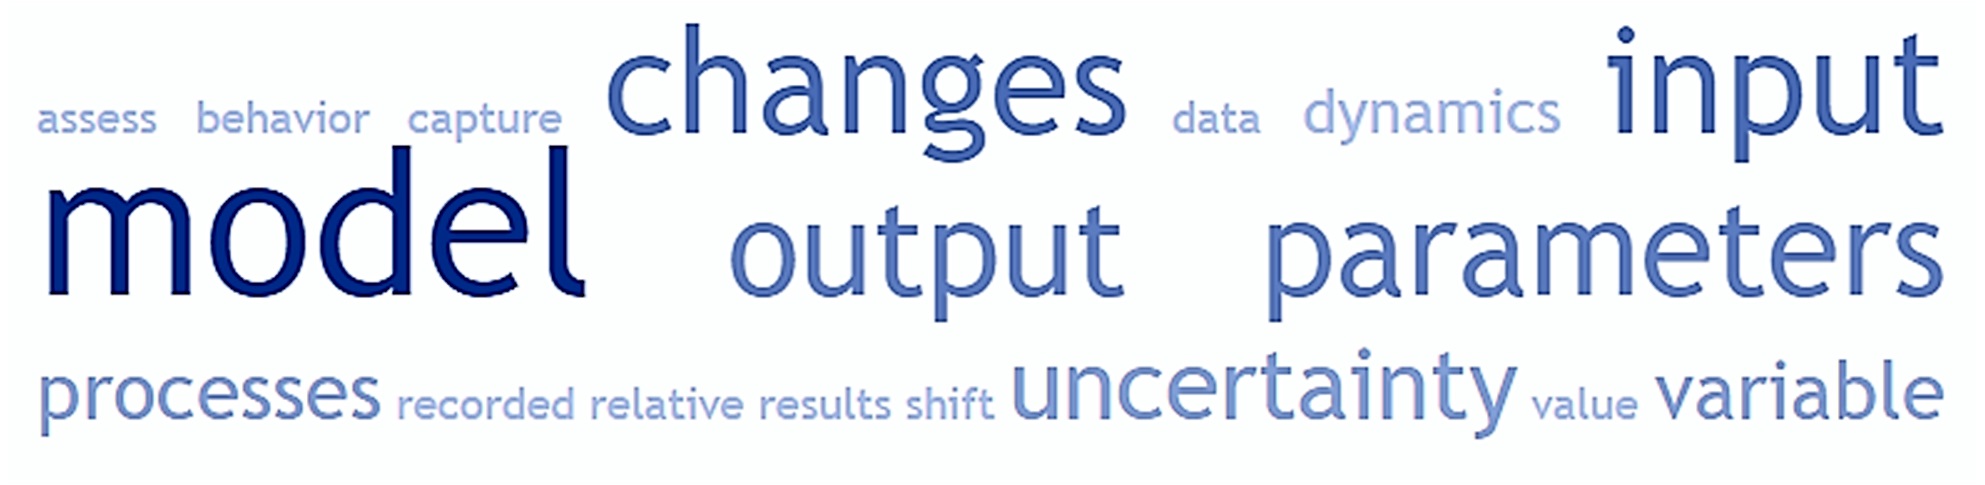
To determine how ABM developers perceive SA, the authors of this manuscript were asked to formulate a definition of SA. Based on this small sample, ABM researchers perceive SA as a way of exposing model drivers (‘changes’, ‘processes’, ‘dynamics’, ‘shifth’, ‘behavior’) (Figure 2). While not fully representative, this sample of responses points to the importance of analyzing not only model output sensitivity to input stochasticity but also the processes within the ABMs. This is not surprising because ABMs’ non-linear dynamics are not attributed to the implementation of a single process. Instead, modeling complexity can arise from interactions among multiple, often simple, discrete micro-processes triggered by agents. Such confounded dynamics become a black-box for developers. SA provides tools for getting insight into model dynamics at the micro-level and an improved understanding of how system properties emerge at the macro-level (Grimm et al. 2014), but the information extracted from the evaluation exercise depends on what tools are employed in the assessment.
SA of ABM provides a means of model exploration. It addresses the question of which inputs, and to what extent, drive the change in model outputs. Here, SA is used as a form of design of experiments with the goal of improving our understanding of the dynamics of the modeled system by identifying inputs, and hence their corresponding processes, that have the biggest impact on the changes in the results (the drivers of change). Developers may focus on identifying the driving inputs, exploring low probability high consequence results, and quantifying model nonlinearity and input interactions.
SA is also used to test ABM credibility. If the model is applied for scenario analysis, SA can give us an indication of the impact of our decisions if the external environment changes. If results prove to be insensitive to broad changes in the inputs, we have more confidence that the model outcomes are likely to occur. A stronger likelihood of a known policy outcome occurring as implemented in a scenario analysis can add decision-making capacity to policymakers. The ultimate goal is to find limits within which the model output makes sense, evaluate model reliability, investigate the robustness of conclusions, and improve transparency (Saltelli et al. 2010).
Sensitivity Analysis Methods Used in ABM
In preparation for setting up a roadmap for purpose-driven mixed-method SA, we first discuss the SA methods identified in the ABM literature. We focus on method benefits and shortcomings. We do not aim at providing alternative implementations of the methods. For further information on these topics, we direct the reader to the practical manual by Thiele et al. (2014), and references therein.
SA has been categorized into local and global (Saltelli et al. 2004). Local SA (LSA) probes the immediate space of sample input values and evaluates how a relatively small change in input changes the output while holding all other inputs constant. Contrarily, global SA (GSA) is a group of methods that simultaneously probe the whole input space and analyze outcome variability both due to single inputs (first-order) and input interactions (second and higher orders).
| Method Name | Examples | Objective | Advantages | Disadvantages |
| LSA explores how single input affects the variability of the results. | ||||
| One-At-A- Time (OAT) | (Du & Wang 2011) | Explores how small deviations in a single input affect the variability of the results. | Easy to implement and understand. | Impractical when dealing with a large number of inputs, does not account for input interactions, does not provide a succinct sensitivity measure [2], assumes that the model is additive and/or mono- tonic. |
| One-Factor- At-A-Time (OFAT) | (An et al. 2005; Railsback & Grimm 2019; ten Broeke et al. 2016) | Explores how deviations in a single input, evaluated across its whole spread, affect the variability of the results. | Easy to implement and understand. | Has the same limitations as OAT. |
| Graphical Methods[3] | (Filatova et al. 2009;Huang et al. 2013; Sun et al. 2014). | Visual depiction of output-input dependencies, e.g., scatterplots, contribution to sample mean/variance. | Fast and easy to interpret. | Similar limitations as other LSA methods in that each input is separately plotted against the output. |
| GSA explores how deviations in inputs, evaluated simultaneously across their whole spread, affect the variability of the results. | ||||
| Screening (Elementary Effects Method) | (Ayllón et al. 2016; Radchuk et al. 2016) | Rank-orders inputs based on their importance and therefore weeds out the non-influential inputs. | Model-independent with low computational cost, easy to understand, provides succinct sensitivity measures per input (\(\sigma , \mu \)*), efficient when dealing with a large number of inputs (even 100s), identifies inputs that participate in interactions. | Uses crude sampling i.e., a relatively low number of sample points with respect to the number of inputs. The sensitivity measures are insufficient when comparing input importance in relation to each other, inappropriate when the output is not normally distributed. |
| Regression | (Filatova et al. 2009; Huang et al. 2013; Lee et al. 2015; Sun et al. 2014) | Fits a regression function of inputs to a given output. The regression coefficients become sensitivity measures of inputs. | Regression coefficients provide information about the magnitude and the direction of input influence. Relatively easy to understand. | Assumes that the ABM is additive and monotonic, handles a low number of inputs, and is limited when evaluating the interactions between inputs. |
| Metamodeling (Emulators, Response Surfaces) | (Arbab et al. 2016; Fonoberova et al. 2013; Mertens et al. 2017; Şalap Ayça et al. 2018) | Uses a relatively simple mathematical function to approximate the relationships between inputs and outputs obtained by running the original model. The metamodel is then used to identify the influential inputs. | Lower computational cost than in the case of the original model – simpler model requires a smaller number of executions. Model complexity is captured using simple mathematical expressions. | Handles a relatively low number of inputs, sensitivity measures from emulators may be harder to interpret than indices calculated directly on ABM outputs. |
| Variance- Based SA | (Ayllón et al. 2016; Du & Ligmann-Zielinska 2015; Ligmann-Zielinska & Sun 2010; Magliocca et al. 2018; Zhang et al. 2019) | Decomposes output variance and assigns the partial variances to individual inputs and their interactions, produces two sensitivity indices per input – first order and total effect, which allow for a complete evaluation of a given input in a nonlinear, non-additive model. | Model independent, produces succinct measures of input influence. | Handles a relatively low number of inputs, and requires a large number of ABM executions, inputs are assumed to be independent, less reliable when the output is not normally distributed. Unlike the regression coefficients, variance-based sensitivity measures do not provide information on the directionality of input influence. |
| Density- Based SA | (Magliocca et al. 2018) | Uses the entire probability distribution of a given output to identify influential inputs. Sensitivity is computed using differences in the entire model output between model executions. | Model-independent, does not assume output normality, moment independent (the whole output distribution captures output variability better than specific moments like variance). Allows for exploration of outliers. | Handles a relatively low number of inputs, still in its infancy - the specific metrics are not well- established in the literature (Puy et al. 2019). |
| Topology Oriented SA (TOSA) | (Du & Ligmann-Zielinska 2015; Du 2016; Du & Wang 2011) | Unlike all other methods presented here that evaluate sensitivities based on changes in values, TOSA uses changes in topological space (structure) of the input-output datasets to quantify sensitivities. | Model-independent, does not rely on statistical tests and their assumptions (normality, input independence), useful in extreme scenario analysis, complementary to other GSA. | Handles a relatively low number of inputs, still in its infancy - the specific metrics are not well- established in the literature, has a high computational cost. |
| Temporal variance- based SA | (Ligmann-Zielinska & Sun 2010; Magliocca et al. 2018) | Uses variance-based SA to compute sensitivity indices for every time step of model execution (sensitivity indices are calculated at discrete intervals rather than the final snapshot). Enables the analyst to understand how a particular input affects model dynamics within model runs. | The same as variance-based SA. | Has the same limitations as variance-based SA. |
| Spatial variance-based SA | (Ligmann-Zielinska 2013) | Uses variance-based SA to compute sensitivity indices for spatially- explicit outputs, producing sensitivity maps. Renders patches of the influence of a given input on the areas with high output variance. | The same as variance-based SA. In addition, it produces multiple sensitivity maps that must be analyzed concurrently. | Has the same limitations as variance-based SA. |
| Geometry of Behavioral Spaces (GOBS) | (Cenek & Dahl 2016a, b) | Statistically based variance measure of the common patterns of agent behaviors. Translates agent trajectories to a state-space Markov model. | Tunable, cross-scale analysis of agent behaviors. Identifies changes to both low and high-frequency behaviors. Model independent. | GOBS needs a large number of trajectories from the ABM execution for the statistics to work. Limited to the AMBs with agents that continuously move on the simulation space and log their trajectories. |
Selected local methods
One-at-a-time (OAT) is the simplest form of SA to understand and implement since only one input at a time is evaluated. The assumption is that, if the results change greatly with slight variations in the value of an input, more effort should be invested in obtaining more accurate estimates of the value of that input. OAT has also been referred to as ‘sensitivity experiments’ (Railsback & Grimm 2019). OAT has been deemed as suitable for exploring mechanistic explanations of single input effects on outcomes (ten Broeke et al. 2016) and used in situations where the sensitivity of a model for a very specific input set is explored. OAT is used when ABM developers and decision-makers need to get an idea of how much model output would change when considering small deviations of the tested input from the initial value, e.g., plus/minus 5%.
An extension to OAT, known as one-factor-at-a-time (OFAT) (ten Broeke et al. 2016), uses stochastic modifications to inputs rather than small variations, to produce a graphical result depicting output against inputs. The OFAT procedure involves uniformly sampling N times throughout input K’s distribution and executing the model N times while holding all other inputs constant. The procedure is then repeated with another input while holding all others constant. OFAT SA results are presented as multiple plots, one for each variation of input on a selected output, which, for a large number of inputs, can be difficult to compare. According to ten Broeke et al. (2016), OFAT allows to identify inputs that generate tipping points, system collapse, path dependence, and nonlinear responses.
The major limitation of OFAT, which is also a limitation of OAT, is that changes in model behavior are assessed solely for individual input variables. OFAT fails to identify cases when a combination of multiple inputs analyzed causes drastic changes in model outputs. Due in part to these limitations, OAT (and OFAT) cover a minuscule portion of the input space and should not be used to understand the all-encompassing dynamics of the target system. For example, when dealing with ten input variables, OFAT is only able to evaluate 0.0025 percent of the input space (Saltelli et al. 2019). Therefore, SA results using only single input approaches, like OAT and OFAT, may generate erroneous inferences about the relative importance of model sensitivity to particular inputs.
Selected global methods
Screening
The screening method (aka Morris or elementary effects; Morris 2006) classifies inputs into [1] those that are negligible, [2] those that are additive and behave linearly, and [3] those that are non-linear or involved in input interactions (Saltelli et al. 2004). It also allows for probing the whole input space (albeit rudimentarily) and is ideal for models with a large number of inputs. Because it does not require a large number of runs to gain insight into input sensitivity, it is computationally cheaper than other GSA methods. The general technique is to run randomized individual OATs. Screening produces two sensitivity measures (\(\mu*\), \(\sigma\)). The absolute mean (\(\mu*\)) is a measure of the overall impact of the input on the model output, whereas the standard deviation (\(\sigma\)), is a measure of the higher-order effects of the model input, i.e., non-linear effects due to interactions with other inputs (Campolongo et al. 2007). The ultimate result is a ranking of inputs (you screen the inputs to identify the three mentioned above groups). However, screening statistics are not sufficient to quantitatively evaluate the significance of inputs in relation to each other (Campolongo et al. 2011). Specifically, screening does not pinpoint how the interactions among inputs affect the model output because the higher-order effects are lumped into a single metric \(\sigma\). Additionally, the mean and standard deviation parametric descriptors are unreliable when output is non-normally distributed. In practice, screening can be used to identify the most sensitive inputs, which are then used in more sophisticated GSA methods.
Metamodeling and regression
Metamodeling (aka emulators) describes a set of methods that try to explain the variations in the model output in response to the changes in the model inputs by fitting the outputs and inputs of that model into a (simpler) mathematical function (Kleijnen 2001). It is assumed that the relationship between output and input can be described in mathematical terms that are relatively easy to conduct and interpret. Emulators come in the form of both simple and complex formulations (Fonoberova et al. 2013), with the most basic form of a standardized linear regression (SLR). The regression coefficients become the sensitivity measures of model inputs. They provide both the magnitude and the directionality of the influence of a given input on the dependent variable (ABM output) (Saltelli et al. 2004). Two questions are addressed: to what extent does input K singly drive the variability of outcome M? and Is this dependence positive or negative? Using regression-based SA makes the outcome easy to understand, especially for people familiar with statistics. More complex emulators, i.e., metamodels that use complex equations, a set of equations, or artificial intelligence methods like machine learning – see, for example, Lamperti et al. (2018) allow for a detailed evaluation of input interactions, which are more appropriate for highly nonlinear output spaces (Lamperti et al. 2018). However, due to the more complex formulation, meta-models can also be difficult to interpret when applied to models representing multi-scale interactions common in complex systems (Mertens et al. 2017). Metamodels may fail to capture all endogenous interactions such as simultaneous casualties and oscillations, leading to incomplete information concerning the behavior of the system (Hassan et al. 2009; Lamperti et al. 2018; Mertens et al. 2017).
Variance-based methods
Variance-based SA (aka an ANOVA-based approach) decomposes the variance of model output and apportions the partial variances to inputs treated singly and in combination with an increasing level of dimensionality (Saltelli et al. 2008). The approach produces two measures: a first-order index (S) computes output sensitivity to independent (decoupled) inputs, and a total-effects index (ST) that encompasses the overall input influence - both individual and interactions with all other inputs. The most important advantage of variance-based SA over other approaches is that it is model-independent, i.e., does not require linear formulation. In this way, it can deal with the nonlinear relationships between inputs and outputs of a model, and, at the same time, can be used to fully consider the interactions among model inputs.
The major disadvantages of variance-based SA are the computational cost, the assumption that inputs are independent, and the assumption that output distribution is normal. The computational cost can be reduced by employing a systematic method for sampling all possible combinations of inputs (e.g., quasi-random sampling; Sobol’ 1993), grouping inputs (Ligmann-Zielinska 2018), or using high-performance computing (Tang et al. 2011). Assessing the independence of inputs and the distribution of outputs can be done using standard statistical methods (e.g., correlation analysis and Shapiro-Wilk’s, respectively).
The value of N-model runs is established by trial-and-error. There is no cut-off value to estimate the indices. A good indication is the stabilization of outputs (Lorscheid et al. 2011; ten Broeke et al. 2016). Thus the (S, ST) pairs should be reported with confidence intervals (ten Broeke et al. 2016).
Density-based approaches
Non-normal outcome distributions are commonly observed in complex systems due to a wide range of non- linear processes, such as economies of scale or path-dependence of development location due to infrastructure provision (Manson 2007). In such cases, assumptions about the normality of model output are violated, which is a common characteristic of models of complex systems. Density-based methods for GSA use ‘moment- independent’ measures of output sensitivity (Borgonovo 2006; Borgonovo et al. 2012). Sensitivity is characterized by differences in the entire model output distributions between model executions, rather than specific moments of output distributions like variance. Pianosi & Wagener (2015) developed a density-based sensitivity index, called PAWN, which uses differences in cumulative density functions (CDFs) of model output to quantify model sensitivities.
Magliocca et al. (2018) applied the density-based approach in tandem with variance-based GSA to characterize sensitivities in housing and land markets to coastal storms of varying frequency. For example, in interactions between consumer preferences for coastal amenities and housing stock composition, variance-based GSA established amenity preference as a significant contributor to outcome sensitivity, but density-based GSA was able to discern that high and low values were solely responsible for variation in housing stock composition.
An advantage of the density-based approach over the variance-based methods is that model sensitivities can be investigated within particular parts of the output distribution, including outliers that may represent low probability high impact events. Also, density-based GSA can indicate the direction of model output sensitivities with input variations.
Roadmap to Sensitivity Analysis Method Selection
Lorscheid et al. (2011) urge the modeling community to pay more attention to the design of computational experiments. Proper design optimizes model execution and adds transparency to ABM output synthesis. Just like there are protocols for experimentation in the physical lab, there are protocols to follow for ABM experimentation and reporting (Grimm et al. 2014, 2006). SA should be a mandatory part of that experimentation.
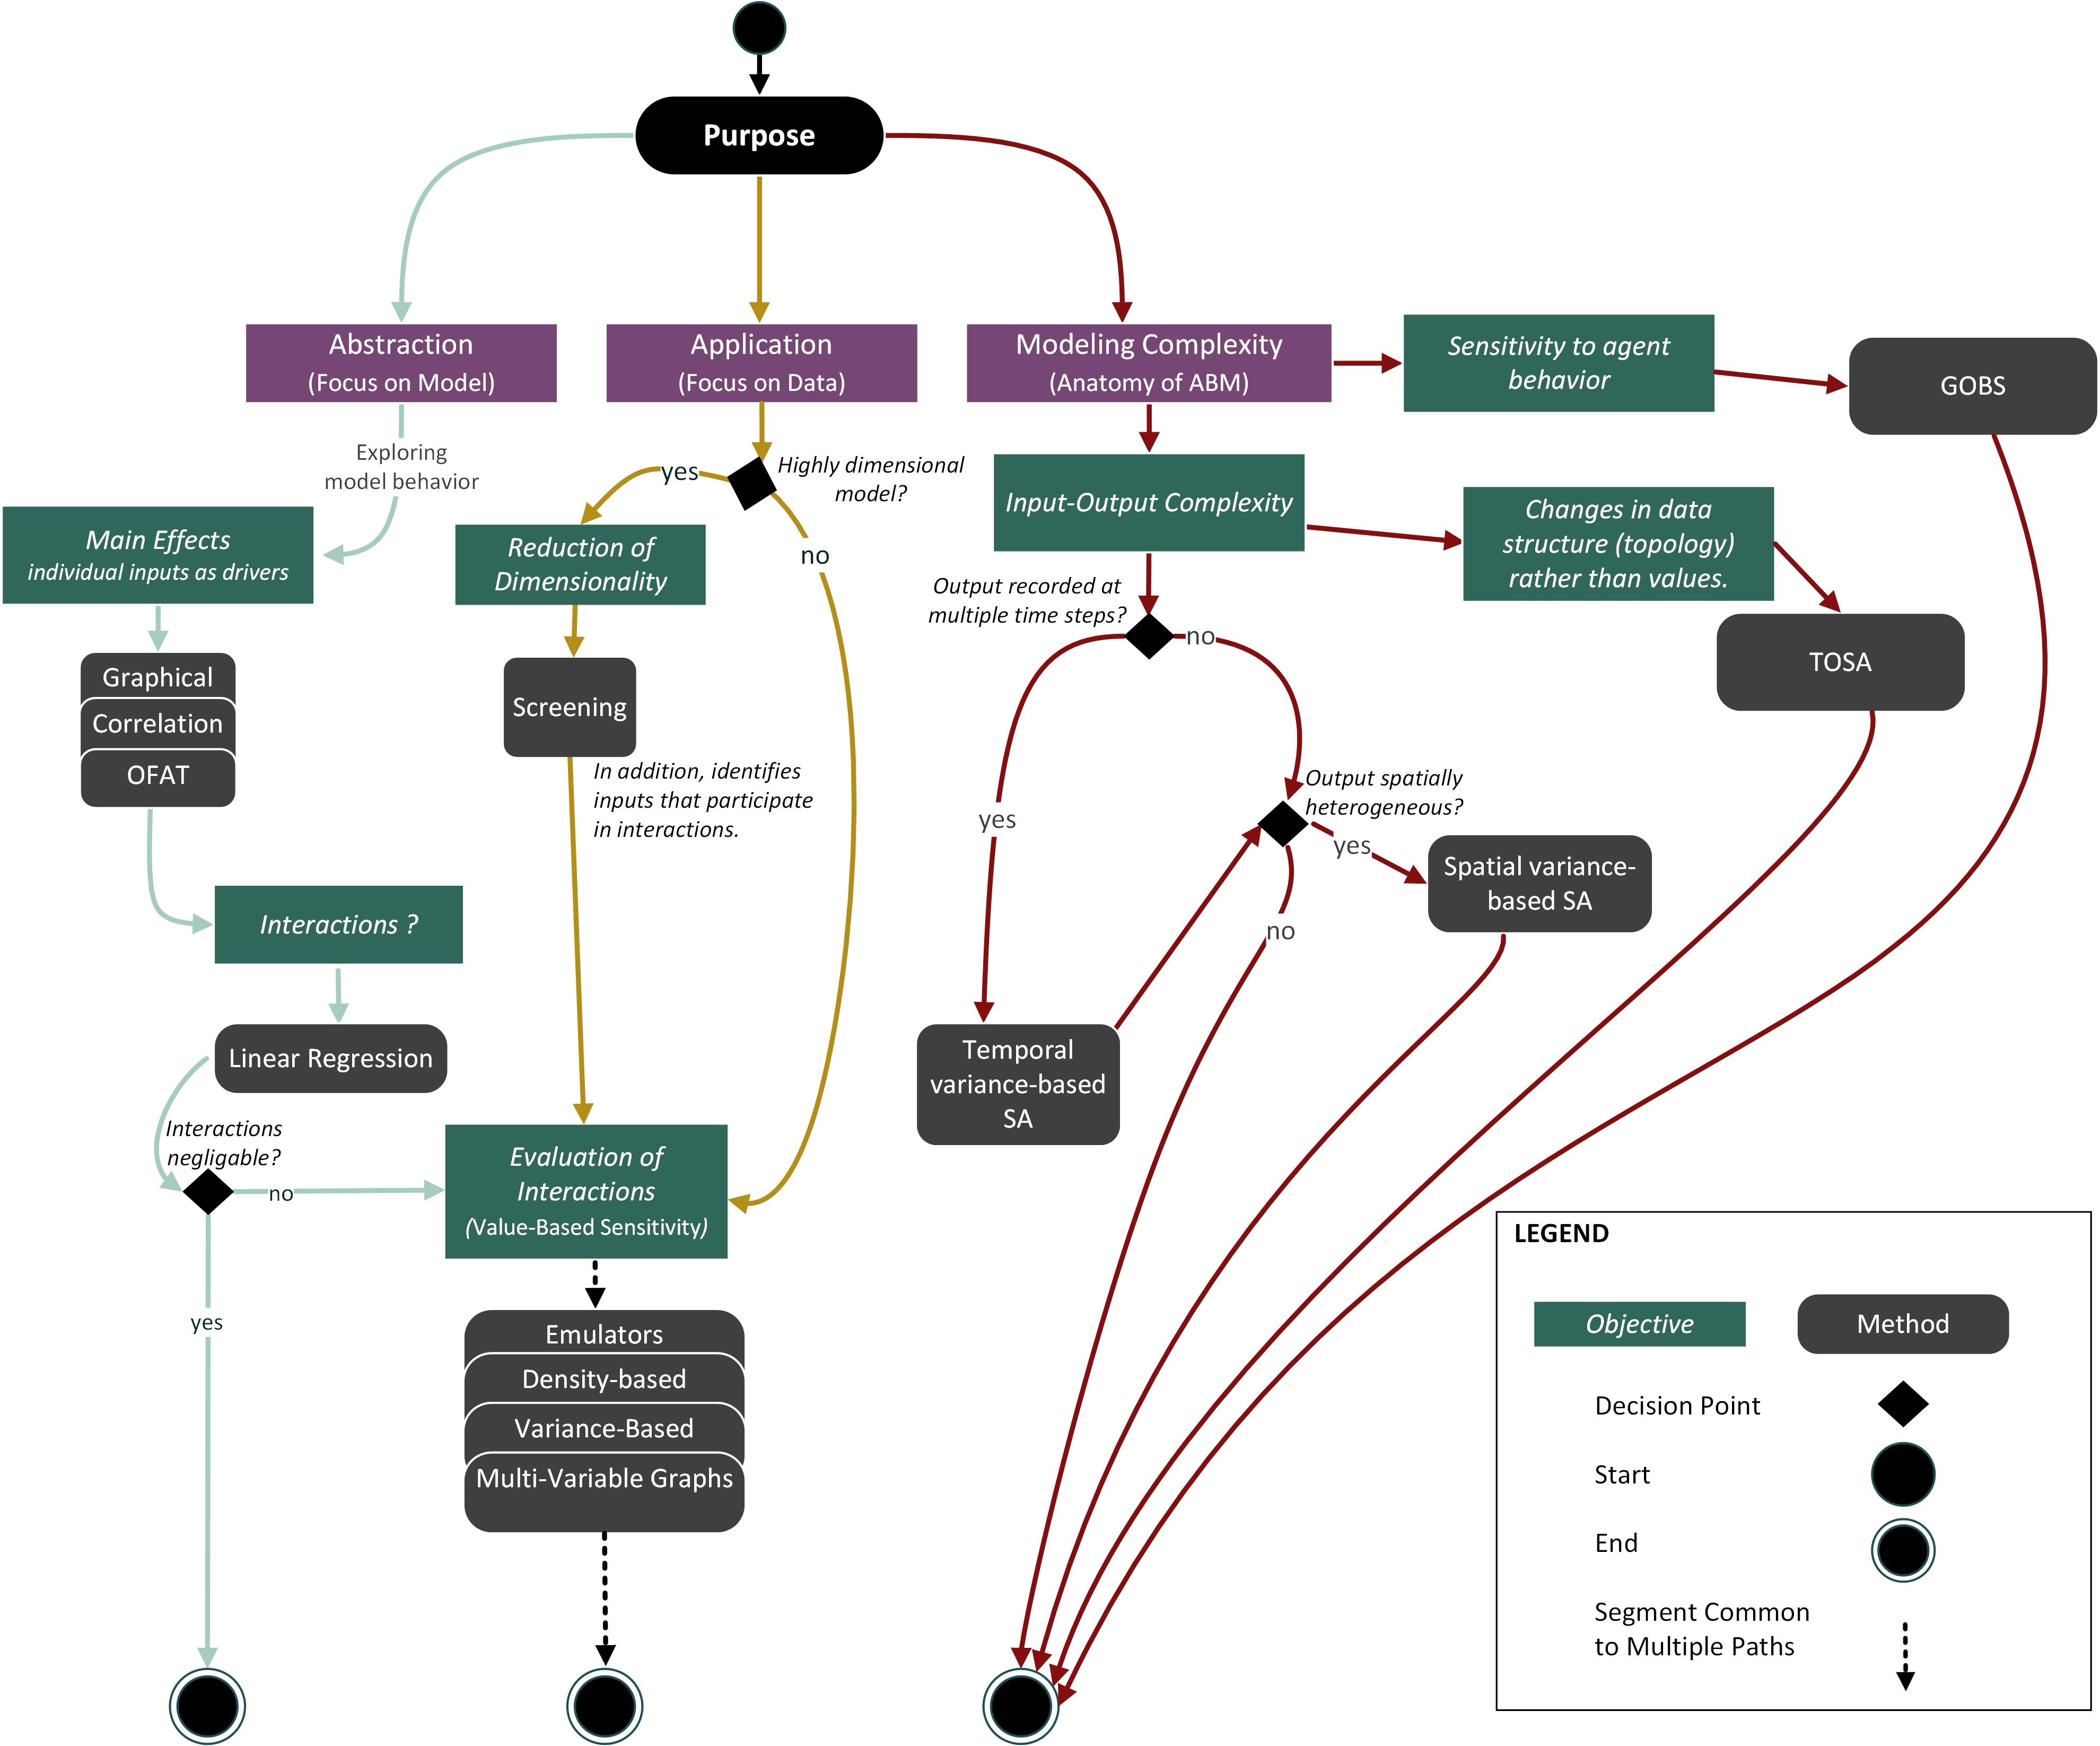
Since ABMs are often a result of an interdisciplinary effort, the selection of a proper SA method may become problematic. Hence, we propose a more unified approach to SA based on the purpose of the model rather than the domain(s) within which it is positioned. Campolongo et al. (2011) and Pianosi et al. (2016), among others, suggest a mixed-method approach – starting from a rudimentary (quick-and-dirty) method like screening and then progressively moving to large-sample but also more comprehensive methods, e.g., variance-based or density-based approaches. We argue that the purpose of the model should drive the successive selection of methods. We provide a mixed-method SA in the form of paths consolidated into a roadmap (Figure 3).
In the next section, we describe the paths in more detail. Following these descriptions are examples demonstrating the use of these paths.
Sensitivity Analysis Path Selection
We identified the paths by balancing cost (time, access to high-performance computing) with the extent of SA (rudimentary SA, first-order calculation, higher-order effects evaluation, etc.). As mentioned by Saltelli et al. (Saltelli et al. 2019; Saltelli & D’Hombres 2010), poorly performed SA does not help in model evaluation, may lead to false conclusions, and, in the end, becomes a redundant (or even misleading) exercise. We aimed to identify the minimum number of methods required to comprehensively study ABM sensitivity given the model’s purpose, while, at the same time, address the strong points and deficiencies of individual methods. In the following, we describe the paths in more detail.
Abstraction
The Sea Green Path (Figure 3, left) pertains to an ABM built for the purpose of abstraction (exploration). The focus is on delving into the relationships between model structure and behavior and evaluating model parsimony. The developers should start from sensitivity experiments that explore the main (first order) effects to test which inputs singly contribute to the variability of a particular output. An example method to use is calculating correlation coefficients between a given input and the selected output or their visual analysis through scatterplots. The main effect analysis is then followed by tests for the existence of input interactions and, if the interactions are present, their evaluation. Developers are encouraged to use graphical tools generated from OFAT, as demonstrated in ten Broeke et al. (2016), to gain a quick-and-dirty understanding of model behavior. OFAT can be employed to study the variations in inputs that were a priori identified as potentially influential, or inputs that the model developer is particularly interested in.
It is prudent to assume that ABMs are imbued with input interactions that need to be studied. We argue that to truly understand the behavior of a given ABM (feedbacks, path dependence, emergence), the mare- effects analysis needs to be followed by tests for the existence of interactions (i.e., whether considerable interactions are present in the model). The crudest method here is a standardized linear regression (SLR). SLR is computationally efficient – it does not require a large number of model runs. It is also easy to communicate. Extending the main effects analysis with SLR requires little additional work, and the foreboding limitations of OFAT can be resolved.
A final step is to evaluate the nature and magnitude of interactions. A number of GSA can be employed – from variance-based, through emulators, multi-dimensional plots, to density-based approaches.
Application
In application-based approaches, the purpose of the ABM is to produce a reliable model that can be used to propose courses of action for a specific real-world problem. To build trust in a model and develop its capability to address a practical problem, it needs to be empirically-rich, hence the focus on data. Given these objectives, we propose a different SA pathway (Figure 3, Yellow Path – center). This path involves a reduction of dimensionality (if needed), followed by a joint analysis of the individual and cumulative contribution of stochastic inputs on the variability of outputs. The assumption here is that the ABM is of high-complexity where interactions are imminent and should be studied.
If a model contains a large number of inputs, a reduction of dimensionality can be done to determine which inputs have no effect on output variability and then those inputs may be set to constant values. The screening method is an efficient approach to complete this task (Saltelli et al. 2008). Furthermore, models with a smaller number of stochastic inputs are easier to communicate to the decision-makers and the public. A disadvantage of dimensionality reduction is that it depends on the output used to evaluate the output-input dependencies (Kang & Aldstadt 2019; Ligmann-Zielinska 2018). As Ligmann-Zielinska (2018) demonstrated, the number of inputs that can be set to constant values goes down with the number of outputs considered in SA. Input k may considerably affect the variability of output A but not output B. If both outputs are equally important to address the research problem, then input k should be left unchanged. The surrogate model should demonstrate roughly the same characteristics as the original model (e.g., the shape of output distribution, summary statistics).
After the reduction of dimensionality, we propose to move directly to evaluating interactions using GSA approaches that result in numerical sensitivity metrics. The goal is not as much about gaining insight into the model, as the SA results are often hard to interpret, but rather its reliability for scenario analysis and real-world decision making. In this case, we ideally want to end up with an ABM that increases modeler (and the public) trust in model outcomes. The direct use of global methods that quantify both single and combined sensitivities (like the (S, ST) indices) provide tools that can be used to assist in negotiation between stakeholders that have different objectives.
As previously mentioned, the ‘evaluation of interactions’ methods in Yellow Path are computationally expensive. However, since the modelers jump straight into the comprehensive SA, the overall time spent on investigating the SA results can become relatively short, compared to the multi-level and longer Sea Green Path.
Modeling complexity
To truly embrace the capability of ABMs, we should strive to gain an understanding of the inner processes during model execution as well as model behavior across a spectrum of output variability. This pertains to both abstract and applied ABMs (Figure 1). We named this purpose ‘modeling complexity’ and depicted it as a separate modeling purpose (Figure 3, Brown Path – right). Below we describe advances to current standards of SA that aim at improving our understanding and ability to quantify the inner workings of ABMs. We focus on four aspects of modeling complexity using an ABM approach: the specifics of both spatial and temporal outputs, the structural (topological) relationships between input and output variables, and the causal relationships within the ABM itself that can be traced back to individual agents.
Dealing with spatial outputs
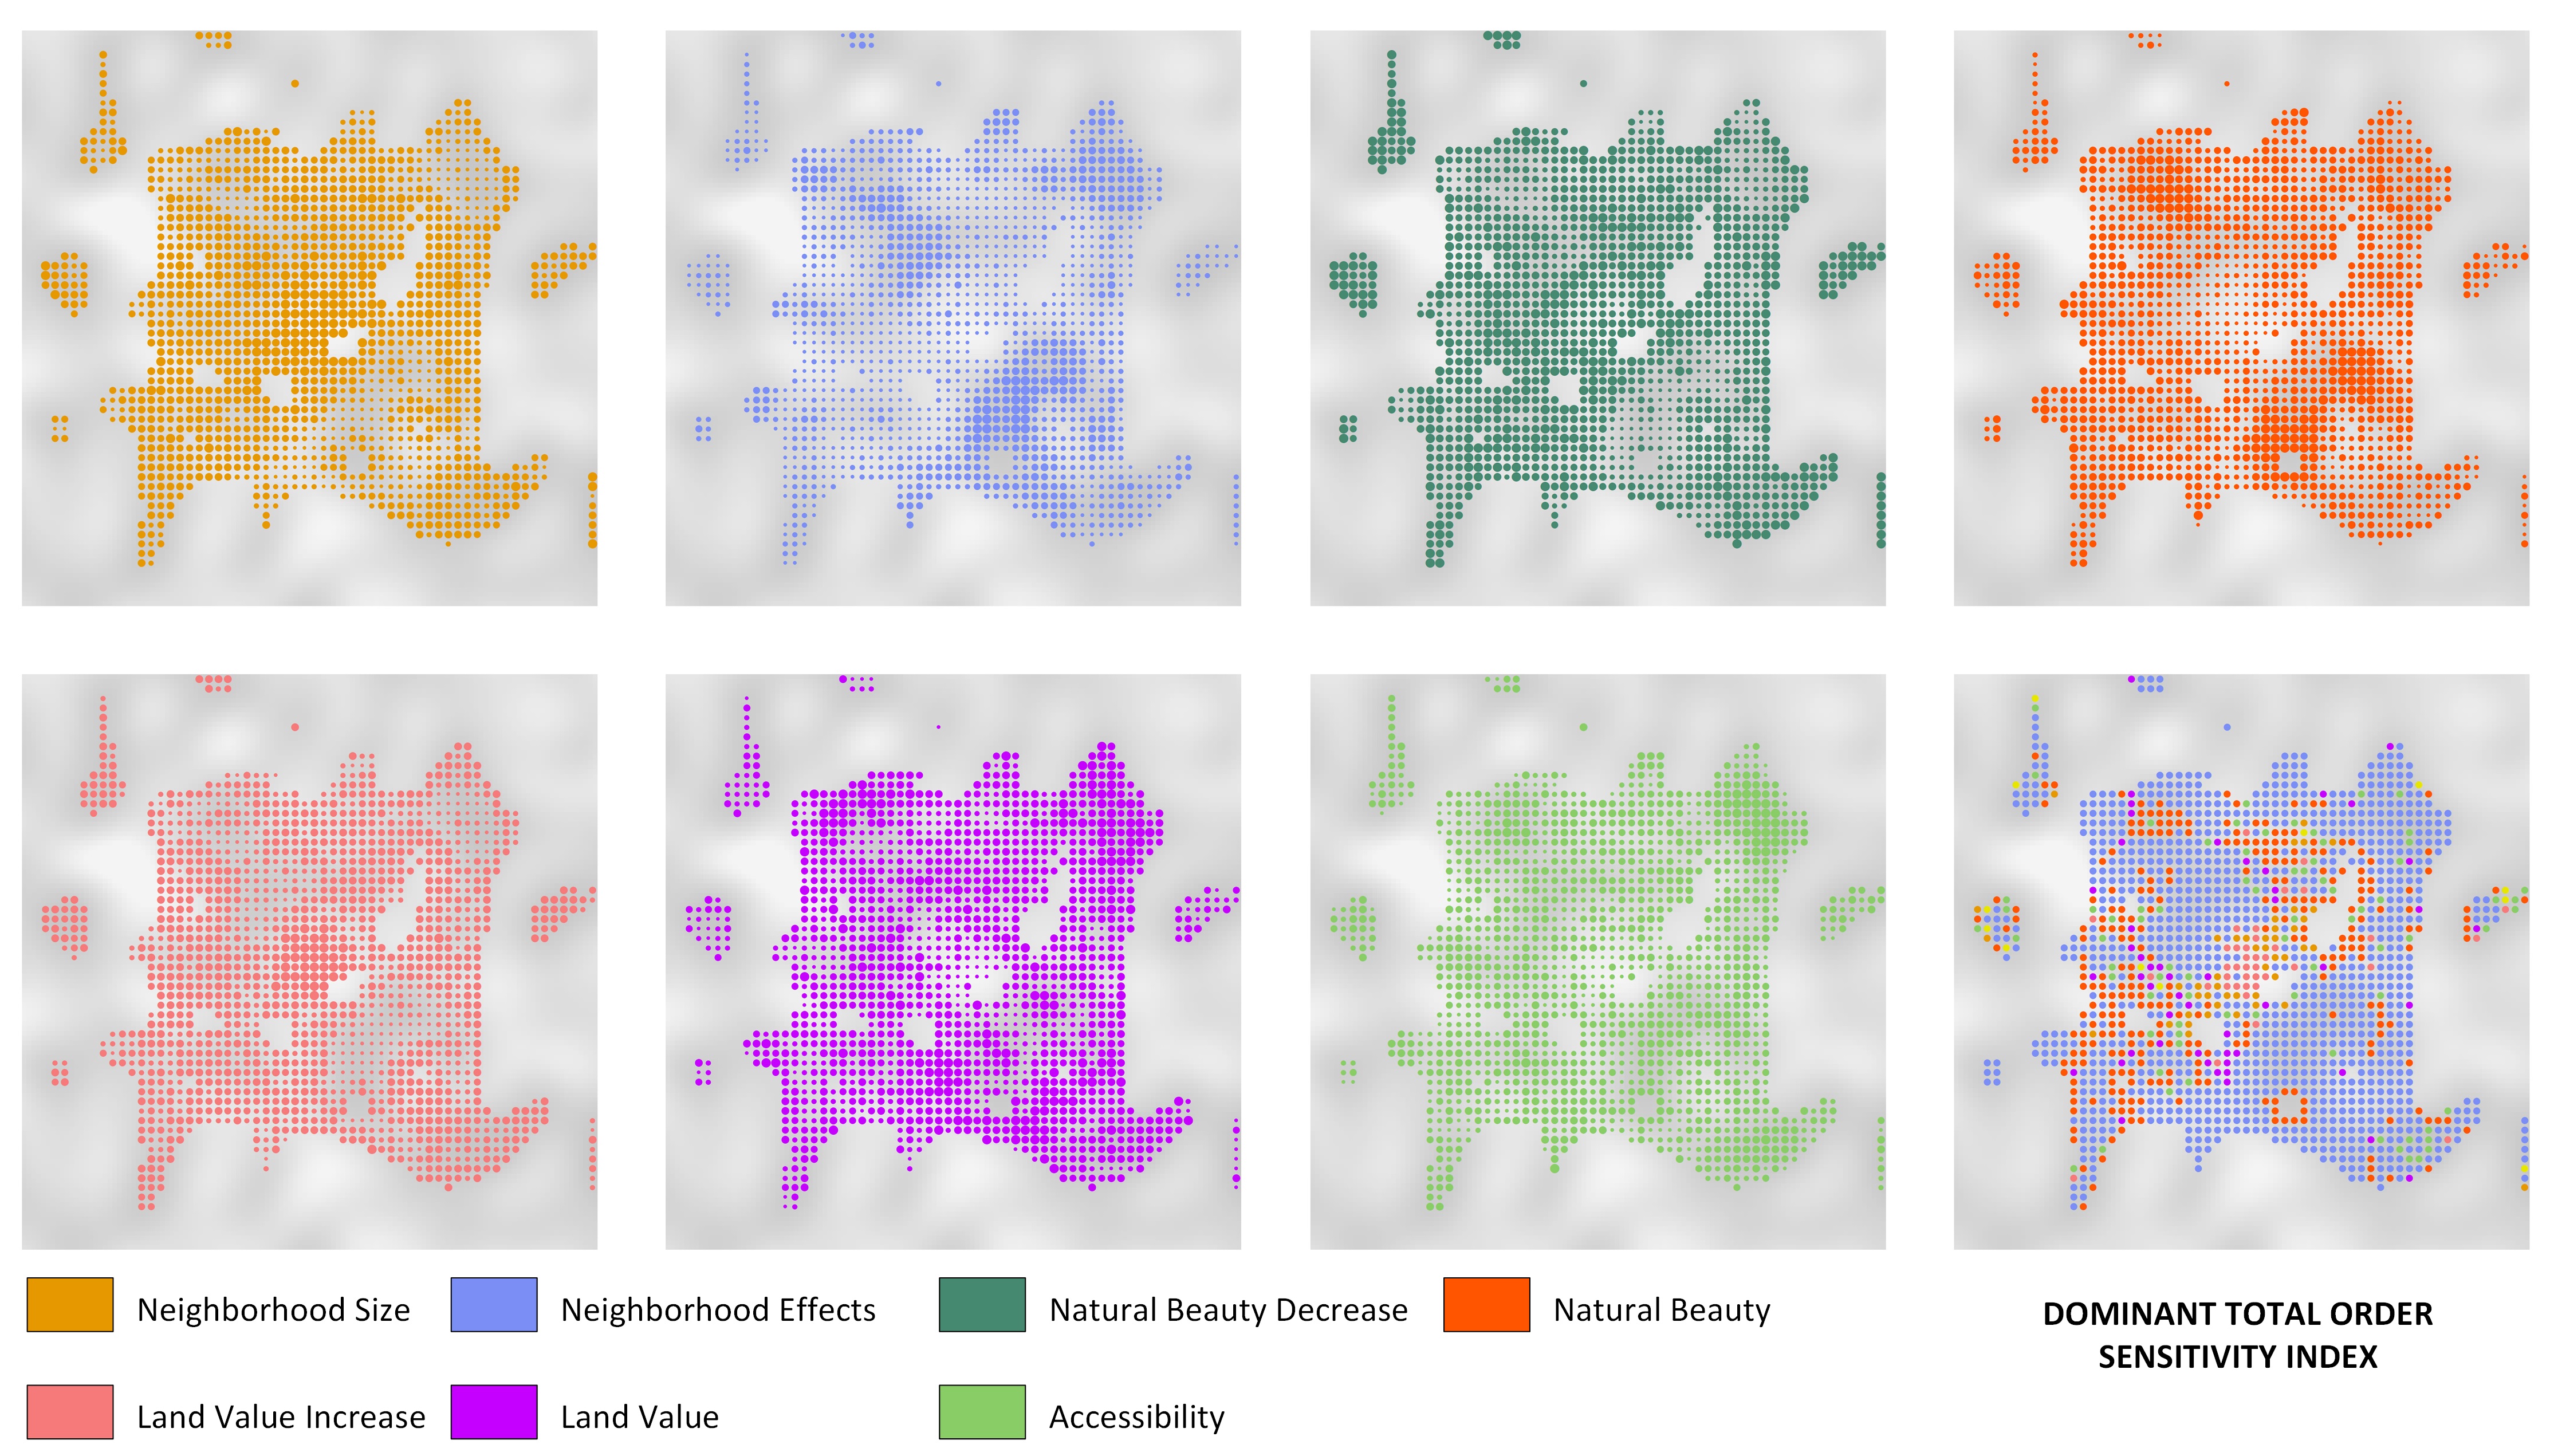
In practical terms, the purpose of the model is reflected in its results. Therefore, the type of model output should also dictate the choice of the SA method. If a model operates across a geographic area (or a two/three- dimensional space), we may also require spatially-explicit approaches to SA. Many ABMs produce spatially- explicit outputs like maps of land-use change e.g., Robinson et al. (2012), biodiversity loss due to human activity, or population vulnerability to hunger. As with any other result of the simulation, output maps come in different realizations depending on input values. Assuming that a systematic investigation of the input space has been performed, these realizations constitute a two-dimensional distribution of the possible output space (the x and y coordinates). Unless lumped into an aggregate statistic (Ligmann-Zielinska 2013, 2018), such outputs produce a major interpretative challenge. For example, a raster map of the size 100 x 100 amounts to 10,000 (spatially auto-correlated) output variables to explain, where each cell constitutes one variable. Ligmann-Zielinska (2013) proposed variance-based SA as a method to identify the influential inputs of maps produced from an ABM of residential development. The method independently calculates sensitivity indices for every spatial unit in model output (e.g. a polygon for vector data or a cell in a grid). Example results are sensitivity maps as shown in Figure 4.
The uniqueness of the method is that it renders patches of the influence of a given input on the areas with high output variance. A unique challenge is that it produces multiple sensitivity maps that must be analyzed concurrently (Figure 4). The number of sensitivity maps depends on the number of model inputs. K inputs produce 2K+1 maps – K first order maps, K total effect maps, and one interactions map. Even with a relatively low number of inputs, the interpretation of spatially-dependent sensitivities may be difficult. To reduce this analytical challenge, the K sensitivity maps can be synthesized into one dominant sensitivity index map (Ligmann-Zielinska & Jankowski 2014), which partitions the space into regions represented by inputs that have the highest index value at a given location (i.e., an input that ‘dominates’ other inputs – Figure 4 lower right corner).
Dealing with temporal outputs
Most GSA applications use ‘final snapshot’ analyses of model outcomes, which assume that input influence is stable or changing at consistent rates throughout model execution. If this is not the case, which is typical for emergent behaviors, the final state of model outcomes does not provide insight into the relative and varying importance of particular inputs throughout model execution (Ligmann-Zielinska & Sun 2010; Richiardi et al. 2006). Time-varying GSA, specifically variance-based GSA, shifts the focus from how variability in model inputs influence model outcome patterns, to how input variability influences the transition of one variable or system state to another. This is of particular concern since ABM is a process-based simulation technique (Bone et al. 2014). Time-varying GSA is essentially an application of conventional GSA calculated at discrete intervals during model execution, which enables the analyst to understand how a particular input affects model dynamics within as well as across model runs.
Dealing with changes in data structure
Topology Oriented Sensitivity Analysis (TOSA) is a network (structure)-based SA method utilizing the geometric and spatial properties of input data. Developed by Du et al. (Du & Ligmann-Zielinska 2015; Du 2016), TOSA is novel in that it is used to quantify the topological differences between model input data and output data as a holistic indicator of sensitivity.
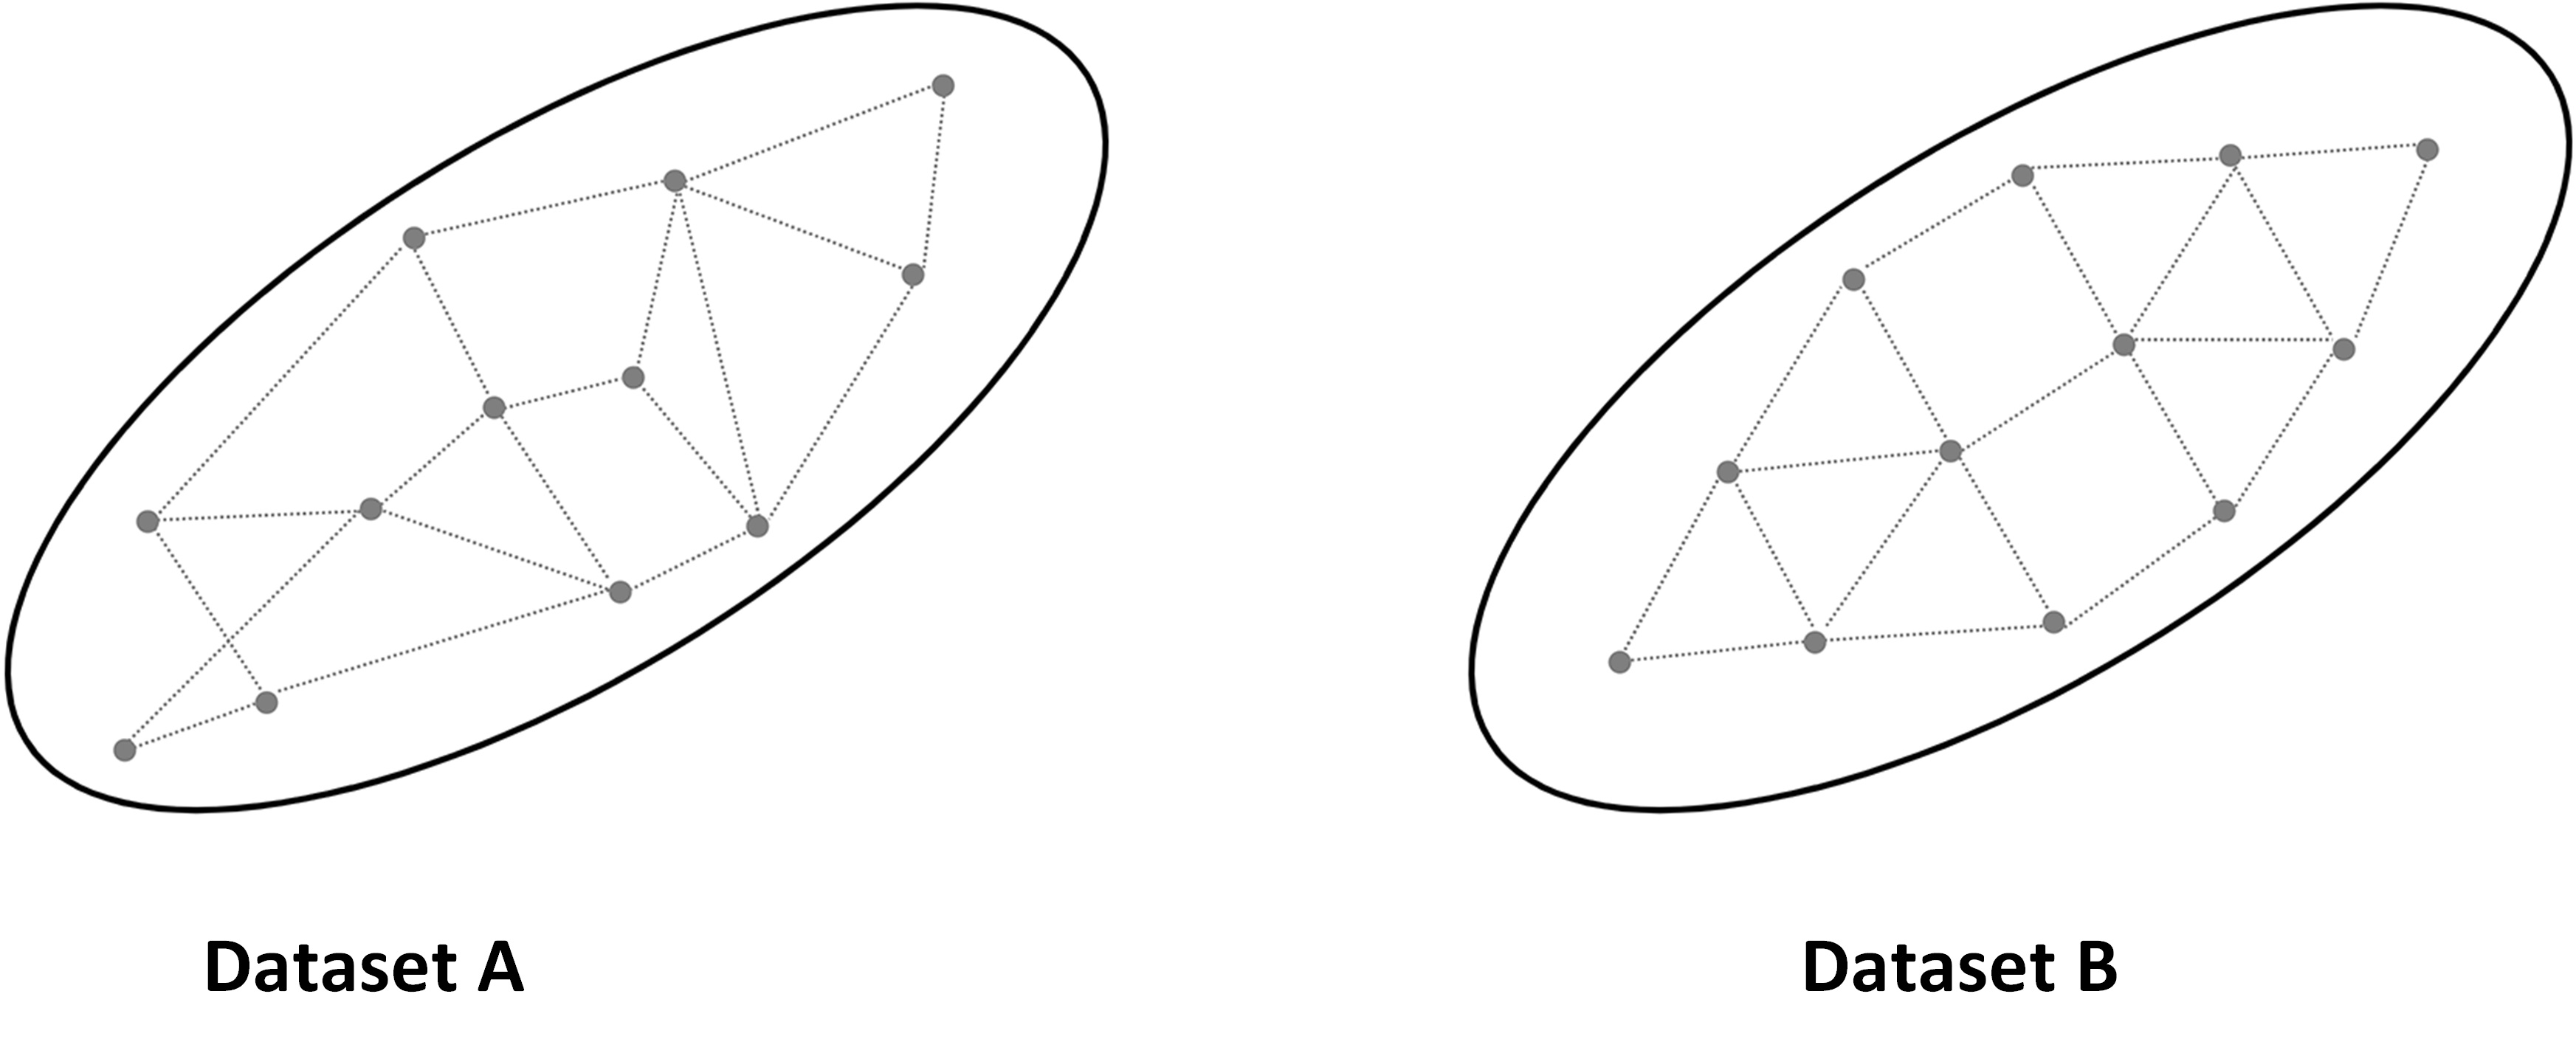
Most SA approaches (section 4) quantify sensitivities based on the change in values. However, datasets with identical statistical features (e.g., variance) may be differently spaced, resulting in diverse topological structures. As a result, two inputs of identical influence on output variability, measured using variance, may have a different effect when evaluated within the topological space (Figure 5). Suppose that Dataset A and B are two different outcome spaces and when a value-based SA is applied both datasets end up with the same variances. Consequently, the importance of each dataset in terms of driving output variability will be equal. But, within the topological space, Dataset A has a more random pattern, and Dataset B has a more uniform pattern. TOSA can expose these hidden differences by capturing the relative ‘movement’ of data points between the pre-model and post-model space. TOSA allows for grouping outputs based on their relative locations in the multidimensional output space, identifying, for example, which input datasets significantly affect specific clustering of outputs.
TOSA defines sensitivities of a particular input when this input is added to the model. When the data space demonstrates more volatility after the input is added, it suggests a high level of model sensitivity to this input. For a value-driven SA, we observe how much variance in the output is reduced by removing an input, while for TOSA, we observe how much output-input topological change is observed by removing an input. TOSA provides a different yet complementary approach to interpret model sensitivity.
Modeling complexity
A critical reason for the development and use of ABMs is that they are able to represent the characteristics and heterogeneity of real-world actors as well as their behaviors and interactions that give rise to system-wide, emergent, self-organizing patterns characteristic of the real-world phenomena (Crooks et al. 2008; Filatova et al. 2013; Rounsevell et al. 2012). Because of these inherent properties, the relationship between initial conditions (i.e., input values) and system/model paths and outcomes is unknown a priori. Thus, understanding the full range of model behavior requires an investigation of agent-to-agent and agent-to-landscape behaviors across multiple scales and locals of interactions.
Cenek & Dahl (2016a, 2016b) introduced the Geometry of Behavioral Spaces (GOBS) as a framework that quantifies the nature of agent behaviors during model execution. This method analyzes the model’s emergent behavior from the agent’s spatio-temporal trajectories that produce a system- and simulation-wide probabilistic model of agent behaviors. GOBS is a statistically based framework that first records agents’ trajectories that are then analyzed for common patterns of stable behaviors called behavioral primitives, exhibited by the agents during model execution. The final step is to measure the likelihood of an agent in a given behavioral primitive to either stay in the same stable behavior or transition to a different primitive. The authors illustrated the use of GOBS as a SA tool to automate the exploration of the input search space to detect system regime shifts, tipping points, and condensation versus dissipation of collective system behavior.
In the context of SA, GOBS analyzes how two model executions differ from each other in terms of exhibited agent behaviors. The framework measures ABM sensitivity relying on its ability to detect new behaviors introduced by changing input(s) values or model drivers. The SA also quantifies how many agents were in which behavioral primitives at the end of the model execution or at any given time of the execution. SA using GOBS offers a measure of uncertainty between two model executions using the units of exhibited behavior.
Example Applications
Abstraction
An example of a mixed-method SA that follows the abstraction path (Figure 3, left) is a study by Parker and colleagues (Filatova et al. 2009; Huang et al. 2013; Sun et al. 2014) who developed a suite of agent-based land market models. Their primary question was whether, and to what extent, the degree of representation of land markets affect model outcomes represented as patterns of urban sprawl and land prices. They used various SA to analyze how model inputs and model operation rules impacted their model outcomes. Initially, they used an approach akin to OAT to explore the effects of agent heterogeneity on model outcomes with other inputs fixed. To address the deficiencies of OAT, they augmented their analyses with regression and graphical methods. They used three-dimensional plots to explore the effect of heterogeneous risk perceptions on land market outcomes in a model with a fixed market, spatial elements, and preference elements (Filatova et al. 2009). Huang et al. (2013) examined how agent heterogeneity impacted spatial and social model outcomes across a range of values for agent preferences and market representation when agent’s preferences and budget were stochastic. They used a variety of two and three-dimensional plots to visualize differences across experiments. Sun et al. (2014) focused on the effects of land market assumptions on social and spatial outcomes, assuming agent homogeneity. They used descriptive statistics, linear regression, and comprehensive plots to explore differences between model rule settings. In all these examples, Parker et al. found that each SA method revealed some aspects of the relationship between market representation and heterogeneity on spatial patterns of sprawl and land prices while obscuring others. They determined that regression analysis is not a complete—or even sometimes a correct—tool for analysis of the sensitivity of a model representing a complex system. At the same time, several of their graphical representation methods were quite revealing. In future research, the authors could employ one of the interaction evaluation methods (from Figure 3) to account for the limitations of regression. They are also interested in exploring regression trees as GSA.
Application
The utility of screening was demonstrated in a data-rich ABM developed by Radchuk et al. (2016). They used SA to understand the drivers of vole population dynamics. The authors included 22 inputs in their analysis, and the design of the screening resulted in (just) 1150 model runs. Two groups of model outputs were examined: the first one reflecting vole demography (mean and standard deviation of the vole population size) and the second one focusing on the cyclicity of the population dynamics (the amplitude and period of cycles). Their SA indicated that, if the population size was used as the output, the most sensitive inputs were a set of intrinsic inputs (i.e., inputs involved in the survival and reproduction processes of the vole). However, if the model output was quantified by metrics reflecting the cyclicity of the population dynamics, the most sensitive inputs were those that represented both intrinsic and extrinsic (predation) inputs. Only one input was found as non-influential when using both groups of model outputs - this input was involved in the description of the mustelid (predator) effect on voles (prey). Additionally, the majority of the inputs that largely affected the outputs were acting in an interactive or non-linear way.
As shown in Radchuk et al. (2016), when dealing with multiple outputs, ABM may exhibit different sensitivities to its inputs. In a different study, Ligmann-Zielinska and colleagues came to the same conclusion (Ligmann-Zielinska 2018; Ligmann-Zielinska et al. 2014). The ABM they developed simulates farmers’ enrollment into Conservation Reserve Program (CRP) (USDA 2012). Their ABM was designed based on a public notice describing the criteria used in CRP enrollment and the procedure to select offers submitted by farmers to the farm agency. The model was built to identify how farmer enrollment and agency selection decisions affect the allocation of federal funds to reassign agricultural land from production to conservation. Their ABM aims to solve the problem of maximizing the environmental benefits from CRP while minimizing the cost per acre of the enrolled land. Outputs include the cost of enrollment, acres enrolled, and different measures of land fragmentation. Since the SA involved the evaluation of multiple outputs, the authors assumed that some of the inputs might cause nonlinear behavior. They selected variance-based GSA as a method of evaluating model sensitivity. The first two outputs – total land enrolled and the cost of enrollment – exhibited an almost linear behavior, and were the most sensitive to different realizations of the environmental benefits index. The land fragmentation statistics, on the other hand, were most sensitive to the interactions among inputs (less than 50% of the variability in every metric was explained by individual inputs). The ABM was validated using an independent data source and can be operationally used to provide recommendations for optimal land rental at specific locations.
Modeling complexity
Topology-based SA
Topology Oriented Sensitivity Analysis (TOSA) has been used in studies led by Jing Du (Du & Ligmann-Zielinska 2015; Du 2016; Du & Wang 2011). The focus was on comparing the outputs of value-based GSA with the outputs of structure-based TOSA to demonstrate the hidden properties of ABMs that could not be identified with traditional value-based approaches.
The flagship TOSA application is reported in Du & Wang (2011). They investigated how people’s daily travel behaviors affected and reshaped the long-term form of a city. TOSA was used to evaluate the importance of seven inputs, including population, traveling preferences, shopping behaviors, initial urban setup, and socio-economic status of families. The analysis was performed to understand how to control automobile use in the long-term future. Outputs included the final number of stores, the total walkable distance, and the total driving distance. In the study, TOSA was compared with GSA. TOSA was able to reveal two inputs – the preference for the store, and preference for accessibility – that have potential influences on the future of the urban configuration. Those two inputs were identified as non-influential using the other (GSA) methods. Traditional value-based SA failed to capture this nuance because it was hidden behind dataset topology rather than the mean value or variance of the output.
Temporal outputs
Only a few ABM applications of time-varying GSA have been performed. Ligmann-Zielinska & Sun (2010) examined time-varying GSA of a land-use ABM, and found that spatial outcomes, such as the size of the largest contiguously developed area, showed varying sensitivity throughout model execution due to feedbacks among landscape characteristics, such as perceived scenic beauty and land values, that varied as development patterns changed. Magliocca et al. (2018) applied a similar approach in a coastal setting. They demonstrated short- term sensitivities to storm frequency and coastal amenity values immediately after storm events, and long-term cycles of model outcome sensitivity due to interactions among economic fundamentals, such as discount rates and travel costs, as the area developed for housing increased over time.
Conclusion
We presented a review of sensitivity analysis (SA) methods used in ABMs to highlight the advantages and limitations of different approaches and highlight novel cutting-edge approaches. Using this review, the experiential knowledge of the coauthors, and qualitatively balancing cost (e.g., implementation and computation time) with the extent of the SA (e.g., first-order or higher-order effects), we developed three paths of sensitivity analysis. Our paths promote mixed-method approaches that are presented in the form of a roadmap for those seeking guidance in conducting a sensitivity analysis of ABMs or other models. A benefit of using a mixed-method approach lies in the opportunity for corroboration of output-input sensitivity among different methods, and, where overlap among different methods occurs, greater importance may be placed on those inputs.
Our constructed roadmap is purpose-driven and synthesizes three disparate paths taken by the ABM modeling community: abstraction, application, and modeling complexity. Broadly, these three paths are similar to those taken by modelers seeking to identify a proof of concept, produce predictive outcomes or increase decision- making capacity, and conduct exploratory modeling to gain insight into the effects that the themes of complexity science (e.g., thresholds, feedbacks, path dependence) have on a system of interest. We acknowledge that our roadmap is not comprehensive and is one of many that may guide others; however, to the best of the authors’ knowledge, it offers a first approach to structure a common pathway or protocol for SA in the ABM community. We hope that others will refine and extend the presented roadmap as well as use it to guide future model evaluation and inform those reviewing model outcomes about the practices for SA with ABMs.
While SA requires extra effort, it also provides important benefits. Increased use of SA in a specific ABM domain provides an indication of maturation of modeling because model analysis and – related to this – model selection and parameterization is less ad hoc. The development of a certain culture of ABM analysis is slow but unavoidable. For example, early individual-based models in ecology were often ad hoc, both in design and analysis; publication without any SA was possible and rather the rule than the exception. This was the situation in 1990. At some point, getting published without an OAT became difficult. More recently, reviewers have started criticizing OAT and call for more comprehensive methods. Therefore, GSA approaches become more common (Thiele et al. 2014). The trend of advancing model construction methodologies is prevalent in other areas that include protocols for ABM description (Grimm et al. 2006) or robustness analysis - RA (Grimm & Berger 2016).
Input uncertainty is an inherent characteristic of any ABM. It stems from the unpredictability of certain events and our incomplete knowledge of systems. GSA is useful and can provide important insights but may also be too complex to comprehend, becoming a black box itself. Better algorithms and visualization methods are needed to make the global methods more accessible to a broadly defined ABM community. Stakeholder participation can also aid formal SA (Corral & Acosta 2017). More case studies are needed to explain better the advantages of the novel SA approaches. It is important to find the right balance between the pragmatic and theoretic realization of SA.
This paper calls for treating SA as an integral part of modeling, in which SA-obtained insights add value to information derived from ABM. We need to continue to pursue SA as a key tool for understanding model performance. Avoiding sensitivity analysis is gambling with uncertainty. Clarke (2005) argues that SA is an obligatory step to establish model credibility. It is yet to be seen if SA becomes one of the key elements in the ABM code of ethics.
Acknowledgements
This paper was partially sponsored by USA National Science Foundation grant number: BCS #1638446 and SMA #1416730. We also thank the insightful comments and input from all the participants of the ABM Model Verification and Validation Workshop at the ABM 17 Symposium, sponsored by USA National Science Foundation grant number: BCS # 1638446. Any opinion, findings, and conclusions or recommendations expressed in this material are those of the authors(s) and do not necessarily reflect the views of the National Science Foundation. Support for Derek Thomas Robinson was provided by the Natural Sciences and Engineering Research Council (NSERC) of Canada under Discovery Grant (06252-2014). Nicholas Maglioccia was supported by the National Socio-Environmental Synthesis Center (SESYNC) under funding received from the National Science Foundation DBI-1052875. The authors would also like to acknowledge the contribution of students of the course on Geosimulation in spring 2017 taught by Ligmann-Zielinska. Their fruitful discussions about the role of sensitivity analysis in ABM contributed to many sections in this manuscript.Notes
- In this paper, we use the term ‘input’ for any variable model factor and its distribution – from parameters, through state variables, spatial inputs, to alterative sub-models in the ABM.
- In principle, OAT/OFAT can be used to produce partial derivatives used as sensitivity measures (ten Broeke et al. 2016). In practice, it is rarely reported. The disadvantage is that we deal with multiple measures rather than a single sensitivity index for first order interactions.
- Graphical methods are also used in GSA (2, 3 inputs) e.g., heat maps/contour plots that show model output (a single variable) vs. the variation of two inputs. Other examples can be found in Huang et al. (2013).
References
ALEXANDER, E. R. (1989). Sensitivity analysis in complex decision-models. Journal of the American Planning Association, 55(3), 323–333.
AN, L., Linderman, M., Qi, J., Shortridge, A. & Liu, J. (2005). Exploring complexity in a human-environment system: An agent-based spatial model for multidisciplinary and multiscale integration. Annals of the Association of American Geographers, 95(1), 54–79. [doi:10.1111/j.1467-8306.2005.00450.x]
ANDERSON, B., Borgonovo, E., Galeotti, M. & Roson, R. (2014). Uncertainty in climate change modeling: Can global sensitivity analysis be of help? Risk Analysis, 34(2), 271–93. [doi:10.1111/risa.12117]
ARBAB, N. N., Collins, A. R. & Conley, J. F. (2016). Projections of watershed pollutant loads using a spatially explicit, agent-based land use conversion model: A case study of Berkeley County, West Virginia. Applied Spatial Analysis and Policy, 1–35. [doi:10.1007/s12061-016-9197-z]
AUCHINCLOSS, A. H. & Diez Roux, A. V. (2008). A new tool for epidemiology: The usefulness of dynamic-agent models in understanding place effects on health. American Journal of Epidemiology, 168(1), 1-8. [doi:10.1093/aje/kwn118]
AUGUSIAK, J., Van den Brink, P. J. & Grimm, V. (2014). Merging validation and evaluation of ecological models to ‘evaludation’: A review of terminology and a practical approach. Ecological Modelling, 280, 117–128. [doi:10.1016/j.ecolmodel.2013.11.009]
AYLLÓN, D., Railsback, S. F., Vincenzi, S., Groeneveld, J., Almodóvar, A. & Grimm, V. (2016). Instream-gen: Modelling eco-evolutionary dynamics of trout populations under anthropogenic environmental change. Ecological Modelling, 326, 36–53. [doi:10.1016/j.ecolmodel.2015.07.026]
BARONI, G. & Tarantola, S. (2014). A general probabilistic framework for uncertainty and global sensitivity analysis of deterministic models: A hydrological case study. Environmental Modelling & Software, 51(0), 26–34. [doi:10.1016/j.envsoft.2013.09.022]
BONE, C., Johnson, B., Nielsen-Pincus, M., Sproles, E. & Bolte, J. (2014). A temporal variant-invariant validation approach for agent-based models of landscape dynamics. Transactions in GIS, 18(2), 161–182. [doi:10.1111/tgis.12016]
BORGONOVO, E. (2006). Measuring uncertainty importance: Investigation and comparison of alternative approaches. Risk Analysis, 26(5), 1349–61. [doi:10.1111/j.1539-6924.2006.00806.x]
BORGONOVO, E., Castaings, W. & Tarantola, S. (2012). Model emulation and moment-independent sensitivity analysis: An application to environmental modelling. Environmental Modelling & Software, 34(0), 105–115. [doi:10.1016/j.envsoft.2011.06.006]
BRANGER, F., Giraudet, L.-G., Guivarch, C. & Quirion, P. (2015). Global sensitivity analysis of an energy–economy model of the residential building sector. Environmental Modelling & Software, 70(0), 45–54. [doi:10.1016/j.envsoft.2015.03.021]
CAMPOLONGO, F., Cariboni, J. & Saltelli, A. (2007). An effective screening design for sensitivity analysis of large models. Environmental Modelling & Software, 22(10), 1509–1518. [doi:10.1016/j.envsoft.2006.10.004]
CAMPOLONGO, F., Saltelli, A. & Cariboni, J. (2011). From screening to quantitative sensitivity analysis. A unified approach. Computer Physics Communications, 182(4), 978–988. [doi:10.1016/j.cpc.2010.12.039]
CENEK, M. & Dahl, S. K. (2016a). Geometry of behavioral spaces: A computational approach to analysis and understanding of agent based models and agent behaviors. Chaos, 26(11), 113107. [doi:10.1063/1.4965982]
CENEK, M. & Dahl, S. K. (2016b). Towards emergent design: Analysis, fitness and heterogeneity of agent based models using geometry of behavioral spaces framework. In C. Gershenson, T. Froese, J. Siqueiros, W. Aguilar, E. Izquierdo & H. Sayama (Eds.), ALife2016, Special Session on Artificial Life and Society. Proceedings of Artificial Life Conference 2016. [doi:10.7551/978-0-262-33936-0-ch013]
CHATTOE, E., Saam, N. J. & Möhring, M. (2000). Sensitivity analysis in the social sciences: Problems and prospects. In Suleiman R., Troitzsch K.G., Gilbert N. (Eds.), Tools and Techniques for Social Science Simulation. Berlin Heidelberg: Springer, pp. 243–273. [doi:10.1007/978-3-642-51744-0_13]
CHU-AGOR, M. L., Muñoz-Carpena, R., Kiker, G., Emanuelsson, A. & Linkov, I. (2011). Exploring vulnerability of coastal habitats to sea level rise through global sensitivity and uncertainty analyses. Environmental Modelling & Software, 26(5), 593–604. [doi:10.1016/j.envsoft.2010.12.003]
CIRIC, C., Ciuroy, P. & Charles, S. (2012). Use of sensitivity analysis to identify influential and non-influential parameters within an aquatic ecosystem model. Ecological Modelling, 246(0), 119–130. [doi:10.1016/j.ecolmodel.2012.06.024]
CLARKE, K. C. (2005). The Limits of Simplicity: Toward Geocomputational Honesty in Urban Modeling. Boca Raton: CRC Press, pp. 215–232. [doi:10.1201/9781420038101.ch16]
CORRAL, S. & Acosta, M. (2017). Social sensitivity analysis in conflictive environmental governance: A case of forest planning. Environmental Impact Assessment Review, 65, 54–62. [doi:10.1016/j.eiar.2017.04.003]
COSENZA, A., Mannina, G., Vanrolleghem, P. A. & Neumann, M. B. (2013). Global sensitivity analysis in wastewater applications: A comprehensive comparison of different methods. Environmental Modelling & Software, 49(0), 40–52. [doi:10.1016/j.envsoft.2013.07.009]
CROOKS, A., Castle, C. & Batty, M. (2008). Key challenges in agent-based modelling for geo-spatial simulation. Computers, Environment and Urban Systems, 32(6), 417–430. [doi:10.1016/j.compenvurbsys.2008.09.004]
DEANGELIS, D. L. & Grimm, V. (2014). Individual-based models in ecology after four decades. F1000prime reports, 6. [doi:10.12703/p6-39]
DU, J. (2016). The “weight” of models and complexity. Complexity, 21(3), 21–35.
DU, J. & Ligmann-Zielinska, A. (2015). The volatility of data space: Topology oriented sensitivity analysis. PLoS One, 10(9), e0137591. [doi:10.1371/journal.pone.0137591]
DU, J. & Wang, Q. (2011). Exploring reciprocal influence between individual shopping travel and urban form: Agent-based modeling approach. Journal of Urban Planning and Development, 137(4), 390–401. [doi:10.1061/(asce)up.1943-5444.0000084]
FERRETTI, F., Saltelli, A. & Tarantola, S. (2016). Trends in sensitivity analysis practice in the last decade. Science of the Total Environment, 568, 666-670. [doi:10.1016/j.scitotenv.2016.02.133]
FILATOVA, T., van der Veen, A. & Parker, D. (2009). Land Market Interactions between Heterogeneous Agents in a Heterogeneous Landscape—Tracing the Macro‐Scale Effects of Individual Trade‐Offs between Environmental Amenities and Disamenities. Canadian Journal of Agricultural Economics/Revue canadienne d'agroeconomie, 57(4), 431-457. [doi:10.1111/j.1744-7976.2009.01164.x]
FILATOVA, T., Verburg, P. H., Parker, D. C. & Stannard, C. A. (2013). Spatial agent-based models for socio-ecological systems: Challenges and prospects. Environmental Modelling& Software, 45, 1–7. [doi:10.1016/j.envsoft.2013.03.017]
FONOBEROVA, M., Fonoberov, V. A. & Mezić, I. (2013). Global sensitivity/uncertainty analysis for agent-based models. Reliability Engineering & System Safety, 118(0), 8–17. [doi:10.1016/j.ress.2013.04.004]
FRENCH, S. (1992). Mathematical-programming approaches to sensitivity calculations in decision-analysis. Journal of the Operational Research Society, 43(8), 813–819. [doi:10.1057/jors.1992.120]
GRIMM, V., Augusiak, J., Focks, A., Frank, B. M., Gabsi, F., Johnston, A. S., Liu, C., Martin, B. T., Meli, M. & Radchuk, V. (2014). Towards better modelling and decision support: documenting model development, testing, and analysis using trace. Ecological Modelling, 280, 129–139. [doi:10.1016/j.ecolmodel.2014.01.018]
GRIMM, V. & Berger, U. (2016). Robustness analysis: Deconstructing computational models for ecological theory and applications. Ecological Modelling, 326, 162–167. [doi:10.1016/j.ecolmodel.2015.07.018]
GRIMM, V., Berger, U., Bastiansen, F., Eliassen, S., Ginot, V., Giske, J., Goss-Custard, J., Grand, T., Heinz, S. K., Huse, G., Huth, A., Jepsen, J. U., Jørgensen, C., Mooij, W. M., Müller, B., Pe’er, G., Piou, C., Railsback, S. F., Robbins, A. M., Robbins, M. M., Rossmanith, E., Rüger, N., Strand, E., Souissi, S., Stillman, R. A., Vabø, R., Visser, U. & DeAngelis, D. L. (2006). A standard protocol for describing individual-based and agent-based models. Ecological Modelling, 198(1-2), 115–126. [doi:10.1016/j.ecolmodel.2006.04.023]
GRIMM, V. & Railsback, S. F. (2005). Individual-Based Modeling and Ecology. Princeton, NJ: Princeton University Press.
HASSAN, S., Fuentes-Fernández, R., Galán, J. M., López-Paredes, A. & Pavón, J. (2009). Reducing the modeling gap: On the use of metamodels in agent-based simulation. In 6th conference of the European Social Simulation Association (ESSA 2009), (pp. 1–13). [doi:10.1007/s10588-012-9110-5]
HUANG, Q., Parker, D. C., Sun, S. & Filatova, T. (2013). Effects of agent heterogeneity in the presence of a land-market: A systematic test in an agent-based laboratory. Computers, Environment and Urban Systems, 41, 188–203. [doi:10.1016/j.compenvurbsys.2013.06.004]
IOOSS, B. & Lemaître, P. (2015). A review on global sensitivity analysis methods. In Dellino G., Meloni C. (Eds.), Uncertainty Management in Simulation-Optimization of Complex Systems. Springer, Boston, MA, pp. 101-122. [doi:10.1007/978-1-4899-7547-8_5]
KANG, J. Y. & Aldstadt, J. (2019). Using multiple scale spatio-temporal patterns for validating spatially explicit agent-based models. International Journal of Geographical Information Science, 33(1), 193-213. [doi:10.1080/13658816.2018.1535121]
KLEIJNEN, J. P. (2001). Experimental Designs for Sensitivity Analysis of Simulation Models. Citeseer
LAMPERTI, F., Roventini, A. & Sani, A. (2018). Agent-based model calibration using machine learning surrogates. Journal of Economic Dynamics and Control, 90, 366–389. [doi:10.1016/j.jedc.2018.03.011]
LEE, J.-S., Filatova, T., Ligmann-Zielinska, A., Hassani-Mahmooei, B., Stonedahl, F., Lorscheid, I., Voinov, A., Polhill, G., Sun, Z. & Parker, D. C. (2015). The complexities of agent-based modeling output analysis. Journal of Artificial Societies and Social Simulation, 18(4), 4: https://www.jasss.org/18/4/4.html. [doi:10.18564/jasss.2897]
LIGMANN-ZIELINSKA, A. (2013). Spatially-explicit sensitivity analysis of an agent-based model of land use change. International Journal of Geographical Information Science, 27(9), 1764–1781. [doi:10.1080/13658816.2013.782613]
LIGMANN-Zielinska, A. (2018). 'Can You Fix It?' Using Variance-Based Sensitivity Analysis to Reduce the Input Space of an Agent-Based Model of Land Use Change. Advances in Geographic Information Science. Cham: Springer International Publishing, pp. 77–99. [doi:10.1007/978-3-319-59511-5_6]
LIGMANN-ZIELINSKA, A. & Jankowski, P. (2014). Spatially-explicit integrated uncertainty and sensitivity analysis of criteria weights in multicriteria land suitability evaluation. Environmental Modelling & Software, 57, 235–247. [doi:10.1016/j.envsoft.2014.03.007]
LIGMANN-ZIELINSKA, A., Kramer, D. B., Cheruvelil, K. S. & Soranno, P. A. (2014). Using uncertainty and sensitivity analyses in socioecological agent-based models to improve their analytical performance and policy relevance. PloS one, 9(10), e109779 [doi:10.1371/journal.pone.0109779]
LIGMANN-ZIELINSKA, A. & Sun, L. (2010). Applying time dependent variance-based global sensitivity analysis to represent the dynamics of an agent-based model of land use change. International Journal of Geographical Information Science, 24(12), 1829–1850. [doi:10.1080/13658816.2010.490533]
LILBURNE, L. & Tarantola, S. (2009). Sensitivity analysis of spatial models. International Journal of Geographical Information Science, 23(2), 151–168. [doi:10.1080/13658810802094995]
LIU, J., Dietz, T., Carpenter, S. R., Alberti, M., Folke, C., Moran, E., Pell, A. N., Deadman, P., Kratz, T., Lubchenco, J., Ostrom, E., Ouyang, Z., Provencher, W., Redman, C. L., Schneider, S. H. & Taylor, W. W. (2007). Complexity of coupled human and natural systems. Science, 317(5844), 1513–6. [doi:10.1126/science.1144004]
LORSCHEID, I., Heine, B.-O. & Meyer, M. (2011). Opening the ‘black box’ of simulations: Increased transparency and effective communication through the systematic design of experiments. Computational and Mathematical Organization Theory, 18(1), 22–62. [doi:10.1007/s10588-011-9097-3]
MAGLIOCCA, N., McConnell, V. & Walls, M. (2018). Integrating global sensitivity approaches to deconstruct spatial and temporal sensitivities of complex spatial agent-based models. Journal of Artificial Societies and Social Simulation, 21(1), 12. https://www.jasss.org/21/1/12.html. [doi:10.18564/jasss.3625]
MAKLER-PICK, V., Gal, G., Gorfine, M., Hipsey, M. R. & Carmel, Y. (2011). Sensitivity analysis for complex ecological models - A new approach. Environmental Modelling & Software, 26(2), 124–134. [doi:10.1016/j.envsoft.2010.06.010]
MANSON, S. M. (2007). Challenges in evaluating models of geographic complexity. Environment and Planning B: Planning and Design, 34(2), 245–260. [doi:10.1068/b31179]
MERTENS, K. G., Lorscheid, I. & Meyer, M. (2017). Using structural equation-based metamodeling for agent-based models. In Proceedings of the 2017 Winter Simulation Conference, (p. 104). IEEE Press. [doi:10.1109/wsc.2017.8247881]
MORRIS, M. D. (2006). Input screening: Finding the important model inputs on a budget. Reliability Engineering & System Safety, 91(10-11), 1252–1256. [doi:10.1016/j.ress.2005.11.022]
NORTH, M. & Macal, C. (2007). ABMS Verification and Validation, book section 11. Oxford: Oxford University Press, pp. 221–234. [doi:10.1093/acprof:oso/9780195172119.003.0011]
NORTON, J. (2015). An introduction to sensitivity assessment of simulation models. Environmental Modelling & Software, 69(0), 166–174. [doi:10.1016/j.envsoft.2015.03.020]
O’SULLIVAN, D. & Haklay, M. (2000). Agent-based models and individualism: Is the world agent-based? Environment and Planning A, 32(8), 1409–1425.
PANNELL, D. J. (1997). Sensitivity analysis of normative economic models: theoretical framework and practical strategies. Agricultural Economics, 16(2), 139–152. [doi:10.1016/s0169-5150(96)01217-0]
PARKER, D. C., Berger, T. & Manson, S. M. (2002). Meeting the challenge of complexity: Proceedings of the special workshop on agent-based models of land-use/land-cover change. Report, Center for Spatially Integrated Social Science, University of California at Santa Barbara: http://citeseerx.ist.psu.edu/viewdoc/download?doi=10.1.1.125.9851&rep=rep1&type=pdf.
PARKER, D. C., Manson, S. M., Janssen, M. A., Houmann, M. J. & Deadman, P. (2003). Multi-agent systems for the simulation of land-use and land-cover change: A review. Annals of the Association of American Geographers, 93(2), 314–337. [doi:10.1111/1467-8306.9302004]
PERZ, S. G., Muñoz-Carpena, R., Kiker, G. & Holt, R. D. (2013). Evaluating ecological resilience with global sensitivity and uncertainty analysis. Ecological Modelling, 263(0), 174–186. [doi:10.1016/j.ecolmodel.2013.04.024]
PIANOSI, F., Beven, K., Freer, J., Hall, J. W., Rougier, J., Stephenson, D. B. & Wagener, T. (2016). Sensitivity analysis of environmental models: A systematic review with practical workflow. Environmental Modelling & Software, 79, 214–232. [doi:10.1016/j.envsoft.2016.02.008]
PIANOSI, F. & Wagener, T. (2015). A simple and efficient method for global sensitivity analysis based on cumulative distribution functions. Environmental Modelling & Software, 67(0), 1–11. [doi:10.1016/j.envsoft.2015.01.004]
PUY, A., Piano, S. L. & Saltelli, A. (2019). A sensitivity analysis of the pawn sensitivity index. arXiv preprint arXiv:1904.04488: https://arxiv.org/abs/1904.04488 published online April 9,2019.
RADCHUK, V., Ims, R. A. & Andreassen, H. P. (2016). From individuals to population cycles: the role of extrinsic and intrinsic factors in rodent populations. Ecology, 97(3), 720–32. [doi:10.1890/15-0756.1]
RAILSBACK, S. F. & Grimm, V. (2019). Agent-Based and Individual-Based Modeling: A Practical Introduction. Princeton, NJ: Princeton University Press.
RICHIARDI, M., Leombruni, R., Saam, N. J. & Sonnessa, M. (2006). A common protocol for agent-based social simulation. Journal of Artificial Societies and Social Simulation, 9(1), 15: https://www.jasss.org/9/1/15.html.
ROBINSON, D. T., Murray-Rust, D., Rieser, V., Milicic, V. & Rounsevell, M. (2012). Modelling the impacts of land system dynamics on human well-being: Using an agent-based approach to cope with data limitations in Koper, Slovenia. Computers, Environment and Urban Systems, 36(2), 164-176. [doi:10.1016/j.compenvurbsys.2011.10.002]
ROBINSON, S. (2010). Modelling service operations: A mixed discrete-event and agent based simulation approach. Talk given at the Western OR Discussion Society on, 27.
ROBINSON, S. (2014). Simulation: The Practice of Model Development and Use. London: Palgrave Macmillan.
ROUNSEVELL, M. D., Robinson, D. T. & Murray-Rust, D. (2012). From actors to agents in socio-ecological systems models. Philosophical Transactions of the Royal Society B: Biological Sciences, 367(1586), 259-269. [doi:10.1098/rstb.2011.0187]
SALTELLI, A., Aleksankina, K., Becker, W., Fennell, P., Ferretti, F., Holst, N., Li, S. & Wu, Q. (2019). Why so many published sensitivity analyses are false: A systematic review of sensitivity analysis practices. Environmental Modelling & Software, 114, 29–39. [doi:10.1016/j.envsoft.2019.01.012]
SALTELLI, A. & Annoni, P. (2010). How to avoid a perfunctory sensitivity analysis. Environmental Modelling & Software, 25(12), 1508–1517. [doi:10.1016/j.envsoft.2010.04.012]
SALTELLI, A., Annoni, P., Azzini, I., Campolongo, F., Ratto, M. & Tarantola, S. (2010). Variance based sensitivity analysis of model output. design and estimator for the total sensitivity index. Computer Physics Communications, 181(2), 259–270. [doi:10.1016/j.cpc.2009.09.018]
SALTELLI, A. & D’Hombres, B. (2010). Sensitivity analysis didn’t help. a practitioner’s critique of the stern review. Global Environmental Change, 20(2), 298–302. [doi:10.1016/j.gloenvcha.2009.12.003]
SALTELLI, A., Ratto, M., Andres, T., Campolongo, F., Cariboni, J., Gatelli, D., Saisana, M. & Tarantola, S. (2008). Global Sensitivity Analysis: The Primer. Chichester, England: Wiley-Interscience. [doi:10.1002/9780470725184]
SALTELLI, A., Tarantola, S., Campolongo, F., & Ratto, M. (2004). Sensitivity Analysis in Practice: A Guide to Assessing Scientific Models. Chichester, UK: Wiley. [doi:10.1002/0470870958]
SHANNON, R. E. (1975). Systems Simulation: The Art and Science. New Jersey: Prentice Hall.
SOBOL’, I. (1993). Sensitivity estimates for nonlinear mathematical models. Mathematical Modelling and Computational Experiments, 1(4), 407-414.
SPICKNALL, I. H., Koopman, J. S., Nicas, M., Pujol, J. M., Li, S. & Eisenberg, J. N. (2010). Informing optimal environmental influenza interventions: how the host, agent, and environment alter dominant routes of transmission. PLoS Computational Biology, 6(10), e1000969. [doi:10.1371/journal.pcbi.1000969]
SUN, S., Parker, D. C., Huang, Q., Filatova, T., Robinson, D., Riolo, R., Hutchinson, M. & Brown, D. (2014). Market impacts on land-use change: An agent-based experiment. Annals of the Association of American Geographers, 104(3), 460–484. [doi:10.1080/00045608.2014.892338]
SUN, Z., Lorscheid, I., Millington, J. D., Lauf, S., Magliocca, N. R., Groeneveld, J., Balbi, S., Nolzen, H., Müller, B., Schulze, J. & Buchmann, C. M. (2016). Simple or complicated agent-based models? a complicated issue. Environmental Modelling & Software, 86, 56–67. [doi:10.1016/j.envsoft.2016.09.006]
TANG, W., Bennett, D. A. & Wang, S. (2011). A parallel agent-based model of land use opinions. Journal of Land Use Science, 6(2-3), 121–135. [doi:10.1080/1747423x.2011.558597]
TEN Broeke, G., van Voorn, G. & Ligtenberg, A. (2016). Which sensitivity analysis method should I use for my agent-based model? Journal of Artificial Societies and Social Simulation, 19(1), 5: https://www.jasss.org/19/1/5.html. [doi:10.18564/jasss.2857]
THIELE, J. C., Kurth, W. & Grimm, V. (2014). Facilitating parameter estimation and sensitivity analysis of agent-based models: A cookbook using Netlogo and ’R’. Journal of Artificial Societies and Social Simulation, 17(3), 11: https://www.jasss.org/17/3/11.html. [doi:10.18564/jasss.2503]
TRUCANO, T. G., Swiler, L. P., Igusa, T., Oberkampf, W. L. & Pilch, M. (2006). Calibration, validation, and sensitivity analysis: What’s what. Reliability Engineering & System Safety, 91(10-11), 1331–1357. [doi:10.1016/j.ress.2005.11.031]
USDA (2012). Conservation reserve program overview. [Online; accessed 06/09/2019]: http://www.fsa.usda.gov/FSA/webapp?area=home&subject=copr&topic=crp.
VANUYTRECHT, E., Raes, D. & Willems, P. (2014). Global sensitivity analysis of yield output from the water productivity model. Environmental Modelling & Software, 51(0), 323–332. [doi:10.1016/j.envsoft.2013.10.017]
WOLTERS, W. T. M. & Mareschal, B. (1995). Novel types of sensitivity analysis for additive mcdm methods. European Journal of Operational Research, 81(2), 281–290. [doi:10.1016/0377-2217(93)e0343-v]
ZHAN, Y. & Zhang, M. (2013). Application of a combined sensitivity analysis approach on a pesticide environmental risk indicator. Environmental Modelling & Software, 49(0), 129–140. [doi:10.1016/j.envsoft.2013.08.005]
ZHANG, J., Du, J., Yiu, Y. F. & Ligmann-Zielinska, A. (2019). Improved global sensitivity analysis for critical factor analysis with intercorrelated inputs: Power plant cost example. Journal of Computing in Civil Engineering, 33(4), 04019025 [doi:10.1061/(asce)cp.1943-5487.0000840]
ŞALAP Ayça, S., Jankowski, P., Clarke, K. C., Kyriakidis, P. C. & Nara, A. (2018). A meta-modeling approach for spatio-temporal uncertainty and sensitivity analysis: an application for a cellular automata-based urban growth and land-use change model. International Journal of Geographical Information Science, 32(4), 637– 662.