
Introduction and Motivation
Over 11 million people commute daily within the United Kingdom (DFT 2016), accounting for 15% of all journeys made (ONS 2011). Employing organisations are faced with the need to take into account the impact of commuting activities of their staff and ultimately reduce their impact. There is a range of actions that employers can take, but determining the most effective action, especially if budgets and time are constrained, is a major difficulty. In this paper we propose a means of modelling and simulating commuter activities that will highlight the effects of actions, guiding an employer towards adopting those measures that are most likely to result in a meaningful improvement.
Employers can play an important role in decreasing the costs of commuting by adopting commuting trip reduction programmes (Litmann 2003), e.g. measures could include subsidising public transport, providing facilities for cyclists or promoting car-pooling. The interest of employers in improving commuting conditions may stem from the need to improve productivity (e.g. ensuring that employees reach work punctually and safely) or to make the work environment more attractive (promoting healthy lifestyles). Many organizations regard reducing environmental impact as part of their corporate and social responsibilities and so support sustainable mobility choices. Employers face a major challenge, in that often limited resources are available to pay for changes thus constraining the options available.
It is desirable for organisations to be able to predict the likely modes of travel used by commuters, this allows an organisation to quantify the effect that the commuting activities of its workforce has on the environment and community. The ability to predict is useful when an organisation is considering changes in working practices, such as opening new places of work or moving substantial numbers of workers between sites and needs to predict the effects of such moves.
In this paper we seek to answer the research question; to what extent can multi-agent technologies combined with access to multiple data sources provide the basis for a framework to model and predict the actions of commuters? We seek to answer this question by designing a software agent framework that can simulate the actions of commuters, and validating it using a case study around commuting for a university workforce and predictions for the effects of a possible site move. The aim of the framework is to provide a means of combining data sources (workforce data, geospatial data and transport network data) with means of prediction.
Related Work
Previous studies that look at employer-led travel demand management (TDM) programs find that they can change commuter behaviour to a degree, but they often require financial investment to provide additional incentives such as free parking and discounted tickets for public transport. For example, (Cairns et al. 2010) review 20 case studies of UK employers that have implemented a TDM program, and find that commuter behavioural change can be achieved, but it will require the employers to provide facilities such as free parking and travel information display. Similarly, (Meyer 1999) review various employer TDM programs in the U.S. in the last 20 years, and conclude that some incentives or disincentives must be present to encourage commuters to change their behaviour. Moreover, even with incentives, changing commuter behaviour can be hard if they are already heavily reliant on cars. One of the major issues surrounding the simulation of commuters is the gathering of data concerning patterns of commuting, (McNeill et al. 2017) attempt to reconstruct commuting patterns by analysing Twitter data, attempting to establish home and work locations for individuals. Some countries, such as the Netherlands (CBS 2018), have collected such data at a national level through mass surveys. Within the United Kingdom, the National Census taken every 10 years records information regarding, home and work locations and the means of travel between them. Visualisations of commuting patterns (based on the 2011 census) may be viewed online at (DataShine 2011). Because of the low frequency of the census the commuting data is not generally timely enough to be used in work such as this.
A way to reduce commute time and travel demand without incurring additional cost to the employer is by providing the workers with more flexible work hours or work locations. Sundo & Fujii (2005) study the effect of a compressed working week (shortened working week with extended daily work times) on the activity-time patterns of employees of the University of the Philippines. They found the two-hour increases in the compressed working week workday substantially changes commuters’ activity and travel patterns. During the compressed working week, commuters reduced household activities, sleeping time, and pre-work preparation time. Their commuting time is also reduced significantly due to changes in departure times. Ge & Polhill (2016) show that under certain conditions, flexible work schedules are more effective in reducing commute time and commute time variability than building new transport infrastructure. Multiple studies shows that flexible work schedules which allow commuters to avoid travelling at peak times can significantly reduce congestion and average commute time (Komma & Srinivasan 2008; He 2013 ; Zhang et al. 2005). Finally, Ge et al. 2018 shows that giving workers more flexibility in their work locations could reduce commute time and commute patterns under certain social environments and corporate cultures, but could also lead to unintended consequences in others.
The effectiveness of employer-led TDM programs depends highly on the type and nature of the organization in which the program is implemented and the existing transport infrastructure. For example, Aoun et al. (2013) looks at The American University of Beirut (AUB) located in the city centre of Beirut, Lebanon, which has a markedly different TDM program than the campuses from most developed countries. Because of Beirut’s insufficient public transport and ineffective law enforcement, and the relatively wealthy population and thus higher car ownership on campus compared with the rest of the country, standard strategies used in the developed world such as subsidized public transport, and restricted or priced parking are considered unsuitable there. As a result, the authors conclude that campus transport services do not always have to rely on existing public transport services. Rather, they proposed that a dynamic taxi-sharing scheme could be a more effective solution in that case. Van Malderen et al. (2012) look at TDM programs of companies in Belgium and find that the effect of a program differs by the size and location of the employer. For example, the promotion of bicycles suits small workplaces best, whereas the promotion of public transport suits large companies located in city centres best.
This paper introduces a framework which is designed to address a number of shortcomings in literature. Our framework is implemented using the Java programming language. An alternative platform for implementation of simulation aspects of this work would have been the Multi-Agent Transport Simulation (MATSIM) (Horni et al. 2016). MATSIM is primarily an application for simulating transport networks. MATSIM allows agents to follow pre-determined travel plans within the network. For this application Java allowed a greater degree of flexibility as the agents and their associated behaviours are written in the Java language, in particular the speed of the simulation may be increased by not having the overhead of a large package such as MATSIM. We obtain our journey times (by various modes of travel) from an external source (TravelLine Scotland) rather than through simulation of journeys using MATSIM. Our framework will be capable of accepting travel data (e.g. journey times, costs and pollution estimations) from a variety of sources. It will be capable of being easily expanded to incorporate data sets that may become available in the future. By utilising a multi-agent system it will be possible to modify agents (e.g. the commuters or data sources) to take account of new policies and incorporate them into the solution.
The Commuting Problem
Edinburgh Napier University data
In this paper we use Edinburgh Napier University (ENU) as a case study. At the time of the study (2017) the University employs just under 1500 staff located at three campuses across the City of Edinburgh, Scotland. We consider University employees rather than students; employees are likely to represent a more generalised instance of a commuter compared to students.
In order to utilise the University as a case study the authors have access to two datasets, firstly the results of an annual travel survey conveying the existing commuting habits, and secondly an anonymized dataset derived from employee records that contains home and work postcodes for each University employee. The postcode dataset may be used to specify problems in terms of the numbers of employees that need to move between home and work. The travel survey data may be used to validate the results of any predictions carried out.
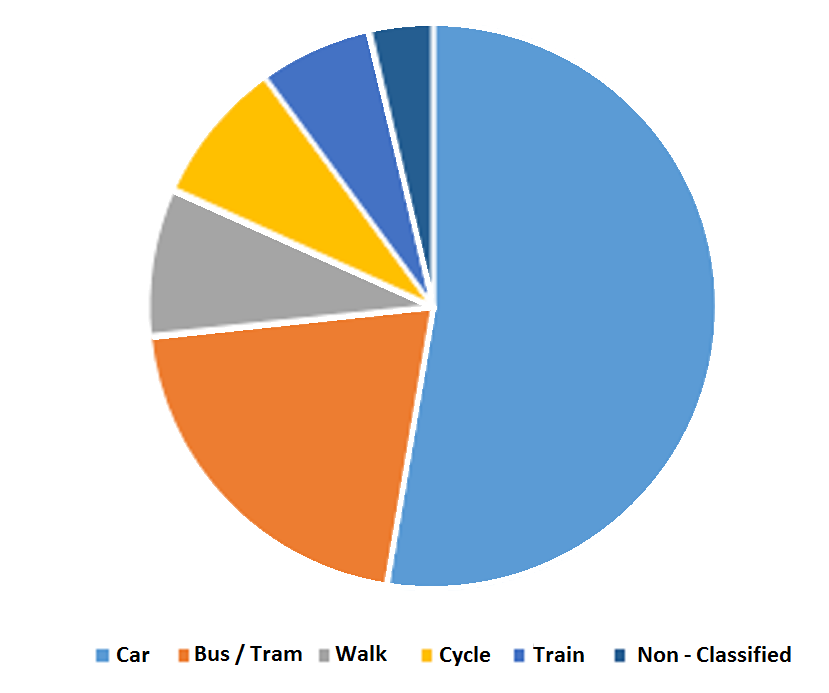
The travel survey questionnaire was not designed for this project, but gives some insight into the nature of the problem from the perspective of individual commuters. The survey contained responses from 728 staff members from a total of 1494 eligible contributors. An indication of the transport modal split of commuters within the survey is presented in Figure 7. We note from this that over 50% of journeys are car based, with the second most popular form of transport being bus/tram.
The survey results were then divided into the three workplaces (Merchiston, Craiglockart and Sighthill) at which the University employs staff.
The travel survey contains eight commuter attributes that might influence travel mode:
| Age | Gender |
| AffectedByIllnessDisability | ArriveTime |
| DepartTime | TravelDistanceMiles |
| Campus (Work location) | Postcode (Home location) |
It should be noted that the travel distance question was answered directly by the user, as a numerical value, and hence should be considered as perceived distance. UK postcodes comprise two main sections the outward code and an inward code, e.g. the code EH10 5DThas an outward code of EH10 and an inward code of 5DT. The outward code specifies a district (10) within the City of Edinburgh district (EH), the inward section specifies a specific building or buildings. We can therefore treat postcodes as specifying the home location to a set of buildings or using only the outward code specify an area within the City of Edinburgh or surrounding area.
Decision tree analysis of the survey data
Decision Tree analysis was applied to the survey data to establish the influence of any of the items on travel mode choice. Decision trees were constructed using the J48 algorithm as implemented within the WEKA (Hall et al. 2009) package. The data was divided into the three workplaces. A tree was constructed for each workplace by using 10-fold cross validation in order to minimise over fitting.
When applied to the Craiglockart data, WEKA used the Postcode field as the splitting criterion, which created an 80 leaf tree, resulting in 78 rules that associated a specific postcode with a travel mode and a more general rule, that all journeys more than 5 miles should be classified as a car journey. This tree correctly classified only 44% of instances.
The algorithm was reapplied using only the outward section of the home postcode in order to force the algorithm to find more general rules. This, however, resulted in the algorithm classifying all journeys as car travel, which allowed 53% of instances to be correctly classified.
In the case of the Sighthill employees data, J48 creates a decision tree that classifies all commuters as car drivers, this leads to 35% classification accuracy. For this dataset, using only the outward section of the post- code makes no difference.
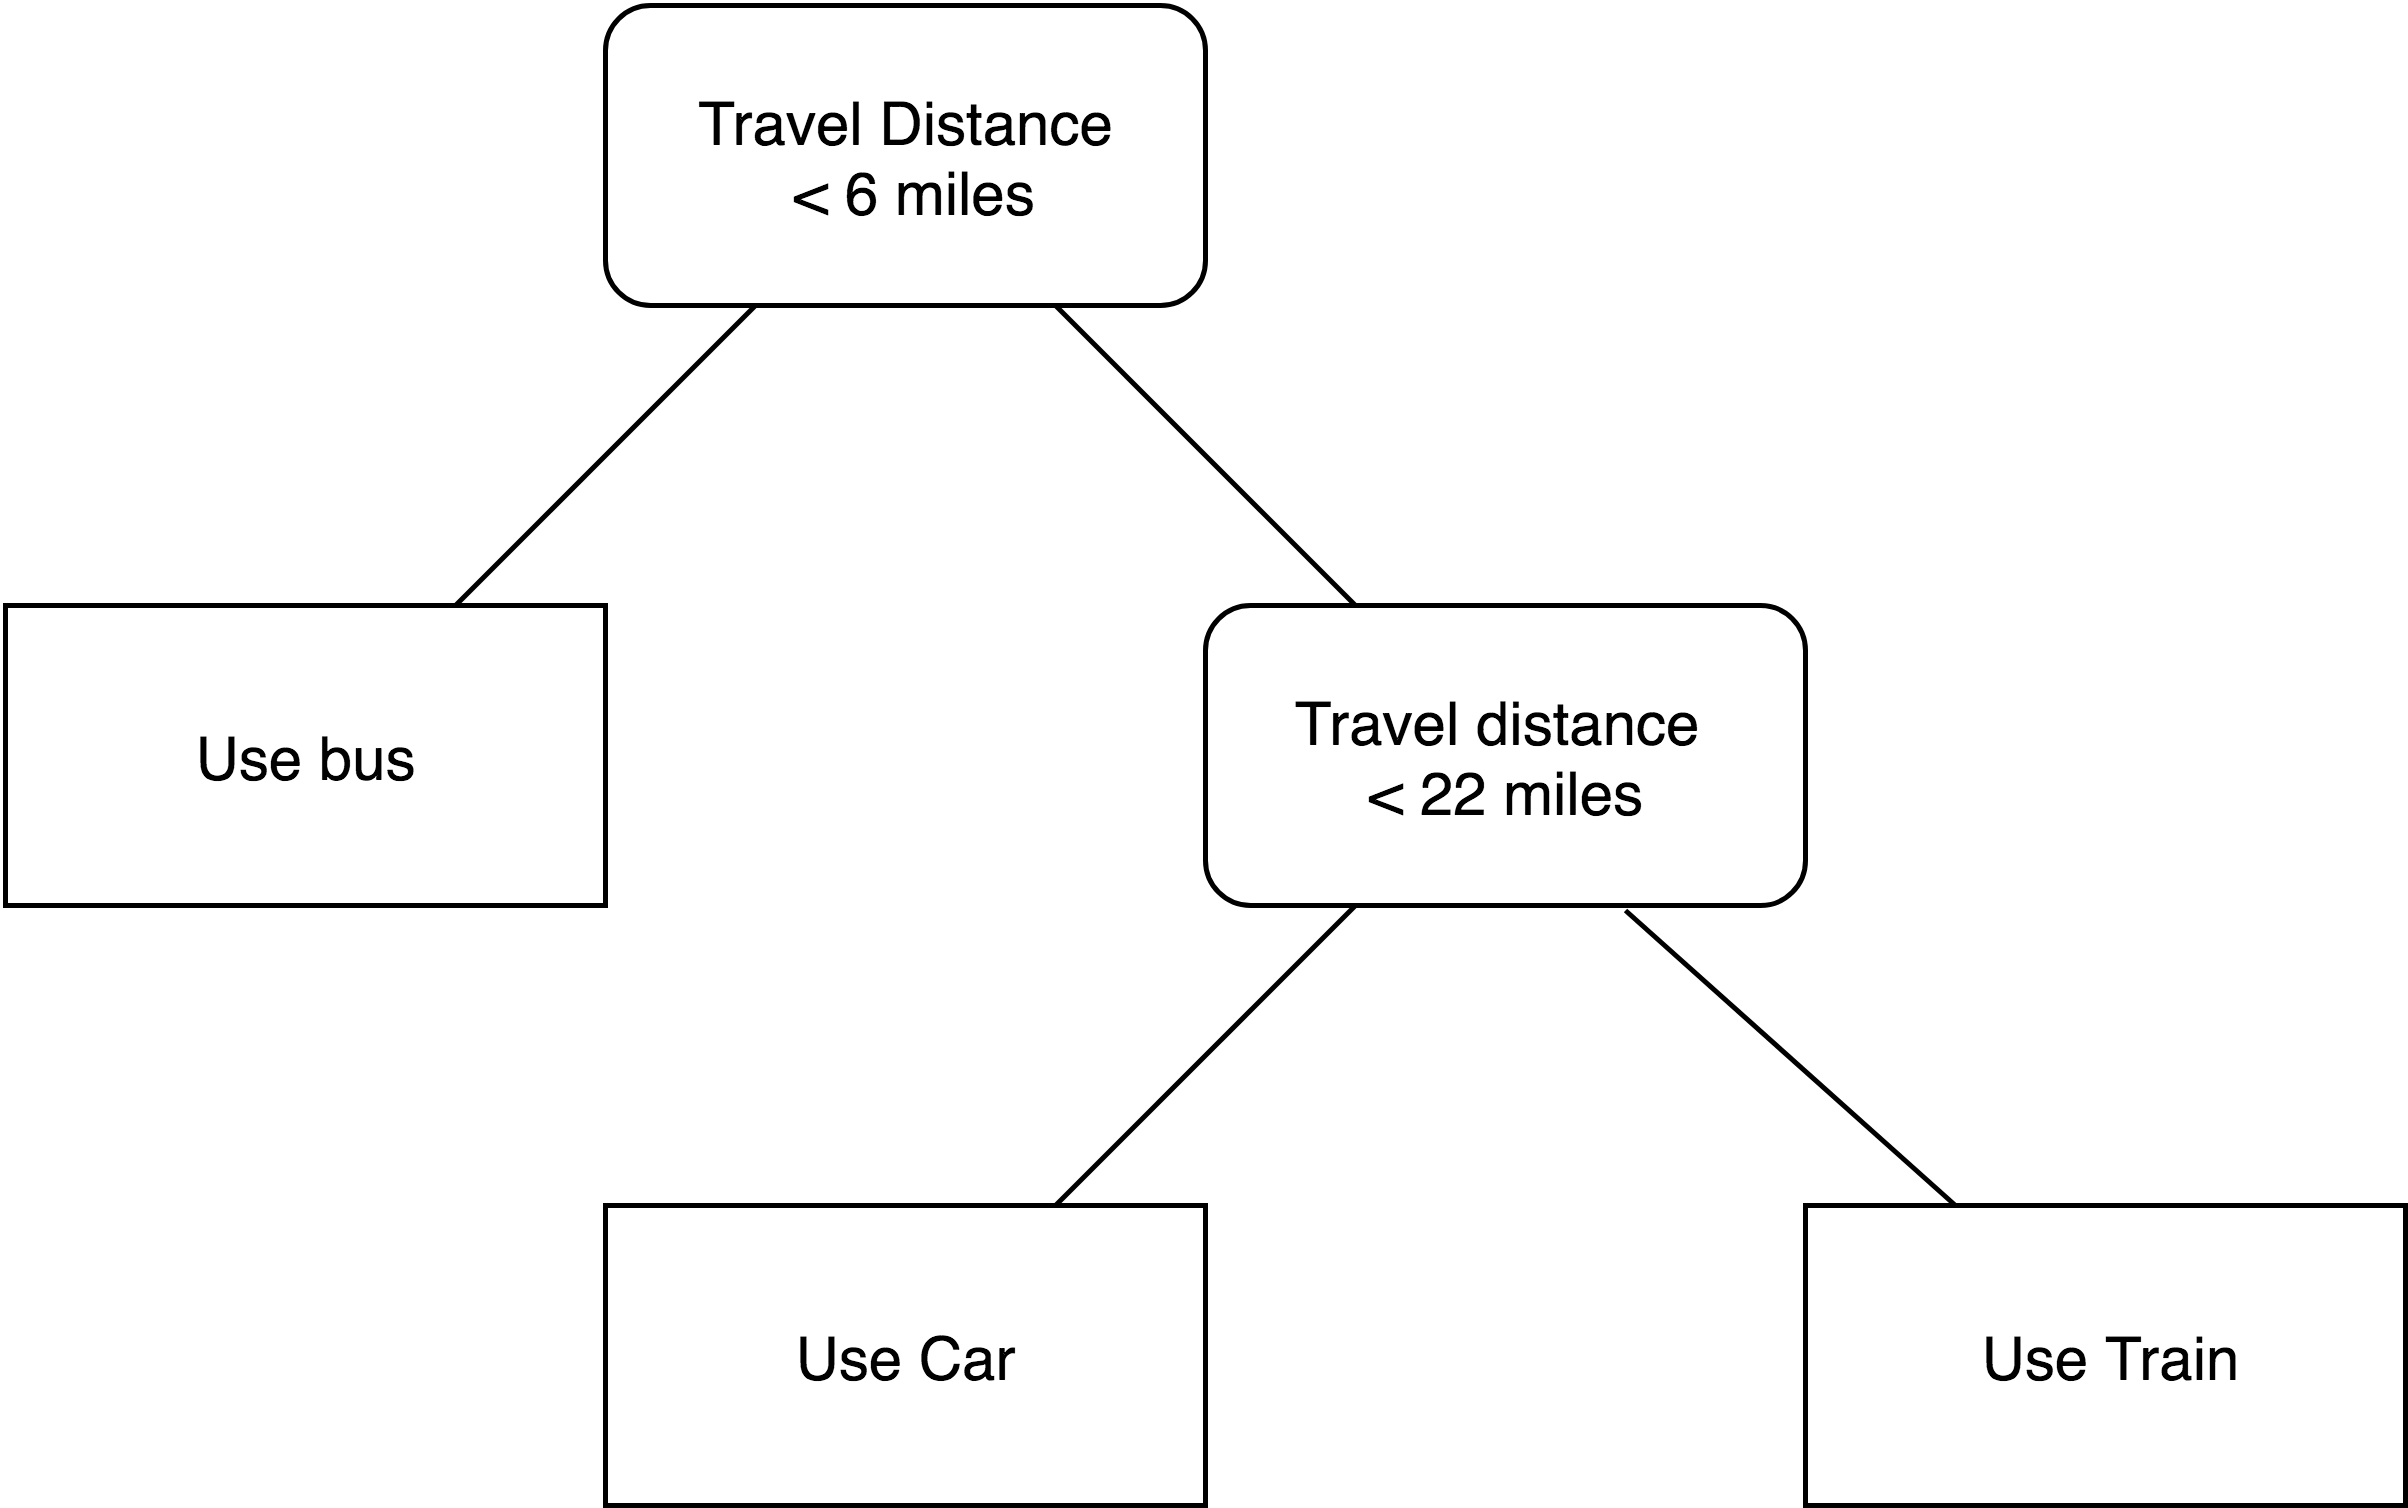
When applied to the Merchiston employees dataset, a more complex tree was created when presented with the dataset containing the full postcode, as shown in Figure 1. For a commute distance between 6 and 22 miles, a commuter will drive, or if over 22 miles use the train. A distance of less than 6 miles is classified as a bus journey. However, this tree only classified 30% of commuters correctly.
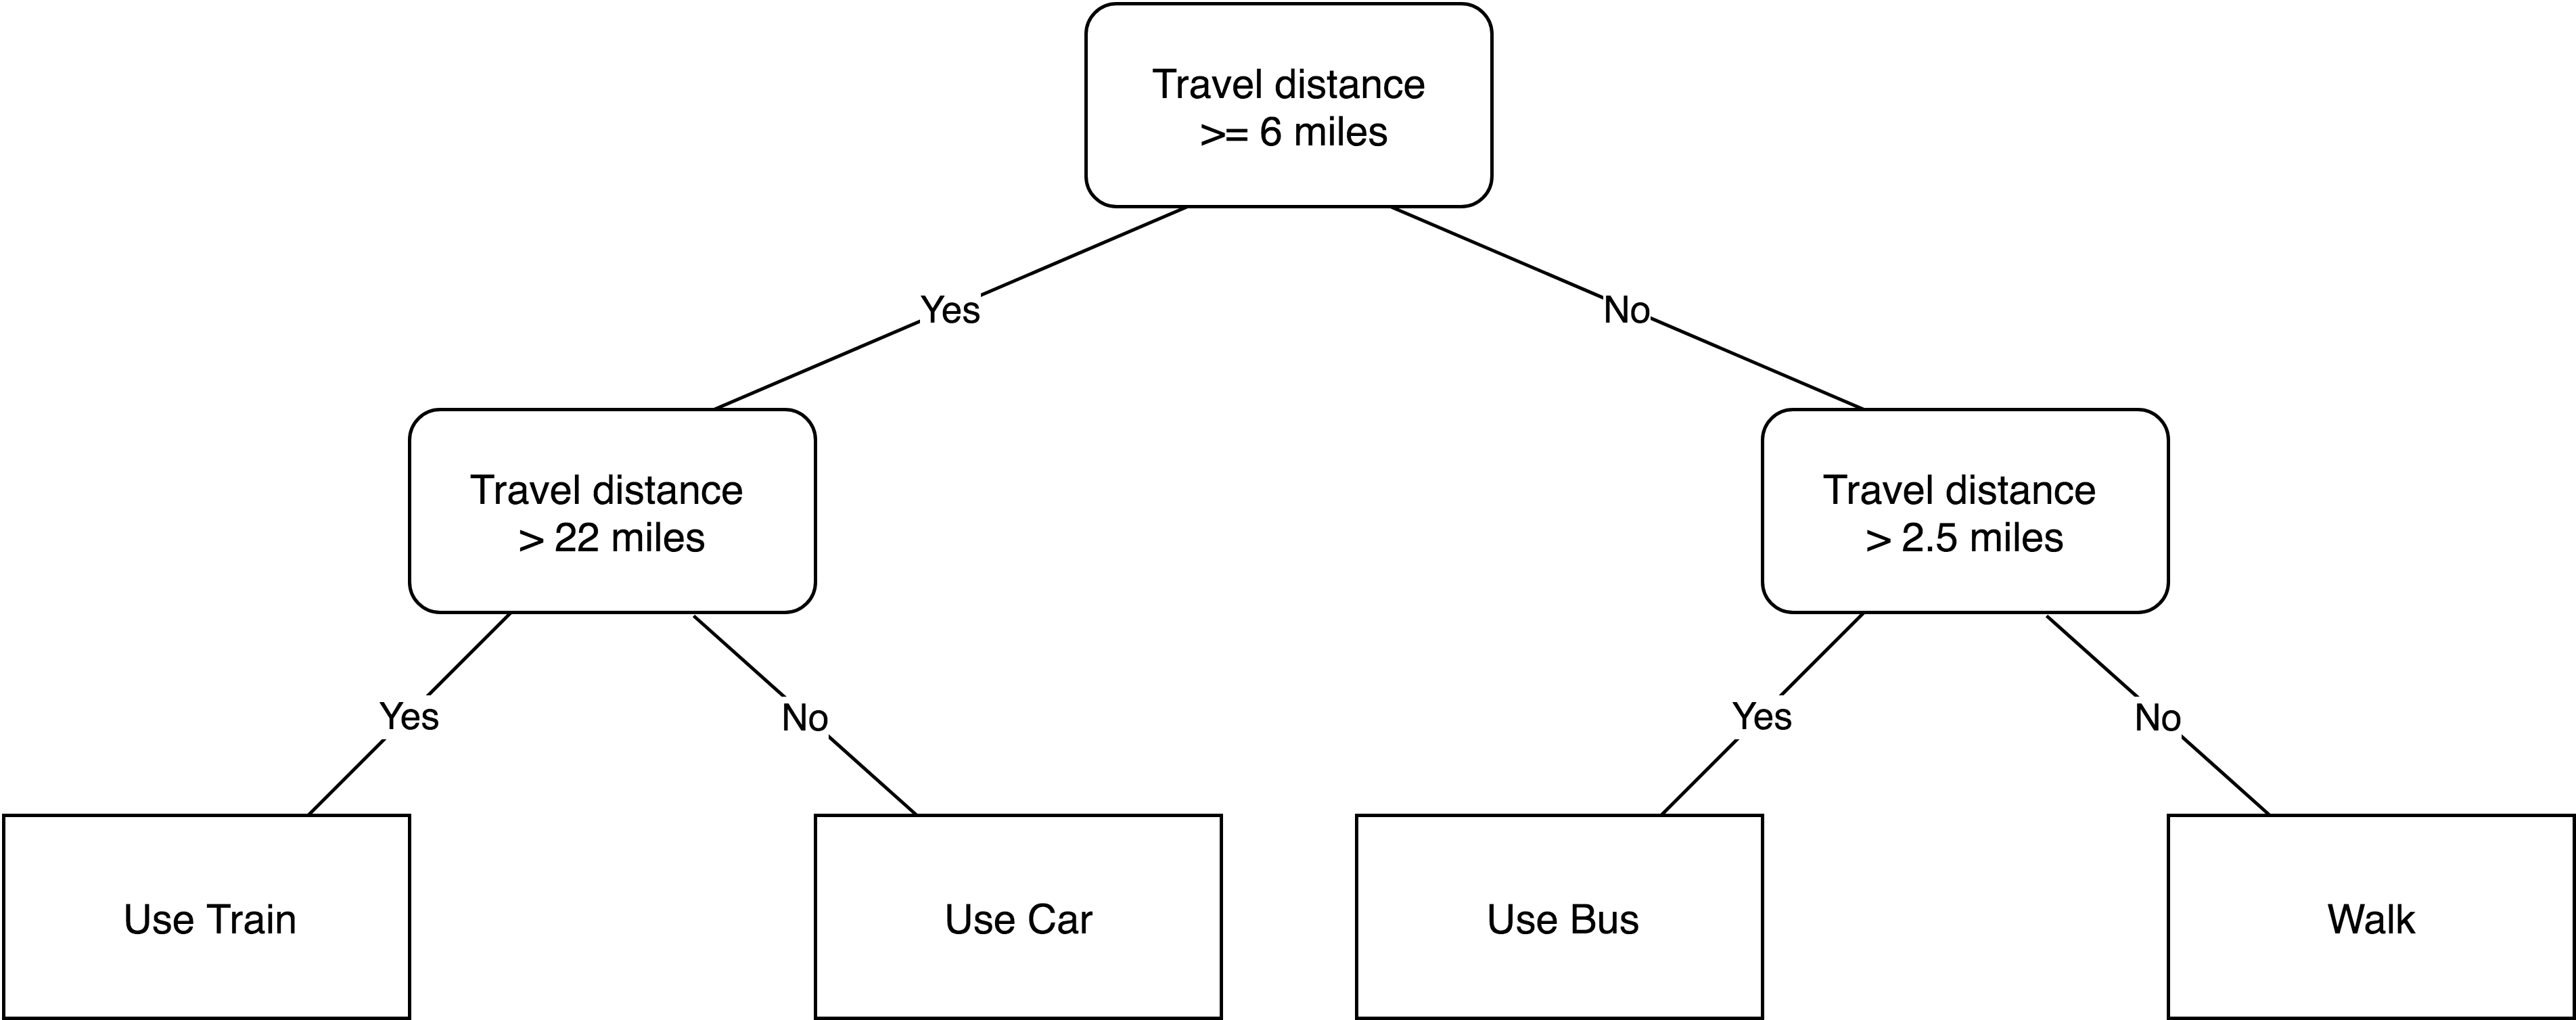
When presented with only the outward section of the home postcode the tree shown in Figure 2 is generated. This tree increased the classification rate to 34.6%. Note that a perceived journey length of 6 miles is still significant for car use, but those walking to work (< 2.5 miles) can now be identified.

If the tree shown in Figure 2 is applied to all three datasets then we note that 35 % of Craiglochart journeys were correctly identified, rising to 40% for Sighthill based staff. Applying the tree to the entire dataset results in 40% of journeys being correctly identified.
If we consider all employees regardless of site the tree shown in Figure 3 is created. The useful conclusion is that the tree splits on perceived distance. This tree classifies commuters across four travel modes: train, car, bus and walk. Overall a prediction accuracy of 40% is achieved by this tree.
The tree analysis suggests a number of issues which need to be taken into account when constructing an agent- based system. Firstly, there are cut off distances of 2.5, 6 and 22 miles between modes. But it should be remembered that values entered are based on the users’ perceived distance – it may be the case that users tend to associate distance with time. We also gain a possible hierarchy of modes based on perceived distance/time being walking, bus, car and finally train. From a practical perspective this makes sense, employees living close to a campus are likely to walk, while the comprehensive bus network in Edinburgh is likely to be attractive to many commuters who live out with walking distance. Edinburgh has little suburban rail network, hence rail is only an option for longer distance commuting from outside the Edinburgh area.
Model Design and Implementation
The commuting process
Our model of commuting takes an organisational view, based on modelling the activities of commuters belonging to a particular organisation. Previous research (see above) has examined commuting from a broader geographical perspective, but such approaches struggle to model, realistically, the choices of individuals. By concentrating on the employees of a specific organisation we can more accurately model the choices of individuals.
In this paper we will view commuting as the journeys made by members of a workforce to and from their place of work. We will concentrate on forecasting modal choice, i.e. whether an individual uses car, bus, train or walks to work. We do not, at this stage take into account the departure times for the commuting journey. In terms of planning, it is useful for organisations to know the mode of travel most likely to be adopted by their employees when commuting.
Model structure
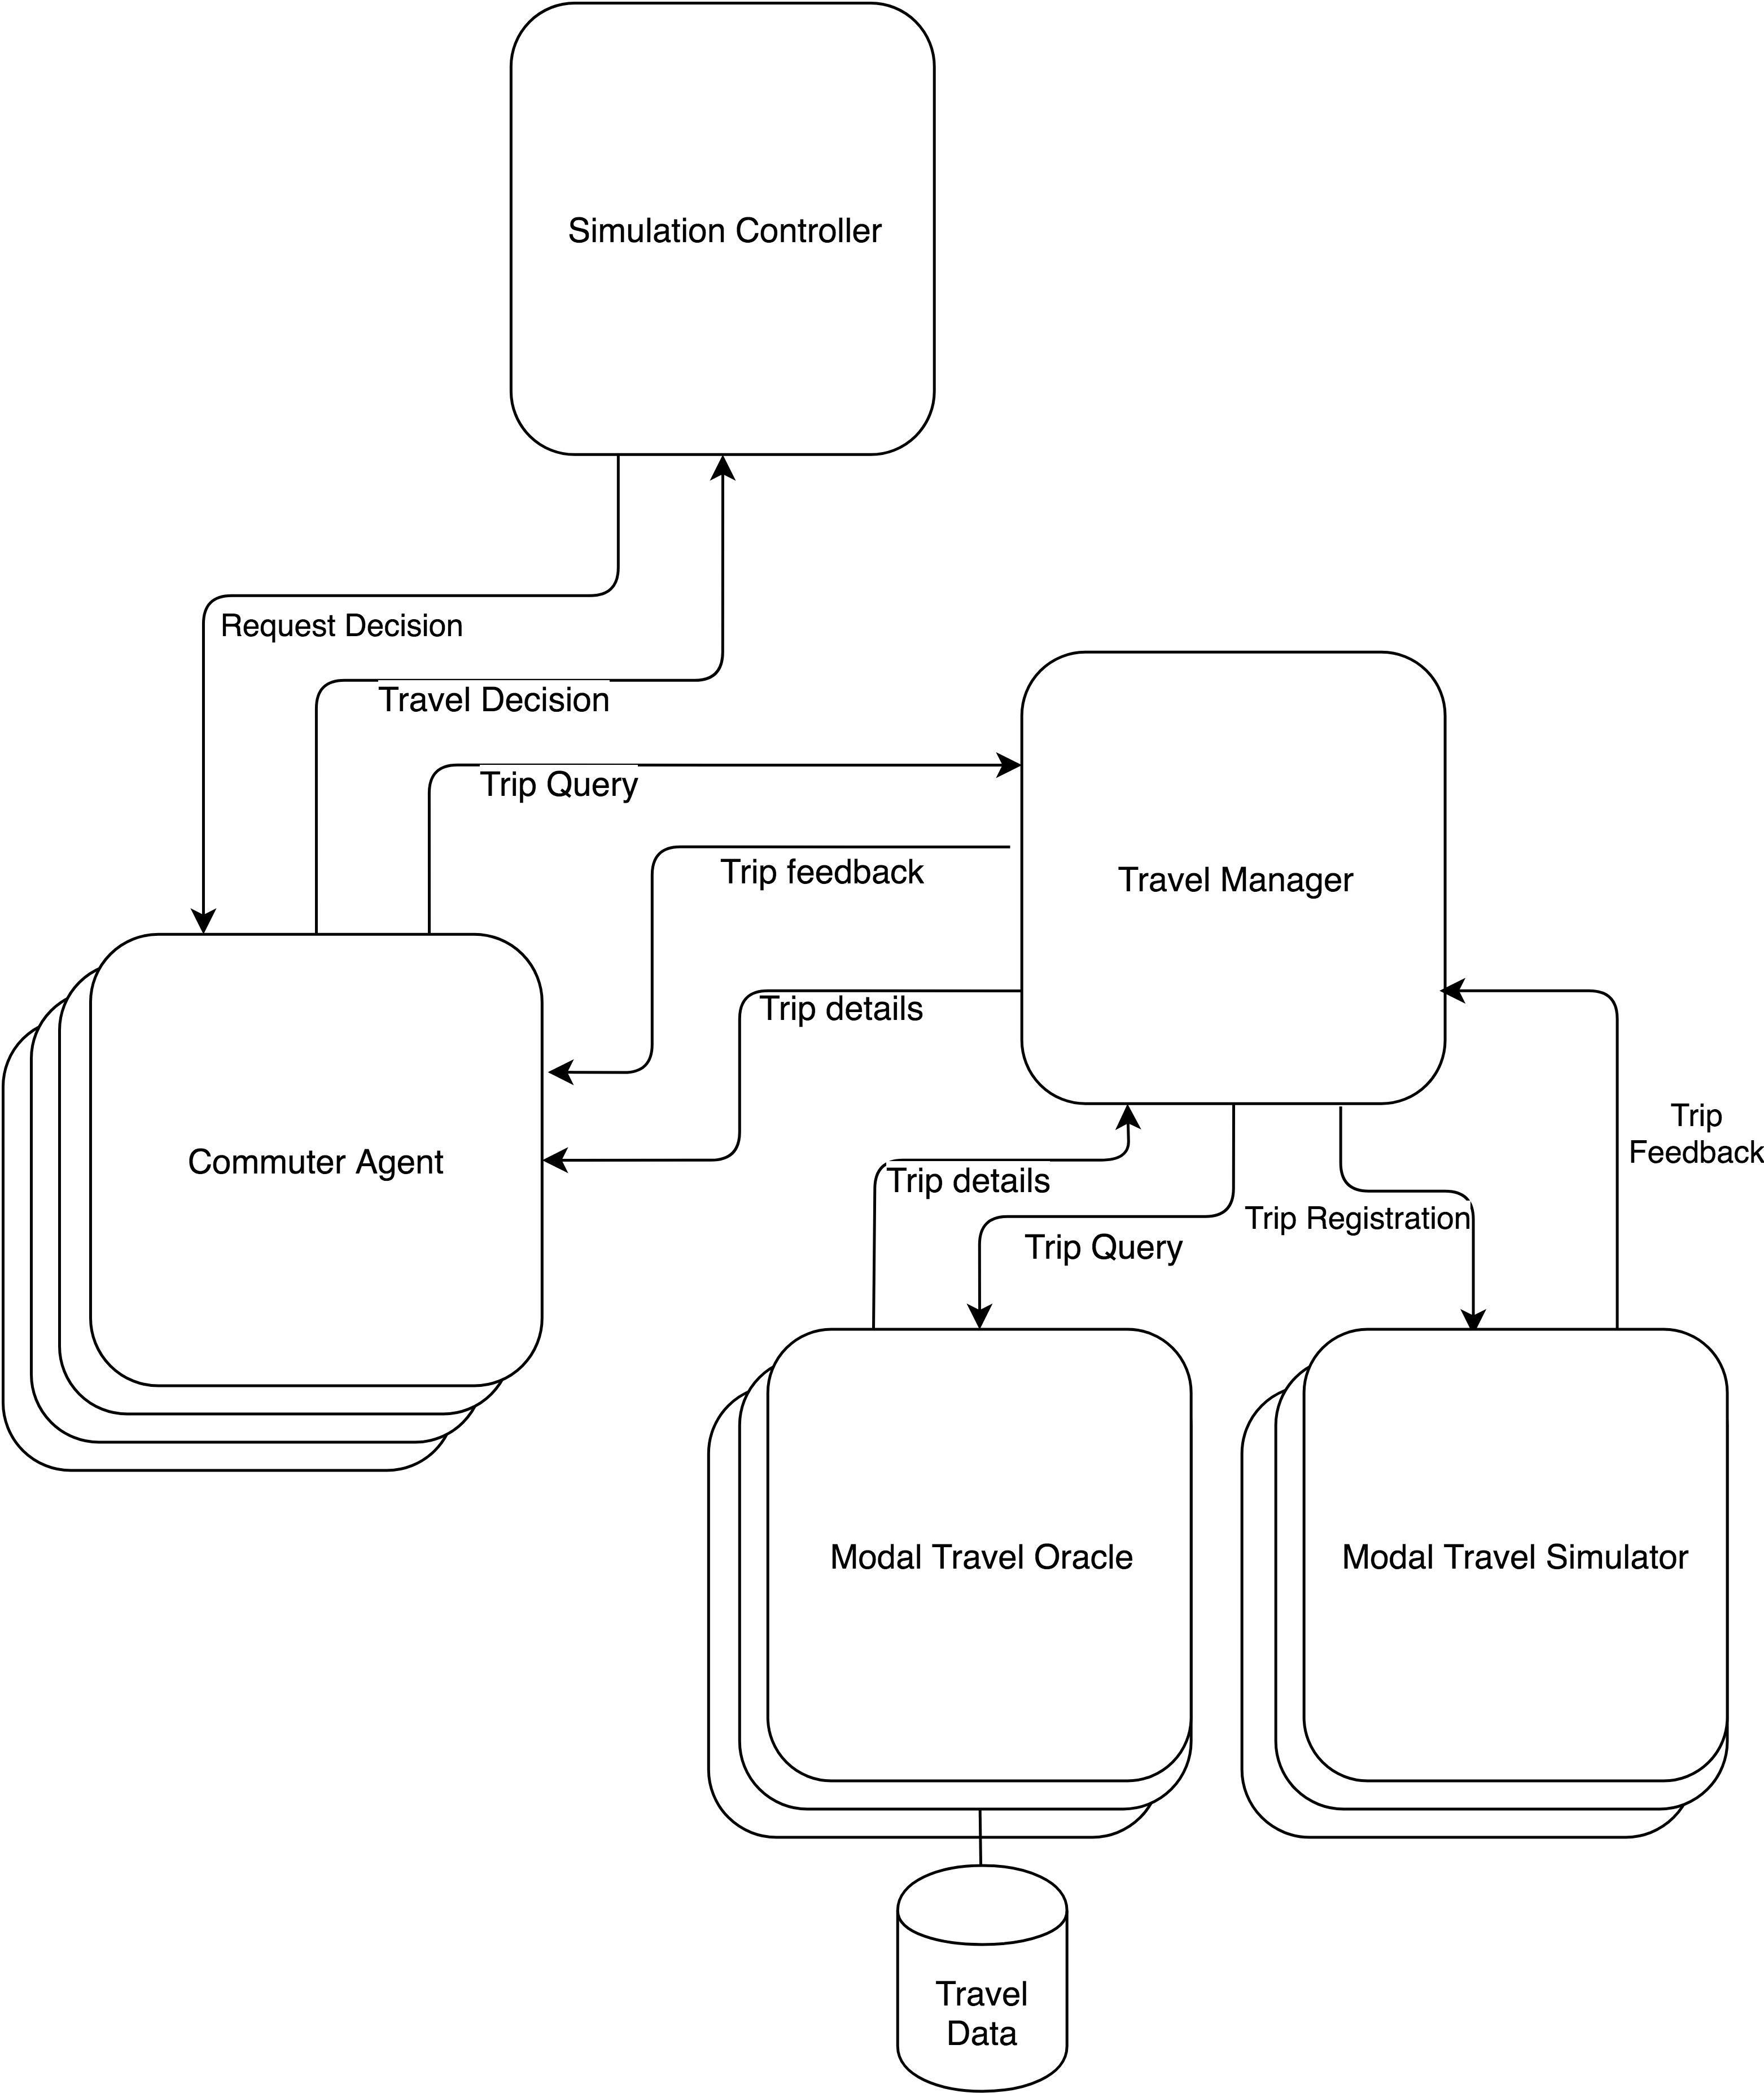
The model design presented is based on the fundamental principles of one agent representing one human commuter. At present the model concentrates on the choice of transport mode. Figure 4 shows the basic structure of the model.
To support the agents in making their decisions, there are two aspects to each travel mode;
- Information of the availability of travel and the likely travel times;
- Feedback on the outcomes to an agent of its modal choice.
Aspect one is dealt with the the Modal Travel Oracle agent (MTO; Figure 4). The role of the Oracle is to answer travel-related queries from an agent. The MTO encompasses data sources containing timetable and other real- world information concerning travel times and costs associated with that travel mode. The data within the MTO is based on ideal travelling conditions and does not take into account congestion or other forms of delay.
The Modal Travel Simulator (MTS) deals with the second aspect by providing feedback to an agent on the results of their chosen travel mode. Within each simulated day agents notify their modal choice to the MTS. When all of the agents have made their choice the MTS can assess the impact of the numbers using the mode of transport that it represents and provide feedback to each agent. The feedback takes the form of notifying the agent of any additional journey times or costs to their journey that occurred on that day as a result of congestion or other similar factors.
The agents access the MTO and MTS via a Travel Manager (TM). The TM maintains a list of available travel modes which it can supply to the Commuter agent. By using the TM the Commuter Agent can send one travel query to the TM and have the TM forward it to each MTO.
Agent communication
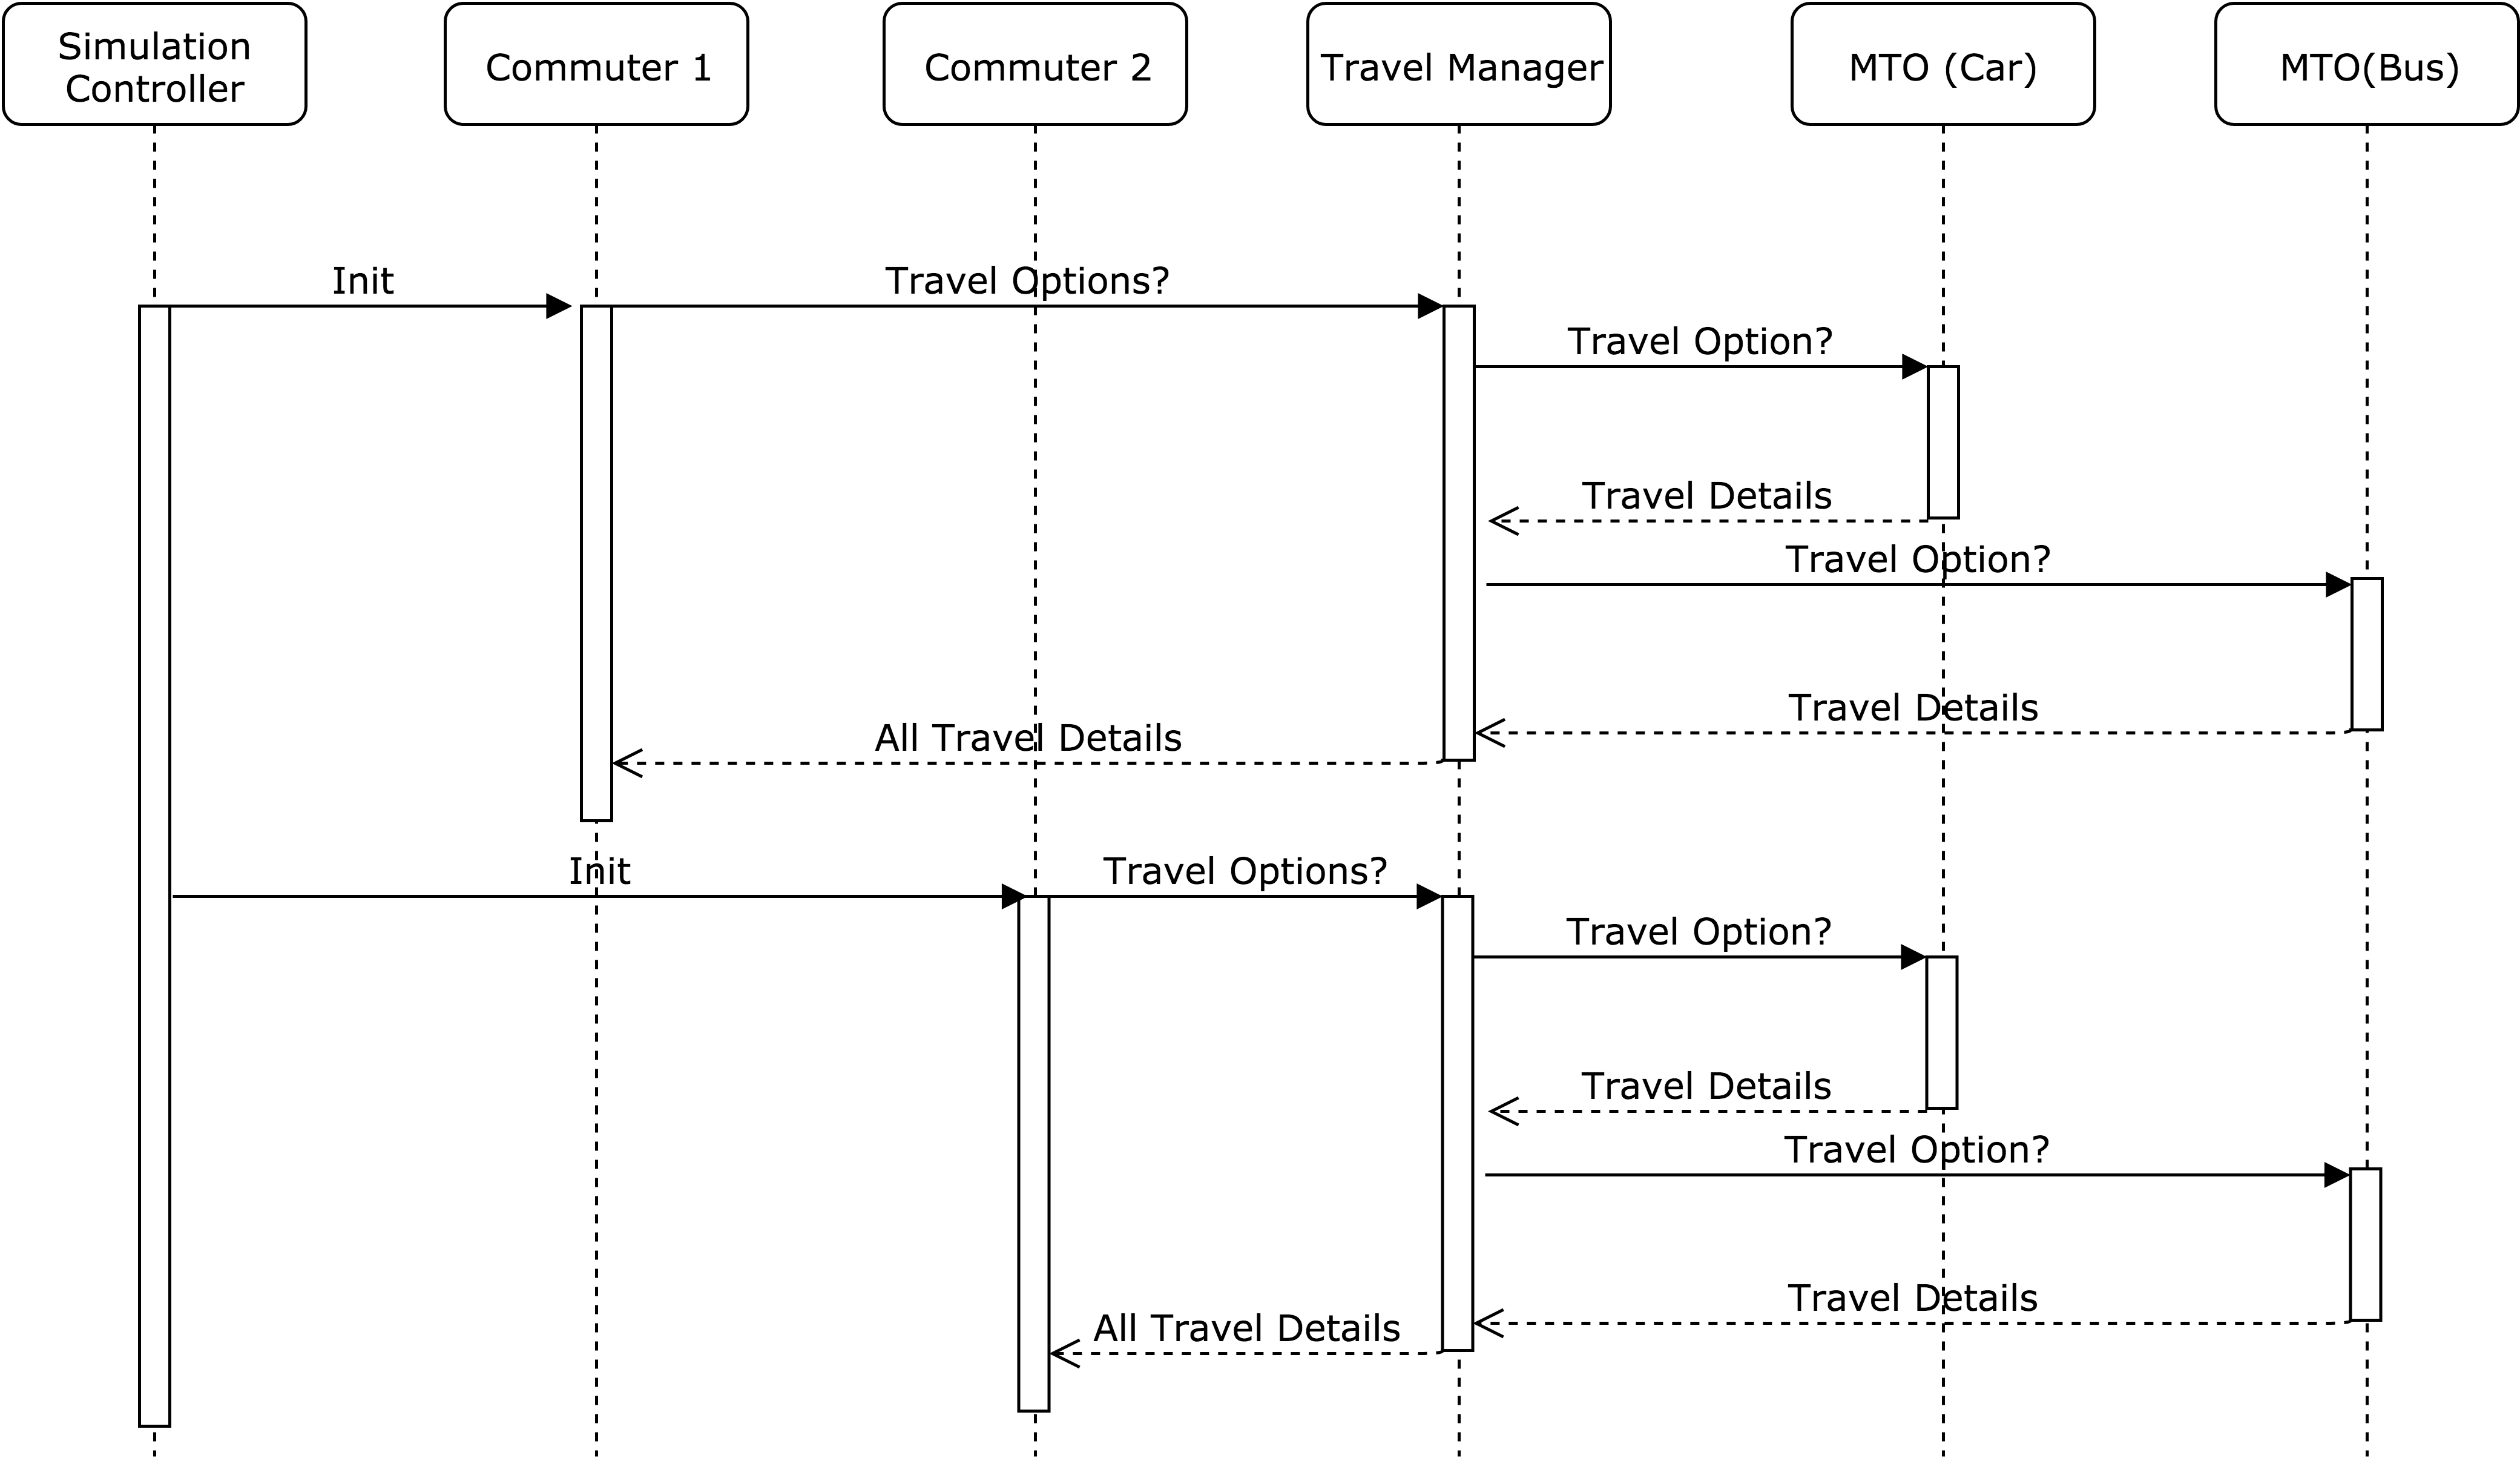
Upon commencing the simulation the agents initially contact the TM in order to establish which travel modes are available within the simulation (see Figure 5). The TM contacts each MTO for journey details. Each MTO responds with journey details, if that mode is valid – some modes e.g. bus or rail are not open to all agents as no appropriate service exists. Having had a response from each MTO the TM responds with a list of all available travel options for that agent. This initial list of travel options is used for form the agents’ initial set of beliefs.
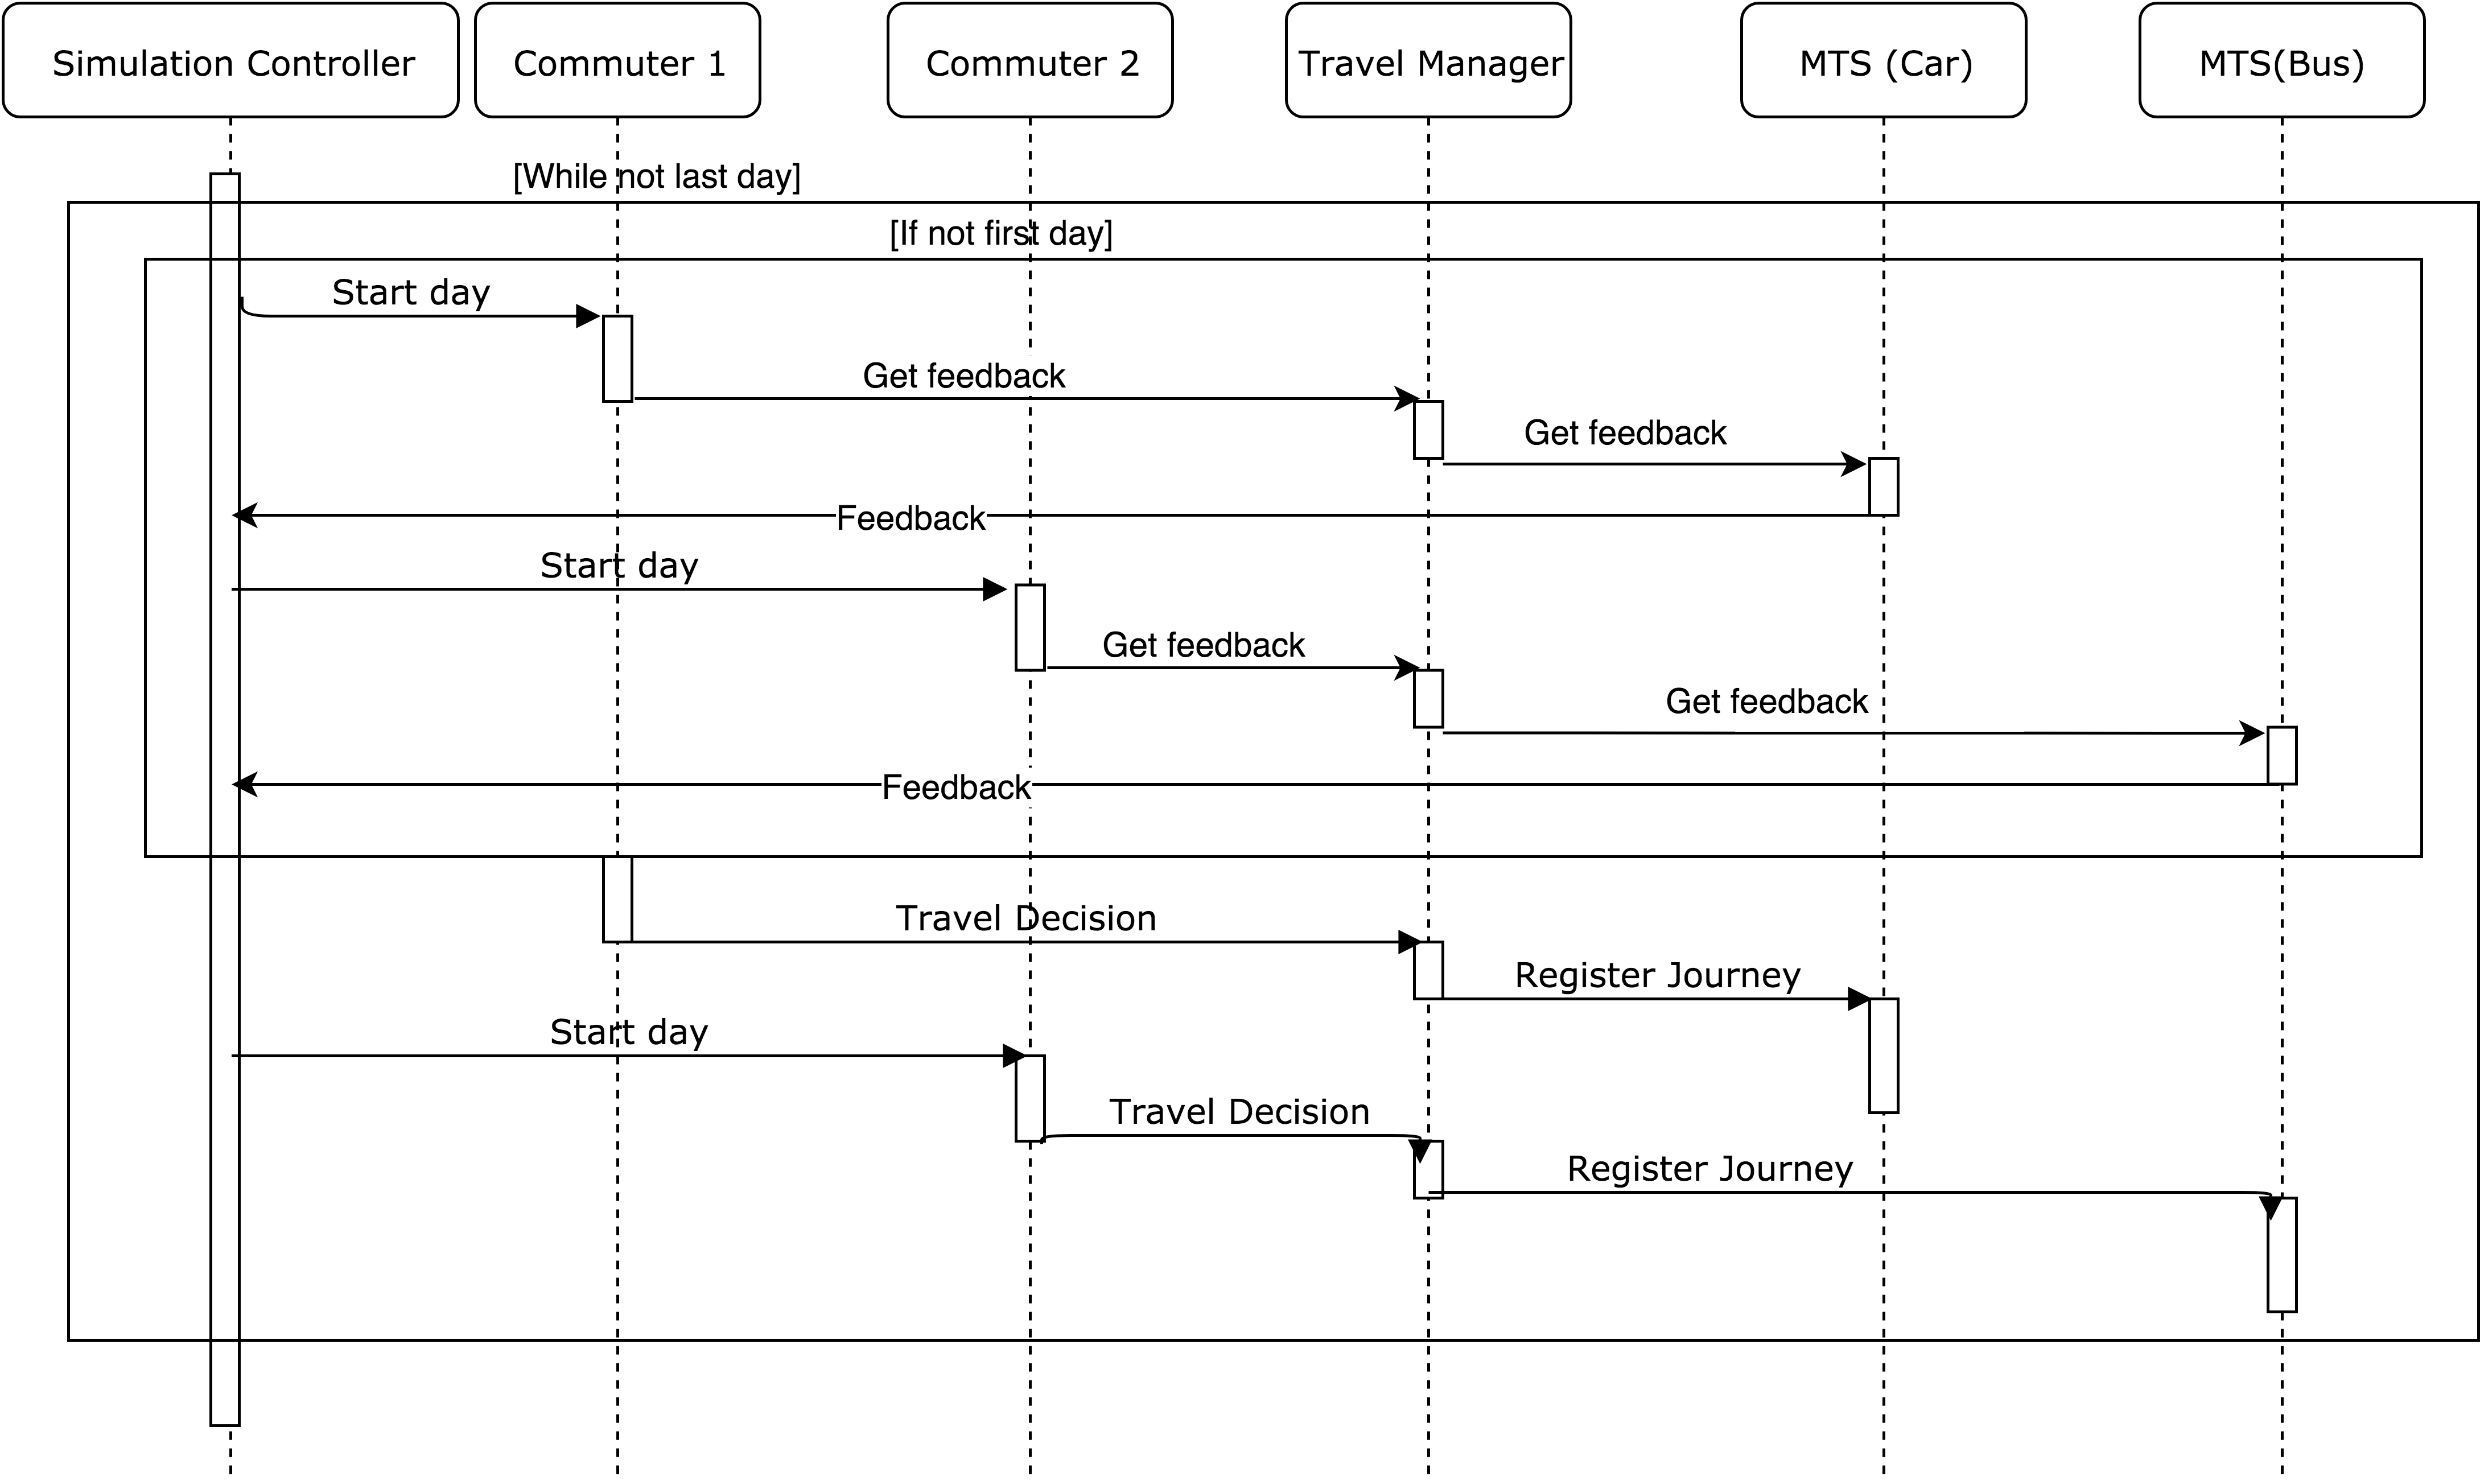
Each simulated day the agents receive feedback based on the previous days travel (see Figure 6)– except in the case of the first day. Agents then make their travel decision and notify the TM agent. Once all agents have made their decisions and notified the TM, the TM can update the appropriate MTS agents. The MTS agents can now provide feedback based on knowing about all journeys being made via their mode.
Decision making
Within the model of commuting being discussed here, each agent has to choose the travel mode to be used when commuting. In the examples examined within this paper there are five modes available. Each agent must model the human-like decision process involved in choosing a travel mode. The commuter agents will use the Belief-Desire-Intention (BDI) model (Georgeff et al. 1999). BDI is designed to replicate the processes used by humans when making a decision, based on the following concepts:
- Belief - What the agent knows about the world
- Desire - Things that the agent would like to achieve
- Intention - Things that the agent could do (options)
In the case of commuting the agent should choose between travel modes, picking the one that a human would pick given the same journey requirements. Each agent will make one decision for each simulated day, at the end of each simulated day the agents’ knowledge will be updated based on feedback received about how their journey went, which may lead to a modified decision. We recognise that the decision to walk may be made on different criteria, as it may be considered a lifestyle decision. Therefore within our BDI mechanism we allow each agent a specific belief regarding their pre-disposition for walking to work.
BDI for commuters
We implement BDI tailored to the commuting scenario. At present, we base our decisions on travel modes. Our BDI model is then defined as follows:
- Beliefs - The travel time for each possible travel mode
- Desires - The need to travel to/from work in a minimal time
- Intentions - Available travel options
The range of possible intentions will be governed by factors such as availability of public transport or the practicalities of active travel modes (cycling and walking).
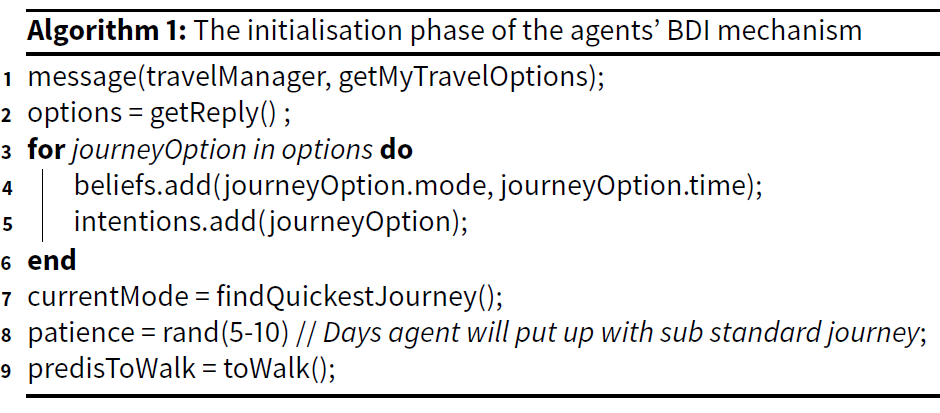
Our BDI framework is described in pseudo code in Algorithms 1 and 2. Algorithm 1 describes the initialisation of each agent, essentially each agent queries the TM to find out the basic journey options available for each mode. This provides the agent with a basic set of beliefs about the journey times for each mode of travel. An agent has a belief that it has a certain probability of adopting walking as its preferred mode of travel. The likelihood of walking is set by the function toWalk(), which can set the probability based on Ge & Polhills’ (2016) formula or based on an arbitrary distance/time to work (as suggested in Figure 3).
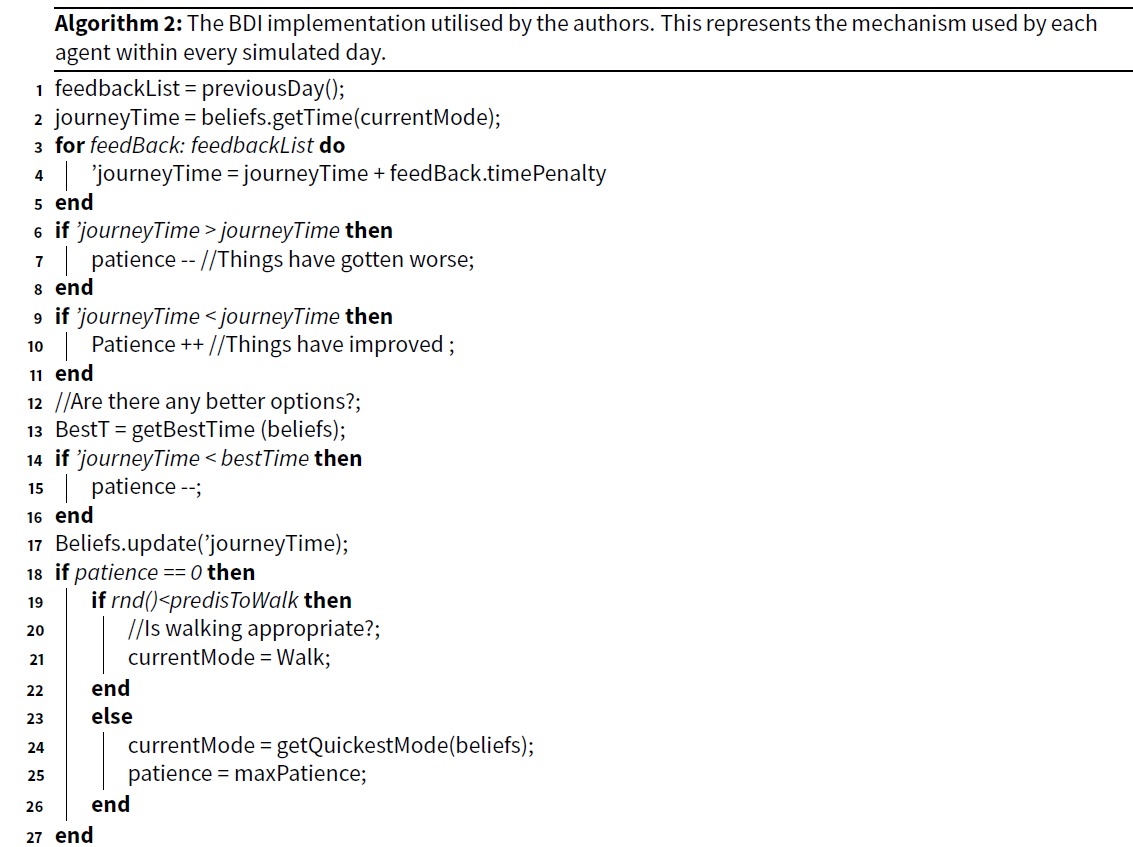
Although the BDI mechanism is executed each day (see Algorithm 2) a patience variable is incorporated within the mechanism to limit the number of times the BDI mechanism can force a change in mode. The patience value provides a tipping point for agents changing mode (see Algorithm 2): the larger the patience value the more days an agent will tolerate travel issues before changing mode.
The daily BDI decision making mechanism is outlined in Algorithm 2. At the start of the process the agent seeks feedback on the previous days activities from the TM, the architecture allows for a list of feedback messages to be sent. Feedback specifies increases or decreases in time, cost or emissions associated with a journey as determined by the appropriate MTS agent. Currently only travel times are used, details on emissions and costs will be added during future development. The changes in time are added/subtracted from the journey time held by the commuter agent within its beliefs for that mode of transport. This allows the calculation of \('journeyTime\) representing the actual time taken the previous day. If the journey time has increased then the patience value is decremented, if it has improved then the patience value is incremented. Once the patience value is updated, the journey time held by the agent within its beliefs is updated to take account of the feedback. If the agent has a journey time with its beliefs that is less than \('journeyTime\) then the agent decreases the patience value. The agents’ beliefs are updated to take account \('journeyTime\).
If the patience value has reached 0 then a change in mode is initiated for that day, with the mode switching to whichever the agent believes has the quickest journey time.
The patience value stops the agent from changing mode too frequently. A journey that the agent believes to be longer than by other modes will be tolerated for a few days (depending on the initial patience value) and depending on the actions of other agents may improve and thus not require a change in mode.
Implementation and data sources
The prototype framework (as described in Figure 4) has been implemented using the Java programming language. The data used within the simulation may be split into two categories, employee data and geospatial data. The employee data is based on that outlined earlier. We treat each site that University employees are located at as a separate problem, the size of the problems may be seen in Table 1.
The authors also have available to them the results of a travel survey that recorded the travel habits of ENU staff. Within the survey 529 members of staff responded and indicated their current means of commuting. The modal split for commuters at ENU, based on survey results is shown in Figure 7.
As well as data concerning the agents, the model also requires geospatial data, this will be used by the MTO and MTS agents to allow them to provide realistic feedback to the agents. The principle source of road-network data is Open StreetMap combined with the GraphHopper library (see: GraphHopper Directions API with Route Optimization). Table 2 shows the principle sources of data used. TravelLine Scotland data is accessed via their bulk journey planner which allows transport options to be downloaded en-masse for a collection of journeys. The GraphHopper templates for Car, Cycle and Walking were used to produce journey times for these modes. Note that in this application the journey times are fixed.
| Site | StaG |
| Merchiston | 532 |
| Sighthill | 638 |
| Craiglochart | 324 |
| Mode | Data Source |
| Bus | TravelLine Scotland |
| Train | TravelLine Scotland |
| Car | Open StreetMap / GraphHopper |
| Cycling | Open StreetMap / GraphHopper |
| Walking | Open StreetMap / GraphHopper |
Methodology
Three problem instances were created based upon the ENU site data, each of which would be simulated for 30 days, with the BDI mechanism taking into account journey times. The aim is to have the agents achieve a modal split that is comparable to that shown in Figure 7. Our aim is to be able to simulate trends in modal choice across the entire workforce.
A major constraint on commuting by car is the limited availability of parking spaces at the sites. Figures were obtained for each site and were added into the car travel MTS agent. The MTS agent notes the car journeys to a site and their arrival time, spaces are allocated on a first-come-first-served basis and once the car park is full the remaining agents arriving by car receive feedback comprising of a 15 minute time penalty, designed to represent the time taken to find a parking space in an adjacent street and then walk back to the workplace. A similar mechanism is in place for cyclists as a limited number of cycle storage spaces are available at each site. A smaller 5 minute penalty represents the time cost of finding another location to store the bicycle. Cycling has a 10 minute fixed time cost added to all journeys to work to represent the time to change clothing upon arrival at work.
Reproducing results
For those who may wish to reproduce the results in this paper or undertake similar simulations of their own, the source code for the framework is available online[1]. The Edinburgh Napier Travel survey results are not available, but users may source their own problem instances. Geographical data from Open StreetMap (Haklay & Weber 2008) is available for download directly from Open StreetMap. Public transport journey details are available from TravelLine Scotland, other sources of public transport data could be adapted for use with the framework.
Results
Initial results - travel by mode
Table 3 shows the results achieved by executing the simulation on the three ENU problems. The objective being to reduce the error (in brackets) as far as possible. The first attempt shows a poor result, especially within car use. The car use times were based on the journey times generated by GraphHopper, but such journey times are based on a free-flow road network. An empirical comparison between sample journey times produced from GraphHopper and a commercial journey planning tool which takes into account congestion suggested that, in general, journey times were a factor of three times greater when congestion was included. The Car MTO agent was modified to increase journey times by a factor of three, representing a congenstion factor. The effect of introducing the congestion factor be viewed in Table 3.
| Observed | Simulation | Weighted Car Time | |||
| Sighthill | |||||
| Car | 62.61% | 93% (31%) | 51% (12%) | ||
| Bus/Tram/PR | 23.11% | 5% (19%) | 31% (8%) | ||
| Walk | 0.84% | 0% (1%) | 0% (1%) | ||
| Bike | 5.04% | 0% (5%) | 3% (2%) | ||
| Train | 5.46% | 2% (3%) | 16% (10%) | ||
| Non classified | 2.94% | ||||
| Craiglockhart | |||||
| Car | 60.61% | 100% (39%) | 57% (4%) | ||
| Bus/Tram/PR | 15.15% | 1% (15%) | 29% (14%) | ||
| Walk | 11.11% | 0% (11%) | 0% (11%) | ||
| Bike | 8.08% | 0% (8%) | 6% (2%) | ||
| Train | 2.02% | 0% (2%) | 9% (7%) | ||
| Non classified | 3.03% | ||||
| Merchiston | |||||
| Car | 33.33% | 64% (30%) | 22% (12%) | ||
| Bus/Tram/PR | 18.75% | 2% (17%) | 54% (35%) | ||
| Walk | 16.67% | 1% (15%) | 2% (15%) | ||
| Bike | 14.58% | 4% (11%) | 13% (1%) | ||
| Train | 11.46% | 30% (19%) | 11% (1%) | ||
| Non classified | 5.21% | ||||
| GP 1.3 | GP 1.4 | GP 1.5 | Radius 5 | Radius 10 | |
| Sighthill | |||||
| Car | 38% (24%) | 42% (21%) | 45% (18%) | 50% (13%) | 50% (13%) |
| Bus/Tram/PR | 18% (5%) | 22% (1%) | 25% (2%) | 31% (7%) | 30% (7%) |
| Walk | 25% (24%) | 18% (17%) | 12% (11%) | 0% (1%) | 0% (1%) |
| Bike | 4% (1%) | 4% (1%) | 4% (1%) | 5% (0%) | 5% (0%) |
| Train | 15% (10%) | 15% (10%) | 15% (10%) | 16% (10%) | 16% (10%) |
| Craiglockhart | |||||
| Car | 34% (26%) | 40% (20%) | 45% (16%) | 55% (6%) | 55% (6%) |
| Bus/Tram/PR | 7% (9%) | 11% (4%) | 14% (1%) | 28% (12%) | 26% (11%) |
| Walk | 44% (33%) | 32% (21%) | 24% (13%) | 0% (11%) | 2% (9%) |
| Bike | 8% (1%) | 9% (1%) | 9% (1%) | 9% (1%) | 9% (1%) |
| Train | 9% (7%) | 9% (7%) | 9% (7%) | 9% (7%) | 9% (7%) |
| Merchiston | |||||
| Car | 16% (18%) | 19% (14%) | 19% (14%) | 22% (11%) | 22% (12%) |
| Bus/Tram/PR | 15% (4%) | 21% (2%) | 24% (5%) | 52% (33%) | 50% (31%) |
| Walk | 51% (35%) | 39% (22%) | 36% (19%) | 2% (14%) | 4% (13%) |
| Bike | 9% (6%) | 11% (3%) | 11% (3%) | 14% (0%) | 14% (0%) |
| Train | 11% (1%) | 11% (1%) | 11% (1%) | 11% (1%) | 11% (1%) |
Making the choice to walk
As discussed earlier we treat the choice to walk as being a special case, with each agent being predisposed towards walking to a certain degree. We use two methods of determining the level pre-disposition to walking. The first is the method used by (Ge & Polhill 2016), the second is simply having every commuter within a specified time radius walk. Ge and Polhill determine the probability of an individual walking as \(P(walk) = \frac{1}{1.3^\frac{t_{walk}}{5}}\) where \(t_{walk}\) is the time to walk to work. Table 4 shows the results for Ge and Polhill’s method with constant values of 1.3, 1.4 and 1.5, as well as the radius method set to 5 and 10 minute walks. The results in Table 4 suggest that using Ge and Polhill’s formula with a constant of 1.5 provides the lowest overall error and the lowest average deviation from the observed results (Table 3) across modes on all three problems (8.15%). We note that Ge and Polhill’s method with radius 1.5 is less accurate at purely predicting walking than the radius method, but the radius method improves accuracy on this at the expense of much less accuracy on the other modes.
Case study
As stated previously, the purpose of this simulation is to denote trends in commuting and assist organisations in setting policies. Within ENU there is a proposal to relocate one academic school from the Merchiston site to the Sighthill site.
The original data supplied by the University recorded each individual’s department/school within their place of work, making it possible to identify those individuals who will be affected by the proposal. A set of modified data files were thus created with the appropriate members of staff relocated to the Sighthill site. The effects of the move, as predicted by the simulation, may be seen in Tables 6, 7 and 8. Our interest lies in the trends shown in Table 8, which suggest a rise in car use, a rise in bus use and a significant reduction in walking. The department at Merchiston has been established for many years and anecdotally, many staff live locally and walk to work. The travel modes used by those who would be affected by the move are given in Table 5,note that due to the very low response rate, this must be regarded as anecdotal, but it does suggest significant bus/bike/walk use. We can analyse the distances travelled by those who would be moving (the distance being the distance through the street graph taking the shortest possible route). Of those moving 33% live 5km or less from campus and are likely candidates to walk/cycle a further 23% live between 5 and 10km from campus and are likely to use non-car based travel. If the move takes place, many of those who walk to work, will not be able to continue walking hence the increase in car and bus use.
| Mode | Responses |
| car | 9 |
| bus | 8 |
| bike | 3 |
| walk | 3 |
| Motorcycle or scooter | 1 |
| rail | 1 |
| Merchiston | Sighthill | |||
| Before | ||||
| Mode | Staff | Staff | ||
| car | 100 | 18.98% | 264 | 41.71% |
| bus | 111 | 21.06% | 137 | 21.64% |
| walk | 206 | 39.09% | 114 | 18.01% |
| bike | 59 | 11.20% | 28 | 4.42% |
| rail | 56 | 10.63% | 95 | 15.01% |
| Total | 532 | 100.00% | 638 | 100.00% |
| After | ||||
| car | 99 | 22.65% | 309 | 42.74% |
| bus | 101 | 23.11% | 175 | 24.20% |
| walk | 149 | 34.10% | 101 | 13.97% |
| bike | 51 | 11.67% | 37 | 5.12% |
| rail | 42 | 9.61% | 106 | 14.66% |
| Total | 442 | 100.00% | 728 | 100.00% |
| Merchiston | Sighthill | ||
|---|---|---|---|
| Mode | StaG | Mode | StaG |
| car | -1 | car | 45 |
| bus | -10 | bus | 38 |
| walk | -57 | walk | -13 |
| bike | -8 | bike | 9 |
| rail | -14 | rail | 11 |
| Global change | |
| car | 44 |
| bus | 28 |
| walk | -70 |
| bike | 1 |
| rail | -3 |
Conclusions
In the introduction, the research question "to what extent can multi-agent technologies combined with access to multiple data sources provide the basis for a framework to model and predict the actions of commuters?" was asked. This paper has proposed a BDI based agent framework for modelling and predicting the actions of commuters. The results presented demonstrate that the framework can simulate commuters to a reasonable level of accuracy. This initial work has concentrated on modelling the modal choice of commuters. Conversations with planners and corporate sustainability experts has suggested that predicting travel mode is potentially the most useful outcome from the simulation.
The framework allows workforce data and transportation data to be utilised and a BDI based mechanism used to model the decisions of individual commuters. The University case study demonstrates that the basic version of the framework discussed in this paper is capable of predicting travel modes to a reasonable degree of accuracy. The current extent of the simulation is to predict travel mode, but predictions of factors such as time, costs, pollution and congestion will be possible as the system is extended to include further data sources allowing more detailed information and feedback to be incorporated.
We believe that this work represents a significant improvement on the earlier work by Ge and Polhill in that it includes public transport within the model and has the facility to have additional modes of transport (data sources and feedback criterion added).
Future work to be carried out includes extending the belief system to take into account other factors, an important consideration is whether all agents should place the same weight on differing factors - e.g. some will individuals will place a higher emphasis on environmental impact. This raises the question as to whether all agents should have the same belief mechanisms or whether a variety should be used across the simulated workforce.
Notes
- The software is in a GIT repository at https://github.com/Zoeoeh/Napier-Commute
References
AOUN, A., Abou-Zeid, M., Kaysi, I. & Myntti, C. (2013). Reducing parking demand and traffic congestion at the American University of Beirut. Transport Policy, 25, 52–60. [doi:10.1016/j.tranpol.2012.11.007]
CAIRNS, S., Newson, C. & Davis, A. (2010). Understanding successful workplace travel initiatives in the UK. Transportation Research Part A: Policy and Practice, 44(7), 473–494.
CBS (2018). Research movements in the Netherlands (ovin). Available at: https://www.cbs.nl/nl-nl/onze-diensten/methoden/onderzoeksomschrijvingen/korte-onderzoeksbeschrijvingen/onderzoek-verplaatsingen-in-nederland--ovin--.
DATASHINE (2011). Datashine: Scotland commute. Available at: http://scotlandcommute.datashine.org.uk/.
DFT (2016). UK Department for Transport. National Travel Survey. Available at: https://www.gov.uk/government/uploads/system/uploads/attachment-data/file/633077/ national-ravelsurvey-2016.pdf.
GE, J. & Polhill, G. (2016). Exploring the combined effect of factors influencing commuting patterns and CO2 emissions in Aberdeen using an Agent-Based Model. Journal of Artificial Societies and Social Simulation, 19(3), 11: https://www.jasss.org/19/3/11.html. [doi:10.18564/jasss.3078]
GE, J., Polhill, J. G. & Craig, T. P. (2018). Too much of a good thing? Using a spatial agent-based model to evaluate “unconventional” workplace sharing programmes. Journal of Transport Geography, 69, 83–97. [doi:10.1016/j.jtrangeo.2018.04.005]
GEORGEFF, M., Pell, B., Pollack, M., Tambe, M. & Wooldridge, M. (1999). ‘The belief-desire-intention model of agency.’ In J. P. Müller, A. S. Rao & M. P. Singh (Eds.), Intelligent Agents V: Agents Theories, Architectures, and Languages. Berlin, Heidelberg: Springer, pp. 1–10.
HAKLAY, M. & Weber, P. (2008). Openstreetmap: User-generated street maps. IEEE Pervasive Computing, 7(4), 12–18. [doi:10.1109/MPRV.2008.80]
HALL, M., Frank, E., Holmes, G., Pfahringer, B., Reutemann, P. & Witten, I. H. (2009). The WEKA data mining software: An update. SIGKDD Explorations, 11(1), 10–18.
HE, S. Y. (2013). Does flexitime affect choice of departure time for morning home-based commuting trips? Evidence from two regions in California. Transport Policy, 25, 210–221. [doi:10.1016/j.tranpol.2012.11.003]
HORNI, A., Nagel, K. & Axhausen, K. W. (2016). The Multi-Agent Transport Simulation MATSim. United Kingdom: Ubiquity Press.
KOMMA, A. & Srinivasan, S. (2008). Modeling home-to-work commute-timing decisions of workers with flexible work schedules (No. 08-3055).
LITMANN, T. (2003). Sustainable Transport: A Sourcebook for Policy-Makers in Developing Cities. Module 2b: Mobility Management. GTZ Transport and Mobility Group.
MCNEILL, G., Bright, J. & Hale, S. A. (2017). Estimating local commuting patterns from geolocated Twitter data. EPJ Data Science, 6(1), 24. [doi:10.1140/epjds/s13688-017-0120-x]
MEYER, M. D. (1999). Demand management as an element of transportation policy: Using carrots and sticks to influence travel behavior. Transportation Research Part A: Policy and Practice, 33(7–8), 575–599.
ONS (2011). Office of national statistics. Where do we commute to? Commuting patterns in the United Kingdom. Available at: http://www.neighbourhood.statistics.gov.uk/.
SUNDO, M. B. & Fujii, S. (2005). The effects of a compressed working week on commuters’ daily activity patterns. Transportation Research Part A: Policy and Practice, 39(10), 835–848.
VAN MALDEREN, L., Jourquin, B., Thomas, I., Vanoutrive, T., Verhetsel, A. & Witlox, F. (2012). On the mobility policies of companies: What are the good practices? The Belgian case. Transport Policy, 21, 10–19. [doi:10.1016/j.tranpol.2011.12.005]
ZHANG, X., Yang, H., Huang, H.-J. & Zhang, H. M. (2005). Integrated scheduling of daily work activities and morning-evening commutes with bottleneck congestion. Transportation Research Part A: Policy and Practice, 39(1), 41–60.