
Introduction
Since the 1970s, the northern part of the Amazonian region of Ecuador has been colonized with the support of intensive oil extraction companies that has opened up roads and supported the settlement of people from Outside Amazonia. These dynamics have caused important forest cuttings but also regular oil leaks and spills, contaminating both soil and water. The still ongoing trial occurring since 1993 opposing Texaco and the Ecuadorian government is the major conflict regarding petrol-related contaminations but other more recent and ongoing contaminations are affecting the Ecuadorian amazon.
However, present-time oil-related contaminations are part of the progressively acknowledged small but long- term expositions to pollution. The point there is that collecting significant information regarding exposition needs a data collection for far more time and even until the generation scale. Do we have to wait until enough death data are collected for assessing and evaluating contamination dynamics? This issue is even more crucial for areas and countries where few data sources are available at the relevant scale, meaning that, once used as inputs in models, there are no more external data for confrontation and confidence building purposes. We here propose to construct such a model as a platform for future evaluations regarding coexisting socio-economic and contamination dynamics.
The aim of this article is to present the PASHAMAMA model that studies the colonization and exposure of the territory of the RAE (Región Amazonica Ecuatoriana) and population to petroleum pollution hazards. As a consequence, many dynamics have to be taken into account together, ranging from the purely physical (the physical dynamics of the environment related to pollution spread) to the social, economic and institutional factors (the colonization process over years). Our interest focused on the interactions and influences between these dynamics and on the possible emergent patterns rather than on a precise study of each independently. We have thus chosen to consider this study object as a complex system (Mitchell 2009) and more specifically a socio-environmental system in the sense of Ostrom (2009). Modeling and computer simulation are appropriate approaches to studying these kinds of complex systems and have had great success in the past few decades (Gaudou et al. 2013; Parrott 2011). More specifically, we chose the Agent-Based Modeling (ABM) approach (Treuil et al. 2008) among many others (Bousquet & Le Page 2004), for both its generative feature (macro phenomena generated from micro behaviors) and as it favors interdisciplinary work. The innovative aspect of this work is the presentation of an approach explicitly dedicated to formalizing interdisciplinary modeling in an almost always incomplete data context, with both qualitative and quantitative information.
The article is organized as follows. Section 2 presents the context of the study: it introduces the case study site and the previous studies of the oil exposition in the area. Section 3 describes the model following the ODD protocol and Section 4 presents the results of the simulation. Section 5 discusses both the results and the method (and in particular the validation of such a model). Finally, Section 6 concludes the article.
Context
The study site: The Región Amazonica Ecuatoriana
This work focuses on the Amazonian part of Ecuador, informally named The Oriente and administratively called the Region Amazonica Ecuatoriana. This area is one of the poorest of the country: the poverty indices in this region are among the lowest of the country, and the Gini index is the highest (Murphy et al. 1997; Hentschel et al. 2000). Moreover, it contains a large portion of indigenous people (labelled nacionalidades: Huaorani, Kichwa, Shuar, Siona-Secoya, and Ai’Co’fan, altogether representing 13.4% of the population in Sucumbios but 31.7% in Orellana, the two northern Amazonian provinces).
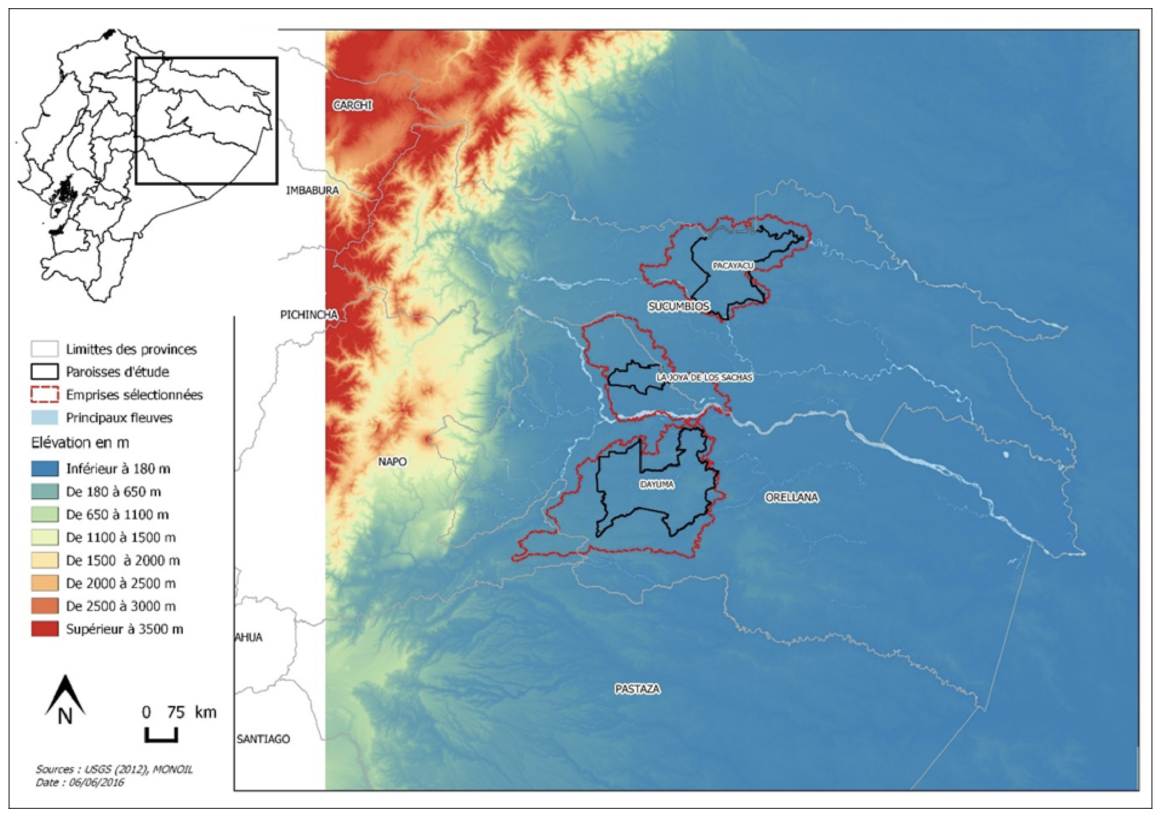
More precisely, the study sites (Table 1) are located in the two northern provinces of the RAE, Sucumbios and Orellana. Three sites (mapped in the Figure 1) were chosen in agreement with other partners of the research project under which this investigation is conducted, the ANR-funded (Agence Nationale de la Recherche: the French National Research funding Agency) Franco-Ecuadorian research and development project called Monoil, using the criteria in the Table 1.
| Sites | Time of first colonization & petrol exploitation | Soil quality for agriculture according to farmers and topography (Maestripieri & Saqalli 2016) | Oil production intensity |
| Dayuma | 1990-2000 | Mostly deep and very altered soils (IRD-USDA pedology) | Medium, for now |
| Pacayacu | 1980-1990 | Mostly deep and very altered soils (IRD-USDA pedology) | High |
| Joya de Los Sachas | 1970-1980 | Good: based on volcanic sands, thereby avoiding soil compaction, and more fertile | Very high |
From the first petrol discovery in 1967 in these provinces until the beginning of the conflictual and trial era ( 1990-2000) Juteau-Martineau et al. (2014), this territory lived practically in a “Texaco era” where, due to the weakness of the central State, it was more an “inner colony” Díaz & Bolívar (2005) than an integrated part of the national territory, as the company played a central role in local governance, exploiting the petrol resource with a policy vis-à-vis neighboring communities that combined threats, violence and bribes and that had a disastrous impact on the environment and human communities. During this era, the North of the RAE was also the object of a colonization plan supported by the various central governments of that time in an effort to “ex- port” the surplus of peasants of the Sierra and the Costa, most of whom lacked land tenure: According to the agropastoral census of 1954, 73.2% of farms covered only 7.2% of farmland, with less than 5 ha per farm, while 2.1% of farms occupied 64.4% of total agricultural land, with more than 100 ha per farm (Naranjo Chiriboga 2004). The plan was supported not only by two laws (1964 and 1973) that were more a support for colonization laws than for agrarian reform (Twenty-three percent (63,500 km2) of the national territory vs 3% (9,000km2) for the redistributed land thanks to the agrarian reform (Gondard & Mazurek 2001). These laws led to the creation of the IERAC (Ecuadorian Institute of Agrarian Reform and Colonization), which organized this colonization) but also by the opening of gravel roads into the forest and connecting oil wells by the Texaco petrol company following an agreement with the government: This means that the current spatial structure of the colonization reflects the organization of the geological resources more than the potentialities of the surface. Primary forests were therefore exploited for their wood and colonized along and around these roads and tracks: each family of colonos received approximately 50 hectares and had to clear at least half of it for agricultural purposes. The forest lost territory while indigenous communities regressed, either changing their way of life or disappearing. However, progressively effective applications of the law of comunas (1937) leased parts of indigenous territories to natives (both locals such as Huaorani, Siona-Secoya, Ai’Co’fan, many Kichwas and those coming from southern provinces, such as some Shuar families), offering some protection thanks to collective land tenure. Since 1990 and the time of conflict, the Texaco company has been more or less expelled thanks to this famous court trial, but oil exploitation has continued and even spread all over the provinces.
Past studies on land cover, population and contamination in the Ecuadorian Amazon
Many investigations have been conducted previously in this area to evaluate environmental degradation in the Amazonian part of Ecuador. These harms were evaluated individually as separate threats.
Contaminants other than those originating from petroleum-related industries have been the focus of several works over time: e.g., mercury (Requelme et al. 2003) in the Zamora-Chinchipe province and pesticides (Hurtig et al. 2003). A more global dichotomy regarding sanitary infrastructure spatial and social accessibility but also disease sensitivity between colonists and indigenous people was explored as being reminiscent of past epidemic shocks (Larrick et al. 1979; Kaplan et al. 1980; Pan et al. 2010).
Petroleum progressively became the major contaminant studied in the Ecuadorian Amazon since Kimerling (1990), who explored the oil production dichotomy between existing laws and reality: this theme expanded suddenly after 2000 (Kimerling 2005) and the emblematic Aguinda vs. Texaco, Inc. case: the juridical theme of this subject has been widely explored (Fontaine 2006; Truuin 2006; Holland et al. 2014; Akchurin 2015; Fernandez Fernandez 2015; Aparicio Wilhelmi 2015). San Sebastián & Hurtig (2004) and Maestripieri & Saqalli (2016) explored the potential consequences in terms of health, Morin (2015), Béguet (2016), Sigal (2016) and Morin & Saqalli (2018) explored the socio-economic consequences while Finer et al. (2008) describes the environmental consequences of petroleum contaminants, followed by Cuesta Soto (2016) and Arellano et al. (2017). Benalcazar & Thurber (2008) investigated the political implications of petroleum contaminants in the structure of the environmental opposition facing oil-supporting powers, followed by scholars such as Larrea & Warnars (2009), Juteau-Martineau et al. (2014), Bromfield (2015), Lu & Silva (2015), Blosser (2016), Kimerling (2015), Lu et al. (2017). If Martínez et al. (2007) intended to propose an .investigative plan for assessing oil consequences in Peru, the equivalent proposal is still missing for Ecuador
However, even if the most mediatized environmental harm is petrol contamination, the best assessed harm at present, in terms of spatial cover and quantification, is clearly deforestation at both the parish and farm levels. Deforestation was first addressed by describing local dynamics (Thapa et al. 1996; Pichón 1997a, b; Barbieri et al. 2003; Perreault 2003; Mena et al. 2006a), then by assessing the forest cutting extent using satellite or aerial image analyses (Arellano et al. 2015; Peláez et al. 2017) and GIS-based (Geographic Information System) LUCC (Land Use & Cover Change) analyses (Messina & Walsh 2001; Bilsborrow et al. 2004; Pan & Bilsborrow 2005; Mena et al. 2006b; Messina & Cochrane 2007; Mena 2008; Brondízio et al. 2009; Gray & Bilsborrow 2014; Lu et al. 2010), and finally through cellular automata and agent-based models (Messina & Walsh 2005; Messina et al. 2006; Walsh et al. 2008, 2009; Mena CF 2011). Four LUCC dynamics were then explored as “both causes and consequences of (a) road development, (b) agricultural extensification and land abandonment, (c) major shifts in world markets and crop prices, and (d) urban expansion of the central city within the region” (Messina et al. 2006).
A simple but meaningful reconstruction of exposure to oil contamination and demography over time
Prior to establishing national law to control oil exploitation in 1990, including waste disposal, oil companies did not undertake measures to protect the environment; their main goal was to maximize production and revenue. A large part of the untreated drilling wastes, including formation water and drilling muds, were directly dumped into the environment in open and unlined pits. This practice did not prevent the waste from leaching out into the environment as the pools degraded or overflowed during rain events. Approximately 5300 separate waste pools have been found in the Ecuadorian Amazon (NGO Acción Ecológica, pers. com. 2013), of which 1701 are referenced geographically (1561 in the two provinces we study) and often historically (in 2016, 84.7% (86.7% in the two provinces we study) are not yet registered as having been remediated by the dedicated department in the Ministry of Environment (MAE): the PRAS, the Programa de Remediacion Ambiental y Social). Moreover, pools are also used to contain spill products. According to local testimonies, these practices still occur, although less frequently, even if they are forbidden. Serious health and environmental damage near oil fields have been identified (Sarria-Villa et al. 2016).
PetroEcuador and PetroAmazonas, the public oil companies, have taken several remediation actions regarding these pools in recent years, along with monitoring by the Ecuadorian Ministry of the Environment (MAE) under the Amazonia Viva Program but executed by PetroAmazonas. From 2005-2016, 1016 oil contamination sources were remediated, including 285 pools and 631 holes, and validated by the national authorities (MAE- PRAS data 2016). Each step in the oil and gas exploitation process causes environmental and social impacts. In fact, whether it is field exploration, drilling, refinery or transportation, each affects the biosphere to a different extent. Deforestation, accidental oil spills, especially along the trans-Andean pipelines (Both SOTE and OCP, altogether designated as the poliducto), and industrial waste discharge are some of the main chronic or accidental impacts caused by oil activities. The release of chemicals, including polycyclic aromatic hydrocarbons (PAHs) and trace metals (TMs), to the environment due to oil activities is one of the major harms caused, affecting human health (San Sebastián & Hurtig 2004; Kuang-Yao Pan et al. 2010) and the environment (Finer et al. 2008). In particular, 16 PAHs are considered priority pollutants by the US Environment Protection Agency (US CFR 1982). Even though several large-scale pollution incidents linked to well explosions or leaking pipelines have been described (Finer et al. 2008), it can be said that no exhaustive environmental impact assessment has been published concerning chronic contamination. In the 2010s, several small studies coordinated by NGOs (like Acción Ecológica) identified local contamination of natural waters used for domestic purposes in the Sucumbíos Province (Pacayacu), but they only focused on the contamination risks of the 16 US EPA-recommended PAHs without taking into account toxic volatile molecules or trace metals (Zhang et al. 2016). The analyses were conducted in Ecuadorian laboratories, and no information regarding the validity or accuracy of these results is available. Until 2010, no large environmental study had been performed in the Ecuadorian Amazon to evaluate the environmental impacts of long-term oil activities and infrastructure presence in the region, especially on river quality and associated health risks.
In this context, the IRD-CNRSconsortium[1], in partnership with several French and Ecuadorian partners, launched the MONOIL program. This transdisciplinary project studies the impacts of oil activities in Ecuadorian territory on the environment and society at different levels, including geographical, political, economic and social levels (Houssou 2016; Chapotat 2016). Three petroleum areas are considered in northeastern Ecuador, each of which is affected by oil exploitation. No other studies to date have approached these specific subjects in Ecuador. Within this project, the purpose of this paper is to present a model that aims to assess the historical and spatial exposure of the colonizing population to past oil contaminations through a simple confrontation of social and environmental dynamics spatially impacting each other.
Contribution and novelty of this work within the research community of other simulating coupled human-natural systems
Different modeling approaches have been used to analyze social and economic questions of the rural world as initially reviewed by (Lambin et al. 2000) among others. Spatially-organized Agent-Based Models were found particularly useful for simulating the intricate and multidisciplinary complexity of any local reality. Many publications have been produced intending to assess a state-of-the-art such as (Abar et al. 2017; An 2012; Balmann 1997; Barton et al. 2012; Berger & Schreinemachers 2006; Wainwright 2008; Bousquet & Le Page 2004; Smajgl 2007; Polhill et al. 2010; Matthews et al. 2007; Marietto et al. 2002; Irwin & Geoghegan 2001; Schulze et al. 2017; Filatova et al. 2013; Cliuord 2007; Bousquet et al. 2001): They can manage data integration gaps such as the quantitative vs. qualitative one, the micro vs. macro level one (with micro level data such as typologies of farmers and macro level data such as soil or elevation maps) but also to formalize the combination of disciplines (Rouchier & Requier-Desjardins 2000). They are particularly relevant to empirically describe the behaviors of populations without forcibly the need to define their rationalities upon predefined paradigms (Janssen & Ostrom 2006; Saqalli et al. 2010; Schutte 2010). As a result of this adaptability and totipotence, one may consider this work as an other case study regarding socio-ecological systems with the particularity of a site with a recent and somehow well-documented history and both pollution and colonization/deforestation issues. However and using the GIS (Geographic Information System) capacities of the GAMA platform (Taillandier et al. 2014), we here tend to settle a methodology of combining qualitatively-acquired farmer-level information and quantitative spatial and historically-rebuild demographic data: the main question in this article is the way a socio- ecological dynamic evolves taking into account various factors of which the human transformation power is crucial. In the present study, the object of our modeling is the population itself and the territory it overturns as a global system, i.e. the definition of the socio-ecological system. Two issues are thereby here explored following many studies using a case study for exploring methodological issue following an anthropologically-settled process where the case creates the issue: Here we explores both the case of a complex present-time situation that has the advantage to be easily positioned regarding time and the methodological issue of the combination of quantitative data on human impacts and qualitative data regarding rationality of human processes inducing these impacts.
Model Description
This section is dedicated to the description of the model using the standard O.D.D. (Overview, Design concepts, Details) protocol (Grimm et al. 2010).
Overview
Purpose
This model aims at studying the colonization and exposure of the RAE territory and population to petroleum pollution hazards, focusing on the interactions and influences of purely physical (the physical dynamics of the environment related to pollution spread) with social, economic and institutional factors (the colonization process over years). Our interest is focused on the possible emergent patterns rather than on a precise study of each independently.
Three case studies are considered: the parishes of Pacayacu, Joya de Los Sachas and Dayuma. Three sites were chosen to cover various combinations of the environment (quality of soils) and population (age of colonization) factors: good soils for Joya de los Sachas and poor soils and territory for Pacayacu and Dayuma; colonization in the 70’s for Pavayacu and Joaya de Los Sachas and in the 80’s for Dayuma) (see Table 1).
Entities, state variables, and scales
Scales. As detailed in Sections 3.23-3.32, we consider three sites which have approximately the same dimensions of 100 km by 50 km. In this area, the smallest spatial unit chosen is the cell (a square of 90m by 90m) coming from the DEM (Digital Elevation Model) file with the best resolution. It is used in particular to let the water flows. It should be noted that apart from large streams, other streams are less than one hundred (100) meters wide, which makes it possible to consider their representation as well as that of their immediate shore- line within a cell. This spatial scale is the basis of the cellular automata component of the model. It can also be noted that this cell area is close to 1 hectare, which is meaningful from an agricultural point of view.
The simulations are launched from the 1st of January 1960 until the 31st of December 2014. The minimum time for a farming step (i.e., weeding a one-ha pasture) is about one month, and we use monthly rainfall data from the WorldClim project (Hijmans et al. 2005). The choice of this time step is also justified by the fact that the stream flows are high enough to allow for the capture of the total discharge of the water resulting from precipitation, as well as the occasional pollution, in a period of one month. In addition, colonization and demography data were processed on a monthly basis. Therefore, we used a one-month interval for our model.
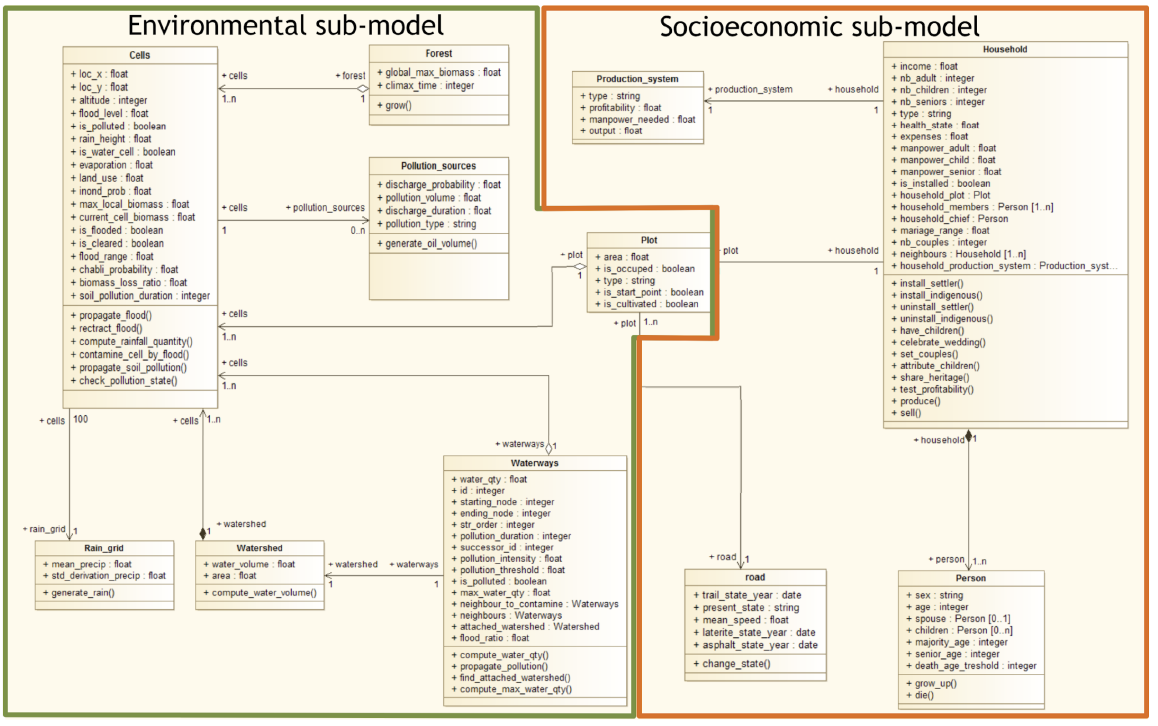
Entities. The integrated model has been subdivided into an environmental sub-model, comprising the contamination and the hydro-geomorphological sub-models, and a socio-economic sub-model (Figure 2). As the model is spatially explicit, each agent is located (has a location attribute) and has a geometry (shape attribute, that can be a point, polyline or polygon).
The environmental sub-model is responsible of managing the water flow and flooding over the water catchment, the oil leaks occurrences and its spread in the environment. The model is spatially distributed following the Digital Elevation Model (DEM) and thus composed of a grid of Cells agents that contain, among others, information about the average height in meters of the corresponding land use, soil type (fertility and flood sensitivity proportion), water volume and forest biomass. The water flows through the hydrographic network composed of connected Waterways, each of them carrying the “Strahler” stream order (Strahler 1957) to conceptually simulate river discharge and the associated propagation of oil contamination. Watersheds agents are composed of Cells and are used to compute water volume statistics. The rain_grid agents (also organized on a grid) will compute the rain falls from their mean and standard deviation precipitation attributes. Finally the Pollution_sources are represented by points or lines (pipelines) and will discharge oil leaks on the Cells on which they are located, given discharge probability, volume and duration attributes.
The socio-economic sub-model is responsible of managing the population migration and settlement, and its demography. According to field surveys (Morin 2015; Béguet 2016; Morin & Saqalli 2018), the autonomous decision-making entity, that is capable of moving geographically, is the Household, that is the main kind of agents of this model part. A Household is an aggregate of Person agents, characterized by their sex, age, spouse and children Person attributes. These individuals become older, get married, get children or die; they thus are responsible of the demography of the settled population. They will also define the composition and manpower of the Household to make its activities. The main Household activities are agriculture (coffee, cocoa and food crops), livestock (both for sale and subsistence) and seasonal jobs, mainly in oil and oil-related companies. They will be managed by the Production_System agents.
Once arrived on the area, each Household will be affected a Plot (that can be privately an owned and managed property, named finca by colonist Households or larger reserves or communities that are commonly exploited by indigenous Households). These Plots are an administrative border for a set of physical Cells, with an average area of 50 ha. The choice of the Plot by each family will depend on the evolution of the Road network. Each Road agent is in one of three types (and will evolved over time): forest track, roads covered with laterite and gravel, and asphalt roads. To each type is assigned a specific average speed.
Biophysical and demographical environment variables. The environment variables are both used in bio- physical dynamics (such as the rain and the evapotranspiration rate, describing the rain water quantity reaching rivers) and demographical dynamics (in particular the reproduction, birth, death and migration occurrences used to describe the population dynamics). In addition, the speed on the various road types are also defined as global variables.
Process overview and scheduling
At each step of the simulation, first the processes related to the socio-economic sub-model are executed and then the ones linked to environmental sub-model.
First the Road agents update their state. They contain indeed the date when they changed they were built, when they changed their state from forest track to roads covered by laterite and from covered roads to asphalt roads. Then the colonization process occurs: new Household agents (with their set of individual Person agents) are created with the appropriate type (colonist or indigenous). They choose the best Plots for them and install on it. Finally, the demography is processed: Person agents are aging, some of them die, some of them get married and so new children are created.
Once the socio-economic sub-model has been executed, environmental dynamics are performed. First the rainfalls are computed on each rain_grid agents and then applied on each Cells spatially overlapped by rain_grid agents. The water flows on the Waterways network and water volume are computed at the Watershed level. Finally, the contamination process creates new Pollution_source agents, let the Pollution_sources discharge pollution on the Cells on which they are located. This pollution spreads from Cells to Cells toward the Waterways following the slope and contaminates all Cells covered by the river.
Design concepts
As recommended by O.D.D. protocol authors, only the appropriate design concepts are presented below.
Objectives
The main dynamics of the model are not driven by some objectives to reach (e.g. water and pollution flow, demography...). Only the parcel choice in the settlement of new families is driven by the family objective to settle in a free parcel as close as possible from the area city.
Interactions
No interactions are assessed between family agents for now. Further improvements in the farming module include exchanges of information regarding soil reactions to the various crops to be implemented. For now, we here present a model where the sole interactions between family agents and between these agents and the territory go through the spatial dimension, i.e. through land appropriation, linking a farm and a family agent and forcing new settling families to settle in other places.
Sensing
Each family agent is aware of the location of its finca, whether a finca is owned or not, and of all of its demographic, ownership and economic data. It is also aware of farm characteristics (type, location and progress of each crop, soil and distance to the local main city center that defines the transportation costs).
Stochasticity
Three factors are stochastically settled:
- Computation of monthly rainfall, producing a rainfall value for each km2,
- Occurrence of oil spills for each oil infrastructure element,
- Various demographical events (family size and number, birth, death...).
Collectives
Family agent group human individuals within the household they belong to, but we consider that they function along a common rationality allowing thereby confounding into one unit each family. On the other hand, family plots, also named finca or farms, group cells, each one equivalent to one pixel of 90*90m. Two cases are considered:
- For family of colonos who settle into comunidades with private ownership, fincas were delimited ex ante by government authorities: they correspond to lots grouping around 50 ha. For the territory from which we got the cadaster, this cadaster was included directly as the plan for settlement, each lot corresponding thereby to a finca;
- For family of indigenos who settle into comunas with collective ownerships, each finca is the territory used de facto by each family: they are thereby the territory of use of each family and not the farm owned as in the previous case.
| Variable | Data type | Description | Sources |
| Environment | |||
| Rainfall mean | GIS raster file | Mean of monthly rainfall from 1960 to 2000 transposed on 900m * 900m cells | WorldClim project www.worldclim.org |
| Rainfall standard deviation | GIS raster file | Standard deviation of monthly rainfall from 1960 to 2000 transposed on 900m * 900m cells | WorldClim project www.worldclim.org |
| Elevation | GIS raster file | DEM (Digital Elevation Model) with a 90*90 m resolution | USGS SRTM earthexplorer.usgs.gov |
| Pedology map | GIS shapefile | Pedology parameters | IRD pedology map using USDA topology sphaera.cartographie.ird.fr |
| Oil pollution | |||
| Oil extraction infrastructure | GIS shapefile | Oil wells, flares, oil waste pools and pits, oil refineries | MAE-PRAS and GADs |
| Oil transportation infrastructure | GIS shapefiles | Pipelines | MAE-PRAS and GADs |
| Population | |||
| Tar & gravel roads, tracks | GIS shapefile | Database of road networks & typology based on field experience | MAE-PRAS and GADs |
| Demography | Numbers | Family appearance probabilities from demographic database | INEC: National Institute of Statistics and Censuses (Ecuador): www.ecuadorencifras.gob.ec |
| Manpower | Numbers | Mean family type manpower | (Morin 2015) (Morin & Saqalli 2018) |
Observation
We observe the annual rate of land appropriation by both colonos and indigenos in the three sites and its correspondence with deforestation data coming from satellite analysis, through the parameter linking family man-power and family rate of deforestation. As bedrock for further investigations, we also observe the occurrence rhythm of oil spills but we do not try to see correspondence as it is impossible to have other data than the ones we used for the simulation.
Details
Initialization
The simulation starts by initializing entities related to biophysical process, and then roads and plots that are the physical ground of the demographical dynamics.
- The cells are initialized from the Digital Elevation Model of the simulated parish. Every cell has an initial surface, slope, fertility and biomass. Its biomass is calculated according to the local maximum biomass. Fertility and local biomass are provided through shapefile layers.
- The waterways and the rain grid are initialized (spatial location and shape and other attributes) from a dedicated shapefile.
- The plots and roads are then initialized from their GIS shapefile.
- Finally, the association between plots and cells are made through simple geographic queries: a plot is linked to all the cells it spatially overlaps.
No family is then created at initialization.
Input data
The input data are composed of several geographical (raster or vector) and tabular data files (details are provided in Table 3). This dataset has been built from a raw dataset (summarized in Table 2) through various data cleaning and transformations presented below.
USGS-originated LANDSAT 90*90 data is used for elevation. We did choose the 90m*90m data rather than the more precise 30m*30m to improve model computing speed but also because this is the closest scale to 1ha, an area unit meaningful from an agricultural point of view.
From these raw DEM data file, the river and water catchment network have been derived. We cannot use raw data for the hydrological network because Ecuadorian administration data do not have the same precision across all of the sites, which does not allow us to use them if we want to apply the same model over the three case studies. For getting a harmonized and precision-equivalent river network, a process applied to the whole territory of each site, using Rivertools from ArcGis on elevation data, was preferred than collecting heterogeneous river data from various sources. However, two sites are in contact with the two main rivers of the RAE (the Aguarico and the Napo), so we had to add a complementary upstream flow input using the INAHMI data for these rivers (Figure 3).

We built data about rainfall from the Worldclim project (Hijmans et al. 2005): this database reconstituted all the monthly rainfall values from 1950 to 2000 and extended rainfall values through simulated expectations integrating global warming impacts. It is then the most useful data for reconstituting the climate values along its temporal and spatial variability. Finally, evapotranspiration (global parameter) is considered in this model version to be fixed at 70% of the rainfall before reaching rivers.
For everything related to soil, we use the IRD pedology map with the USDA topology and deduce from it:
- The soil flood potential, defined as a flood probability, is derived from the addition of the area of hydro- morphic characteristics of the IRD pedological map, i.e. hydromorphic soils and swamp land area. The extent of the flood within these floodable areas is defined by the difference between the simulated flow of a river and its medium value, characterizing thereby a flooded surface extent expanding from the concerned riverbank, and potentially contaminating different areas. The value is then the extent (Figure 2).
- The soil fertility is based on the IRD map, where soils are described only along their physical characteristics. It is simply the clustering into 5 classes of the soils of the three sites , according to the crop potential of different soils as described by settlers during qualitative field investigations on agriculture (Maestripieri & Saqalli 2016), thereby producing a qualitative soil fertility categorization index ranging from 0 (the least fertile) to 1 (the most fertile).
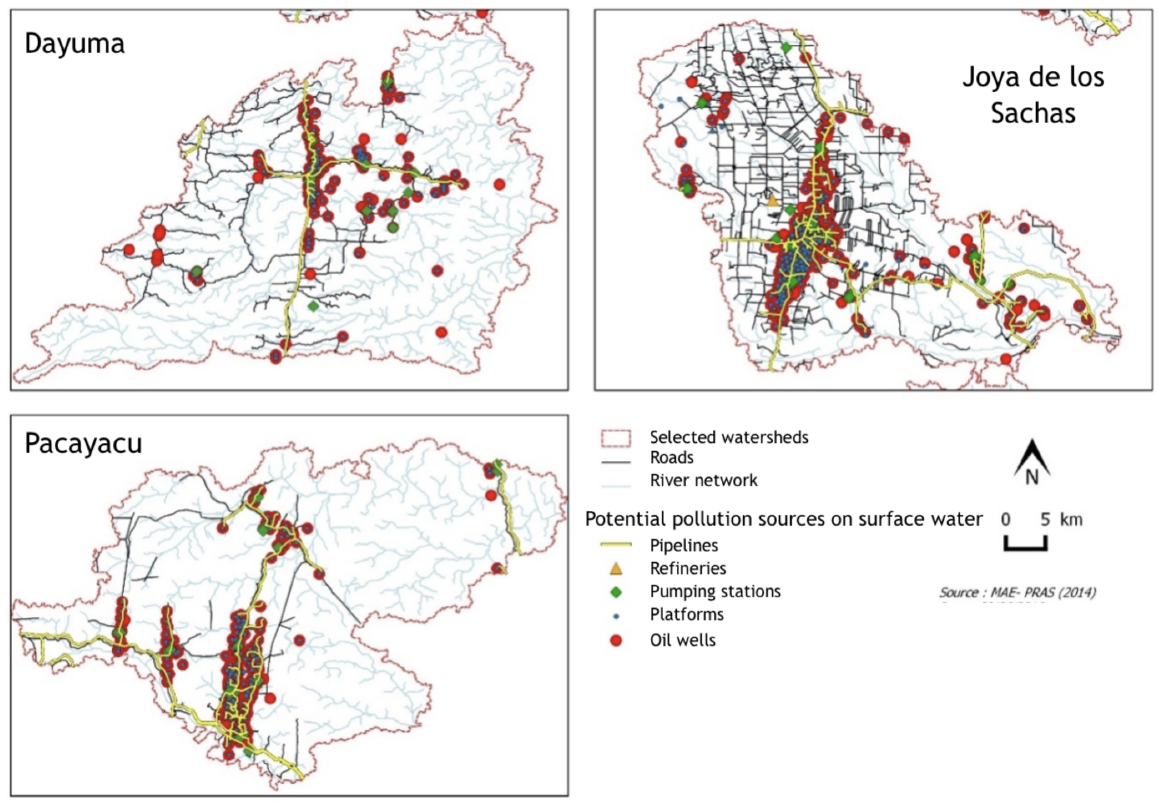
All oil infrastructures were collected thanks to ministries (Environment, Agriculture) but also through GIS mapping services in decentralized authorities (Municipios) who collected locally but did not always shared spatial data regarding oil infrastructures on their territory. Implementing a series of derrames in the model means establishing their probability of occurrence, the volume associated with each incident and the duration of emission. We note that the PetroEcuador/PetroAmazonas data on derrames can be trusted for the blocks owned by these companies but that other companies did not provide any data for their own spills. Oil and gas infrastructure was referenced in the GAD in which it was located, so we hypothesized that the derrame frequency was equivalent for across this infrastructure, assuming the data were representative of all blocks. From the PetroEcuador/PetroAmazonas dataset, we extracted probabilities of occurrence (1.82 incidents per month on average) and the volume per incident (a standard normal distribution with 17 oil barrels on average (17* 159 L = 2703 L) with ±5.4 barrels as the standard deviation (856 L).
Oil wells and pipelines, which generate oil spills, are used in the model. Data on other contamination sources and using other media, including flare and aerial imagery and data on petrol pits and subterranean shallow waters, were not included in order to focus on the main visible contamination type and medium, water pollution from oil spills and the spread thereof (Figure 4).

Portions of routes and paths were as well collected from various GADs. Speed according to terrains (tar roads, gravel roads, pistes, paths, untraced), history of appearance and characteristic shifts (from paths to pistes, then gravel roads until tar roads) are defined according to local qualitative interviews assessed from 2013 to 2015. A shapefile has been created containing all the roads in 2014, with for each the date in which it reaches the state tat, gravel or track). For each of these types, we associate an average speed, used to compute the distance of a plot to the market, tar: 60 km/h; gravel: 20 km/h; track: 10 km/h; off: 5 km/h.
Demography is based on quinquennial census from INEC (National Institute of Statistics and Censuses of Ecuador) from which we deduced for the whole simulation duration a monthly probability of appearance of families, each one defined with a family size and age distribution in order to fit with these demographic data. Demographic factors are translated into settlers’ family appearance probabilities: the population data inventoried in the three sites by INEC, which are available with age classes, are first decomposed into local birth rate, identified through the one-month age class, and immigration growth. The latter should then be translated into families: following Bilsborrow et al. (2004), Gray & Bilsborrow (2014) and Pan & Bilsborrow (2005), newly settling households have a random size between 4 and 11 people of various ages, each corresponding to the relative proportion of age classes within the calculated immigrant population.
Manpower is derived from Morin (2015) and Morin & Saqalli (2018): an average value for each time period is derived from the related proportion of each family type identified during the Dayuma fieldwork in 2015. Regarding the land use, the deforested land cover from Durango et al. (2016) is here used to be compared in terms of value at the scale of each site with our data, acknowledging.
Sub-models
Hydro-geomorphological model (1). The amount of rainfall in each of the basins is computed on a monthly basis from the rainfall recorded at the level of the cells constituting the basin. Monthly water streams are reconstructed and derived from rainfall: for each 900m*900m group of pixels, the monthly rainfall random sampling follows a Gaussian distribution, the mean and standard deviation of which are derived from the WorldClim 1950-2000 data collected for the study areas (Hijmans et al. 2005). We then deduce the water fluxes of all rivers as the collection of water runoff from their respective water catchments, minus a loss of 70% due to evapotranspiration and infiltration. Such a simple hydrological model is sufficient, as we are seeking not an absolute value of the water fluxes but rather a relative value that is comparable between rivers and water catchments.
The forest is modeled based on biomass per hectare. As long as a cell is not affected by human activity or by random treefalls, its associated biomass remains constant because the Amazonian forest is roughly considered to be at its climax. Otherwise, the forest suffers a biomass loss at the level of the affected cell(s) and immediately enters a growth process unless the human activity persists.
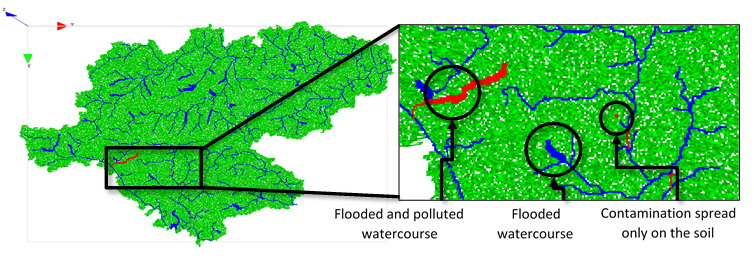
Contamination model (2). The pollution sources are represented by points or lines (pipelines) and are associated with the DEM cells. At each time step, a certain amount of oil is generated by the pollution points using a Gaussian function based on the available data (see Section 3.20). The cells that include pollution points are then identified as contaminated and propagate pollution to all the neighboring cells with an altitude lower than or equal to theirs. This pattern of propagation is reproduced by the newly contaminated cells until there are no more adjacent cells of equal or lower altitude or until the pollution touches a stream. In the second case, pollution is propagated along the hydrographic network as long as its intensity is above the predefined pollution threshold.
Demographic model (3). At each simulation steps, new household are created in the simulation (given the immigration rate coming from data) with a random size between 4 and 11 people of various ages, each corresponding to the relative proportion of age classes within the calculated immigrant population. As farmers produce both food and cash crops, accessibility is as important as soil potentialities. Therefore, families settle close to roads, close to other farms and in areas with fertile soil.
In addition, at every step, there is also a demographic process over the existing population: people become older, they can give birth to new people, die, get married... In particular, the birth of new people and their aging will increase, after some steps, the manpower of the family.
| Variable | Data type | Description | Treatments | Use | Sources |
| Environment | |||||
| Rivers & water catchments | GIS shapefile | Calculation based on DEM using ArcGIS Spatial Analyst extension | Rivers & water catchments calculation | Input | USGS then Treatments |
| Flood potential | GIS shapefile | Soil map reshaped into 6 flood classes (5 “possible” and one “impossible”) | Clips | Input | IRD pedology map reinterpreted using USDA classification |
| Soil fertility | GIS shapefile | Soil map reshaped into 5 fertility classes | Clips | Input | IRD pedology map reinterpreted using USDA classification |
| Land use & cover | GIS shapefile | 7 types of land use | Validation test | GADs and field experience | |
| Oil pollution | |||||
| Oil accidents (derrames) | Parameters | Calculations of accident probabilities based on the GIS shapefile & database | Clips, inference on other data & | Input | MAE-PRAS and GADs |
| Population | |||||
| Tar & gravel roads, tracks | GIS shapefile | Database of road networks & typology based on field experience | Clips | Input | MAE-PRAS and GADs |
Results
In this section, we present various results: we start by describing the results of each of the 2 main dynamics alone (the bio-physical dynamics and the colonization process). We then analyze the model coupling both ones.
Spatially modeling the riverine and soil oil contamination hazard
The hydrographic network organized along the Strahler order-based hierarchy is fed by rainwater, except for the Joya de Los Sachas and Pacayacu sites, where we had to add the water catchment discharges from major rivers, Napo and Aguarico respectively. The network recreates the dynamics of the water flow from small watercourses to large ones as well as inundations. One representation shows the elevation and the river network in 3D, and the second representation categorizes the network according to each watercourse Strahler order in 2D (Figure 5).
As a first result, we obtain a spatially designed monthly-timed dynamic model of oil pollution emission and spread hazards both in water and land. When polluted watercourses flood the land, the latter is also polluted (Figure 6).
Modeling migration demography & colonization over time & space
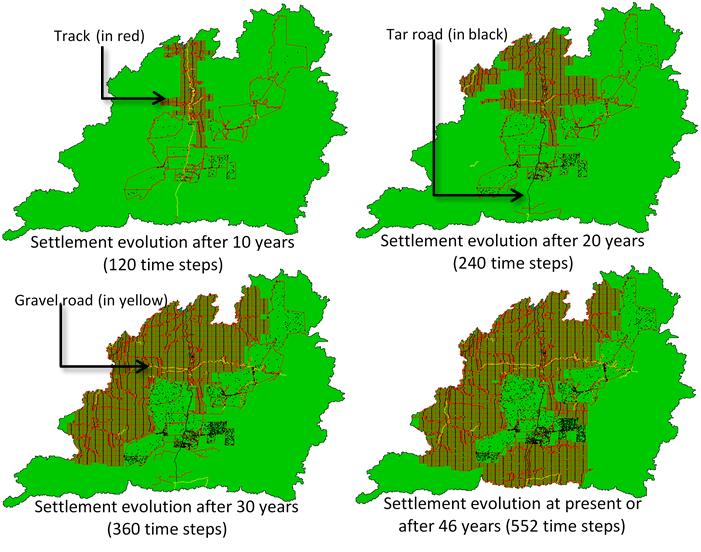
When considering alone the process of colonization, the model reproduces in a way the evolution of the population pressure over the environment. As an example, Figure 7 shows the settlement process on the Dayuma parish, through new settlements in fincas but also in non-tenured comunas. Road conditions and networks are evolving Rectangles indicate parcels of the settlers, while polygons represent indigenous comunas.
Comparing these outputs with external data, i.e. land cover maps derived from satellite image analyses at different times, time series analyses corresponding to similar time periods are used to assess the validation of our settlement evolution simulation. We used land cover classification GIS data layers derived from satellite images procured by the Ministry of Agriculture and Fisheries (MAGAP) and Ministry of Environment (MAE) in 2014, focusing on forest area extent evolution, that we did not use purposely in the model. Forested land cover is defined as a minimum of one hectare area covered by trees at least 5 m tall and in which foliage covers at least 30% of the ground.
In addition, a network layer of different road types corresponding to the same time periods was added to the forest maps to be compared with the simulated road network. The coarse resolution data available for the year 1982 results in a divergent estimation of forest extent so we decided to combine forest cover with a class of mixed forest and arboriculture. Table 4 shows the forest extent and the sequential forest loss along years. This visual comparison is encouraging as it shows that our reconstruction matches the spatial patterns of colonization in Dayuma and its water catchment since the model initialization in 1972 (Figure 8).

| Year | Forest (km2) | % loss | Data and Scale | Simulation outputs |
| 1982 | 2.881 | —– | Landsat ETM+ 1:250,000 | —– |
| 1990 | 2.812 | -2.4 | Landsat TM and ETM+ 1:250,000 | -2.80% |
| 2000 | 2.582 | -10.4 | Landsat TM and ETM+ 1:100,000 | -10.10% |
| 2014 | 2.397 | -16.8 | Landsat 8 and Rapid-Eye 1:100.000 | -14.63% |
We can see that the model successfully represents the colonization along the main roads that started to spread from the north side, first following forest tracks and intensifying thereafter with the improvement of the roads. The colonization is faster and stronger in the west due to a more substantial development of the road network. Meanwhile, we can see a growth in the number of dots within comuna limits, indicating the settlement of indigenous families there.
Combined spatial modeling of population and territory exposure
Finally, combining demography, water catchment dynamics and pollution events, the model is able to represent the exposure dynamics of both territories and populations in the three study sites (Figure 9).

The Sacha and Pacayacu sites have a longer history of colonization and oil exploitation, meaning that their simulations should begin earlier and should show more impacts from territory and population exposure. The Pacayacu site may exhibit concentrated oil pollution exposures to scattered sites along the Aguarico River in the south due to a highly concentrated spatial distribution of oil wells and pipelines. The Sacha site, owing to its better soils, may provide a better income to farmers, which has not been included in the simulation. However, the far more important number of oil wells and pipelines and their spatial distributions, often upstream, may expose a higher proportion of the territory and population, especially the indigenous comunas downstream along the Napo River. Finally, the later colonized Dayuma site has the same distribution of wells and pipelines, often upstream, meaning that the downstream population, a mix of colonos and indigenous people, who are often the poorest as they are far from the tar road, may be the most exposed.
One may then already note that the extent of contaminated areas is by definition limited to talwegs and regularly flooded areas, thereby reducing the territory exposure and therefore the affected environment. Based on field interviews with farmers, petroleum technicians and public officers during interview sessions in 2013, 2014, 2015 and 2016, this reconstruction is perceived as correct in terms of spatial leak coverage. Scholars from the Monoil project agree as well on the spatially and temporally limited extent of the derrames, even when we apply the same frequency of PetroEcuador/PetroAmazonas derrames to the entire network of oil infrastructure.
Discussion
Value as a risk estimation tool
PASHAMAMA is a practical, sustainable and easy-to-explain model to assess the impact of a spatially “invisible” hazard in a socio-environmental system. The main issues were not only to build the framework for both a simple evaluation of the exposure to this hazard even as some data were unavailable but also to construct a software framework that can support additional modules for assessing the impacts of other risks affecting both the environment and the population.
The model uses both historical spatial and non-spatial data and uses expert knowledge and experiences to count for physical and conceptual processes and rules that are only partly validated due to the lack of observation time series within the study site, including discharge and pollutant transportation, stream flood dynamics and oil leak events and quantity. Therefore, we may assume that one strength of this simulation is its capacity to estimate, even roughly, the spatial and human impact of chemical pollution over time using modeling with accurately combined, accessible and open-access data and process-based dynamics. Based on the agent-based modeling approach, the integration of socio-economic and environmental aspects allows the model to support a) knowledge integration and sharing among studies from different disciplines and sources and b) future decision making and planning. Connectivity, accessibility and pedology seem to be the only major explicative factors as the global colonization pattern matched the satellite-based imagery at the end of the simulation but throughout, meaning that the pace of colonization corresponds to our demography forcing. Our results are different from the closest simulation approach, i.e., the Repast NEA model (Messina & Walsh 2005; Messina et al. 2006; Walsh et al. 2008, Walsh 2009; Mena CF 2011) because the model purpose, approach and scale are different. We focus on exposure and not on deforestation in the three sites, with each site being 3 to 4 times bigger than that in the other model. Furthermore, our model shows the colonization process itself and not the consequences in terms of deforestation of already settled populations. As such, the model we built here may be able to include the agriculture module from the Repast NEA in the future to simulate the consequences in terms of deforestation at a far larger scale.
From a more epistemological point of view, the model is a practical application of the following principle: better than acquiring precise data, the relevant focus of modeling is to obtain, infer or generate the valuable variables that, when combined together, best fulfill the purpose of the question raised. Here, we show that a simple combination of variables may provide interesting insights, suggesting that this variable-then-data-first principle provides generalizable results in an easier way.
Model validation: Lack of data, confidence-building and knowledge emergence
This socio-eco-hydrological modeling was only validated using existing spatio-temporal data, including the deforestation resulting from land appropriation/colonization dynamics. Indeed, hydrological monitoring pro- grams conducted by the Ecuadorian government focus on major rivers (Aguarico, Napo) and do not yet focus on the less important ones, such as those draining our study sites. The processes and importance of pollution spreading to the environment need to be further quantified and validated using the research outputs from the Monoil research project, which are not yet fully developed. For instance, the first global epidemiology investigation was assessed in the Monoil project. The data are not yet analyzed in space and time. From a confidence-building perspective, from the dynamics we simulate, only the appropriation/colonization process can be tested: hydrological measurements in the RAE have been assessed by the Ecuadorian government for the major rivers (Aguarico, Napo) but not the less important ones we simulated here, meaning that there are no data that can be contrasted with our simulation outputs. The oil pollution values are yet to be analyzed, estimated and published by Monoil scholars, meaning that the related test is to be assessed in the future. Demographics are inputs in the model. No procedure can be provided yet as a test of the value of this simulation because the first global epidemiology investigation has been assessed in the Monoil project and has yet to be analyzed both temporally and spatially. However, one should not neglect the impacts of repeated low doses of contaminants on population health. The environmental consequences of such a succession of oil-related pollution accidents have yet to be determined. The first global estimation of these impacts is on its way to being proposed within the same project (Durango et al. 2016). Therefore, the procedure we propose can only be used a confidence-building step for now.
Thematically, this simulation underestimates the exposed population, with only the solute transport in water runoff taken into account, though gas flares and oil pools should also be considered, but these are likely to be overestimated as large parts of the population, mainly those close to roads or living in villages, do have access to tap water, which, even if it is not of good quality, allows the population to avoid accidental contamination. One should not forget that the environmental and sanitary impacts of the two other oil-related pollution sources have yet to be assessed in terms of the chronic and permanent impacts, including the aerial pollution from the 117 gas flares in the three study areas and the pollution from the at minimum 1561 geographically referenced oil pools, mainly from the Texaco era, in the same sites. A new source of pollution from newly implemented oil palm plantations may be noted, which, according to field interviews, uses many phytosanitary pesticides.
Methodologically, field investigations induce both sampling and data flaws: apart from the choice of sites, a question that can be raised only after field investigations, one may question the origins of the data: they come from central administrations (INEC, MAE) and GADs. However, some GADs have refused to share their data, as is their right, possibly affecting the representativeness of the data. Any GIS data may face flaws in their positioning accuracy and/or their characteristics, while a sampled field-check of some of these points has yet to be done. The data source inventory also revealed the heterogeneity of these data, even if the national information system (SNI) tends to centralize all available spatial information. The geo-localization precision varies according to different sources, and there are potential duplicates and redundancies. As the derrame occurrence is known only for PetroEcuador/PetroAmazonas blocks, the equivalence hypothesis we postulate may underestimate the number of spills for other less cautious companies. Similar problems appear regarding the volumes of these derrames.
Regarding the modeling aspect, ABMs do not require large hypotheses in the system. The main assumption is that the investigated macroscopic outputs can be generated by the behaviors and interactions between the individual elements of the system. This is a weak hypothesis compared to those needed for representing equation- based systems, and thereby provides more freedom in modeling. Such freedom has a counterpart, the ability to analyze a system in its entirety, thereby introducing many dynamic, entities and details, making it difficult to identify the individual influences of each part (Edmonds & Moss 2004). Similar investigations regarding equatorial forests have not shown an equivalent “syndrome” in the analysis of the outputs (Purnomo & Vanclay 2003; Stolle et al. 2003; Pan et al. 2004; Sirén et al. 2004; Bonaudo et al. 2005; Verburg et al. 2006; Malanson et al. 2007; Van Vliet et al. 2010).
More globally, we deal in this model proposal with the more global validation issue for models with several intricate dynamics with few and incomplete data: we are forced and thereby assume to realize a partial validation for the sole dynamics for which we have external data to be used as confrontation test, assuming thereby that “validating” one dynamic implies having confidence on the dynamic simulation for which no test can be assessed. Otherwise, it means that no modeling can be done on environmental issues unless having enough data while usually, modeling is assessed for compensating the lack of data! Moreover, in our case, building such a platform is a necessary step for expanding the model with other social and environmental dynamics to be presented in future articles.
Conclusion
The PASHAMAMA model should be considered as a first step in an on-going research process that employs a combination of results from various disciplines, methodologies and research practices within the same project. The model, a spatially explicit agent-based model, has been designed as a global model of system structure in which natural and socio-economic components are harmonized at the most “atomic scale”, i.e., the family scale for the human agents, the 90*90 m pixel for the territory and the month for time.
A first step is to test our model by comparing simulation outputs with newly produced data from the Monoil project or from the Ecuadorian government, for instance data on hydrology and water contamination. For now, these two ensembles of dynamics (exposure as a product of demography, contamination and hydrology) are juxtaposed. The model provides a good reproduction of the colonization dynamics through time and establishes a dynamic pollution exposure risk to population that can be improved with further research results. This expected knowledge about pollution epidemiology and transportation processes and levels will allow us to implement retroactive simulations of colonization, climate variability and pollution, for instance modeling families fleeing from contaminated areas.
More globally, the model is purposely designed to be incremental, meaning that several modules can be added further, each being internally consistent, meaning that its value would be tested by comparing outputs with external data. This modularity implies the consistency of the ensemble as well, allowing a simulation of selected dynamics ceteris paribus for testing hypotheses, thereby allowing the model to function following its most valuable purposes and providing a testbed for discussion and prospective modeling. We then can envision further add-ons on for agriculture and deforestation, epidemiology and health, and finally the impacts of various policies affecting all these issues in a prospective approach.
Even more, the modeling focus is on processes, i.e., introducing data and processes only on dynamics (demography, hydrology and contamination) and not on patterns, thereby assuming the causality of phenomena, allowing us to position within the modeling methodology a confidence-building step where the simulation out- puts are compared with pattern data not used in the model, such as satellite-based land cover data. This aspect is, for now, restricted to the human choice criteria for settlement in the model, but it is the main driver of the model.
As a conclusion, we here address practical interdisciplinarity: usually, risk assessment is based on either deterministic or often qualitative methods. Both ways do not provide justification for the chosen variables in the investigation nor the combination of dynamics. We stand for the use of modeling for quantitatively assessing socio-anthropological and often qualitative variables alongside environmental variables, such as the human choice criteria for settlement. Using such a model opens up opportunities for improving this information in order to support both health and sanitary assessment planning and decision-making processes.
Each of the model components has behavior for which we do not always have timely, reliable or complete data. Such an uncertainty is in fact the purpose of building such a model, and modeling is the best alternative for either producing and/or assessing data to which we do not have access. Nevertheless, this uncertainty is not itself harmless: the results of any simulation output provide a magnitude of both the result we look for but also the sensitivity of this result to the different variables affecting it, thereby suggesting the most effective research direction. The magnitude of the result itself can then be seen as an early-warning system through a prioritization of risks through combined modeling: even at present, many assertions are provided in popular media describing the actual contamination situation in the RAE. In terms of the applicability and potential of such a model, the more practical and unbiased methodologies that are available for decision making, the more legitimate such decisions may be.
Acknowledgements
This study was funded by the French research funding agency ANR (Agence Nationale de la Recherche) and two French research institutions, the “Institut des Amériques” and “Maison des Sciences de l’Homme et de la Société de Toulouse” (USR CNRS 3414). The team received logistical support from the IRD, and we thank William Chapotat for his work and Dr. Olivier Dangles for their support.Notes
- IRD and CNRS stand for Institut de Recherche pour le Développement and Centre National de la Recherche Scientifique, that are the two most prominent scientific centers in France on environment, society and health in developing countries.
References
ABAR, S., Theodoropoulos, G., Lemarinier, P. & O’Hare, G. (2017). Agent based modelling and simulation tools: A review of the state-of-art software. Computer Science Review, 24, 13–33. [doi:10.1016/j.cosrev.2017.03.001]
AKCHURIN, M. (2015). Constructing the rights of nature: Constitutional reform, mobilization, and environmental protection in Ecuador. Law & Social Inquiry, 40(4), 937–968.
AN, L. (2012). Modeling human decisions in coupled human and natural systems: Review of agent-based models. Ecological Modelling, 229, 25–36. [doi:10.1016/j.ecolmodel.2011.07.010]
APARICIO Wilhelmi, M. (2015). Rights and indigenous peoples: objective advances, subjective weaknesses. Revista de Antrhopologia Social, 24, 127–147.
ARELLANO, P., Tansey, K., Balzter, H. & Boyd, D. S. (2015). Detecting the effects of hydrocarbon pollution in the Amazon forest using hyperspectral satellite images. Environmental Pollution, 205, 225–239. [doi:10.1016/j.envpol.2015.05.041]
ARELLANO, P., Tansey, K., Balzter, H. & Tellkamp, M. (2017). Plant family-specific impacts of petroleum pollution on biodiversity and leaf chlorophyll content in the Amazon rainforest of Ecuador. PloS ONE, 12(1), e0169867.
BALMANN, A. (1997). Farm-based modelling of regional structural change. European Review of Agricultural Economics, 25, 85–108. [doi:10.1093/erae/24.1.85]
BARBIERI, A., Mena, C., Erlien, C., Bilsborrow, R. & Torres-Navarrete, B. (2003). Settler welfare and land use in the Ecuadorian Amazon. In Open Meeting of the Human Dimensions of Global Environmental Change Research Community. Montreal, Canada.
BARTON, M., Ullah, I., Bergin, S., Mitasova, H. & Sarjoughian, H. (2012). Looking for the future in the past: Long-term change in socioecological systems. Ecological Modelling, 241, 42–53. [doi:10.1016/j.ecolmodel.2012.02.010]
BÉGUET, E. (2016). "Del monte, del campo, o del pueblo?": subsister en zone pétrolière chez les Shuar d’Amazonie équatorienne. MSc Anthropology, Université Paris 10 Nanterre La Défense, Paris, France.
BENALCAZAR, F. L. & Thurber, M. (2008). Permitting and building an oil pipeline in Lago Agrio, Ecuador. In Environment Concerns in Rights-of-Way Management 8th International Symposium, Amsterdam: Elsevier, pp. 273–276. [doi:10.1016/B978-044453223-7.50033-2]
BERGER, T. & Schreinemachers, P. (2006). Creating agents and landscapes for multiagent systems from random samples. Ecology and Society, 11(2).
BILSBORROW, R. E., Barbieri, A. F. & Pan, W. (2004). Changes in population and land use over time in the Ecuadorian Amazon. Acta Amazonica, 34(4), 635–647. [doi:10.1590/S0044-59672004000400015]
BLOSSER, M. (2016). The Struggle to Exist: Indigenous Movements and Resistance in Ecuador and Mexico during the Age of Globalization. M.A. in International Development and Service, Concordia University-Portland, Portland, USA.
BONAUDO, T., Le Pendu, Y., Faure, J. F. & Quanz, D. (2005). The effects of deforestation on wildlife along the Transamazon highway. European Journal of Wildlife Research, 51(3), 199–206. [doi:10.1007/s10344-005-0092-1]
BOUSQUET, F. & Le Page, C. (2004b). Multi-agent simulations and ecosystem management: a review. EcologicalModelling, 176(3-4), 313–332. [doi:10.1016/j.ecolmodel.2004.01.011]
BOUSQUET, F., Lifran, R., Tidball, M., Thoyer, S. & Antona, M. (2001). Agent-based modelling, game theory and natural resource management issues. Journal of Artificial Societies and Social Simulation, 4(2), 0: https://www.jasss.org/4/2/0.html.
BROMFIELD, B. (2015). What is the likelihood of being heard? An Examination of the relationship between decentralization, strength in indigenous movements, and meaningful consultation with indigenous groups in Latin America. M. Sc. Political Sciences, Georgia State University, Atlanta, USA.
BRONDÍZIO, E. S., Cak, A., Caldas, M. M., Mena, C., Bilsborrow, R., Futemma, C. T., Ludewigs, T., Moran, E. F. & Batistella, M. (2009). 'Small farmers and deforestation in Amazonia.' in M.Keller, Keller, M. Bustamante, J. Gash & P. S. Dias (Eds.), Amazonia and Global Change. Washington, D.C.: American Geophysical Union.
CHAPOTAT, W. (2016). Une modélisation multi-agents des dynamiques de front pionnier et de pollution pétrolière en Amazonie Equatorienne. M. Sc. Geography of Environment and Landscape, Université Toulouse 2 Jean Jaurès, Toulouse, France.
CLIUORD, N. J. (2007). Models in geography revisited. Geoforum, 39, 675–686.
CUESTA Soto, I. (2016). Determinación de hidrocarburos aromáticos policíclicos en aguas y sedimentos de ríos de la Amazona ecuatoriana. Magíster en EcologÃya, Universidad San Francisco de Quito, Quito, Ecuador.
DÍAZ, A. & Bolívar, N. (2005). Lacomunakichwa San Carlosy la actividadpetrolera. Master’s thesis, Quito: FLACSO Sede Ecuador.
DURANGO, J., Saqalli, M., Maurice, L., Lerigouleur, E., Maestripieri, N. & Elger, A. (2016). Heterogeneous data mining for a semi-quantitative risk assessment of oil contamination from multiple-sources in the Ecuadorian Amazon. In 8th International Congress on Environmental Modelling and Software.
EDMONDS, B. & Moss, S. (2004, July). 'From KISS to KIDS–an ‘anti-simplistic’ modelling approach.' In P. Davidsson, B. Logan & K. Takadama (Eds.), Multi-Agent and Multi-Agent-Based Simulation Joint Workshop MABS 2004, New York, NY, USA, July 19, 2004, Revised Selected Papers. Berlin/Heidelberg: Springer, pp. 130–144.
FERNANDEZ Fernandez, E. (2015). Les controverses autour de l’intérêt à agir pour l’accès au juge constitutionnel: de la défense du droit à l’environnement (Costa Rica) à la défense des droits de la nature (Équateur). VertigO-la revue électronique en sciences de l'environnement, (Hors-série 22). [doi:10.4000/vertigo.16214]
FILATOVA, T., Verburg, P. H., Parker, D. C. & Stannard, C. (2013). Spatial agent-based models for socio-ecological systems: Challenges and prospects. Environmental Modelling & Software, 45, 1-7.
FINER, M., Jenkins, C. N., Pimm, S. L., Keane, B. & Ross, C. (2008). Oil and gas projects in the western Amazon: threats to wilderness, biodiversity, and indigenous peoples. PloS ONE, 3(8), e2932. [doi:10.1371/journal.pone.0002932]
FONTAINE, G. (2006). Convergences et tensions entre ethnicité et écologisme en Amazonie. Autrepart, 2, 63–80.
GAUDOU, B., Sibertin-Blanc, C., Therond, O., Amblard, F., Auda, Y., Arcangeli, J.-P., Balestrat, M., Charron-Moirez, M.-H., Gondet, E., Hong, Y. et al. (2013). 'The MAELIA multi-agent platform for integrated analysis of interactions between agricultural land-use and low-water management strategies.' In S. J. Alam & H. Van Dyke Parunak (Eds.), Multi-Agent-Based Simulation XIV. International Workshop, MABS 2013, Saint Paul, MN, USA, May 6-7, 2013, Revised Selected Papers. Berlin/Heidelberg: Springer, pp. 85–100.
GONDARD, P. & Mazurek, H. (2001). 30 anos de reforma agraria y colonizacion en el ecuador (1964-1994): di- namicas espaciales. In P. Gondard & V. Leon (Eds.), Dinamicas Territoriales: Ecuador, Bolivia, Peru, Venezuela, Estudios de Geografia, Vol. 10, (pp. 15–40). Colegio de Gebgrafos del Ecuador, CGE ; Corporacidn Editora Nacional, CEN ; Institut de Recherche pour le Developpement, IRD ; Pontificia Universidad Catdlica del Ecuador, PUCE I Quito.
GRAY, C. L. & Bilsborrow, R. E. (2014). Consequences of out-migration for land use in rural Ecuador. Land Use Policy, 36, 182–191. [doi:10.1016/j.landusepol.2013.07.006]
GRIMM, V., Berger, U., DeAngelis, D. L., Polhill, J. G., Giske, J. & Railsback, S. F. (2010). The ODD protocol: a review and first update. Ecological modelling, 221(23), 2760–2768.
HENTSCHEL, J., Lanjouw, J. O., Lanjouw, P. & Poggi, J. (2000). Combining census and survey data to trace the spatial dimensions of poverty: A case study of Ecuador. The World Bank Economic Review, 14(1), 147–165. [doi:10.1093/wber/14.1.147]
HIJMANS, R., Cameron, S., Parra, J., Jones, P. & Jarvis, A. (2005). Very high resolution interpolated climate surfaces for global land areas. International Journal of Climatology, 25(15), 1965–1978.
HOLLAND, M. B., De Koning, F., Morales, M., Naughton-Treves, L., Robinson, B. E. & Suárez, L. (2014). Complex tenure and deforestation: implications for conservation incentives in the ecuadorian Amazon. World Development, 55, 21–36. [doi:10.1016/j.worlddev.2013.01.012]
HOUSSOU, N. (2016). Simulation sociale à base d’agents du comportement microéconomiques des ménages en Amazonie équatorienne, face aux contaminations pétrolières, aux dynamiques économiques et aux politiques publiques. M.Sc Informatique, Université nationale du Vietnam, Institut francophone international, Hanoi, Vietnam.
HURTIG, A. K., Sebastián, M. S., Soto, A., Shingre, A., Zambrano, D. & Guerrero, W. (2003). Pesticide use among farmers in the Amazon basin of Ecuador. Archives of Environmental Health: An International Journal, 58(4), 223–228. [doi:10.3200/AEOH.58.4.223-228]
IRWIN, E. & Geoghegan, J. (2001). Theory, data, methods: developing spatially explicit economic models of land use change. Agriculture, Ecosystems & Environment, 85(1-3), 7-24.
JANSSEN, M. A. & Ostrom, E. (2006). Empirically based, agent-based models. Ecology and Society, 11(2), 24-37. [doi:10.5751/ES-01861-110237]
JUTEAU-MARTINEAU, G., Becerra, S. & Maurice, L. (2014). Ambiente, petróleo y vulnerabilidad política en el oriente ecuatoriano:¿ hacia nuevas formas de gobernanza energética? América Latina Hoy, 67.
KAPLAN, J. E., Larrick, J. W., Yost, J., Farrell, L., Greenberg, H. B., Herrmann, K. L., Sulzer, A. J., Walls, K. W. & Pederson, L. (1980). Infectious disease patterns in the waorani, an isolated amerindian population. The American Journal of Tropical Medicine and Hygiene, 29(2), 298–312. [doi:10.4269/ajtmh.1980.29.298]
KIMERLING, J. (1990). Disregarding environmental law: Petroleum development in protected natural areas and indigenous homelands in the Ecuadorian Amazon. Hastings International and Comparative Law Review, 14, 849-904.
KIMERLING, J. (2005). Indigenous peoples and the oil frontier in Amazonia: The case of Ecuador, Chevrontexaco, and Aguinda v. Texaco. New York University Journal of International Law and Politics, 38, 413-474.
KIMERLING, J. (2015). Habitat as human rights: Indigenous Huaorani in the Amazon rainforest, oil, and Ome Yasuni. Vermont Law Review, 40, 445.
KUANG-YAO Pan, W., Erlien, C. & Bilsborrow, R. (2010). Morbidity and mortality disparities among colonist and indigenous populations in the Ecuadorian Amazon. Social Science & Medicine, 70, 401–411. [doi:10.1016/j.socscimed.2009.09.021]
LAMBIN, E. F., Rounsevell, M. D. & Geist, H. (2000). Are agricultural land-use models able to predict changes in land-use intensity?. Agriculture, Ecosystems & Environment, 82(1-3), 321-331.
LARREA, C. & Warnars, L. (2009). Ecuador’s Yasuni-ITT Initiative: Avoiding emissions by keeping petroleum underground. Energy for Sustainable Development, 13(3), 219–223. [doi:10.1016/j.esd.2009.08.003]
LARRICK, J. W., Yost, J. A., Kaplan, J., King, G. & Mayhall, J. (1979). Part one: Patterns of health and disease among the waorani indians of eastern Ecuador. Medical Anthropology, 3(2), 147–189. LU, F., Gray, C., Bilsborrow, R. E., Mena, C. F., Erlien, C. M., Bremner, J., A., B. & S.J., W. (2010). Contrasting colonist and indigenous impacts on Amazonian forests. Conservation Biology, 36(3), 881–885.
LU, F., Valdivia, G. & Silva, N. L. (2017). 'The habits of oil rule.' In F. Lu, G. Valdivia & N. L. Silva (Eds.), Oil, Revolution, and Indigenous Citizenship in Ecuadorian Amazonia, New York, NY: Palgrave Macmillan, pp. 69–99. [doi:10.1057/978-1-137-53362-3_3]
LU, F. E. & Silva, N. L. (2015). Imagined Borders:(Un) Bounded Spaces of Oil Extraction and Indigenous Sociality in "Post-Neoliberal" Ecuador. Social Sciences, 4(2), 434–458.
MAESTRIPIERI, N. & Saqalli, M. (2016). Assessing health risk using regional mappings based on local perceptions: A comparative study of three different hazards. Human and Ecological Risk Assessment: An International Journal, 22(3), 721–735. [doi:10.1080/10807039.2015.1105099]
MALANSON, G. P., Wang, Q. & Kupfer, J. A. (2007). Ecological processes and spatial patterns before, during and after simulated deforestation. Ecological Modelling, 202(3-4), 397–409.
MARIETTO, M. B., David, N., Sichman, J. S., & Coelho, H. (2002, July). Requirements analysis of agent-based simulation platforms: state of the art and new prospects. In International Workshop on Multi-Agent Systems and Agent-Based Simulation(pp. 125-141). Springer, Berlin, Heidelberg.
MARTÍNEZ, M. O., Napolitano, D. A., MacLennan, G. J., OâĂŹCallaghan, C., Ciborowski, S. & Fabregas, X. (2007). Impacts of petroleum activities for the Achuar people of the Peruvian Amazon: summary of existing evidence and research gaps. Environmental Research Letters, 2(4), 045006.
MATTHEWS, R., Gilbert, N., Roach, A. & Polhill, G. N. M., Gary J. (2007). Agent-based land-use models: a review of applications. Landscape Ecology, 22(10), 1447-1459. [doi:10.1007/s10980-007-9135-1]
MENA, C. F. (2008). Trajectories of land-use and land-cover in the Northern Ecuadorian Amazon. Photogrammetric Engineering & Remote Sensing, 74(6), 737–751.
MENA, C. F., Barbieri, A. F., Walsh, S. J., Erlien, C. M., Holt, F. L. & Bilsborrow, R. E. (2006a). Pressure on the Cuyabeno Wildlife Reserve: development and land use/cover change in the Northern Ecuadorian Amazon. World Development, 34(10), 1831–1849. [doi:10.1016/j.worlddev.2006.02.009]
MENA, C. F., Bilsborrow, R. E. & McClain, M. E. (2006b). Socioeconomic drivers of deforestation in the Northern Ecuadorian Amazon. Environmental Management, 37(6), 802–815.
MENA CF, F. B. X. Y. M. G., Walsh SJ (2011). Land use change on household farms in the Ecuadorian Amazon: Design and implementation of an agent-based model. Applied Geography, 31, 210–222. [doi:10.1016/j.apgeog.2010.04.005]
MESSINA, J. & Walsh, S. (2005). Dynamic spatial simulation modeling of the population? environment matrix in the Ecuadorian Amazon. Environment and Planning B: Planning and Design, 32(6), 835–856.
MESSINA, J., Walsh, S., Mena, C. & Delamater, P. (2006). Land tenure and deforestation patterns in the Ecuadorian Amazon: Conflicts in land conservation in frontier settings. Applied Geography, 26, 113–128. Messina, J. P. & Cochrane, M. A. (2007). The forests are bleeding: How land use change is creating a new fire regime in the Ecuadorian Amazon. Journal of Latin American Geography, 85–100. [doi:10.1353/lag.2007.0007]
MESSINA, J. P. & Walsh, S. J. (2001). Morphogenesis: modeling landuse and landcover dynamics in the Ecuadorian Amazon. Plant Ecology, 156(1), 75–88.
MITCHELL, M. (2009). Complexity: A Guided Tour. Oxford: Oxford University Press.
MORIN, L. (2015). Diagnostic agraire d’un front pionnier en Amazonie équatorienne, Paroisse de Dayuma, province d’Orellana, Equateur. MSc Agriculture and Agronomy, SupAgro Montpellier IRC, Montpellier, France.
MORIN, L. & Saqalli, M. (2018). Una historia agraria al amparo del petróleo: el caso de la parroquia de Dayuma. Huellas del Sumaco, Revista de la Universidad Estatal de Puyo.
MURPHY, L., Bilsborrow, R. & Pichón, F. (1997). Poverty and prosperity among migrant settlers in the Amazon rainforest frontier of Ecuador. The Journal of Development Studies, 34(2), 35–65.
NARANJO Chiriboga, M. P. (2004). Costos del abandono de la dolarización en Ecuador. Revistade Ciencias Sociales, FLACSO-Ecuador, 19. Naranjo Chiriboga, M. P. (2004). Costos del abandono de la dolarización en Ecuador. Iconos. Revista de Ciencias Sociales, (19).
OSTROM, E. (2009). A general framework for analyzing sustainability of social-ecological systems. Science, 325(5939), 419–422.
PAN, W. K. & Bilsborrow, R. E. (2005). The use of a multilevel statistical model to analyze factors influencing land use: A study of the Ecuadorian Amazon. Global and Planetary Change, 47(2-4), 232–252. [doi:10.1016/j.gloplacha.2004.10.014]
PAN, W. K., Walsh, S. J., Bilsborrow, R. E., Frizzelle, B. G., Erlien, C. M. & Baquero, F. (2004). Farm-level models of spatial patterns of land use and land cover dynamics in the Ecuadorian Amazon. Agriculture, Ecosystems & Environment, 101(2-3), 117–134.
PAN, W. K.-Y., Erlien, C. & Bilsborrow, R. E. (2010). Morbidity and mortality disparities among colonist and indigenous populations in the Ecuadorian Amazon. Social Science & Medicine, 70(3), 401–411. [doi:10.1016/j.socscimed.2009.09.021]
PARROTT, L. (2011). Hybrid modelling of complex ecological systems for decision support: Recent successes and future perspectives. Ecological Informatics, 6(1), 44–49.
PELÁEZ, J. I., Vaccaro, G., Yanez, E. R. & Saqalli, M. (2017). Un sistemas para detección de contaminación por hidrocarburos: Aplicación al oriente ecuatoriano. Revista Iberoamericana de Sistemas, Cibernética e Informáática: RISCI, special issue CISCI conference, (pp. 180–185).
PERREAULT, T. (2003). Changing places: transnational networks, ethnic politics, and community development in the Ecuadorian Amazon. Political Geography, 22(1), 61–88.
PICHÓN, F. J. (1997a). Colonist land-allocation decisions, land use, and deforestation in the Ecuadorian Amazon frontier. Economic Development and Cultural Change, 45(4), 707–744. [doi:10.1086/452305]
PICHÓN, F. J. (1997b). Settler households and land-use patterns in the Amazon frontier: farm-level evidence from Ecuador. World Development, 25(1), 67–91.
POLHILL, G. J., Sutherland, L. & Gotts, N. M. (2010). Using qualitative evidence to enhance an agent-based modelling system for studying land use change. Journal of Artificial Societies and Social Simulation, 13(2), 10: https://www.jasss.org/13/2/10.html. [doi:10.18564/jasss.1563]
PURNOMO, H. & Vanclay, J. (2003). Multi-agent Simulation of Alternative Scenarios of Collaborative Forest Management. Small-scale Forest Economics, Management and Policy, 2, 277–292.
REQUELME, M. R., Ramos, J., Angélica, R. & Brabo, E. (2003). Assessment of hg-contamination in soils and stream sediments in the mineral district of Nambija, Ecuadorian Amazon (example of an impacted area affected by artisanal gold mining). Applied Geochemistry, 18(3), 371–381. [doi:10.1016/S0883-2927(02)00088-4]
ROUCHIER, J. & Requier-Desjardins, M. (2000). La modélisation comme soutien à l’interdisciplinarité en recherche-développement. Une application au pastoralisme soudano-sahélien-Communication à colloque. Natures Sciences Sociétés, 8(3), 61-67. [doi:10.1016/S1240-1307(00)80063-1]
SAN SEBASTIÁN, M. & Hurtig, A.K. (2004). Oil exploitation and health in the Amazon basin of Ecuador. Department of Public Health and Clinical Medicine, Umeå University, Umeå.
SAQUALLI, M., Bielders, C. L., Defourny, P. & GÃľrard, B. (2010). Simulating rural environmentally and socio- economically constrained multi-activity and multi-decision societies in a low-data context: a challenge through empirical agent-based modeling. Journal of Artificial Societies and Social Simulation, 13(2), 1: https://www.jasss.org/13/2/1.html. [doi:10.18564/jasss.1547]
SARRIA-VILLA, R., Ocampo-Duque, W., Páez, M. & Schuhmacher, M. (2016). Presence of PAHs in water and sediments of the Colombian Cauca River during heavy rain episodes, and implications for risk assessment. Science of the Total Environment, 540, 455–564. [doi:10.1016/j.scitotenv.2015.07.020]
SCHULZE, J., Müller, B., Groeneveld, J., & Grimm, V. (2017). Agent-based modelling of social-ecological systems: achievements, challenges, and a way forward. Journal of Artificial Societies and Social Simulation, 20(2m 8): https://www.jasss.org/20/2/8.html. [doi:10.18564/jasss.3423]
SCHUTTE, S. (2010). Optimization and falsification in empirical agent-based models. Journal of Artificial Societies and Social Simulation, 13(1), 2: https://www.jasss.org/13/1/2.html. [doi:10.18564/jasss.1503]
SIGAL, M. (2016). Socioeconomic Effects of Oil Drilling: The Case of Ecuador. M. Sc. Economics, Yale University, New Haven, USA.
SIRÉN, A., Hambäck, P., & Machoa, J. (2004). Including spatial heterogeneity and animal dispersal when evaluating hunting: a model analysis and an empirical assessment in an Amazonian community. Conservation Biology, 18(5), 1315-1329. [doi:10.1111/j.1523-1739.2004.00024.x]
SMAJGL, A. (2007). Modelling evolving rules for the use of common-pool resources in an agent-based model. Interdisciplinary Description of Complex Systems: INDECS, 5(2), 56-80.
STOLLE, F., Chomitz, K. M., Lambin, E. F., & Tomich, T. P. (2003). Land use and vegetation fires in Jambi Province, Sumatra, Indonesia. Forest Ecology and Management, 179(1-3), 277-292. [doi:10.1016/S0378-1127(02)00547-9]
STRAHLER, A. (1957). Quantitative analysis of watershed geomorphology. Eos, Transactions American Geophysical Union, 38(6), 913-920. [doi:10.1029/TR038i006p00913]
TAILLANDIER, P., Grignard, A., Gaudou, B. & Drogoul, A. (2014). From geographical data to agent-based simulation: application of the gama platform. Cybergeo: European Journal of Geography, 671.
THAPA, K. K., Bilsborrow, R. E. & Murphy, L. (1996). Deforestation, land use, and women’s agricultural activities in the Ecuadorian Amazon. World Development, 24(8), 1317–1332. [doi:10.1016/0305-750X(96)00041-1]
TREUIL, J.-P., Drogoul, A. & Zucker, J.-D. (2008). Modélisation et simulation à base d’agents: exemples commentés, outils informatiques et questions théoriques. Dunod.
TRUUIN, B. (2006). Droits autochtones amazoniens et droit ouiciel équatorien: une opposition culturelle?. le cas des runa et des shiwiars. Civilisations. Revue internationale d’anthropologie et de sciences humaines, 55, 143–162.
VAN Vliet, N., Milner-Gulland, E., Bousquet, F., Saqalli, M. & Nasi, R. (2010). Effect of small-scale heterogeneity of prey and hunter distributions on the sustainability of bushmeat hunting. Conservation Biology, 24(5), 1327– 1337. [doi:10.1111/j.1523-1739.2010.01484.x]
VERBURG, P. H., Overmars, K. P., Huigen, M. G., de Groot, W. T. & Veldkamp, A. (2006). Analysis of the effects of land use change on protected areas in the Philippines. Applied Geography, 26(2), 153–173. [doi:10.1016/j.apgeog.2005.11.005]
WAINWRIGHT, J. (2008). Can modelling enable us to understand the rôle of humans in landscape evolution?. Geoforum, 39(2), 659-674. [doi:10.1016/j.geoforum.2006.09.011]
WALSH, S., Mena, C., DeHart, J. & Frizzelle, B. (2009). Stylized environments and abms: educational tools for examining the causes and consequences of land use/land cover change. Geocarto International, 24, 423–435. [doi:10.1080/10106040902737020]
WALSH, S., Messina, J., C.F., M., G.P., M. & P.H., P. (2008). Complexity theory, spatial simulation models, and land use dynamics in the Northern Ecuadorian Amazon. Geoforum, 39, 867–878. [doi:10.1016/j.geoforum.2007.02.011]
ZHANG, Z., Teng, Y., Guo, G., Li, F. & Zhang, C. (2016). Risk assessment of BTEX in the groundwater of Songyuan region of Songhua River in China. Water Science and Technology: Water Supply, 16(1), 135–143. [doi:10.2166/ws.2015.120]