
Introduction: Challenges of Energy Security
The complexity of energy systems poses challenges to decision making in the electricity sector on the future energy-mix. Tackling these challenges requires the evaluation of possible energy systems and involves relevant stakeholders, while considering the influence of decisions in other sectors. Moreover, local spatial conditions play an important role in site selection of new power plants as well as in the comparative assessment of potential technologies to be installed at a certain location. Current international concern for sustainable development to alleviate climate change puts a large burden on decision makers for the right planning of future electricity supply systems. For these reasons, actors in the electricity sector are concerned with the trilemma of ensuring access to affordable, reliable and sustainable energy, fostering the objectives of Sustainable Energy for All initiative (United Nations 2016).
During the last seven years, Egypt has experienced frequent electricity blackouts due to rising demand, natural gas supply shortages, aging infrastructure and inadequate generation and transmission capacity. According to the United States Energy Information Administration (US EIA), Egypt's generating capacity was 31.45 gigawatts (GW) in May 2015, which is slightly higher than the expected peak demand in 2015 of 30 GW. About 70% of Egypt-s electricity is fueled by natural gas, 19% by petroleum and 11% by renewable energy, which is mostly hydroelectricity (9%) (US EIA 2015; EEHC 2014). Additionally, political instability, unclear policy and regulation hinder investments of the private sector in this field. Thus, there should be a short, medium and long term planning on how to resolve this issue and to secure the future supply of electricity.
Exploring the literature, we found that different methodologies have been applied to evaluate complex energy systems from different perspectives. Some studies have investigated sustainability in general terms without specifying any methodology. Additionally, they have assessed the impact of energy systems on the sustainability of the surrounding community emphasizing the correlation between renewable energy technologies and sustainability (see Terrapon2014; Stambouli et al. 2012; del Río and Burguillo 2009; Tsai 2010; Liu 2014; Singh et al. 2009 and Ness et al. 2007).
Another prominent methodology is multi-criteria decision analysis (MCDA) (see Pohekar and Ramachandran 2004; Wang et al. 2009; Abu-Taha & Daim 2013; Doukas et al. 2012; Troldborg et al. 2014; Evans et al. 2009 and Demirtas 2013). Further studies have applied agent-based modeling (ABM) to investigate electricity markets (see Möst et al. 2008; Sousa et al. 2013; Babic and Podobnik 2016; Guerci et al. 2010; Macal et al. 2014; Zhou et al. 2007; North et al. 2002 and Rastegar et al. 2009). These explain the interaction between end-users and electricity suppliers and how this influences the electricity prices of different technologies, which is not applicable to our case study since the energy sector is entirely moderated by the government.
Allen and Varga (2014) investigated the changing geographical distribution of electrical generation capacity in the UK till 2050, using a relatively simple spatial, dynamic agent-based model. Their objective was to identify the energy-mix that copes with reducing carbon emissions to 20% of their 1990 value by 2050 in the UK. Bale et al. (2015) reviewed the application and importance of complexity science methods like ABM in understanding the energy transition. The application of these methods which recognize the complexity of energy systems in relation to social, technological, economic and environmental sustainability aspects facilitates transition to sustainable energy systems providing secure, affordable and low-carbon energy services. These complex energy systems consist of many stakeholders, interacting through networks, leading to emergent properties and adaptive learning processes. Bale et al. (2015) support the idea of our study of applying ABM in energy transition planning in combination with sustainability. Moreover, Rai and Henry (2016) shed the light on the use of agent-based modeling to consumer energy choices, with an emphasis on identifying specific ways in which ABM can improve understanding of both basic scientific and applied aspects of the demand side of energy to aid the design of better policies and programs. However, we have introduced a novel model combining multi-criteria decision analysis (MCDA) with agent-based modeling (ABM) and Geographic Information Systems (GIS) visualization to integrate the interactions of the decisions of multiple agents, the multi-criteria evaluation of sustainability, the time factor and site factors to assess the transformation of the energy landscape.
Research Framework
The paper aims to answer the research question: Which future electricity-mix scenario could secure a sustainable electricity supply in Egypt up to 2100, and is the most suitable for stakeholder criteria and local conditions? In order to answer this question, we investigated the conditions, scenarios and strategies for future energy planning in Egypt, with an emphasis on alternative energy pathways and a sustainable electricity supply mix as part of an energy roadmap until 2100. Different electricity supply technologies are investigated and compared with multiple assessment criteria and multiple agents to achieve a comprehensive sustainability assessment covering technical, social, economic and environmental aspects of these technologies.
The paper is guided by the underlying hypothesis that a comprehensive sustainability assessment supports transformation from the fossil-based energy system in Egypt towards alternatives, developing the enormous renewable energy potentials of North Africa. Starting from an understanding of the obstacles and lock-in effects of the current energy situation, the research aims to go beyond technical and economic fixes of established structures, towards expanding the range of criteria and agents reflecting sustainable development. Scenario-based modeling represents the shifting priorities of agents who shape the evolving energy landscape in Egypt (Shaaban 2017).
This study expands upon an agent-based modeling framework describing the interaction of values and investments of multiple agents (see BenDor and Scheffran 2018; Scheffran and Hannon 2007; Scheffran 2008, 2013; Scheffran and BenDor 2009; Eisenack et al. 2007). We used the open source ABM software “NetLogo” to explicitly represent spatial agents across space and time as they decide on different energy pathways. We considered environmental factors that vary across the landscape and create non-uniform environments for each energy type. We selected seven principal technologies based on their potential capacity in Egypt and the government’s intention to employ them in the future. These technologies are coal-fired power plants, natural gas-fired power plants, wind, concentrated solar power (CSP), photovoltaics (PV), biomass and nuclear power plants. We did not include oil-fired power plants as oil use is only used in Egypt in co-firing steam power plants that are mainly fueled by natural gas. Moreover, we excluded hydropower as the resource potential is already totally exploited.
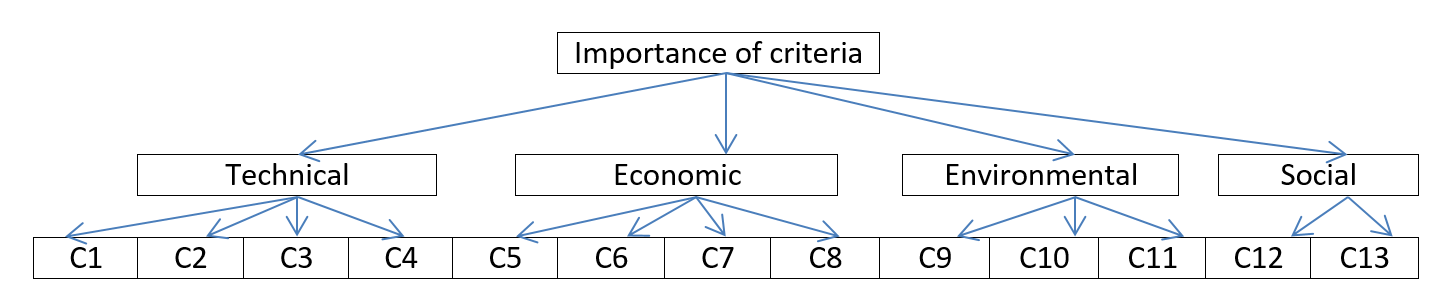
There are numerous criteria that have been used to assess sustainable development of energy systems. However, too many indicators are not helpful for sustainable energy decision-making. Indicators should cover relevant dimensions of sustainability which are not repetitive and overlapping (Liu 2014), such as fuel costs in operation and maintenance costs, job creation and social benefits of energy projects (Wang et al. 2009). Selection requires a compromise between simplification and complication (Singh et al. 2009). Some selection methodologies have been proposed by Singh et al. (2009) and Wang et al. (2009). We selected 13 criteria as shown in Table 1 for the sustainability assessment of the technologies according to the approach applied in Shaaban & Scheffran (2017).
| Category | Criteria | Category | Criteria |
| Economic | Investment cost | Technical | Efficiency of energy generation |
| Job creation | Resource Potential | ||
| Cost of electricity | Reliability of energy supply | ||
| Operation and maintenance cost | Water consumption | ||
| Environmental | CO2 emission | Social | Safety risks |
| NOx emission | Social acceptability | ||
| SO2 emission |
Methodology
The multi-criteria decision analysis
The multi-criteria decision analysis MCDA is a decision-making approach to evaluate the sustainability of a system in an integrated form (Wang et al. 2009) by representing and operationalizing the decision-making of actors in a system (Knoeri et al. 2011). It addresses complex problems while considering the evolving bio-physical and socio-economic systems. It has been widely applied in various fields such as social, economic, agricultural, industrial, ecological and biological systems. Moreover, it currently plays an important role in energy systems planning, especially since concern for environmental protection has increased. The theory is based on comparing different alternatives by identifying a set of evaluation criteria applicable to all these alternatives. The values of these criteria are then normalized, and their weights are determined according to the relative importance of the criteria. The main objective of MCDA is to integrate the weights and normalized values of the criteria so that each alternative is associated with an integrated value that reflects its ranking (Wang et al. 2009). In this research we employed two MCDA approaches in the sustainability assessment of the technologies: the analytical hierarchy process (AHP) and the weighted sum method (WSM).
The analytical hierarchy process (AHP) was proposed primarily by Saaty (1980). It is based on the decomposition of a complex problem into a hierarchy with an objective at the top of the hierarchy, indicators and sub-indicators at levels and sub-levels of the hierarchy and decision alternatives at the bottom of the hierarchy as shown in Figure 1 (Pohekar and Ramachandran 2004). Here, we evaluate the weights of the indicators in a pair-wise comparison using the scoring system presented in Table 2. The scoring is based on the relative importance of the indicators with the aim of energy technology selection according to the perspectives of stakeholders in a questionnaire that we designed and distributed to them (see Appendix ).
| Scale | Degree of preference | Scale | Degree of preference |
| 1 | Equal importance | 7 | Very strong |
| 3 | Weak | 9 | Extreme importance |
| 5 | Strong | 2, 4, 6, 8 | Intermediate values |
The weighted sum method (WSM) is the most commonly used approach in sustainable energy systems (Wang et al. 2009) that satisfies the following expression:
| $$A_i = \sum_{j = 1}^n (a_{ij} w_{j}) \text{, for } i = 1, 2, 3, \dots, m $$ | (1) |
GIS-based spatial data analysis
Another part of the model is to evaluate the influence of certain important external factors that represent local conditions on the selection of an energy pathway. These factors are more site-specific than being dependent on a technology type, with a few exceptions. They play an important role in location ranking for the installation of technologies.
To prepare the Egyptian spatial framework, we selected six spatial factors: population density, primary roads availability, water availability, electric grid availability, political stability and the negative impact potential on crops. Additionally, we evaluated the spatial resource potential for each of the seven technologies. We built these data sets as layers of vector data on the political boundary layer of the Egyptian base map obtained from the Russian GIS-lab website (GIS-Lab 2014), using ArcGIS v.10.3.1. We then converted it to raster data layers at a resolution of 0.01745 degree (cell size = 0.02) using the open source SAGA GIS v. 2.1.4 (Conrad et al. 2015). For some spatial factors, we divided the map into zones with similar features related to the analyzed factor. We gave a score to each zone based on an ordinal scale between 0 and 10. For other factors, such as the resource potential of wind and solar energy, we built the spatial data based on a reference map e.g., the wind and solar atlas, respectively.
We applied the AHP methodology in obtaining the weight of these factors for each technology. We also applied the WSM to obtain an integrated value for each site location so that they could be ranked. The detailed explanation of the spatial data analysis can be found in Shaaban (2017).
It is important to mention that for almost all types of technologies, the required area for installation is not a major problem in Egypt, where the total land use requirement by CSP technology is 10 acres/MW (\(\approx\)0.04 km2/MW) (Ong et al. 2013). Thus, one percent (1/100) of the total surface area of Egypt (\(\approx\)10,000 km2) is enough for the installation of 250 GW from CSP type power plants which is the most land-consuming technology. Additionally, a very limited area along the Nile Valley and the delta was also exploited. Thus, a high degree of accuracy of spatial data was not necessary in our investigation. Moreover, these spatial factors were not the only ones that should be considered in energy system planning. There are still other factors that play also important roles in this process but we just use some of them to build up our basic model. The next step is to include the agent-based model reflecting the temporal dynamics of the decision making process based on cost-benefit analysis.
Agent-based modeling (ABM)
Agent-based simulation has become increasingly popular as a modeling approach in the social sciences. This is because it allows building models where individual entities and their interactions are directly represented. In comparison with variable-based approaches using structural equations, or system-based approaches using differential equations, agent-based simulation is a bottom-up modeling approach. This offers the possibility of modeling individual heterogeneity, representing explicit agent decision rules, and situating agents in a geographical or another type of space. It allows modelers to naturally represent multiple scales of analysis, the emergence of structures at the macro or societal level from individual action and various kinds of adaptation and learning, none of which is easy to do with other modeling approaches (Billari et al. 2006; Gilbert 2008).
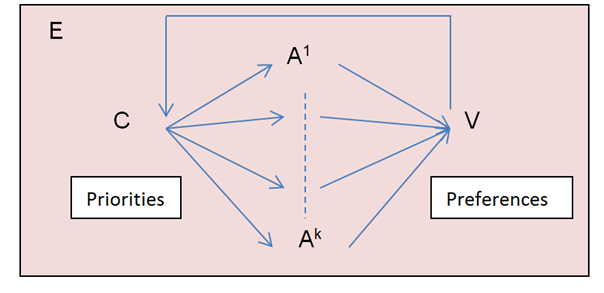
An agent is a discrete and autonomous entity with its own goals and behavior, with a capability to adapt and modify this behavior. An ABM consists of a set of agents, their relationships, rules of behavior and a framework for simulating agent behaviors and interactions. Unlike other approaches, ABM begins and ends with the agent’s perspective (Macal and North 2006) making it particularly suitable to apply agent choices and investment to energy pathways. In our model, the ABM is built on agents who act by adjusting their priorities (p) for action pathways (A) in response to the change in marginal values of pathways as a function of costs (C) and value preferences (V), as well as environmental conditions (E) that change in space and time as shown in Figure 2 (for a description of the VCX model framework, see Scheffran and Hannon 2007; BenDor & Scheffran 2018).
We modified and expanded this ABM approach by including value functions based on the MCDA assessment models as well as expert evaluations and projected future electricity demand to compare different energy pathways used in electricity mix scenarios and sustainability of land use. The multi-criteria assessment is applied to classify typical agents characterized by weighted priorities for certain criteria sets. These types of agents are then used in models where they follow these priorities to select energy pathways that meet these criteria. Agent decision-rules are applied to a GIS-based spatial (cellular) model landscape, taking into account spatially specific environmental and socio-economic conditions.
The dynamics of changing action priorities for energy pathways describes agents that iteratively shift their action pathways towards large marginal value preferences. This is achieved by comparing the marginal value of one pathway with the weighted average marginal value including all pathways. This is given by the following evolutionary equations of shifting priorities for action pathway \(k\) of actor type \(q\) in spatial cell (agent) \(i\):
| $$\frac{\Delta p^k_{iq}}{\Delta t} = \alpha_{iq} p^k_{iq} \Bigl( v^k_{iq} - \sum_l p^l_{iq} v^l_{iq} \Bigr) $$ | (2) |
- \(\frac{\Delta p^k_{iq}}{\Delta t}\) is the change in action priority \(p\) of actor \(q\) for energy pathway \(k\) in spatial cell \(i\) for time period \(\Delta t\) which is one year in our case.
- \(\alpha_{iq}\) is the adaptation rate of actor \(q\) in spatial cell \(i\) (in this study we apply the same adaptation rate for all pathways).
- \(\sum_l p^l_{iq} v^l_{iq}\) is the sum of weighted marginal values (average) including all energy pathways \(l\).
- \(v^k_{iq}\) is the marginal value of energy pathway \(k\) for actor \(q\) in spatial cell \(i\) which is a function of the normalized values, the weight of the spatial factors and the assessment indicators
$$v^k_{iq} = \frac{ \Biggl( \frac{\bigl( \sum^o_{m=1} s^k_{mi} \times h_m \bigr)}{\sum^z_{i=1} \bigl( \sum^o_{m=1} s^k_{mi} \times h_m \bigr)} \Biggr) \times \Bigl( \sum^n_{j=1} a(t)_{kj} \times w_{jq} \Bigr) }{\sum^l_{k=1} \Biggl[ \Biggl( \frac{\bigl( \sum^o_{m=1} s^k_{mi} \times h_m \bigr)}{\sum^z_{i=1} \bigl( \sum^o_{m=1} s^k_{mi} \times h_m \bigr)} \Biggr) \times \Bigl( \sum^n_{j=1} a(t)_{kj} \times w_{jq} \Bigr) \Biggr]}$$ (3) - \(s_{mi}^k\) is the normalized value of spatial factor \(m\) influencing spatial cell \(i\) which is for some factors specific to energy pathway \(k\) as in case of the resource potential, where \(z\) is the number of spatial agents.
- \(h_m\) is the weight of the spatial factor \(m\), where \(o\) is the number of spatial factors.
- \(a(t)_{kj}\) is the normalized value of the assessment indicator \(j\) for energy pathway \(k\) which is for some indicators a function of time.
- \(w_{jq}\) is the weight of the assessment indicator \(j\) of actor \(q\), where \(n\) is the number of the assessment indicators.
In this model, the marginal values which drive the change of priority for different energy pathways take multiple criteria and weights of several actors for local spatial conditions into consideration (Equation 3). In reality, the actors interact in response to decisions taken by others in their respective spatial cells since these decisions affect the marginal value of action pathways. This type of interactive simulation between multiple actors, reflects game theoretical and collective decision-making principles, discussed in more detail in Shaaban (2017). These agents could be customers or suppliers, directly affected by the action pathways, or they could be supporters or opponents indirectly affected.
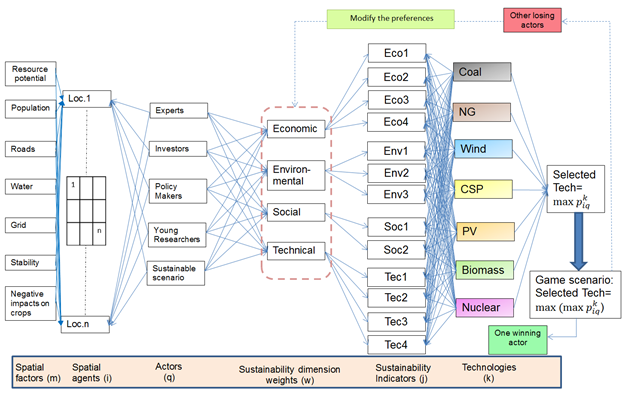
In this paper, we are concerned with the interaction between four categories of agents, i.e., actors, who represent energy planners selecting among energy system technologies that could supply the growing electricity demands. In one of the investigated scenarios, which we called the game scenario, each of these four types of agents (experts, policy-makers, investors and young-researchers) together with the sustainable scenario rank the technologies in each spatial location, and the winning agent is the one with maximum priority technology after its marginal value preference. The other agents could thereafter modify their evaluation preferences to achieve the maximum priority technology in future time steps. Figure 3 shows a schematic diagram summarizing the principle of integrating the three methodologies in assessment and selection of technologies. The identification of the best location for each technology is based on the ranking of patches for each technology according to the integrated spatial factors, conducted using the multi-criteria approach: the weighted sum method.
We assume that we have virtual representatives of each of the four tested agents distributed across the map of Egypt, which has been divided into cells or patches of equal size, here called spatial agents or decision-makers (DM). The number of these patches depends on the analysis resolution. In each patch, there is an independent representative of each actor type, who can select one technology with the highest priority, to be installed on this patch or to identify the preferred energy-mix in the spatial cell. The decision making process is based on local conditions in each patch caused by spatial factors as well as the multi-criteria sustainability analysis of the technology. These two factors build the marginal value \(v^k_{iq}\) of each technology by which actors change their initial priority. Thus, in every patch, each actor should rank the technologies and identify the technology with maximum priority. This reflects the most preferred technology to be installed on this specific patch by this actor at a specific time step or year. It could be interpreted in another way, where it shows the allocated investment in the energy-mix by one actor at one patch at a specific time step. Going back to our main objective, where we investigate a national energy-mix planning across the whole country, we took the average priorities of each technology of all spatial agents (i.e., the virtual representative) of each actor achieving the overall priorities of the technologies over time. These investment priorities are allocated on the future upcoming energy demand.
We investigate several possible scenarios, which are basically classified according to agent type. We therefore tested four agent types: experts, investors, policy-makers and young-researchers. Each of these types are compared to the sustainable scenario, which has equal weight of sustainability dimensions and is also compared to the game scenario. The game scenario reflects the interaction between the four actual actors and the sustainable scenario. For each of these agent-based scenarios, we analyzed the change in average priorities of each assessed technologies over the whole country, the map visualization of the predominating highest priority technology across the spatial DM, and the winning technology type in the game scenario across the spatial DM. All analysis could be performed at different adaptation rates (alpha) although here, we show only results at \(\alpha = 1\).
Preparation of data
Some selected indicators in Table 1 represent, on one hand costs that stakeholders seek to avoid, or to minimize as in the case of investment costs. On the other hand, the other indicators represent values that are favored by stakeholders, for example plant efficiency. Some indicators are directly proportional to sustainability, while others are inversely proportional to sustainability. Basically, the integration of values of multiple criteria requires a standardization of the measurement scale. Some studies prefer to use the evaluation of the criteria in monetary terms, which greatly influence the decision making process, as most decisions are built on economic evaluation. Here, we apply the Min-Max scaling standardization method (Patro and Sahu 2015). The formulas are shown below:
| $$\frac{\bigl( v - (0.9 \times v_{\min}) \bigr)}{\bigl( v_{\max} - (0.9 \times v_{\min}) \bigr)} $$ | (4) |
| $$\frac{\bigl( (1.1 \times v_{\max}) - v \bigr)}{\bigl( (1.1 \times v_{\max}) - v_{\min} \bigr)} $$ | (5) |
The first formula is used when the indicator represents a positive value (i.e., the higher the value, the more sustainable), whereas the second formula is used when the indicator represents a negative value or cost (i.e., the lower the value, the more sustainable), so that ultimately we get a value between 0 and 1 for each indicator across the assessed technologies with an equal interpretation (i.e. 1 means the best). In order to avoid zero values of the indicator, we reduced the minimum value in the first formula by 10%, and added the same 10% to the maximum value in the second formula.
In order to identify the initial input data of the model, we used two main questions answered in a questionnaire (see Appendix A). The questionnaire was distributed during a field research in Egypt after appointments with key actors in energy planning in Egypt, as well as during a summer school and conference in Cyprus.
The main objective of this questionnaire is to know the initial preference of different electricity supply technologies and the preference order of the sustainability assessment indicators in the evaluation of these technologies by stakeholders in the energy sector. We used these input data in finding the weight of indicators and the initial preference value of technologies. We categorized participants into four groups including: experts representing researchers in Egyptian Universities with an experience of more than 10 years in the energy field; policy-makers representing employees in the Ministry of Energy and Electricity; investors representing employees in the World Bank office and the European Union Delegation in Egypt which financially supports energy projects; and young-researchers with an experience of less than 10 years in the energy field. Another virtual actor that we used in this study is based on the sustainable scenario representing equal initial preferences of all technologies and its progress with equal weight of sustainability dimensions.
Results and Discussion
Comparison of energy priorities and landscapes for different actor types
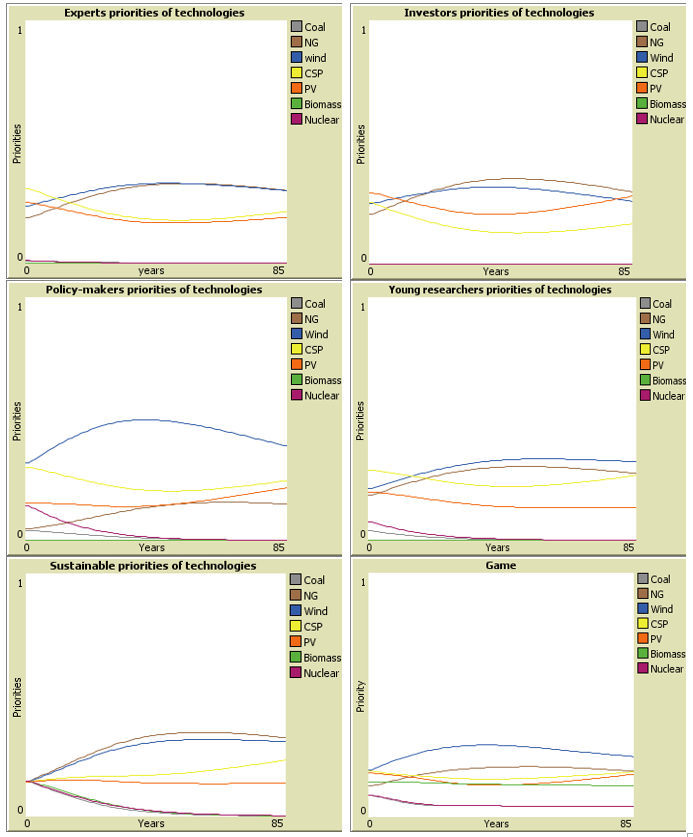
Figure 4 compares the adaptive changes in the average priorities of technologies over all spatial cells for the four tested actors (Experts, Investors, Policy-makers and Young-researchers), the sustainable scenario and the game scenario throughout 2015 – 2100 (i.e., 0 – 85 time steps in Netlogo). In the “Experts” scenario, it can be observed that the model started with the highest average priority to CSP followed by PV, wind and NG. Nuclear and coal were almost zero priority throughout the running period for both experts and investors, however, they started in the policy-makers and young-researchers scenario at a low level and again reduced drastically to nearly zero.
In general, there was a gradual increase in priorities of both wind and NG, which started to decrease again after approximately 40 years with an opposite pattern to both CSP and PV. This implies that the potential tendency towards both CSP and PV would start after 2050 giving less emphasis on wind and NG by these actors. However, this changing pattern existed at different levels between actors. In the “Policy-makers” scenario, the priority of wind was higher than other actors, showing more affinity towards this technology. This scenario also showed a lower priority curve of NG than CSP and PV. In the sustainable scenario, the priorities of wind and NG almost coincided, whereas for CSP and PV, they bifurcated from the middle of the model running period with an increasing trend to CSP and decreasing trend to PV, but at a lower rate than CSP.
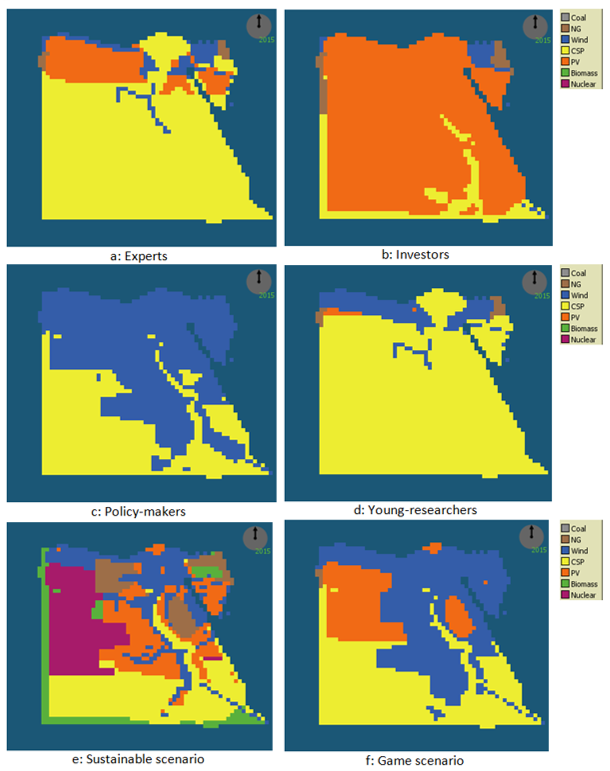
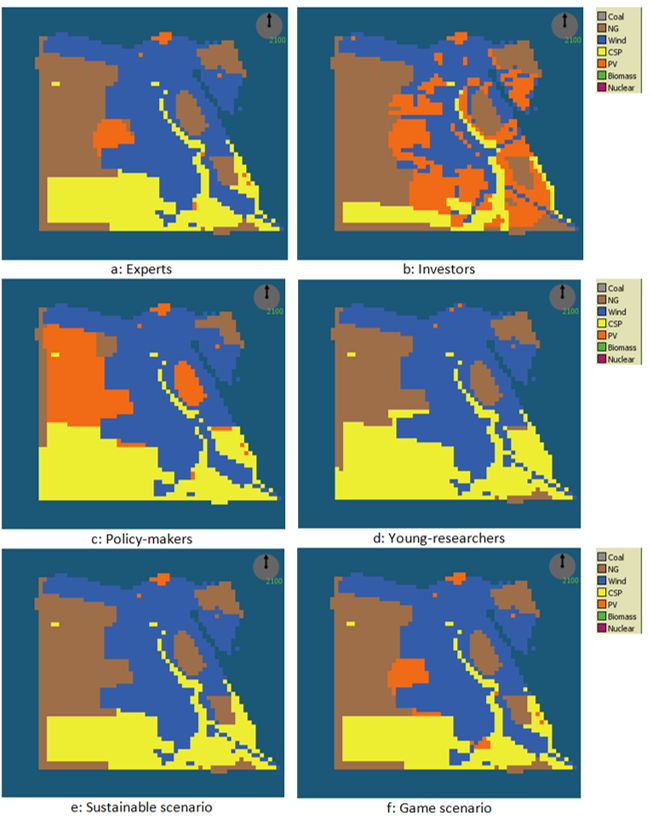
The map of the energy landscapes for each actor in the years 2015 and 2100 are presented in Figure 5 and Figure 6 respectively. They show the spatial DMs (cells) with maximum priority technology in the four tested actor scenarios and in the sustainable scenario (a – e) over time. In the game scenario (f), the map shows the spatial DM with maximum priority technology across the five actors in each cell.
In the “Experts” scenario in Figure 5, CSP started as a predominant priority in most spatial DMs, with the rest being distributed between PV, wind and NG, with PV coverage exceeding that of wind. As the model ran, the CSP and PV coverage decreased, whereas wind and NG coverage increased (Figure 6). In the “Investors” scenario, the landscape started with very wide coverage of PV, while the rest was distributed between CSP, wind and NG. However, this enormous coverage later decreased, whereas NG and wind increased simultaneously, while CSP remained at low coverage.
In the “Policy-makers” scenario, the landscape performs in a different way from that of the previous two scenarios. Instead of starting with an overwhelming technology with a huge coverage, the scenario started with close percentage coverage between CSP and wind. Then CSP coverage decreased, NG coverage increased gradually, PV coverage increased at a high rate ending up with considerable coverage. In the “Young-researchers” scenario, the landscape started with a huge CSP coverage as in the “Experts” scenario, low coverage of wind and very low coverage distributed between NG and PV. While the CSP coverage decreased as the model runs, the wind and NG coverage increased until it reached equilibrium. The PV coverage was too negligible to be considered.
In the sustainable scenario, the landscape started with a balanced mix, including all technology types except coal. This was because the priorities were only affected by spatial factors without including the technology assessment through the MCDA at the setup stage. However, this distribution changed drastically after the model runs, with an abrupt drop of biomass, PV and nuclear coverage, leaving the landscape with major coverage by NG, Wind and CSP. In the game scenario, the landscape started with major coverage by wind and CSP at equal proportions and the remaining was covered by PV. As the model ran, NG coverage replaced CSP and PV in certain patches.
Generally, the government assessed the possible technologies, and then checked for the best location for installation of the technology selected. However, from this landscape analysis, if one of the actors selected the location first, then this actor would have needed to know the best technology to be installed at that location at a certain time step, and so this analysis would be of help. Moreover, the energy demand in Egypt did not need to be supplied through the overall coverage of land. This meant that when we had 80% CSP coverage, indicating that CSP should not be installed in all of these cells, but rather it reflected only the dominant priority of these cells.
In the game scenario, each actor set up an initial preference of sustainability dimensions and played the game to achieve the maximum value of the maximum priority technology relative to other actors in each spatial cell. In order to control the conformity of each actor strategy with the game scenario results, there were several possibilities. The first was to compare the average priorities of actor technologies with those of the game scenario. The second was to compare the landscape coverage of each actors’ maximum priority technology with that in the game scenario. The third was to observe the winning actor’s landscape. At each step, each actor could observe how much deviation there was from their result.
The game winning hypothesis could be ruled in three different ways: technology-wise, value-wise of the maximum priority technology and actor-wise. In the value-based hypothesis, the winning actor with maximum priority would get the maximum return on investment through more investment allocation to that technology compared to other actors who might have the same maximum priority technology but at a lower value. The first two ways are useful to conform to the main target of the game that is concerned with the energy technology of maximum value to be selected and the investment allocation across technologies. The winning actor could select the same technology as another losing actor, who had lost the game due to a lower priority value of that technology. According to this logic, conflict between actors could be avoided. However, if the game ran subjectively, where each actor was concerned with simply winning even if two actors had the same technology, as in a tendering process, then there would be strong conflict and competition. Thus, the actors choose between sticking to their initial preferences of the technology assessment and modifying their preferences to win the game. For the future, other game scenarios could possibly be based on collective decision-making representing a majority or joint benefit decision rule.
Future projected energy-mix
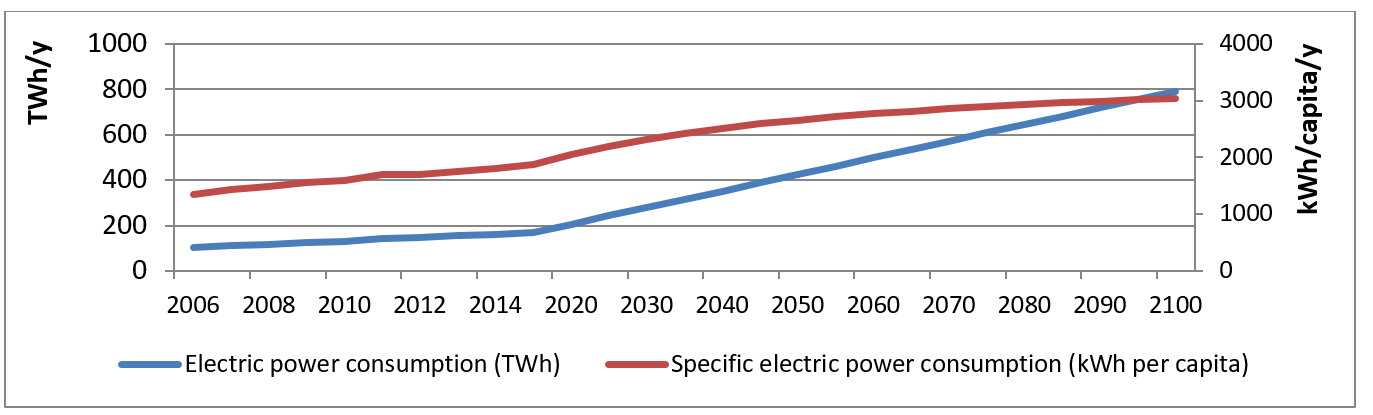
This section presents the electricity-mix scenarios based on preferences made by actors and a dynamic assessment of these technologies. Based on these average priorities of the technologies presented in Figure 4, we calculated the future projected energy-mix. In 2015, we used the actual energy-mix in Egypt at year 2014 based on energy produced, not on the installed capacity, shown in Table 3 in the fifth column. We used the predicted future electricity consumption shown in Figure 7[1]. We then calculated the amount of predicted electricity demand during each period.
The priority-mix of technologies for each actor was multiplied by the predicted electricity demand giving a new energy-mix distribution. For instance, if 30 TWh of electricity would be needed to be supplied between 2015 and 2020, therefore the priorities would be distributed on this amount, and then added to the previously existing amount. We assumed that the old systems were included in the energy-mix and not substituted or decommissioned, and the energy produced from hydro and oil-fired power plants remained constant throughout the period. This meant that no new installations would be made. We calculated the predicted electricity-mix in the form of percentage and installed capacity where the latter was calculated according to the predicted future energy generated and full load hours for each technology type.
| MW | TWh | % MW* | % TWh* | FLH* | |
| Hydro | 2800 | 13.352 | 8.745900359 | 7.9455381 | 4769 |
| NG | 22288 | 119.3 | 69.61736686 | 70.993311 | 5353 |
| Oil | 6360 | 34.04 | 19.86568796 | 20.256599 | 5352 |
| Wind | 547 | 1.332 | 1.708574106 | 0.7926495 | 2435 |
| Solar | 20 | 0.02 | 0.062470717 | 0.0119016 | 1000 |
The values of the energy-mix in percentage are shown in Table 4 and Table 5 for the years 2020 and 2100, respectively and the values of the energy-mix in terms of installed capacity for the same years are shown in Table 6 and Table 7. Although the values across actors were very close in some cases, we highlighted the major variations between these actors in 2020 and 2100. The values in Table 4 and Table 5, which are highlighted in yellow represent the minimum values while the ones highlighted in light grey represent the maximum values. For hydro and oil, the values were constant between actors because they were assumed not to be extended.
It was found that coal in 2020 would range between completely absent in the energy-mix as preferred by investors, to about 2% in the sustainable scenario corresponding to 0.8 GW, although 0.5 GW would be accepted to all actors according to the game scenario. In 2100, coal would be accepted not to exceed 4% of the energy-mix with an installed capacity in the range of 5 GW. For NG which currently constitutes about 70% of the energy mix, its share is expected to be reduced to about 60 % with an installed capacity of about 23 GW in 2020. There is no big difference in the prediction levels of NG between actors in 2020, however in 2100, the gap increases between actors regarding this technology where it ranges between 25 – 40% share in the energy-mix which corresponds to a predicted installed capacity ranging between 36 – 58 GW. Wind share is predicted to have an average value of 5% with a range of 3.5 – 7% in 2020 of the generated energy and an installed capacity of about 5 GW. These values should not be confused with the values stated in the national plan of 12% share of wind as the latter value is based on the installed capacity share. This installed capacity share is almost close to our calculation that shows approximately 10%. In 2100, there would also be a big difference between actors’ predictions, where the share of wind ranges between 20 – 35%, which corresponds to an installed capacity range of 70 – 113 GW. For CSP in 2020, the share ranges between 2.7 – 5% with an installed capacity ranging between 5.5 – 10.5 GW. The value of the installed capacity for CSP is almost double that of wind, although the share of CSP is lower than wind as the full load hours of CSP is less than half that of wind.
The full load hours were calculated according to the currently installed power plants in Egypt and their generated electricity. The difference in the full load hours roots from the difference in the capacity factors and the availability of technologies. This also justifies the differences in the total installed capacities between the actors as they have different energy-mixes. In 2100, the share of CSP would rise to a range of 12 – 20% with an average installed capacity of about 120 GW. The PV share is expected to have the same range like that in CSP in 2020 and 2100 in accordance to the preferences of various actors. Moreover, the installed capacity is in the range of 3 – 6 GW in 2020 to 50 – 85 GW in 2100 which differs from that of CSP due to the differences in the full load hours also.
It is recommended by the sustainable scenario to include a share of 2.2% of biomass in 2020 and 2100 as a diversification tool of electricity resources to achieve higher security. The same applies to nuclear technology where the share ranges from 0 – 2.2% in 2020 at an average installed capacity of 0.4 GW. Although the share range is preferred to be unchanged, the installed capacity is however increased to an average value of 2 GW in 2100. The tendency towards nuclear between actors varies to some extent as in coal, where it is completely absent in the energy-mix of the “Investors” actor but is recommended in the sustainable scenario and by “Policy-makers”.
| Actors[2] | Exp | Inv | PM | YR | SS | GS |
| Coal | 0.14% | 0.00% | 0.65% | 0.53% | 2.16% | 1.30% |
| NG | 62.03% | 62.43% | 59.32% | 62.00% | 61.35% | 60.87% |
| Wind | 5.13% | 5.32% | 6.97% | 4.79% | 3.57% | 4.56% |
| CSP | 5.12% | 4.10% | 5.15% | 5.02% | 2.67% | 3.17% |
| PV | 4.25% | 4.97% | 2.71% | 3.43% | 2.58% | 3.08% |
| Biomass | 0.00% | 0.00% | 0.00% | 0.00% | 2.28% | 2.51% |
| Nuclear | 0.14% | 0.00% | 2.02% | 1.05% | 2.21% | 1.34% |
| Hydro | 6.53% | 6.53% | 6.53% | 6.53% | 6.53% | 6.53% |
| Oil | 16.65% | 16.65% | 16.65% | 16.65% | 16.65% | 16.65% |
| Exp | Inv | PM | YR | SS | GS | |
| Coal | 0.12% | 0.00% | 0.72% | 0.41% | 1.86% | 3.56% |
| NG | 38.27% | 39.53% | 24.94% | 36.87% | 38.94% | 30.41% |
| Wind | 24.18% | 22.79% | 34.89% | 24.65% | 22.49% | 21.26% |
| CSP | 16.40% | 12.41% | 18.43% | 19.48% | 14.90% | 13.05% |
| PV | 14.92% | 19.25% | 13.46% | 11.82% | 11.32% | 11.78% |
| Biomass | 0.00% | 0.00% | 0.00% | 0.00% | 2.24% | 10.33% |
| Nuclear | 0.08% | 0.00% | 1.54% | 0.75% | 2.22% | 3.58% |
| Hydro | 1.70% | 1.70% | 1.70% | 1.70% | 1.70% | 1.70% |
| Oil | 4.33% | 4.33% | 4.33% | 4.33% | 4.33% | 4.33% |
| Exp | Inv | PM | YR | SS | GS | |
| Coal | 51.97 | 0.00 | 248.21 | 205.13 | 829.42 | 497.10 |
| NG | 23,807.14 | 23,960.29 | 22,765.20 | 23,792.79 | 23,545.29 | 23,360.70 |
| Wind | 4,330.34 | 4,486.63 | 5,881.26 | 4,043.30 | 3,010.85 | 3,844.92 |
| CSP | 10,526.66 | 8,418.76 | 10,570.57 | 10,307.09 | 5,483.80 | 6,504.81 |
| PV | 4,909.55 | 5,731.92 | 3,131.18 | 3,957.66 | 2,979.04 | 3,552.64 |
| Biomass | 0.00 | 0.00 | 0.00 | 0.00 | 636.12 | 701.27 |
| Nuclear | 35.28 | 0.00 | 526.37 | 272.47 | 574.65 | 348.13 |
| Hydro | 2,812.16 | 2,812.16 | 2,812.16 | 2,812.16 | 2,812.16 | 2,812.16 |
| Oil | 6,391.76 | 6,391.76 | 6,391.76 | 6,391.76 | 6,391.76 | 6,391.76 |
| Total | 52,864.86 | 51,801.53 | 52,326.72 | 51,782.35 | 46,263.09 | 48,013.50 |
| Exp | Inv | PM | YR | SS | GS | |
| Coal | 172.31 | 0.00 | 1,068.74 | 598.98 | 2,746.71 | 5,267.10 |
| NG | 56,553.09 | 58,412.73 | 36,854.66 | 54,484.94 | 57,543.76 | 44,940.64 |
| Wind | 78,552.26 | 74,013.71 | 113,321.81 | 80,080.65 | 73,054.90 | 69,067.88 |
| CSP | 129,710.88 | 98,136.29 | 145,754.35 | 154,068.85 | 117,890.54 | 103,204.76 |
| PV | 66,315.98 | 85,559.46 | 59,792.52 | 52,518.65 | 50,306.48 | 52,352.12 |
| Biomass | 0.00 | 0.00 | 0.00 | 0.00 | 2,408.70 | 11,105.97 |
| Nuclear | 83.55 | 0.00 | 1,547.56 | 751.50 | 2,227.11 | 3,588.07 |
| Hydro | 2,812.16 | 2,812.16 | 2,812.16 | 2,812.16 | 2,812.16 | 2,812.16 |
| Oil | 6,391.76 | 6,391.76 | 6,391.76 | 6,391.76 | 6,391.76 | 6,391.76 |
| Total | 340,592.01 | 325,326.10 | 367,543.56 | 351,707.49 | 315,382.12 | 298,730.48 |
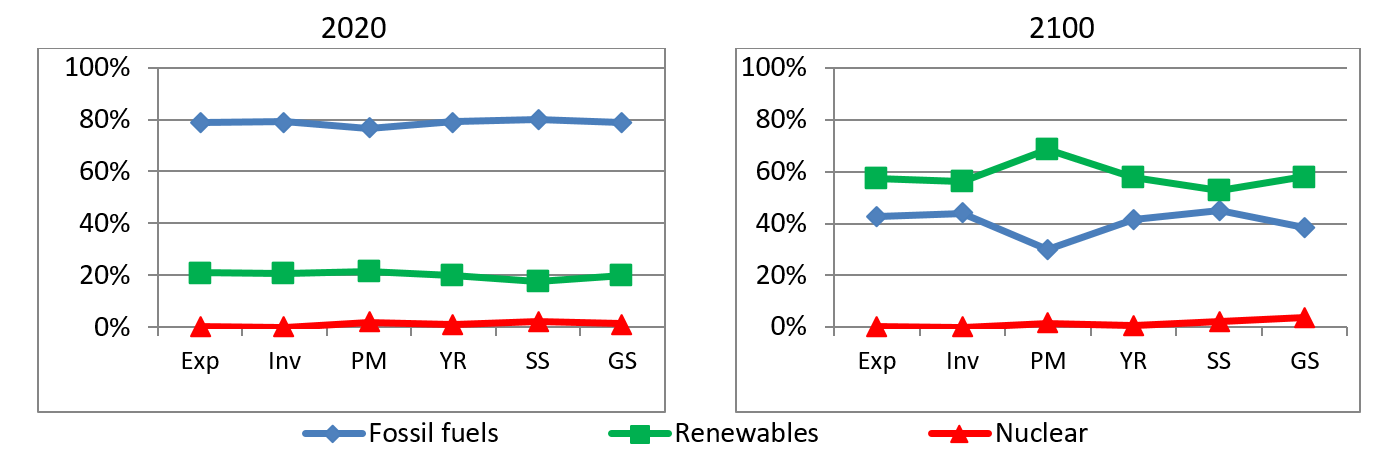
Figure 8 shows a comparison between the energy-mix of the compiled technologies based on their resources (i.e., fossil fuels – renewables – nuclear) between actors in addition to the sustainable and the game scenarios for 2020 and 2100. In the left-hand figure, it is clear that all actors agree on having 20% of the energy supply from renewable resources, which is in line with the Egyptian national plan for renewable energy, while 80% is from fossil fuels with the inclusion of approximately 2% of nuclear for some actors in 2020. In 2100 in the right figure, the share of renewables accounts for 50 – 70%, having the complementary supply from fossil fuels but also with about 3% nuclear for the game scenario.
Summary and Conclusion
According to these results, we conclude that the decision making process in the energy sector to secure future electricity supply for the future generations is a complex process. It involves a multi-dimensional analysis of all possible potential technologies through the evaluation of indicators whose values change in space and time. Moreover, the actors involved in the decision-making process have different preferences and their decisions could be affected by other actors. Additionally, in practice they adapt at a different rate to changes in the values of technologies.
The sustainable scenario constitutes a normative decision approach with unbiased affinity towards any of the sustainable dimensions making it a target for all countries in their energy planning. However, in practice, there are many actors who decide differently and interact with each other. Therefore, we cannot state that the energy-mix obtained from any of the tested actors including the sustainable scenario is the best, but rather a balanced energy-mix resulting from the interaction of the actors in the game scenario could represent a realistic and better approach of planning an acceptable, a secure and a sustainable future energy-mix in Egypt. The results of the game scenario show how important it is for the Egyptian government to be more concerned with the renewable energy projects and the transition of the energy landscape from fossil fuel-fired energy systems to renewable ones. Energy diversification, through the inclusion of other resources such as limited coal or nuclear power, adds more security through gaining knowledge and experience of their operation.
In order to validate the data collected in our questionnaire, we applied a Monte-Carlo validation approach. A big challenge in validating such model is the inclusion of data based on the opinion of people which we cannot guarantee to remain consistent with time. Moreover, values of indicators could change in the future due to the impact of other agents or external factors. Furthermore, we developed a supportive model for energy planning and decision making optimization rather than a prediction model. This is an adaptation model where the actors change their action pathways based on changes to input data. Another feature included here is the adaptation rate, which in reality differs from one individual to another, but here we applied a constant rate for all actors. This model would be helpful for an interactive energy planning which always requires an update of data especially if it includes the influence of other agents. Thus, it could be a guide for long term planning as well as an assistance tool of quick action in short term planning.
The developed model includes the possibility of conducting a sensitivity analysis in addition to other features. The sensitivity analysis can test the model for full preference to only one dimension of sustainability as well as through the selection of certain types of the technologies under assessment. Shaaban et al. (2018a) explained the Monte-Carlo validation approach and showed the results of the sensitivity analysis of ranking technologies using the MCDA approach. The Netlogo model is available at the website of CoMSES Net (Network for Computational Modeling in the Social and Ecological Sciences) under the following link (https://www.comses.net/codebase-release/2e27d874-7581-4e1b-a6d2-bb65a27af711/) where it can be downloaded and all features can be examined Shaaban et al. (2018b).
In this study, we were able to develop a novel prototype model integrating three methodologies: MCDA, ABM and GIS. We recommend extending the model by including a higher number of assessment indicators, spatial factors and other actors. Additionally, the spatial factors should be analyzed at a higher resolution and should exclude locations that could not be used in all cases to install power plants. As more variables as indicators, spatial factors and actors, and higher resolution analysis were included in the model, the accuracy of results would be higher. Therefore, this model could be used as a building block for future projects through changing alternatives, assessment indicators, external spatial factors, the study country and actors as follows:
- A high resolution and accuracy assessment of the energy systems in Egypt or in any other country.
- The dynamic decision making process in sectors other than the energy sector, such as farming, transportation, housing etc..
- The analysis of interaction between actors in a decision making process and the resulting pathways of conflict or cooperation from this interaction.
- The analysis of the behavior of different actors in response to action taken by other actors in the energy sector, including:
- Electricity planning and climate change.
- Energy, water and food nexus.
- Electricity planning and migration.
Acknowledgements
The authors would like to thank all those who gave assistance and advice during the writing of this paper, and also like to thank the committee of Doctoral scholarships awarded in accordance with the Hamburg Act to Promote Young Academics and Artists (HmbNFG) for financial PhD support. This work was supported in part by the German Science Foundation (DFG) through the Cluster of Excellence "CliSAP" (EXC177).Notes
- Data are based on specific electric power consumption (kWh per capita) until the year 2012 as obtained from the World Bank (2014b). We multiplied these data by the obtained population data from the World Bank (2014a) till the year 2012 to get the total consumption. We then extrapolated the total consumption to 2100. Finally, we divided the extrapolated total consumption by the extrapolated population to get the specific consumption.
- Exp.= Experts, Inv.= Investors, PM= Policy-makers, YR= Young-researchers, SS= Sustainable scenario, GS= Game scenario
Appendix
STUDY OBJECTIVES
We conduct a sustainability analysis of different electricity supply technologies in terms of technical, socio-economic and environmental analysis in Egypt.
The aim of this questionnaire is to measure the importance and the weight of the selected sustainability criteria for future electricity planning, and ranking the different electricity production technologies for future supply.
This data is important as it will be further used for analyzing the sustainability extent of each electricity supply resource. Furthermore, it will be used for designing future electricity mix scenarios for Egypt.
You as experts, policy makers, investors, and researchers play an important role in designing and shaping future energy that is strictly linked to the future quality of life. The questionnaire will take from you only 15-20 minutes. Please read the instructions on how to fill in the questionnaire before going through it.
After collecting the data, it will be analyzed and surely I will send you a feedback about the results.
For privacy and data protection no names or contact details should be provided and your participation will be kept confidential.
INSTRUCTIONS ON HOW TO FILL IN THE QUESTIONNAIRE
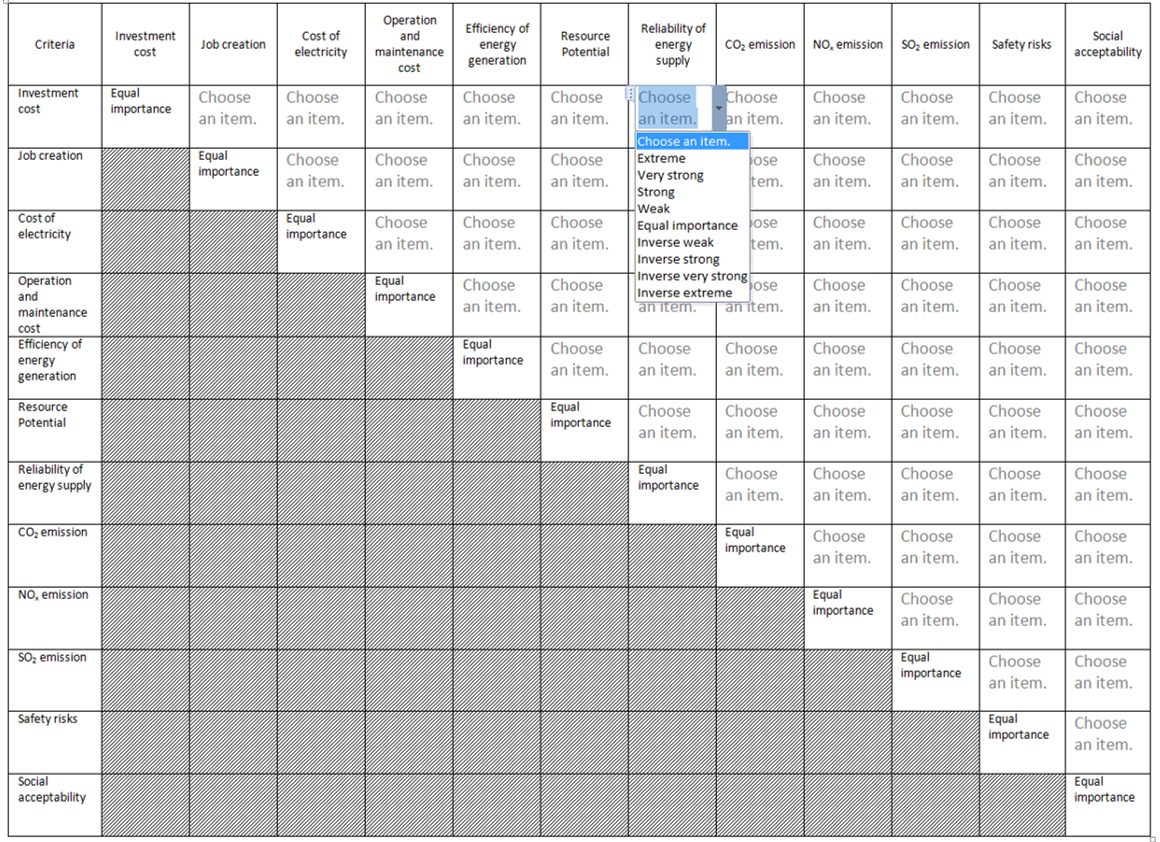
- Figure 9 measures the importance of the criteria for future electricity planning through pairwise comparison. Please compare the criteria in the first column with those in the first row horizontally such that the criterion in the first column, second row is of (…) importance as compared to the criterion in the first row, second column. Kindly select an item from the drop-down list in the corresponding cell. Items starting with “Inverse" mean that the higher importance is given to the cell in the row as compared to the cell in the column
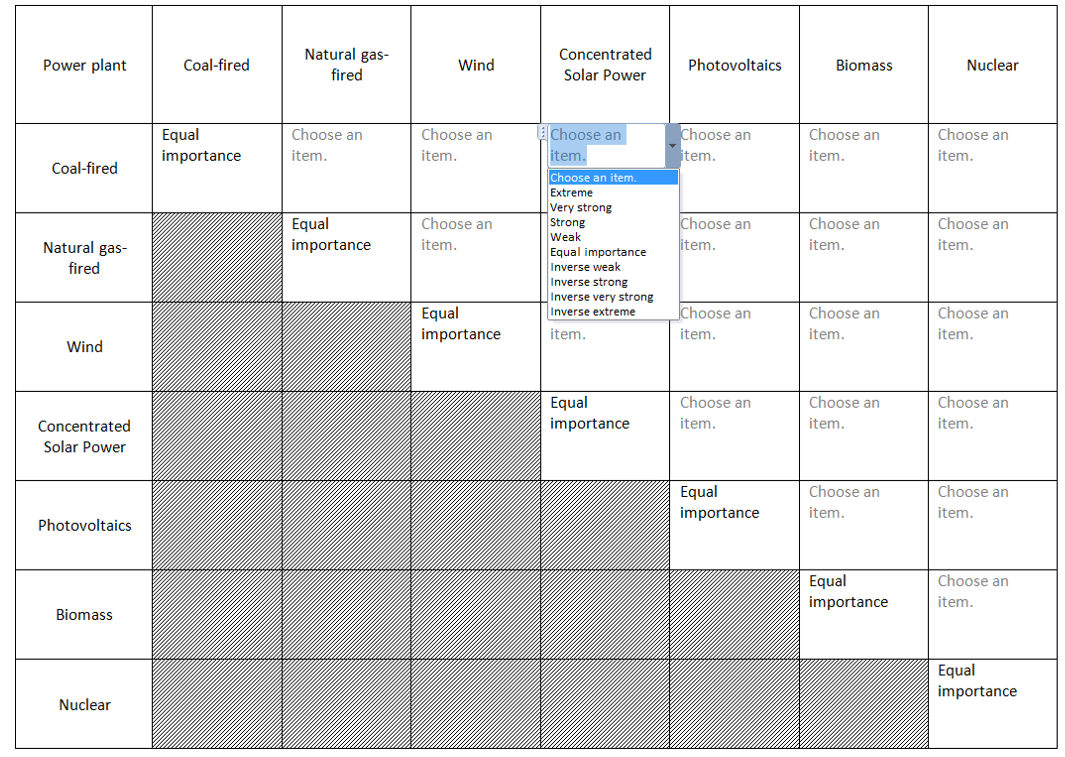
- Figure 10 measures the preference of the electricity supply according to the same principle of Figure 9.
- Finally, you will be asked to enter your affiliation.
- Please, do not use the shaded cells.
References
ABU-TAHA, R., Daim, T (2013). ‘Multi-Criteria Applications in Renewable Energy Analysis, a Literature Review.’ In Daim, T., Oliver, T., Kim, J. (Eds.), Research and Technology Management in the Electricity Industry. Springer London, London, pp. 17–30. [doi:10.1007/978-1-4471-5097-8_2]
ALLEN, P., Varga, L. (2014). Modelling sustainable energy futures for the UK. Futures 57, 28–40. [doi:10.1016/j.futures.2014.01.005]
BABIC, J., Podobnik, V. (2016). A review of agent-based modelling of electricity markets in future energy eco-systems. Computer and Energy Science (SpliTech), International Multidisciplinary Conference on, IEEE, pp. 1–9.
BALE, C.S.E., Varga, L., Foxon, T.J. (2015). Energy and complexity: New ways forward. Applied Energy 138, 150–159. [doi:10.1016/j.apenergy.2014.10.057]
BENDOR, T.K., Scheffran, J. (2018). Agent-Based Modeling of Environmental Conflict and Cooperation. Boca Raton, FL: Taylor & Francis, CRC Press.
BILLARI, F.C., Fent, T., Prskawetz, A., Scheffran, J. (Eds.) (2006). Agent-Based Computational Modelling, Contributions to Economics. Physica-Verlag HD, Heidelberg.
CONRAD, O., Bechtel, B., Bock, M., Dietrich, H., Fischer, E., Gerlitz, L., Wehberg, J., Wichmann, V., Böhner, J. (2015). System for Automated Geoscientific Analyses (SAGA) v. 2.1.4. Geoscientific Model Development, 8, 1991–2007. [doi:10.5194/gmd-8-1991-2015]
DEL Río, P., Burguillo, M. (2009). An empirical analysis of the impact of renewable energy deployment on local sustainability. Renewable and Sustainable Energy Reviews 13, 1314–1325.
DEMIRTAS, O. (2013). Evaluating the Best Renewable Energy Technology for Sustainable Energy Planning. International Journal of Energy Economics and Policy 3, 23–33.
DOUKAS, H., Papadopoulou, A., Savvakis, N., Tsoutsos, T., Psarras, J. (2012). Assessing energy sustainability of rural communities using Principal Component Analysis. Renewable and Sustainable Energy Review 16, 1949–1957.
EEHC (2014). Egyptian electricity holding company annual report. Ministry of Electricity and Renewable Energy, Cairo. http://www.moee.gov.eg/english_new/EEHC_Rep/2013-2014en.pdf. Archived at: http://www.webcitation.org/6yWfjpw6h.
EISENACK, K., Lüdeke, M., Petschel-Held, G., Scheffran, J., Kropp, J. (2007). Qualitative Modelling Techniques to Assess Patterns of Global Change, in: Kropp, J., Scheffran, J. (Eds.), Advanced Methods for Decision Making and Risk Management in Sustainability Science. Nova Science Publishers, New York, pp. 99–146.
EVANS, A., Strezov, V., Evans, T.J. (2009). Assessment of sustainability indicators for renewable energy technologies. Renewable and Sustainable Energy Reviews 13, 1082–1088.
GILBERT, G.N. (2008). Agent-based models, Quantitative applications in the social sciences. Sage Publications, Los Angeles. [doi:10.4135/9781412983259]
GIS-LAB (2014). VMap0 data in ESRI shape format. http://gis-lab.info/qa/vmap0-eng.html (accessed 10.6.16). Archived at: http://www.webcitation.org/6yWgJfgd4.
GUERCI, E., Rastegar, M.A., Cincotti, S. (2010). ‘Agent-based Modeling and Simulation of Competitive Wholesale Electricity Markets’. In Rebennack, S., Pardalos, P.M., Pereira, M.V.F., Iliadis, N.A. (Eds.), Handbook of Power Systems II. Springer Berlin Heidelberg, Berlin, Heidelberg, pp. 241–286.
KNOERI, C., Binder, C.R., Althaus, H.-J. (2011). An Agent Operationalization Approach for Context Specific Agent-Based Modeling. Journal of Artificial Societies and Social Simulation 14(2), 4: https://www.jasss.org/14/2/4.html. [doi:10.18564/jasss.1729]
LIU, G. (2014). Development of a general sustainability indicator for renewable energy systems: A review. Renewable and sustainable Energy Reviews 31, 611–621.
MACAL, C., North, M. (2006). Introduction to Agent-based Modeling and Simulation. http://www.mcs.anl.gov/~leyffer/listn/slides-06/MacalNorth.pdf. Archived at: http://www.webcitation.org/6yWgbNwdT.
MACAL, C., Thimmapuram, P., Koritarov, V., Conzelmann, G., Veselka, T., North, M., Mahalik, M., Botterud, A., Cirillo, R. (2014). Agent-based Modeling of Electric Power Markets. In Proceedings of the 2014 Winter Simulation Conference, WSC ’14. IEEE Press, Piscataway, NJ, USA, pp. 276–287.
MÖST, D., Fischtner, W., Ragwitz, M., Veit, D. (Eds.) (2008). New methods for energy market modelling: proceedings of the first European workshop on Energy Market Modelling using agent-based computational economics. October Karlsruhe, Germany. Universitäts-Verlag, Karlsruhe.
NESS, B., Urbel-Piirsalu, E., Anderberg, S., Olsson, L. (2007). Categorising tools for sustainability assessment. Ecological Economics 60(3), 498–508.
NORTH, M., Conzelmann, G., Koritarov, V., Macal, C., Thimmapuram, P., Veselka, T. (2002). E-laboratories: Agent-based modeling of electricity markets. 2002 American Power Conference,United States.
ONG, S., Campbell, C., Denholm, P., Margolis, R., Heath, G. (2013). Land-Use Requirements for Solar Power Plants in the United States (No. NREL/TP-6A20-56290). NREL.
PATRO, S.G.K., Sahu, K.K. (2015). Normalization: A Preprocessing Stage. International Advanced Research Journal in Science, Engineering and Technology, 20–22. [doi:10.17148/IARJSET.2015.2305]
POHEKAR, S.D., Ramachandran, M. (2004). Application of multi-criteria decision making to sustainable energy planning—A review. Renewable and Sustainable Energy Reviews 8, 365–381.
RAI, V., Henry, A.D. (2016). Agent-based modelling of consumer energy choices. Natural Climate Change 6(6), 556–562. [doi:10.1038/nclimate2967]
RASTEGAR, M.A., Guerci, E., Cincotti, S. (2009). Agent-based model of the Italian wholesale electricity market. In Energy Market, 2009. 6th International Conference on the European, IEEE, pp. 1–7.
SAATY, T.L. (1980). The Analytic Hierarchy Process: Planning, Priority Setting, Resource Allocation. McGraw-Hill International Book Co, New York ; London.
SCHEFFRAN, J. (2013). ‘Conditions for Cooperation and Trading in Value-Cost Dynamic Games.’ In Křivan, V., Zaccour, G. (Eds.), Advances in Dynamic Games. Springer International Publishing, Cham, pp. 173–203.
SCHEFFRAN, J. (2008). Adaptive management of energy transitions in long-term climate change. Computational Management Science 5, 259–286. [doi:10.1007/s10287-007-0044-1]
SCHEFFRAN, J., BenDor, T. (2009). Bioenergy and land use: a spatial-agent dynamic model of energy crop production in Illinois. International Journal of Environment and Pollution 39, 4.
SCHEFFRAN, J., Hannon, B. (2007). From complex conflicts to stable cooperation: Cases in environment and security. Complexity 13, 78–91. [doi:10.1002/cplx.20201]
SHAABAN, M. (2017). The Roadmap to Energy Security in Egypt (Doctoral thesis). University of Hamburg, Hamburg, Germany. http://ediss.sub.uni-hamburg.de/volltexte/2017/8835/. Archived at: http://www.webcitation.org/6yWhLpWlL.
SHAABAN, M., Scheffran, J. (2017). Selection of sustainable development indicators for the assessment of electricity production in Egypt. Sustainable Energy Technologies and Assessments 22, 65–73. [doi:10.1016/j.seta.2017.07.003]
SHAABAN, M., Scheffran, J., Böhner, J., Elsobki, M. (2018a). Sustainability Assessment of Electricity Generation Technologies in Egypt Using Multi-Criteria Decision Analysis. Energies 11, 1117.
SHAABAN, M., Scheffran, J., Böhner, J., Elsobki, M. (2018b). Energy Landscape Transition Analysis and Planning in Egypt (ELTAP-Egy): https://www.comses.net/codebases/4881b53f-34a4-4759-8b32-655609a8c671/releases/1.0.0/ (accessed December 29, 2018). Archived at: http://www.webcitation.org/7522zqhm7.
SINGH, R.K., Murty, H.R., Gupta, S.K., Dikshit, A.K. (2009). An overview of sustainability assessment methodologies. Ecological Indicators 9, 189–212. [doi:10.1016/j.ecolind.2008.05.011]
SOUSA, J., Kokkinogenis, Z., Rossetti, R., Tomé Saraiva, J. (2013). Electricity market and renewable energy integration: An agent-based conceptual model. Presented at the 1st International Workshop on Simulation for Energy, Sustainable Development and Environment, SESDE 2013, Held at the International Multidisciplinary Modeling and Simulation Multiconference, I3M 2013, pp. 101–108.
STAMBOULI, A.B., Khiat, Z., Flazi, S., Kitamura, Y. (2012). A review on the renewable energy development in Algeria: Current perspective, energy scenario and sustainability issues. Renewable and Sustainable Energy Reviews 16, 4445–4460. [doi:10.1016/j.rser.2012.04.031]
TERRAPON-PFAFF, J., Dienst, C., König, J., Ortiz, W. (2014). A cross-sectional review: Impacts and sustainability of small-scale renewable energy projects in developing countries. Renewable and Sustainable Energy Reviews 40, 1–10.
THE WORLD BANK (2014a). Total population. Population. URL http://data.worldbank.org/indicator/SP.POP.TOTL (accessed 4.22.16). Archived at: http://www.webcitation.org/6yWhseyQd.
THE WORLD BANK (2014b). Electric power consumption. Electric Power Consumption. URL http://data.worldbank.org/indicator/EG.USE.ELEC.KH.PC (accessed 4.22.16). Archived at: http://www.webcitation.org/6yWi3cJNm.
TROLDBORG, M., Heslop, S., Hough, R.L. (2014). Assessing the sustainability of renewable energy technologies using multi-criteria analysis: Suitability of approach for national-scale assessments and associated uncertainties. Renewable and Sustainable Energy Reviews 39, 1173–1184. [doi:10.1016/j.rser.2014.07.160]
TSAI, W.-T. (2010). Energy sustainability from analysis of sustainable development indicators: A case study in Taiwan. Renewable and Sustainable Energy Reviews 14(7), 2131–2138.
UNITED Nations (2016). United Nations sustainable development agenda. http://www.un.org/sustainabledevelopment/development-agenda/. Archived at: http://www.webcitation.org/6yWiDJagH.
US EIA (2015). Egypt energy analysis. US Energy: https://www.eia.gov/beta/international/analysis.cfm?iso=EGY (accessed 3.14.16). Archived at: http://www.webcitation.org/6yWiMenV3.
WANG, J.-J., Jing, Y.-Y., Zhang, C.-F., Zhao, J.-H. (2009). Review on multi-criteria decision analysis aid in sustainable energy decision-making. Renewable and Sustainable Energy Reviews 13, 2263–2278. [doi:10.1016/j.rser.2009.06.021]
ZHOU, Z., Chan, W.K. (Victor), Chow, J.H. (2007). Agent-based simulation of electricity markets: a survey of tools. Artificial Intelligence Review 28(4), 305–342.