
Introduction
The aim of this paper is to develop a methodological approach to enable the construction of agent-based models of community food security in developing country contexts where regional (sub-national) data sets are available. Measurement of food security has tended to concentrate on either entire nations or individual households (Carletto et al. 2013; Pinstrup-Andersen 2009). However, rights-based approaches have prompted a renewed interest in community food security, an evolving concept that advocates long-term systemic approaches to address food insecurity in an equitable and sustainable manner (Jarosz 2014). Community food security can be defined as “a situation in which all community residents obtain a safe, culturally acceptable, nutritionally adequate diet through a sustainable food system that maximizes self-reliance and social justice” (Hamm & Bellows 2003, p. 37). It differs from household or national food security, as it emphasises the complex nature of food systems, which are embedded within dynamic social, ecological and economic processes (Kaiser 2011; Thompson & Scoones 2009). Community food security pays attention to interactions between system components such as households, institutions and the environment and the emergence of diverse food systems and food security outcomes (Hamm & Bellows 2003; McCullum et al. 2005).
The inherent complexity of community food security poses a significant challenge to the design and implementation of appropriate development programmes and policy (McCullum et al. 2005). Indeed, community food security is an emergent property of household food security, which is shaped by the way in which households interact, acquire and utilise assets within a context of vulnerability (Chambers & Conway 1991; Scoones 1998). The multiple interactions between the various factors that affect the livelihoods of households give rise to often complex and non-linear system behaviour (Chambers & Conway 1991; Scoones 1998).
Within developing countries, the livelihoods of rural households remain largely dependent upon agriculture. This article uses rural Malawi as a case study. It is a small, landlocked country home to approximately 15 million people. More than 90 percent of the rural population are smallholder farmers, responsible for cultivating plots with an average size of just 0.8 hectares (NSO 2012).
Maize is the dominant crop of the smallholder sector and the staple diet of the population (NSO 2012). According to Chisinga and Chasukwa (2012), although over 97 percent of smallholder farmers grow maize, only 10 percent are net sellers and up to 60 percent are net buyers. Between the months of November and March there is a single rainy (growing) season, followed by a dry season from April to October (Orr et al. 2009). Smallholders with access to dimba fields located in the valley bottoms (dambos) may take advantage of residual moisture and extend maize cultivation beyond the end of the rains (Orr et al. 2009). However, access to dimba fields is limited and the vast majority of agriculture remains rainfed, leaving farmers vulnerable to climatic shocks and food insecurity (Sahley et al. 2005). Additional exogenous trends such as population growth (De Sherbinin et al. 2008) and climate change (Schmidhuber & Tubiello 2007) further compound food insecurity. The discourse on climate change impacts and food security in Africa has tended to focus on changes in crop yields and food production (Knox et al. 2012; Cairns et al. 2013; Folberth et al. 2014). According to Connolly-Boutin and Smit (2015) however, attention must be paid to the multidimensional nature of food security.
A total of four dimensions are recognized under the ‘four pillars’ framework—created by FAO and operationalised for modelling purposes in Dobbie & Balbi (2017)—including food availability, access, utilisation and stability. The production of food is related primarily to food availability (Headey & Ecker 2013). Access refers to the amount of food a household can produce, purchase from the market and/or derive from other means (Burchi & Muro 2016). Households might draw upon social safety nets such as food for work programmes or adopt coping strategies like selling livestock or borrowing food (Devereux 2016). A third dimension, utilisation, refers to the ability of households to process accessible food. This is dependent upon the household’s ability to obtain sufficient quantities of fuel and clean water. Utilisation also relates to the physiological capability of individuals to digest food. This is affected by health and wellbeing (Jones et al. 2013). Finally, stability dictates how robust availability, access and utilisation dimensions are to shocks and stresses over time (Burchi & Muro 2016).
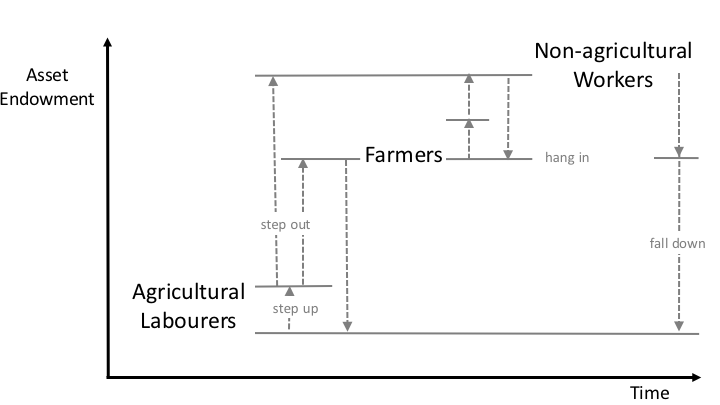
In response to shocks and stresses, households may adjust their livelihood activities to ensure sufficient food security (Tittonell 2014). This results in four main trajectories in which households may be seen to ‘hang-in’, ‘step-up’, ‘step-out’ or ‘fall-down’. Households that are able to maintain and protect current levels of wealth and welfare for example, are considered to be ‘hanging-in’ (Dorward et al. 2009). Those who are able invest in assets to expand the scale or productivity of existing activities are regarded to be ‘stepping up’ (Dorward et al. 2009). The term ‘stepping out’ refers to cases whereby the accumulation of assets permits households to shift into new, more productive activities (Dorward et al. 2009). Households following the opposite trajectory however, of deteriorating assets and a shift towards less productive activities are considered to be ‘falling-down’ (Falconnier et al. 2015). A livelihood is deemed sustainable by Chambers and Conway (1991, p. 26) “when it can cope with and recover from stresses and shocks, maintain or enhance its capabilities and assets and provide sustainable livelihood opportunities for the next generation and which contributes net benefits to other livelihoods at the local and global levels and in the short and long term”.
Besides the complexity of community food security, its assessment is challenged by scarcity of data at the community level. Within Malawi, since 1990 the National Statistical Office (NSO) has conducted integrated household surveys every five years. The surveys have provided a wealth of information on the socio-economic status of households within Malawi. However, a district level sampling frame means that data are not representative at village level. Compared with Integrated Household Surveys, the collection of village level data within Malawi has typically been uncoordinated and is not easily available in the literature.
Greater understanding of the relationships amongst climate, population, food and livelihoods is necessary to guide policy programmes and actions intended to sustain or improve the livelihoods and food security of communities in many developing countries and smallholder dominated areas. The applied questions that motivated this research are: how do interactions between households and the environment lead to the emergence of community food security? How is increased rainfall variability and population growth likely to impact future food availability, access, utilisation and stability? And how will increased rainfall variability and population growth affect household livelihood trajectories over time?
The potential of agent-based modelling
Agent-based modelling provides a useful simulation tool to address these questions (Balbi & Giupponi 2010; Balbi et al. 2013). It represents a bottom-up approach in which interactions at the local level lead to the emergence of patterns at the macro-level (Epstein & Axtell 1996). Agent-based simulations enable the heterogeneous nature of households, individuals and the environment to be taken into account (Epstein 1999). ABM’s also employ a dynamic approach that allows the trajectory of households and individuals to be traced over time (Valbuena et al. 2008; Valbuena et al. 2010). A key advantage of the technique is its ability to represent decision-making and behaviour (Smajgl & Bohensky 2013; Smajgl et al. 2011). Finally, agent-based models can integrate data from multiple sources, both qualitative and quantitative, which is particularly useful within data scarce contexts (Janssen & Ostrom 2006; Robinson et al. 2007). In data poor regions, such as our case study area of southern Malawi, we suggest that the scarcity of community or village data can be overcome using a typology-based approach. The ABM can be built upon regional data that tends to be more easily available. The paper demonstrates how the ABM can then be supplemented with context specific data to tailor development programmes and policies that address community food security.
For simulation outputs to be of use to decision makers, the model must be credible (Verburg et al. 2016). A range of technical, methodological and epistemological uncertainties may act to undermine model credibility (Funtowicz & Ravetz 1990). According to Reilly & Willenbockel (2010), technical uncertainties relate to the quality of data available to calibrate the model. Methodological uncertainties arise from knowledge constraints. There may not be sufficient knowledge with which to construct an accurate representation of the system at hand. Finally, epistemological uncertainties are concerned with model completeness. A number of factors, including stochasticity inherent to social-ecological systems, changes in human behaviour, technological innovations and ‘black swan’ events, may pose great uncertainty over time (Reilly & Willenbockel 2010). In order to ensure model credibility, uncertainty analysis can build confidence that outcomes are representative of the complex social ecological system at hand, rather than artefacts of parameterisation. In the present case, we use expert knowledge and empirical data to validate the model both quantitatively and qualitatively.
The paper begins with a description of the study site and modelling approach. In Results and Discussion we first present the effects of population growth, rainfall variability and market projections on food security, considering both the four pillars at the community level and the household livelihood trajectories. We then consider the limitations and the benefits of the modelling approach, using rural Malawi as a case study.
Study Site and Methodology
This study analyses rural households located within Southern Malawi. Over 50% of the population live on less than one US dollar a day and the proportion of ultra-poor people (defined as the proportion of the population below the minimum level of dietary energy requirement) is highest within Southern Malawi at approximately 34.2% (Gondwe 2014). Villages within rural Malawi are highly heterogeneous. Households differ with regards to the assets they possess and the trends, shocks and seasonal shifts they are exposed to (Kamanga et al. 2009; Chilongo 2014).
Two exogenous drivers, population growth and climate change, appear to be highly relevant to food security outcomes. Africa is the only region in the world expected to demonstrate sustained population growth until 2050 (Jayne et al. 2014). In Malawi, the rural population is anticipated to grow from approximately 8.4 million in 1990 to almost 29 million by 2050 (UN 2015). The share of young people is also increasing over time (UN 2015). Within Africa as a whole, Fine et al. (2012) estimate that approximately 122 million people will enter the labour force between 2010 and 2020. Over the same period it is estimated that the non-farm sectors will generate just 70 million wage jobs (Fine et al. 2012). Agricultural work will therefore remain an important livelihood strategy for Africa’s expanding young labour force. Climate change provides an additional stressor affecting livelihoods and food security (Connolly-Boutin & Smit 2015). Here, changes to climatic patterns manifest over longer time frames, whilst changes in the frequency and severity of extreme weather events can be felt over shorter time periods.
Modelling approach
The modelling approach required an iterative development process that comprised a number of stages (Figure 1) and different data sources incorporated into each. The remainder of this section introduces the data sources before moving on to summarise the main stages of the approach.
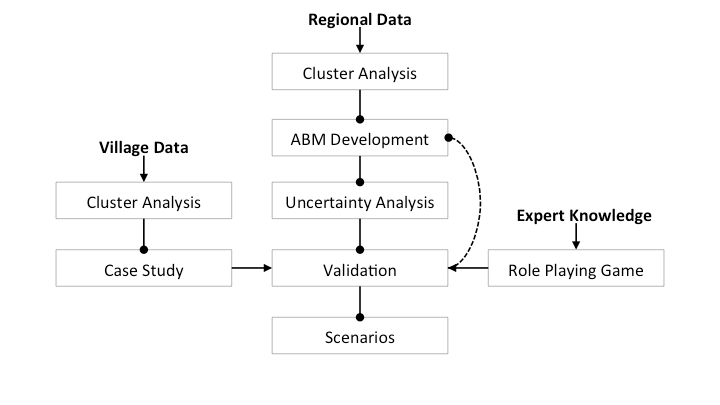
Data sources
Regional data
Regional data for this study came from Malawi’s Third Integrated Household Survey (IHS3) (NSO 2012). The National Statistical Office of Malawi (NSO) conducted the survey from March 2010 to March 2011. The main objective of the IHS3 was to provide and update information on the welfare and socio-economic status of Malawian households. Four questionnaire instruments were employed including household, agriculture, fishery and community questionnaires. The survey selected households based on a two-stage stratified sampling process and a Probability Proportional to Size (PPS) design. As a result, the sample was representative at national as well as district levels. A total of 12,271 households were sampled, made up of a cross-sectional sample set (74%) and a smaller, panel sample set (26%). Cross-sectional households were visited once in 2010/11, whereas panel households were visited twice: once in 2010/11 and again in 2013. The panel sample wasn’t publicly available at the time of our study. For this study, cross-sectional households from rural areas of southern Malawi were extracted to give a sample of 3840 households. This data was utilised for the ABM development to represent a hypothetical village within Southern Malawi.
Village data
Household-level data for a village in Southern Malawi was collected over a period of four days in July 2015 as part of a larger research project. Four trained Malawian enumerators used a household questionnaire to collect information on farming practices, crops planted, harvested and sold, other income generating activities, perceived food security, and socio-demographic characteristics of the households. After a village mapping exercise, in which three village representatives listed the household heads and mapped their locations, all households (n=46) were selected (census) to participate. When the listed household head was not available, the partner or another adult (18 years or above) was interviewed. Three households were not home and therefore not interviewed. Village data was used for parameterisation purposes as described in the 2.26-2.29. To this end, village data were clusterized with the same variables of the regional data.
Cluster analysis
A cluster analysis was performed twice, once during the initial model design stages and again as part of the validation process. The initial cluster analysis used regional data to construct a typology of households within rural Southern Malawi (see Dobbie et al. 2016). Using variables based upon land, labour, livestock assets and gender, three distinct clusters were identified and labelled: farmers, agricultural labourers and non-agricultural workers, respectively (Dobbie et al. 2016). A subsequent cluster analysis used the same variables to enable the integration of village data into the model. This provided a village-level case study, which formed a key component of the validation process.
Expert knowledge
This study benefits from an informal association with the project ‘Attaining Sustainable Services from Ecosystems through Trade-off Scenarios’ (ASSETS), which aims to “explicitly quantify the linkages between ecosystem services that affect and are affected by food security and nutritional health for the rural poor at the forest-agricultural interface” (http://espa-assets.org/). Expert knowledge was drawn from project partners at the University of Southampton and LEAD-SEA, Malawi, throughout the modelling design process to iteratively validate the structure of the ABM and test agents’ behaviour. The latter stage included a role playing game devised to test the land allocation decision (more details in the Sections 2.26-2.29).
ABM Development
The initial model development process involved a number of iterative steps, including i) clarification of model aim, ii) conceptual model development, iii) design and implementation of the ABM, and iv) validation. A detailed explanation of the model process is provided by Dobbie & Balbi (2017). A number of improvements have since been made to the model, which is presented here using a summary of the Overview, Design and Details (ODD) protocol (Grimm et al. 2006; Grimm et al. 2010). The extended ODD protocol and model code are available online (https://www.openabm.org/model/5170/version/2/view).
Purpose
The purpose of the model is to simulate the behaviour of households within a village and observe the emerging properties of the system in terms of food security. The model draws upon the Sustainable Livelihoods Framework (Chambers & Conway 1991; Scoones, 1998) to consider food security outcomes of different livelihood strategies. A key aim of the model is to quantify the multiple dimensions of food security (namely food availability, access, utilisation and stability) at both the household and village level.
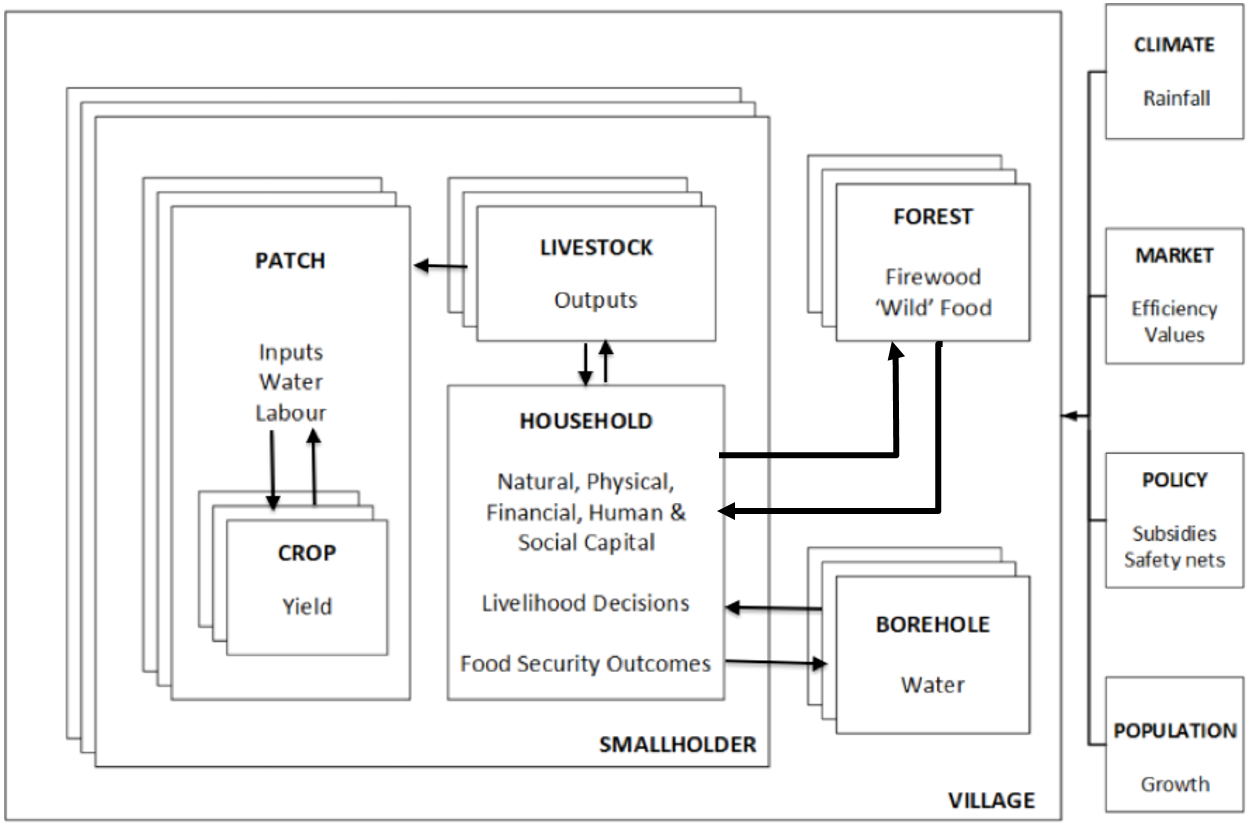
Households are the main entity and are divided into three types: i) farmers, ii) agricultural labourers and iii) non-agricultural workers. The main attributes of households include human, physical, natural and financial capital. Individuals belong to households and are defined by their gender, education, and age. Households and individuals are initialised using empirical data from the third household survey (IHS3) for Malawi (NSO 2012) and as a result are highly heterogeneous. The total number of households at initialization is 116: 73 farmers, 15 agricultural labourers and 28 non-agricultural workers. This is based upon the average number of households registered within villages in Southern Malawi in 2010 according to population data from MASDAP (http://www.masdap.mw/).
Households interact through a social network, which is modelled as a ‘small world’ with characteristically short average path lengths and high clustering (Watts & Strogatz 1998). The social network is used by the households to access labour opportunities and food donations. This assumption is based upon results from the IHS3 data combined with evidence from the literature (Gebremedhin et al. 2010; Spielman et al. 2011; Ligon & Schechter 2012; NSO 2012). Following the ‘small world’ assumption, the social network is initialized with an average degree (i.e. number of connections per household to access opportunities) of 9.5, an average path (i.e. shortest path between all pairs of households) slightly above 2 and an average clustering coefficient (i.e. the ratio of household’s connections that are connected among themselves) of 0.64.
The current environment represents a hypothetical village within Southern Malawi. Based upon IHS3 data, the village encompasses approximately 199 hectares made up of farmland, dimba [1], forest and water. At initialization farmland is set at around 60 ha (making it less than a hectare per farmer) while forest area is set at 135 ha in total. The environment is represented as a stylised 2D grid of patches with each patch corresponding to an area of land of variable size. Key attributes of the different patches include: size (in hectares), fertility (kg of fertiliser applied) and ownership. These are initialised using plot level data from the IHS3 (NSO 2012). Households can own both dimba and farm plots, whilst forests and water remain communal. The model runs on a monthly time-step. The location of patches and individuals or households has no effect on model outcomes as it is assumed that the village boundary is small enough for individuals (and households) to access farm plots, dimba and forest within any given month. Other entities are captured in Figure 2 and a more detailed description and justification of the state variables that characterise each entity is provided as part of model documentation online (see ODD available online).
Process, overview and scheduling
During each monthly time step households go through a sequence of processes from resource allocation to harvesting and adopting coping strategies which combine to give village-level outcomes in relation to land use, food production and food security status (Figure 3). During simulations described here, the model loops through 480 months, representing 40 years from 2010 to 2050. Each time-step begins by defining the month of the year and the corresponding agricultural season. Basic needs, defined in the IHS3 in the form of food, water and fuel, are then calculated for each of the households. Total labour availability (in hours per month) is also calculated for the household. This is based upon the household type, number of working adults, gender and health. Household labour is allocated between productive activities, including firewood collection, water collection, on-farm agricultural activities, off-farm agricultural activities and off-farm non-agricultural work. The proportion of time spent by the household on different productive activities is set according to household type using averages calculated from IHS3 data (NSO 2012).
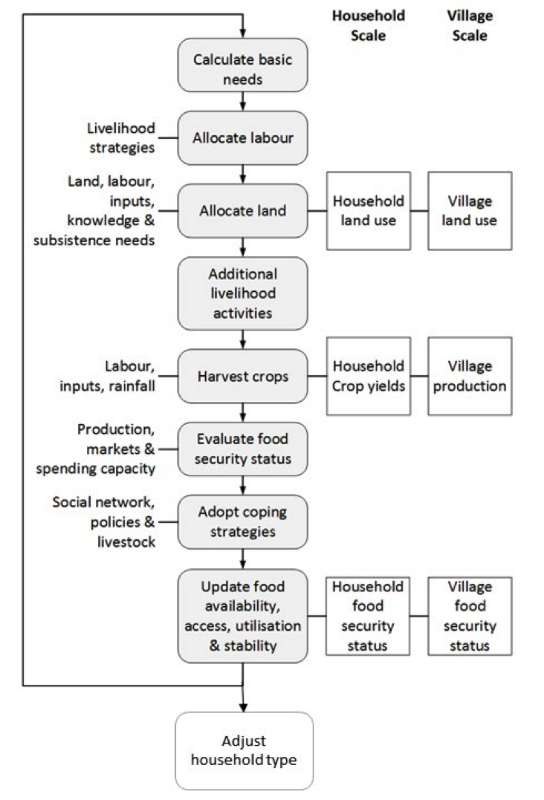
At the beginning of the agricultural season, households decide on which crops to grow. Eleven different combinations of basic grains, annual roots, permanent roots, nuts & pulses, fruit trees, vegetables and cash crops are possible. Decisions are constrained by land, labour, subsistence, input and knowledge requirements. In the months that follow, households are able to adjust land allocation decisions based upon labour availability. In addition to farming, households may also tend livestock, forage for wild and indigenous foods and carry out off-farm agricultural activities such as casual farm labour (ganyu) and non-agricultural employment.
Decisions surrounding the extraction of firewood and water are simulated using a modified version of a common pool resources model described by Agrawal et al. (2013). Time spent upon both casual labour and non-agricultural work is multiplied by an hourly wage estimated from household survey data. Output in calories for time spent foraging for ‘wild’ foods on the other hand, is drawn from a distribution consistent with ISH3 survey data. Time spent tending to livestock is also multiplied by an expected hourly output for meat, eggs, milk and manure. A further procedure for livestock then determines the proportions of outputs that are eaten, sold, or lost. It is assumed that all stored outputs are eaten within the monthly time step.
Towards the end of the time-step the four dimensions of food security, namely availability, access, utilisation and stability, are quantified for each household. Crop production is assumed to be affected by the availability of land and labour as well as rainfall. Food availability is determined based upon the amount of calories available from self-production and the market. The total number of calories from crops, livestock products and forage is first summed. Surplus calories are then calculated as the difference between food-needs and calories from food availability and spending capacity (the difference between household income and non-food expenses). If surplus is greater than zero it is divided into a calorie-pool that can be donated to members of a household’s social network. If surplus is less than zero it is converted into a calorie deficit.
Food access is defined by the amount of calories accessible from food production, market purchases and coping strategies. It is calculated as a sum of equivalent calories from food production, spending capacity, payment for work programmes, borrowing food from the social network and sale of livestock. The ability of a household to process this food dictates food utilisation. Potential calories are determined by food access. Actual calories can then be calculated by multiplying potential calories by the process-ability value. This is a percentage value that takes into account the proportion of water and fuel needs the household has met, as well as household health. Whether food needs of the household have been met or not is then determined and stocks of water and fuel are also updated.
Food stability is a function of market stability, political stability and production stability. Market stability is defined as the coefficient of variation (CV) in annual maize price: this dataset is provided as international market scenario (see the 2.30-2.32). Political stability is a global variable calculated as the mean of the CV of the proportion of households with access to inputs and the CV of households with access to payment for work schemes (Beegle et al. 2014). Production stability is a local variable calculated as the CV of household maize output for the given month. This allows multiple scales to be taken into account when evaluating food stability. Finally, food security is determined based upon food availability, access, utilisation and stability. Using techniques from fuzzy logic (Bosma et al. 2012; Zadeh 1996), each household returns a value between 0 and 100 with 0 being the lowest and 100, the highest (further details are given in the extended ODD available online).
A total of 12 time-steps constitute an agricultural season, running from June to May the following year. The livelihood strategy, or ‘type’ of a household may be adjusted at the end of an agricultural season. This is based upon the proportion of time allocated to farming, agricultural labour and non-agricultural work. In line with Dorward (2009), households persevering with the same livelihood strategy, or type are considered to be ‘hanging in’, those households who move to a type of higher yields and/or income compared to previous years are classified as ‘stepping up’ and households shifting into new, more productive activities are termed ‘stepping-out’. Households following a trajectory of declining yields and income are regarded to be ‘falling down’ (Figure 4).
Software environment
The model was implemented within Netlogo 5.2.1 (Wilensky 1990). Three model extensions have been used: array, network (Wilensky 1990) and NLfuzzy (Machálek et al. 2013).
Uncertainty analysis
Once constructed, we employed two techniques to explore model uncertainty. Firstly, consistency analysis provided an indication of the number of simulation runs necessary to reduce stochastic uncertainty. Secondly, we determined the effect of parameter estimation on simulation results (Alden et al. 2013).
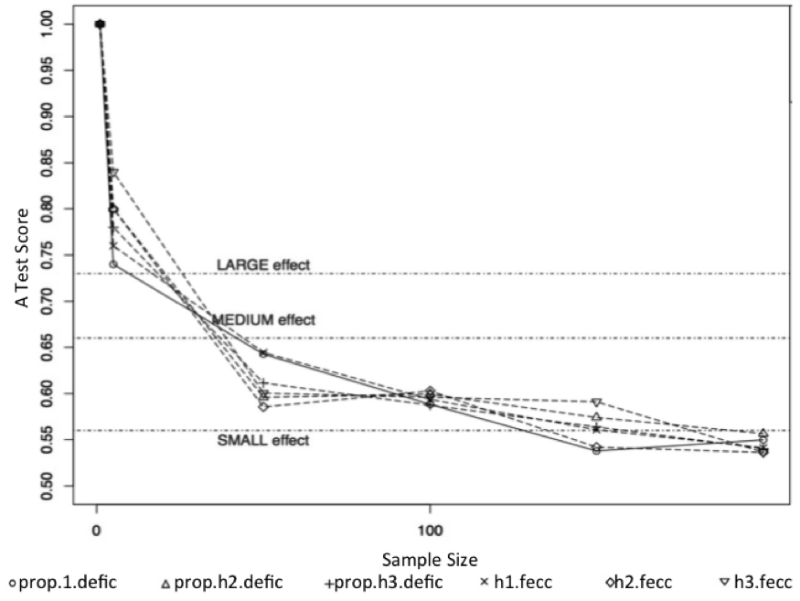
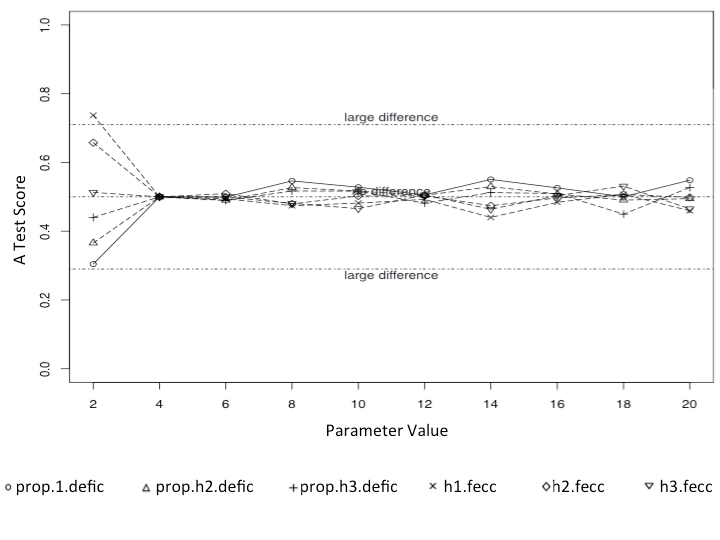
To conduct the consistency analysis, distributions of simulation outputs resulting from model runs using identical parameter values were compared using Simulation Parameter Analysis R Toolkit Application (SPARTAN) (Alden et al. 2013). The number of runs required to ensure statistical consistency of outcomes was determined by altering the number of replicates within each distribution. In this case, a total of 20 distributions were used and sample sizes of 5, 50, 100, 150 and 200 model runs were analysed. For a sample size of 5, each of the 20 distributions contained the results of 5 runs, etc. A distribution of median model outcomes responses for each simulation run was then generated for each of the 20 subsets. Distributions 2 to 20 were compared with the first distribution using the Vargha-Delaney A-Test. This is a non-parametric effect magnitude test that provides a statistical measure of the difference between two distributions (Vargha & Delaney 2000). Samples from two distributions were contrasted and the probability that a randomly selected sample from one distribution would be larger than a randomly selected sample from the other was calculated. In agreement with Vargha & Delaney (2000) A-Test scores above 0.71 or below 0.29 indicated a significant difference between distributions and 0.5 indicated no difference. A sample size was deemed suitable when no statistical difference was found between the first set of A-Test scores and the remaining 19 distributions.
The maximum A-Test score for each simulation outcome over the 20 result distributions is shown for all sample sizes analysed (Figure 5). Attention was paid to outcomes in the form of daily food energy consumption per capita (kcal per capita per day) and the proportion of calorie deficient households (%). Results are disaggregated based upon household type, namely farmers (h1), agricultural labourers (h2) and non-agricultural workers (h3). Results from the analysis implied that reducing the effect of stochastic uncertainty on simulation results to less than ‘small’ requires at least 200 model runs.
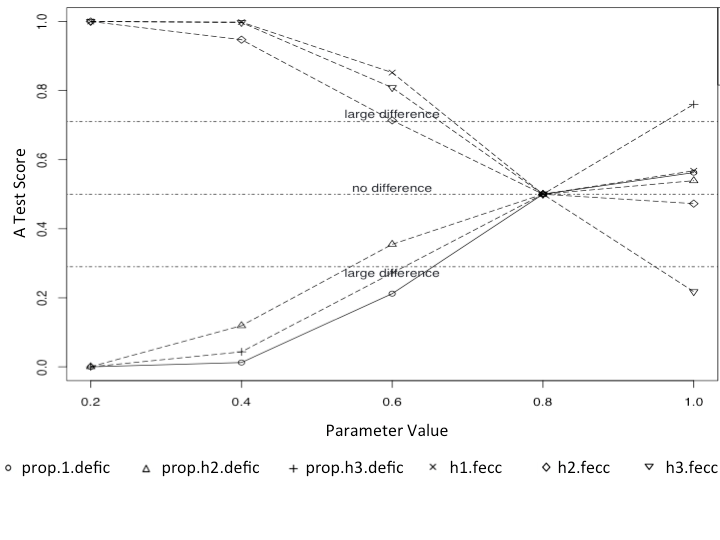
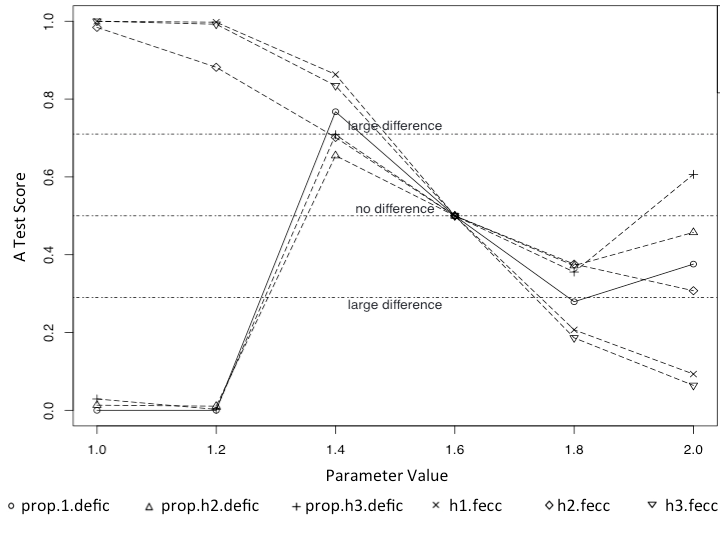
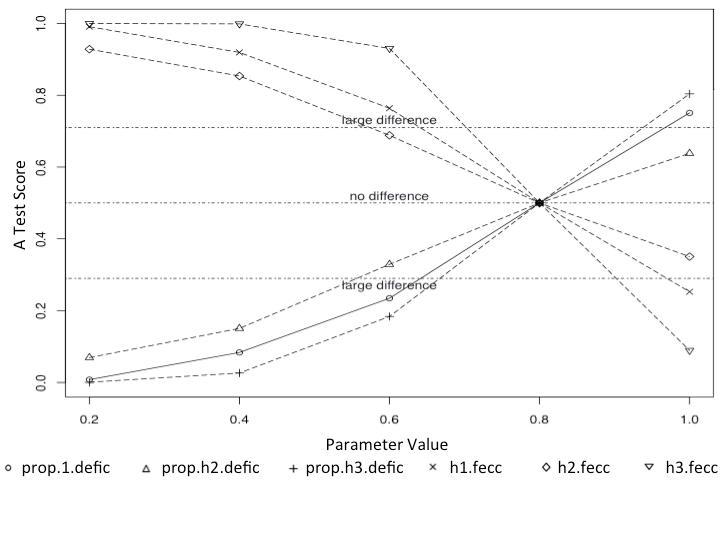
Five simulation parameters for which values are currently unknown were analysed for parameter robustness. These included: the number of times a household can call upon its social network for i) labour and ii) food in a given month, n-l-interact and n-f-interact, respectively; as well as the efficiency of markets m-efficiency, the availability of non-agricultural work nag-avail and multiplier, a value that limits the amount of calories individuals can consume in a given month. A local sensitivity analysis was conducted, perturbing each parameter independently of all others, which were maintained at baseline values (Table 1). Simulation outcomes under perturbed conditions could then be compared using the Vargha-Delaney A-Test described above (Vargha & Delaney 2000). If altering the value of a particular parameter from a baseline or calibrated value had a significant effect on simulator output, the simulation was deemed highly sensitive to that parameter and caution applied when interpreting the result and establishing a value for that parameter.
| Parameter | Description | Baseline Value | [min, increment, max] | A-test* |
| n-l-interact | The number of times a household can call upon its social network for labour in a given month. | 4 | [2,2,20] | ✘ |
| n-f-interact | The number of times a household can call upon its social network for food in a given month. | 2 | [2,2,20] | ✔ |
| m-efficiency | Adjusts the amount gained from sales and/or purchases of livestock and crops to take into account the efficiency of the market. | 0.8 | [0.2,0.2,1] | ✔ |
| nag-avail | Adjusts the amount gained from time allocated to non-agricultural work to take into account the availability of work. | 0.8 | [0.2,0.2,1] | ✔ |
| multiplier | Provides a limit to the amount of calories an individual is able to consume. | 1.6 | [1,0.2,2] | ✔ |
A significant effect on simulation responses was uncovered for four of the parameters, including: n-f-interact, m-efficiency, nag-avail and multiplier (see the Appendix for more details). The number of times a household can draw upon its social network for labour, n-l-interact had little effect on simulation outcomes, however.
Model validation
The model was validated using both qualitative and quantitative approaches during different stages of the design and implementation process. A role playing game was devised to test the behavioural rules underpinning key decision-based procedures within the ABM. A total of 14 experts associated with the ASSETS project took part in a two-day workshop convened in January 2015. Participants took on the role of a household and followed decision tree rules to allocate land to cropping strategies, interact with social networks to borrow/donate labour or food and update financial capital. Following the exercise, a discussion was facilitated to evaluate the behavioural rules of households and determine whether alterations to the model code were required.
The generic village-level model was parameterised using case study data. A total of 47 household agents were created, with attributes corresponding to the case study data. The model was run for 12 time-steps from May 2013 to June 2014, to reflect the data collection time-frame. Mean results from 200 model simulations were then compared with the empirical data, focusing on outcomes in the form of food security and land use at the household level (Figure 6).
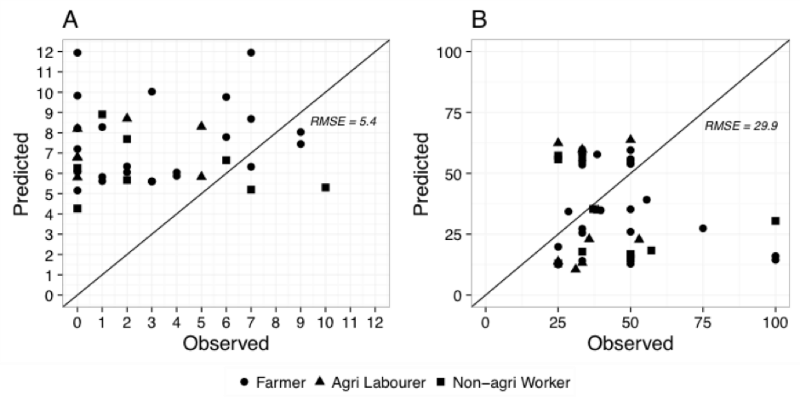
Initial results overestimated the number of months households are food insecure (Figure 6A). The root mean squared error (RMSE) was high at 5.4 months. While it would be possible to tune the model and reduce the RMSE, care needs to be exercised in interpreting the empirical data that the model is being compared with. The household food security data was compiled using an indicator based upon an individual’s perception of household food security. Jones et al. (2013) recognise experience-based measures of food security may result in a broad range of response bias. Changing environmental conditions may cause respondents to alter internal standards of food security, resulting in ‘response drift’ (Maes et al. 2009). One individual’s perception of food security may not be representative of the household and it may be difficult to ensure the definition of recall periods across respondents remains consistent (Jones et al. 2013). Further research should use additional survey instruments such as food diaries or household consumption and expenditure surveys to estimate food consumption and the actual food security status of households. This will enable further model fine-tuning and validation.
Model results for land allocation decisions were much closer to empirical data, although the number of single crop systems was significantly lower (Figure 6B). The percentage area of land given to grain crops was predicted with a RMSE of 29.9%. As with household food security data, land allocation data should be viewed with caution as measures of land allocation were based upon household recall and best guesses rather than empirical measurement. Future work will validate land allocation decisions against additional village case studies.
Scenarios
The model was run from June 2010 to May 2050. Over time, changes to climate, markets and population were projected. Climate variability was represented by annual rainfall. At the beginning of each model year, a value is drawn from a list of rainfall data. This list was generated using MarkSim, a third-order Markov rainfall generator that can be employed as a Global Climate Model (GCM) downscaler (Jones & Thornton 2013). Daily rainfall projections for Malawi were generated from 2010 to 2050. This was based upon the average output of 17 GCMs using the RCP2.6 scenario, as defined by the IPCC (Van Vuuren et al. 2011). Daily values were then aggregated to give an estimate of annual rainfall.
Village-level population growth was approximated using rural population projections from the 2014 revision of world urbanisation prospects (UN 2015). As projections consider the number of individuals only, the growth in household numbers at the village level had to be estimated. This was achieved using the simple equation:
| $$hh = rpop * prop / hhsize $$ | (1) |
The local market prices for 11 food categories are provided as input to the agent-based model at initialisation. The model stores the annual market price of these commodities starting at 2010 for the following 40 years. The market value of crops and livestock products such as milk, eggs and meat play an important role within the model. Changes over time are simulated using two well established global models: AGLINK-COSIMO (OECD & FAO 2015) and GCAM4.0 (Capellán-pérez et al. 2014; Kyle et al. 2011). The stability of food is an emergent property of market, political and production stability. Under the current scenario, although political stability remains fixed throughout, market prices are assumed to exhibit annual variation. For example, the price of grains per kg is projected to increase from 0.3 USD in 2015, to 0.7 USD by 2050.
Results and Discussion
Modelling of community food security
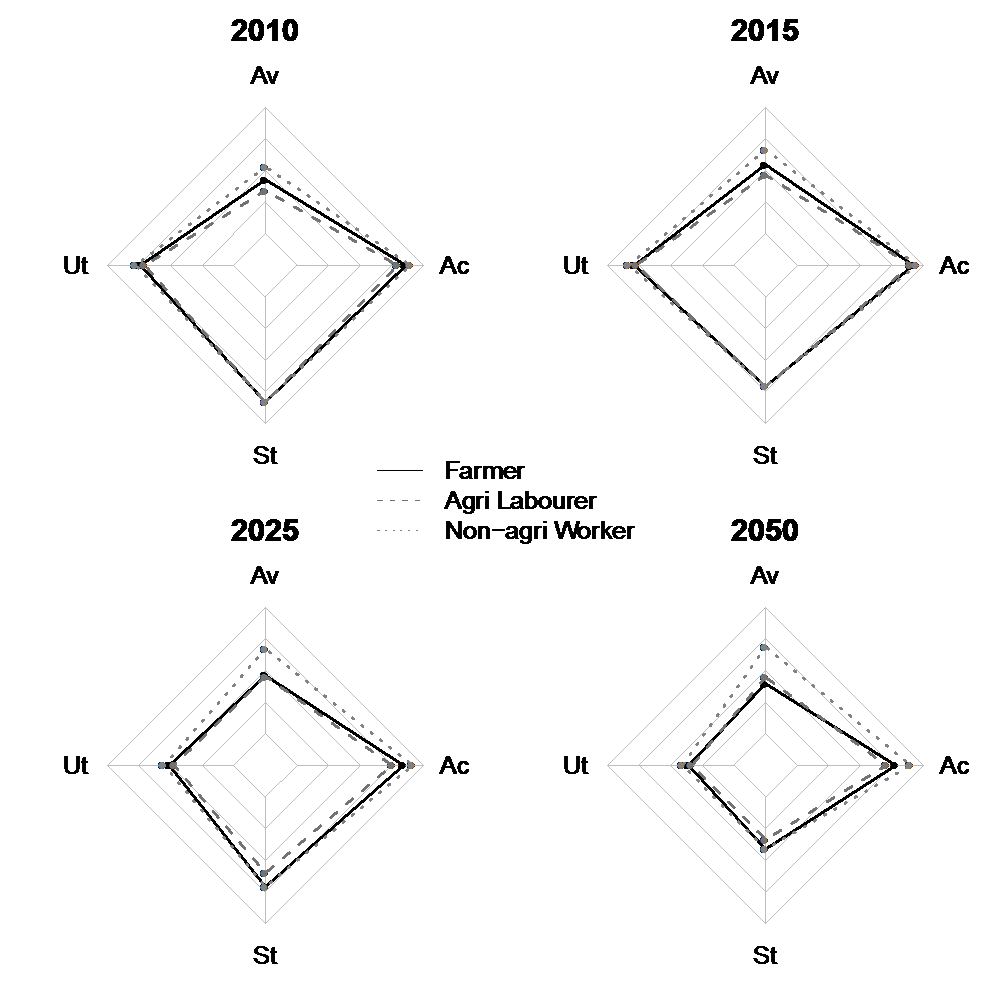
The four pillars of food security were quantified for each household and are summarized at the village level for farmers, agricultural labourers and non-agricultural workers (Figure 7). Overall, non-agricultural workers tend to have greater food availability, access, utilisation and stability when compared with farmers and agricultural labourers. Taking into account population growth, rainfall variability and market projections, the availability and access dimensions of food security remain stable between 2010 and 2050. Large declines in utilisation and stability of food however, are anticipated for all households by 2050. Such reductions are the result of increased exploitation of the natural resource base over time.
Indeed, the ability of households to utilise food is dependent upon access to sufficient amounts of water and fuel as well as a household’s health and wellbeing. Model outputs suggest that the proportion of household water needs met could decline from 92% in 2010 to 44% in 2050. This is due to increased demand for water as the population increases.
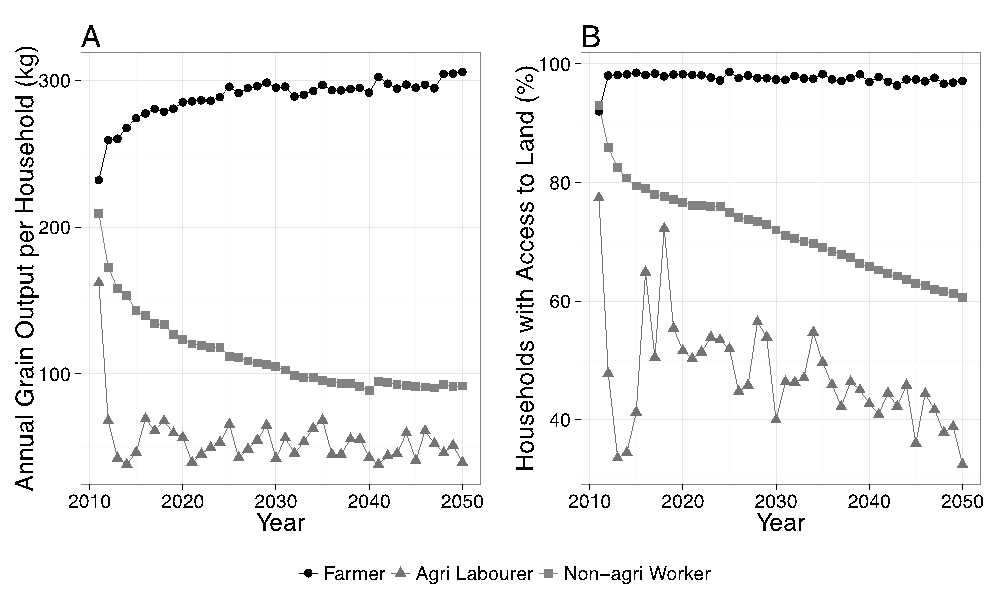
Simulation outputs show large variation in the production of grains over time (Figure 8A). Non-agricultural workers are projected to experience a sharp decline in grain output between 2011 and 2030. During this period the mean quantity of grain produced falls from 209.3 kg to 104.8 kg. Agricultural labourers also experience a severe drop in grain output, which fluctuates between 38.3 kg and 69.4 kg from 2012 onwards. Average annual grain output for farmers on the other hand, increases from 232.1 kg in 2011 to over 300 kg by 2050. Results for grain output reflect changes in the proportion of households with access to land (Figure 8B), highlighting the importance of land tenure to food security outcomes over time.
Although non-agricultural workers display higher food security in our simulations, community food security can only exist when all residents obtain a safe, culturally acceptable, and nutritionally adequate diet (Hamm & Bellows 2003). Efforts must therefore be made to target policies and development programs towards improving the sustainability of livelihoods based upon farming and agricultural labour.
Knowledge of livelihood strategies and food security outcomes at the community level generated by this research may help build shared understanding and capacity for action. Practice of community food security is in its infancy, however interesting parallels can be made to the African Millennium Villages. Since the year 2000, a total of 78 Millennium Villages have been initiated in 12 sites in 10 African countries (Sanchez et al. 2007). Science-based research and interventions at the community level are suggested to have enabled food energy requirements of households to be met (Sanchez et al. 2007).
Complementing existing national and district-level conceptualisations of food security with village level perspectives could address scale mismatches present within social-ecological systems. National policies and regulations that are effective over larger geographical scales can have unintentional consequences at finer scales in which local conditions may differ significantly from the mean (Cumming et al. 2006). By taking a bottom-up approach and exploring how social-ecological interactions lead to the emergence of community food security, it is possible to take heterogeneity into account and develop context specific solutions. At the same time further research could look into the challenges and opportunities for scaling up the model for regional policy exploration.
The household livelihood trajectories
The shift in household trajectories (as outlined in Figure 4) over time can also be demonstrated (Figure 9). Sustainable livelihoods are expected to be resilient to shocks and stresses over time. The number of households ‘falling down’ into a less food secure category is projected to be minimal at less than 1% overall (Figure 9A). Farmers tend to ‘hang-in’ or ‘step-up’ within their category rather than ‘stepping-out’ to become non-agricultural workers (Figure 9B). Agricultural labourers, on the other hand, appear the least stable. The proportion of households ‘hanging-in’ fluctuates over time. Only a small number of agricultural labourers ‘step-up’, instead the vast majority ‘step-out’ to become farmers or non-agricultural workers (Figure 9C). None of the non-agricultural workers were found to ‘fall-down’ into less food secure livelihood strategies, between 2010 and 2050. However, the proportion of such households ‘stepping-up’ declines from almost 60% in 2010 to just 32% in 2050 (Figure 9D).

The dynamic nature of household livelihoods can be linked to trends in land access (Figure 8B). Over time increasing numbers of agricultural labourers step out to become non-agricultural workers. These households tend to own less land and the ability to acquire new land is constrained by the area of fallow and forest remaining. As the population grows between 2010 and 2050, the proportion of households with access to land declines by approximately 20%. In this context, non-agricultural workers were the most resilient to shocks and stresses over time. Farmers were the most likely to fall-down and adopt a less food secure livelihood strategy when compared with other households, however the proportion was low with a mean value of just 1.4% from 2011 to 2050.
These model outcomes reflect empirical findings described by Falconnier et al. (2015) for Southern Mali. Here, between 1994 and 2010, 70% of households chose to ‘hang-in’. A number of technical options were proposed by the authors to avoid stagnation of the agricultural sector and promote trajectories that ‘step-up’ over time. These included increasing access to farm equipment, promoting mixed cropping strategies with legumes and the intensification of milk production (Falconnier et al. 2015). Within Malawi, the ability of non-agricultural workers to step-up, may also be promoted by improved access to credit, better infrastructure and more employment opportunities (Castaing Gachassin et al. 2015; Swaminathan et al. 2010). By following household trajectories, the model provides a systemic view that addresses the dynamics of agri-food systems within Malawi. According to Thompson and Scoones (2009) by understanding critical feedbacks across multiple scales, effective responses to social-ecological interactions can be designed.
In this article we focussed on the impact of exogenous factors such as rainfall and population growth. However, the agent-based model described here can provide a virtual environment through which different policies and development narratives could be explored. For instance, the potential of land tenure reforms (Holden & Otsuka 2014) and the development of land rental markets (Chamberlin & Ricker-Gilbert 2016) to increase efficiency and equity could be investigated. The ability of sustainable agricultural intensification to increase food production and reduce negative environmental impacts (Pretty 2008) through agroforestry, conservation agriculture, integrated pest management and aquaculture (Pretty et al. 2011) could also be evaluated. In addition, the role of social security policies, such as conditional cash transfers and school feeding programmes, to alleviate food insecurity of the most vulnerable community members (Devereux 2016) could be considered.
Model limitations
By quantifying food availability, access, utilisation and stability, the model enables the impact of exogenous factors on the multidimensional nature of food security to be explored. Rainfall variability and population growth, for instance, were linked to declines in food utilisation and stability over time.
Climate was characterised within the model by annual rainfall. In addition to changes in rainfall frequency and intensity, climate change in sub-Saharan Africa is anticipated to cause temperature increases, along with more frequent shocks and stresses in the form of droughts and floods (McSweeney et al. 2008). This will shorten growing seasons, reduce the area of land suitable for agriculture and lead to declines in agricultural yield (Schlenker & Lobell 2010; Vizy et al. 2015; Dube et al. 2016). Currently such factors are out of the scope of the model as yield is calculated using regression equations, which take into account the accumulation of labour, fertiliser and rainfall. However, there is potential for incorporating additional climatic variables to better explore the impact of climate change upon community food security.
A number of simplifications were made when modelling population dynamics. Population growth for example, was represented by the addition of households at the end of the simulated year. Existing households remained with the same number and age of individuals as before. This means that the current model does not fully capture age structure, fertility, mortality and migration. Future work should expand on the role of household demographics upon food security.
Despite model simplifications, simulation outputs were found to correspond closely with observations and theories documented within the literature. Within Malawi, the proportion of young people is set to increase over time (UN 2015). As the number of young adults rises, the inheritance of land, long considered a birth right of rural individuals, will become ever more problematic (Jayne et al. 2014). In the simulation, population growth was negatively correlated with land access: as the number of households increased from 116 in 2010 to 263 in 2050, the proportion of households with access to land declined from 90.3% to 74.6%.
According to Jayne et al. (2014), behavioural responses of households to land scarcity can be divided into five main trajectories: i) intensification of land use; ii) shifting labour to rural non-farm activities, iii) migration to other rural areas, iv) migration to urban areas and v) reduction in fertility rates. The simulation was able to reproduce the first two trajectories. Population growth was met with a reduction in the area of land left to fallow. Within Malawi this is recognised as a common repercussion of land intensification (Headey & Jayne 2014). Regarding shifting labour patterns, model outputs show the proportion of non-agricultural workers increased from 24% in 2010 to 61% in 2050. Such findings are supported by a recent study which found population density had a significant effect upon off-farm income per capita (Ricker-Gilbert et al. 2014). Analysis of panel data by Christiaensen & Todo (2014) also uncovered a link between shifting to off-farm activities and poverty reduction.
The current model does not take into account migration and fertility rates due to poor data availability. Regarding migration, both Jayne et al. (2014) and Ricker-Gilbert et al. (2014) found little evidence of increased migration under greater population density (see also Englund 2002, and Suckall et al. 2015). The response of fertility rates is also uncertain for Malawi. A recent study found that, whilst achieved fertility rates did not differ significantly between high density countries such as Benin, Ethiopia and Malawi, and low density countries (e.g. Niger, Tanzania and Zambia), the fertility rates desired by African women decrease with increasing population density (Headey & Jayne 2014).
Benefits of the modelling approach
The main benefit of the proposed modelling approach is the ability to produce fine scale and relatively detailed micro-simulation of a rural community with limited use of local scale data. This is possible by building the generic model on largely available national longitudinal household surveys and integrating village data at the parameterisation stage. We regard this as a relevant methodological contribution to a major issue of agent-based modellers working on data-scarce agro-ecological environments (e.g. Saqalli et al. 2010), and more specifically, as a possible resolution to the tension between the lack of a minimum amount of reliable and checkable information and the need for individual-centered, empirical, and descriptive representation of complex social-ecological systems. The possibility to limit the need for scarce finer-scale data has tremendous implications for the potential replicability of this methodology in other low-data availability contexts. For example, within Sub Saharan Africa, the Living Standards Measurement Study has aided the design and implementation of household surveys within a number of countries (Malawi, Burkina Faso, Ethiopia, Mali, Niger, Nigeria, Tanzania and Uganda) (Grosh & Glewwe 1998). The data collected in each project country is publicly available. Using our approach, such district data sets could be supplemented with quick and unexpansive assessments in village field studies to allow the construction of micro-level agent-based models of community food security within a wide range of contexts.
A second major benefit of the modelling approach is the ability to deliver a credible model. Indeed, in order to be useful to decision makers, model outputs must be credible. A key strength of our methodological approach is the ability to explore model uncertainty and validity. Using the SPARTAN R package (Alden et al. 2013) in combination with Netlogo enabled two techniques to be operationalised, namely consistency analysis and parameter robustness. Both quantitative and qualitative approaches were used to validate the model. Comparison of simulation outputs with empirical data uncovered inconsistencies between food security indicators. The model consistently overestimated the number of months that households were food insecure. However, this may be explained by a disparity between actual and perceived food security status as reported by the model and the survey data, respectively. Additional data sets should be used to verify and validate the model further. Combining qualitative efforts with quantitative validation has proved beneficial especially because promoting dialogue with stakeholders during role-playing exercises ensured model fit not only to the data, but also to its intended purposes.
Conclusion
This study provides a methodological approach for the development of an agent-based model to assess community food security. Issues associated with data scarcity were alleviated by using a typology-based approach—driven by empirical data-informed identification of representative household types based upon shared attributes and livelihood strategies—that enables models to be built using district level data that tends to be richer and more readily available. This can then be supplemented with village level data to tailor policies and development programmes. The model takes into account the multi-dimensional nature of food security. Availability, access, utilisation and stability dimensions are quantified and can be summarized at both the household and community level. The trajectories of households can also be traced over time. The model is validated in a strategic manner, using both quantitative and qualitative approaches to ensure the simulation tool can reproduce real-world data and also be of use to stakeholders. Model uncertainty is tackled to ensure credibility and ensure the model is fit for decision-making purposes. Future work could focus on exploring household demographics further, as well as using the model to investigate different strategies to enhance community food security. Attempts could be made to validate the model against additional data sets as well as consider how assessments of community food security can guide the design and targeting of policy and development programmes in practice. The creation of agent-based models represents a potentially powerful tool that communities and stakeholders could use to ensure all community residents obtain a safe, culturally acceptable, nutritionally adequate diet through a sustainable food system that maximizes self-reliance and social justice.
Acknowledgements
SD was supported by an EPSRC Doctoral Training Centre grant (EP/G03690X/1). MS provided the village-level data collected under an ESPA Early Career Fellowship Grant (FELL-2014–104) with support from the Ecosystem Services for Poverty Alleviation (ESPA) programme. The expert workshop was organized with the support of the ‘Attaining Sustainable Services from Ecosystems using Trade-off Scenarios’ project (ASSETS; http://espa-assets.org/; NE-J002267-1), which is also funded with support from ESPA. The ESPA programme is funded by the Department for International Development (DFID), the Economic and Social Research Council (ESRC) and the Natural Environment Research Council (NERC). SB was supported by two grants: BizkaiaTalent, Marie Curie Actions (People, Grant agreement nº 267230) and Juan de la Cierva incorporación (Grant IJCI-2014-22590).Notes
- Farm plots typically found in areas bordering streams and rivers. Residual moisture means they can be cultivated during the dry season from April to October.
Appendix: Parameter Robustness

References
AGRAWAL, A., Brown, D.G., Rao, G., Riolo, R., Robinson, D.T. & Bommarito, M. (2013). Interactions between organizations and networks in common-pool resource governance. Environmental Science & Policy, 25, 138-146. [doi:10.1016/j.envsci.2012.08.004 ]
ALDEN, K., Read, M., Timmis, J., Andrews, P. S., Veiga-Fernandes, H., & Coles, M. (2013). SPARTAN: a comprehensive tool for understanding uncertainty in simulations of biological systems. PLoS Computational Biology, 9(2), e1002916.
BALBI S., & Giupponi, C. (2010). Agent-Based Modelling of Socio-Ecosystems: A Methodolgy for the Analysis of Adaption to Climate Change. International Journal of Agent Technologies and Systems, 2(4), 17–38. [doi:10.4018/jats.2010100103 ]
BALBI, S., Bhandari, S., Gain, A. K., & Giupponi, C. (2013). Multi-agent agro-economic simulation of irrigation water demand with climate services for climate change adaptation. Italian Journal of Agronomy, 8(3), 23.
BEEGLE, K., Galasso, E., & Goldberg, J. (2014). Direct and indirect effects of Malawi’s public works program on food security. Journal of Development Economics, 128, 1-23.
BOSMA, R., van den Berg, J., Kaymak, U., Udo, H., & Verreth, J. (2012). A generic methodology for developing fuzzy decision models. Expert Systems with Applications, 39(1), 1200–1210.
BURCHI, F., & Muro, P. De. (2016). From food availability to nutritional capabilities : Advancing food security analysis. Food Policy, 60, 10–19. [doi:10.1016/j.foodpol.2015.03.008 ]
CAIRNS, J. E., Hellin, J., Sonder, K., Araus, J. L., MacRobert, J. F., Thierfelder, C., & Prasanna, B. M. (2013). Adapting maize production to climate change in sub-Saharan Africa. Food Security, 5(3), 345–360.
CAPELLÁN-PÉREZ, I., González-Eguino, M., Arto, I., Ansuategi, A., Dhavala, K., Patel, P., & Markandya, A. (2014). New climate scenario framework implementation in the GCAM integrated assessment model. BC3 Working Paper Series 2014-04.
CARLETTO, C., Zezza, A., & Banerjee, R. (2013). Towards better measurement of household food security: Harmonizing indicators and the role of household surveys. Global Food Security, 2(1), 30–40.
CASTAING GACHASSIN, M., Najman, B., & Raballand, G. (2015). Roads and diversification of activities in rural areas: A Cameroon case study. Development Policy Review, 33(3), 355–372. [doi:10.1111/dpr.12111 ]
CHAMBERLIN, J., & Ricker-Gilbert, J. (2016). Participation in Rural Land Rental Markets in Sub-Saharan Africa: Who Benefits and by How Much? Evidence from Malawi and Zambia. American Journal of Agricultural Economics, 98(5), 1507-1528.
CHAMBERS, R., & Conway, G. (1991). Sustainable rural livelihoods: practical concepts for the 21st century. IDS Discussion Paper, 296, 29.
CHILONGO, T. (2014). Livelihood strategies and forest reliance in Malawi. Forests, Trees and Livelihoods, 23(3), 188–210.
CHISINGA, B., & Chasukwa, M. (2012). Youth, Agriculture and Land Grabs in Malawi. IDS Bulletin, 43(6), 67–77. [doi:10.1111/j.1759-5436.2012.00380.x ]
CHRISTIAENSEN, L., & Todo, Y. (2014). Poverty reduction during the rural-urban transformation - The role of the missing middle. World Development, 63, 43–58. [doi:10.1016/j.worlddev.2013.10.002 ]
CONNOLLY-BOUTIN, L., & Smit, B. (2015). Climate change, food security, and livelihoods in sub-Saharan Africa. Regional Environmental Change, 16(2), 385–399.
CUMMING, G., Cumming, D. H., & Redman, C. (2006). Scale mismatches in social-ecological systems: causes, consequences, and solutions. Ecology and Society, 11(1). [doi:10.5751/ES-01569-110114 ]
DE SHERBININ, A., Vanwey, L., Mcsweeney, K., Henry, S., & Hunter, L. M. (2008). Rural household demographics, livelihoods and the environment. Global Environmental Change, 18(1), 38–53.
DEVEREAUX, S. (2016). Social protection for enhanced food security in sub-Saharan Africa. Food policy, 60, 52-62. [doi:10.1016/j.foodpol.2015.03.009 ]
DOBBIE, S. and Balbi, S. (2017). 'Design of an Empirical Agent-Based Model to Explore Rural Household Food Security Within a Developing Country Context.' In W. Jager et al. (Eds.), Advances in Social Simulation 2015 (pp. 81-94). Cham: Springer.
DOBBIE, S. (2016). The potential of agent-based modeling as a tool to unravel the complexity of household food security: a case study of rural Southern Malawi (Doctoral dissertation, University of Southampton). Retrieved from: https://eprints.soton.ac.uk/412710/.
DORWARD, A., Anderson, S., Bernal, Y., Vera, E., Rushton, J., Pattison, J., & Paz, R. (2009). Hanging in, stepping up and stepping out: livelihood aspirations and strategies of the poor. Development in Practice, 19(2), 240–247.
DUBE, T., Moyo, P., Ncube, M., & Nyathi, D. (2016). The Impact of Climate Change on Agro-Ecological Based Livelihoods in Africa: A Review. Journal of Sustainable Development, 9(1), 256. [doi:10.5539/jsd.v9n1p256 ]
ENGLUND, H. (2002). Ethnography after globalism : migration and emplacement in Malawi. American Ethnologist, 29(2), 261–286.
EPSTEIN, J. M. (1999). Agent-Based Computational Models and Generative Social Science. Complexity, 4(5), 41–60. [doi:10.1002/(SICI)1099-0526(199905/06)4:5<41::AID-CPLX9>3.0.CO;2-F ]
EPSTEIN, J. M., & Axtell, R. (1996). Growing artificial societies: social science from the bottom up. Washington, DC: Brookings Institution Press.
FALCONNIER, G. N., Descheemaeker, K., Van Mourik, T. A., Sanogo, O. M., & Giller, K. E. (2015). Understanding farm trajectories and development pathways: Two decades of change in southern Mali. Agricultural Systems, 139, 210–222. [doi:10.1016/j.agsy.2015.07.005 ]
FINE, D., van Wamelen, A., Lund, S., Cabral, A., Taoufiki, M., Dörr, N., Leke, A., Roxburgh, C., Schubert, J., & Cook, P. (2012). Africa at work: Job creation and inclusive growth. McKinsey Global Institute.
FOLBERTH, C., Yang, H., Gaiser, T., Liu, J., Wang, X., Williams, J., & Schulin, R. (2014). Effects of ecological and conventional agricultural intensification practices on maize yields in sub-Saharan Africa under potential climate change. Environmental Research Letters, 9(4), 044004. [doi:10.1088/1748-9326/9/4/044004 ]
FUNTOWICZ, S., & Ravetz, J. (1990). Uncertainty and quality in science for policy (Vol. 15). Springer Science & Business Media (Vol. 15). Springer Science & Business Media.
GEBREMEDHIN, L., Bezabih, M., & Gebreegziabher, Z. (2010). Local Social Networks, Shocks and Rainfall Patterns in the Highlands of Ethiopia. EfD Ethiopia Working Paper.
GONDWE, G. (2014). 2014 Millennium Development Goal Report for Malawi. Lilongwe.
GRIMM, V., Berger, U., Bastiansen, F., Eliassen, S., Ginot, V., Giske, J., Goss-Custard, J., Grand, T., Heinz, S. K., Huse, G., Huth, A., Jepsen, J. U., Jørgensen, C., Mooij, W. M., Müller, B., Pe’er, G., Piou, C., Railsback, S. F., Robbins, A. M., Robbins, M. M., Rossmanith, E., Rüger, N., Strand, E., Souissi, S., Stillman, R. A., Vabø, R., Visser, U. & DeAngelis, D. L. (2006). A standard protocol for describing individual-based and agent-based models. Ecological modelling, 198(1), 115-126. [doi:10.1016/j.ecolmodel.2006.04.023 ]
GRIMM, V., Berger, U., DeAngelis, D.L., Polhill, J.G., Giske, J., & Railsback, S.F. (2010). The ODD protocol: a review and first update. Ecological modelling, 221(23), 2760-2768. [doi:10.1016/j.ecolmodel.2010.08.019 ]
GROSH, M. E., & Glewwe, P. (1998). Data Watch The World Bank’ s Living Standards Measurement Study Household Surveys. The Journal of Economic Perspectives, 12(1), 187–196. [doi:10.1257/jep.12.1.187 ]
HAMM, M., & Bellows, A. (2003). Community Food Security and Nutrition Educators. Journal of Nutrition Education and Behavior, 35(1), 37–43.
HEADEY, D. D., & Jayne, T. S. (2014). Adaptation to land constraints: Is Africa different? Food Policy, 48, 18–33. [doi:10.1016/j.foodpol.2014.05.005 ]
HEADEY, D., & Ecker, O. (2013). Rethinking the measurement of food security: from first principles to best practice. Food Security, 5(3), 327–343.
HOLDEN, S. T., & Otsuka, K. (2014). The roles of land tenure reforms and land markets in the context of population growth and land use intensification in Africa. Food Policy, 48, 88–97. [doi:10.1016/j.foodpol.2014.03.005 ]
JANSSEN, M., & Ostrom, E. (2006). Empirically Based, Agent-based models. Ecology and Society, 11(2), 37.
JAROSZ, L. (2014). Comparing food security and food sovereignty discourses. Dialogues in Human Geography, 4(2), 168–181. [doi:10.1177/2043820614537161 ]
JAYNE, T. S., Chamberlin, J., & Headey, D. D. (2014). Land pressures, the evolution of farming systems, and development strategies in Africa: A synthesis. Food Policy, 48, 1–17.
JONES, A., Ngure, F., Pelto, G., & Young, S. (2013). What are we assessing when we measure food security? A compendium and review of current metrics. Advances in Nutrition, 4(5), 481–505. [doi:10.3945/an.113.004119 ]
JONES, P. G., & Thornton, P. K. (2013). Generating downscaled weather data from a suite of climate models for agricultural modelling applications. Agricultural Systems, 114, 1–5.
KAISER, M. L. (2011). Food Security: An Ecological-Social Analysis to Promote Social Development. Journal of Community Practice, 19(1), 62–79. [doi:10.1080/10705422.2011.550261 ]
KAMANGA, P., Vedeld, P., & Sjaastad, E. (2009). Forest incomes and rural livelihoods in Chiradzulu District, Malawi. Ecological Economics, 68(3), 613–624.
KNOX, J., Hess, T., Daccache, A., & Wheeler, T. (2012). Climate change impacts on crop productivity in Africa and South Asia. Environmental Research Letters, 7(3), 34032. [doi:10.1088/1748-9326/7/3/034032 ]
KYLE, P., Emamuel, B., Luckow, P., Nathan, M., Calvin, K. V., & Zhou, Y. (2011). GCAM 3.0 Agriculture and Land Use: Data Sources and Methods. Richland, Washington.
LIGON, E., & Schechter, L. (2012). Motives for sharing in social networks. Journal of Development Economics, 99(1), 13–26. [doi:10.1016/j.jdeveco.2011.12.002 ]
MACHÁLEK, T., Cimler, R., Olševičová, K., & Danielisová, A. (2013). Fuzzy Methods in Land Use Modeling for Archaeology. Proc. of 31st International Conference on Mathematical Methods in Economics 2013, Jihlava, Part II, 552–557.
MAES, K. C., Hadley, C., Tesfaye, F., Shifferaw, S., & Tesfaye, Y. A. (2009). Food insecurity among volunteer AIDS caregivers in Addis Ababa, Ethiopia was highly prevalent but buffered from the 2008 food crisis. The Journal of Nutrition, 139(9), 1758–64. [doi:10.3945/jn.109.108548 ]
MCCULLUM, C., Desjardins, E., Kraak, V., Ladipo, P., & Costello, H. (2005). Evidence-Based Strategies to Build Community Food Security. Journal of the American Dietetic Association, 105(2), 278–283.
MCSWEENEY, C., New, M., & Lizcano, G. (2008). UNDP climate change country profiles Malawi. National Communications Support Programme. Retrieved from: http://www.geog.ox.ac.uk/research/climate/projects/undp-cp/.
NSO (2012). Integrated Household Survey 2010/11 (IHS3): National Statistical Office, Lilongwe. Retrieved from: http://microdata.worldbank.org/index.php/catalog/1003.
OECD & FAO (2015). Aglink-Cosimo Model Documentation: A partial equilibrium model of world agricultural markets. Secretary-General of the OECD. Retrieved from: : http://www.agri-outlook.org/about/.
ORR, A., Mwale, B., & Saiti-Chitsonga, D. (2009). Exploring Seasonal Poverty Traps: The “Six-Week Window” in Southern Malawi. The Journal of Development Studies, 45(2), 227–255. [doi:10.1080/00220380802265330 ]
PINSTRUP-ANDERSEN, P. (2009). Food security: definition and measurement. Food Security, 1, 5–7. [doi:10.1007/s12571-008-0002-y ]
PRETTY, J. (2008). Agricultural sustainability: concepts, principles and evidence. Philosophical Transactions of the Royal Society of London. Series B, Biological Sciences, 363(1491), 447–65.
PRETTY, J., Toulmin, C., & Williams, S. (2011). Sustainable intensification in African agriculture. International Journal of Agricultural Sustainability, 9(1), 5–24. [doi:10.3763/ijas.2010.0583 ]
REILLY, M., & Willenbockel, D. (2010). Managing uncertainty: a review of food system scenario analysis and modelling. Philosophical Transactions of the Royal Society of London. Series B, Biological Sciences, 365(1554), 3049–3063.
RICKER-GILBERT, J., Jumbe, C., & Chamberlin, J. (2014). The impact of increasing population density on African agriculture and livelihoods: the case of Malawi. Food Policy, 48, 114–128. [doi:10.1016/j.foodpol.2014.02.006 ]
ROBINSON, D. T., Brown, D. G., Parker, D. C., Schreinemachers, P., Janssen, M. A., Huigen, M., Wittmer, H., Gotts, N., Promburom, P., Irwin, E., Berger, T., Gatzweiler, F. & Barnaud, C. (2007). Comparison of empirical methods for building agent-based models in land use science. Journal of Land Use Science, 2(1), 31–55.
SANCHEZ, P., Palm, C., Scahs, J., Denning, G., Flor, R., Harawa, R., … Zamba, C. (2007). The African Millenium Villages. Proceedings of the National Academy of Science (PNAS), 104(43), 6775–16780. [doi:10.1073/pnas.0700423104 ]
SAQALLI, M., Bielders, C. L., Gerard, B., & Defourny, P. (2010). Simulating rural environmentally and socio-economically constrained multi-activity and multi-decision societies in a low-data context: a challenge through empirical agent-based modeling. Journal of Artificial Societies and Social Simulation, 13(2), 1: https://www.jasss.org/13/2/1.html.
SCHMIDHUBER, J., & Tubiello, F. N. (2007). Global food security under climate change. Proceedings of the National Academy of Sciences, 104(50), 19703. [doi:10.1073/pnas.0701976104 ]
SCOONES, I. (1998). Sustainable Rural Livelihoods a Framework for Analysis. IDS Working Paper, 72, 1–22.
SALHEY C., Groelsema, B., Marchione, T., & Nelson, D. (2005). The governance dimensions of food security in Malawi (Vol. 20), Washington, DC: USAID.
SMAJGL, A., & Bohensky, E. (2013). Behaviour and space in agent-based modelling: Poverty patterns in East Kalimantan, Indonesia. Environmental Modelling & Software, 45, 8–14. [doi:10.1016/j.envsoft.2011.10.014 ]
SMAJGL, A., Brown, D. G., Valbuena, D., & Huigen, M. G. A. (2011). Empirical characterisation of agent behaviours in socio-ecological systems. Environmental Modelling & Software, 26(7), 837–844.
SPIELMAN, D. J., Davis, K., Negash, M., & Ayele, G. (2011). Rural innovation systems and networks: Findings from a study of Ethiopian smallholders. Agriculture and Human Values, 28(2), 195–212. [doi:10.1007/s10460-010-9273-y ]
SUCKALL, N., Fraser, E., Forster, P., & Mkwambisi, D. (2015). Using a migration systems approach to understand the link between climate change and urbanisation in Malawi. Applied Geography, 63, 244–252.
SWAMINATHAN, H., Salcedo Du Bois, R., & Findeis, J. L. (2010). Impact of access to credit on labor allocation patterns in Malawi. World Development, 38(4), 555–566. [doi:10.1016/j.worlddev.2009.11.002 ]
TAKANE, T. (2008). Customary Land Tenure, Inheritance Rules, and Smallholder Farmers in Malawi. Journal of Southern African Studies, 34(November), 269–291.
THOMPSON, J., & Scoones, I. (2009). Addressing the dynamics of agri-food systems: an emerging agenda for social science research. Environmental Science and Policy, 12(4), 386–397. [doi:10.1016/j.envsci.2009.03.001 ]
TITTONELL, P. (2014). Livelihood strategies, resilience and transformability in African agroecosystems. Agricultural Systems, 126, 3–14.
UN (2015). World Urbanisation Prospects. The 2014 revision. The Population Division of the Department of Economic and Social Affairs of the United Nations. Retrieved from: http://esa.un.org/unpd/wup/.
VALBUENA, D., Verburg, P. H., & Bregt, A. K. (2008). A method to define a typology for agent-based analysis in regional land-use research. Agriculture, Ecosystems & Environment, 128(1-2), 27–36.
VALBUENA, D., Verburg, P. H., Bregt, A. K., & Ligtenberg, A. (2010). An agent-based approach to model land-use change at a regional scale. Landscape Ecology, 25(2), 185–199. [doi:10.1007/s10980-009-9380-6 ]
VAN VUUREN, D. P., Edmonds, J., Kainuma, M., Riahi, K., Thomson, A., Hibbard, K., … Rose, S. K. (2011). The representative concentration pathways: An overview. Climatic Change, 109(1), 5–31.
VARGHA, A., & Delaney, H. D. (2000). A critique and improvement of the CL common language effect size statistics of McGraw and Wong. Journal of Educational and Behavioral Statistics, 25(2), 101–132.
VERBURG, P. H., Dearing, J. A., Dyke, J. G., Leeuw, S. van der, Seitzinger, S., Steffen, W., & Syvitski, J. (2016). Methods and approaches to modelling the Anthropocene. Global Environmental Change, 39, 328-340.
VIZY, E. K., Cook, K. H., Chimphamba, J., & McCusker, B. (2015). Projected changes in Malawi’s growing season. Climate Dynamics, 1673–1698. [doi:10.1007/s00382-014-2424-x ]
WATTS, D.J., & Strogatz, S.H. (1998). Collective dynamics of "small-world" networks. Nature, 393(6684), 440–442. [doi:10.1038/30918 ]
WILENSKY, U. (1990). Netlogo. Evanston, IL. Retrieved from: http://ccl.northwestern.edu/netlogo/.
SCHLENKER, W., & Lobell, D. B. (2010). Robust negative impacts of climate change on African agriculture. Environmental Research Letters, 5(1), 14010. [doi:10.1088/1748-9326/5/1/014010 ]
ZADEH, L. (1996). Fuzzy logic equals Computing with words. IEEE Transactions on Fuzzy Systems, 4(2), 103–111.