
Introduction
Local communities have been opposing mining operations in spite of the importance of mining to human life and the local economy. Local communities’ perceptions affect whether a mine has the social license to operate (SLO), which is defined as the communities’ approval of a project, on an ongoing basis (Thomson & Boutilier 2011; Boutilier 2011). SLO dictates the social risk surrounding the success of resource projects, and affects a project’s sustainability impacts (e.g. SLO is closely related to the sustainability concept of free, prior and in-formed consent). Gaining and maintaining social license to operate is a mitigating factor against possibly ex-pensive conflicts, and the associated business risk (Mo at & Zhang 2014; Prno 2013). Studies have shown that lack of community acceptance has led to political and social unrest (Prno 2013; Prno & Slocombe 2012; Thomson & Boutilier 2011; Browne et al. 2011), which increases the cost of doing mining business (Mo at & Zhang 2014; Davis & Franks 2011). A mining project, from permitting through to mine closure, has a higher chance of success (both economic and sustainability-related success) if the local community grants SLO. Thus, all stakeholders must give the needed attention to these political and social issues to ensure sustainable development of mineral resources
The fact that the environmental, social and economic impacts of mining change over time is one of the main challenges to understanding the socio-political risks posed to mining business by the lack of SLO. This is be-cause the community’s perceptions of the mining project change as the mine’s impacts, and the community’s own demographics change over time. Such changes contribute to the complexities in predicting a community’s acceptance[1] of a mining project (Que et al. 2015). Nevertheless, mine managers have to deal with these risks by understanding and anticipating changes in the host community’s perceptions about a mining project due to changes in perceptions of the environmental, social and economic impacts.
The effect of information diffusion on perceptions is considered to be a key determinant in understanding changes in community's perceptions over time (Maillé & Saint-Charles 2014). Changes in community’s perception of the impacts and characteristics of the mine can be viewed as diffusion of information through a social network (Goldenberg et al. 2001). Hence, modeling changes in perception resulting from information diffusion can be useful in understanding changes in community's opinions of mining projects over time.
Some researchers have applied agent-based modeling together with social network concepts to model changes in perceptions as a result of word-of-mouth (Awuah-Offei et al. 2017; Boateng & Awuah-Offei 2017; Sobkowicz 2009; Suo & Chen 2008). However, these agent-based models are responsive to several key input parameters such as network parameters, diffusion model parameters and initial conditions. In practice, acquiring these parameters can be cumbersome and expensive while estimating them based on assumptions can lead to un-certainties in the modeling results. In an attempt to understand the uncertainties surrounding the modeling results when estimates of these parameters are used in the model, researchers should ascertain the sensitivity of the model results to these parameters.
This work investigates the responsiveness of an agent-based model (ABM) for predicting changes in community acceptance of a mining project as a result of information diffusion (Boateng & Awuah-Offei 2017) to key input parameters. The parameters explored in this work are average degree (number of friends), close neighbor ratio (a parameter used in the ABM to model homophily) and number of early adopters ("innovators"). The authors used a two-level full factorial experiment to investigate the responsiveness of the model to these parameters (Saltelli & Annoni 2010).
Sensitivity analysis of agent-based models is challenging because these models are non-linear, multi-level and have emergent properties (Ten Broeke et al. 2016). Some of the approaches for performing sensitivity analysis in the literature are: one-factor-at-a-time, local and global sensitivity analysis (Thiele et al. 2014; Saltelli & Annoni 2010; Ten Broeke et al. 2016). The one-factor-at-a-time approach is applicable so long as the model is linear and non-additive. Also, local analysis is valid if the model is linear (for the case of first order derivatives) or at least additive (for the case of higher and cross order derivatives) (Saltelli & Annoni 2010). In agent-based modeling, the interactions between the agents are non-linear (Ten Broeke et al. 2016; Scholl 2001). For this reason, global sensitivity analysis, which relies on statistical theory is the most appropriate for ABM (Saltelli et al. 2008; Saltelli & Annoni 2010).
As discussed above, sensitivity analysis is important to make informed decisions to balance the cost of studies to obtain accurate estimates of key parameters and the uncertainty related to estimates based on assumptions. Besides Awuah-Offei et al. (2017), we are not aware on any work that evaluates the sensitivity of agent-based models of changes in community's perceptions of large projects (including mining projects) due to changes in perception of environmental, social and economic impacts of the projects. This work differs from Awuah-Offei et al. (2017) in three material respects. First, the model presented in that paper does not account for changes in agent demographics over time. Second, that paper models homophily in the social network based on all attributes of the agent whereas the model in this paper models homophily based on the agent’s residence (i.e. homophily as a result of proximity). Finally, the diffusion models are different. Whereas Awuah-Offei et al. (2017) use a model that incorporates both probabilities of innovation and imitation, the model in this work only incorporates imitation. Thus, one of the key parameters in this work, initial number of adopters is not a parameter in their model. Similarly, probability of innovation, which is a key parameter in their model is not a parameter in this model. Given these distinctions, the responsiveness of this model to its key parameters, two of which are different from the three key parameters in Awuah-Offei et al. (2017), deserves to be presented on its own. This will provide stakeholders who prefer this model to the model presented by Awuah-Offei et al. (2017) the same information. This also contributes to further discussion of the uncertainties surrounding such ABM results and informs future research and models.
This paper is organized as follows: Section 2 describes the community acceptance model; Section 3 discusses the sensitivity analysis; Section 4 presents and discusses the results; and Section 5 presents the conclusions.
modeling Community Acceptance
All the previous studies that have used ABM and social network theory to evaluate the effect of word-of-mouth on changes in perceptions are based on the premise that agent utility functions remain valid over the simulation period (Awuah-Offei et al. 2017; Boateng & Awuah-Offei 2017; Sobkowicz 2009; Suo & Chen 2008). Utility functions are valid when they are based on sound decision theory that captures the relevant factors affecting an individual’s preference for a particular alternative (e.g. of mine projects) in the presence of other alternatives. Discrete choice theory has been employed to study the preferences of individuals in the local community for mine project alternatives (Ivanova & Rolfe 2011; Que 2015; Ivanova et al. 2007). Hunt et al. (2007) have shown that discrete choice models are capable of producing agent's utility function in ABM. This work uses agent's utility functions derived from a discrete choice model of individual's preferences for mining project alternatives. The model in this work aims to understand the effect of information diffusion on the level of community acceptance for a mining project over time. The model attempts to estimate, at any given point in time, the level of acceptance of the mining project depending on agents’ interaction and attributes, which comprises demo-graphic (e.g. age, gender, income level, etc.) and non-demographic (i.e. perceptions of the project) attributes. We achieved this by using utility functions based on discrete choice models and the Bass model for diffusion over social networks. This model was implemented in MATLAB 7.7 2014.
The main assumptions of the modeling framework are that it assumes:
- The influence of other agents (individuals) who live outside the mining community under consideration on the preferences of agents in the community is negligible (i.e. boundary condition);
- The effect of other variables, besides those captured in the utility function (the so-called unobserved variables in discrete choice theory), on individual's preferences are negligible;
- Information diffusion is primarily through word of mouth and the effect of other forms of information transfer are negligible; and
- All agents have similar roles in the information diffusion process (i.e. all agents are open to new information and can influence others).
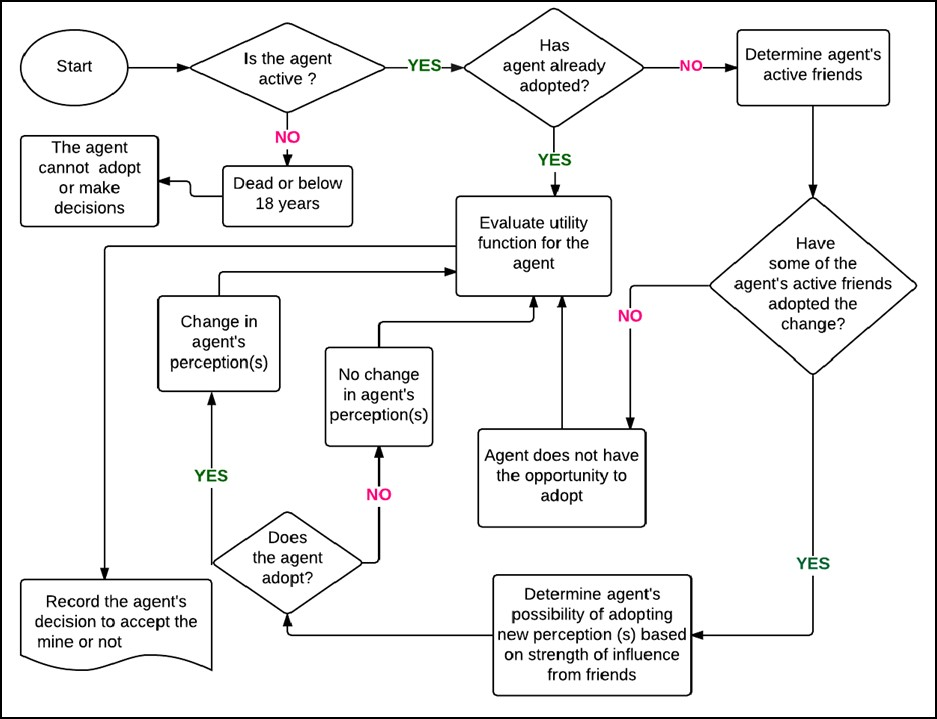
The general framework can be represented by the following algorithm:
The algorithm initializes agents at the onset of each iteration. At this stage, agents are created with different attributes (demographic and non-demographic attributes). The two important state variables for this model are the "decision" and "preference" variables. The decision variable describes whether the agent is part of the decision makers (above 18 years and alive) or not (below 18 years or dead). The agent's preference state, on the other hand, depicts whether the agent prefers the proposed mining project to the status quo or not. Some attributes are dynamic, which means they change over time. For instance, age and agent’s decision state (at-tained 18 years, or alive /dead) change over time. Such attributes are updated at every time step. For the model to predict the effect of information diffusion on community acceptance, at the minimum, one non-demographic attribute has to be dynamic and be affected by information diffusion over a social network. The model is run for a number of iterations to sufficiently estimate the output from Monte Carlo Simulation, which addresses stochasticity in the model.
Agents
An agent is defined as a discrete, autonomous entity with its own goals and behaviors, which it can adapt and modify (Macal & North 2006). Agents are described by their attributes. In this model, agents denote people living in the local mining community. The factors that influence individual’s preference for a mine vary from one scenario to the other. This suggests that the number and type of attributes in the model will depend on the number and type of factors that are significant in predicting an individual's preference.
From discrete choice theory, an individual’s utility (or payoff) for alternative \(a\) (\(U_a\)), and the odds of selecting alternative \(a\) over \(b\) (\(OR_{ab}\)) are given by Equations 1 and 2, respectively, based on the conditional logit model. \(\beta_j\) is the taste coefficient related to attribute \(j\); \(X_j\), the variable for attribute \(j\); \(\epsilon_a\) is the random unobserved component, and \(n\) is the number of attributes relevant to the choice. The odds ratio, which is the ratio of the probability of an individual with particular demographic characteristics selecting alternative \(a\) over alternative \(b\), under specific conditions, is used as the decision criteria in this model (Equation 2). The agent prefers an alternative to the status quo, if its odds ratio is greater than one (Boateng & Awuah-Offei 2015, 2014).
| $$ U_a=\Big\{\sum_1^n\beta_j X_j+\epsilon_a \Big\} $$ | (1) |
| $$OR_{ab}=exp\Big\{\sum_1^n\beta_j(X_j^a-X_j^b) \Big\}$$ | (2) |
The odds ratio is estimated at each time step for every agent participating in the decision. The odds ratio is used to determine the agents’ preference state, which determines whether or not they prefer the simulated mining project to the status quo or not. Agent's preferences are tabulated by the algorithm to estimate the level of community acceptance (percentage of agents participating in the decision that prefer the simulated mining project) at that time step.
The user is expected to provide the model with the required distributions of the various agent attributes. At the initialization stage, the agents are assigned initial values of the demographic attributes using Monte Carlo Sampling. (It is important to note that, although the model has the ability to incorporate correlation in the Monte Carlo sampling, the case study in this work does not consider potentially correlated input variables since correlation coefficients are not available in Que’s work.) Every agent is assigned demographic attributes by randomly sampling from the given distributions to imitate the true distribution of the attributes. On the other hand, the non-demographic attribute values are assigned to the agents deterministically based on the specific simulated mining project. This method assumes that all agents have the same perception of the status quo and simulated alternative at time zero.
There are three categories of dynamic agent attributes: (i) attributes that are a direct function of time (e.g. age); (ii) attributes that are a function of events that occur over time (e.g. number of children); and (iii) attributes that change due to interaction with other agents (e.g. an agent’s number of "active friends"[2]). Attributes that are a function of time are updated depending on their relationship with time. For instance, agent’s age is updated by adding the time step to the previous age. Attributes that are a function of events that occur over time are updated dependent on whether those events occur or not in the model. Agent's network (topology) and diffusion process influence attributes that change due to interactions with other agents. The network and diffusion processes are discussed in the subsequent sections.
In this work, agents’ death is modeled using the death rate distribution over the age of the agents. Monte Carlo sampling is used to establish whether an agent is dead or not at every time step. Dead agents are excluded from the pool of decision makers by assigning "0" to their decision state variable. On the contrary, the decision state variables are set to "1" for those agents who are living (i.e. decision makers). As discussed earlier, during initialization, the ages of agents are simulated using Monte Carlo sampling, depending on the age distribution given by the user. As the simulation advances, agents are incorporated into the decision pool as they attain 18 years when ages are updated at every time step.
In this model, the agents have 20 (16 non-demographic and 4 demographic) attributes that are used to evaluate the utility function in accordance with Que et al. (2015). The four demographic attributes are age, gender, level of education and annual income. The 16 non-demographic attributes center on economic, environmental, social and other factors relevant to the problem (e.g. life of the project, decision making mechanism for permit approval).
Agent network
Through a network: (i) an agent interacts with a subsection of agents that it is connected to, known as the agent’s neighbors; and (ii) local information is obtained from interactions with an agent’s neighbors. Several networks with different characteristics have been defined in the literature (Newman 2003). It is important that modelers choose a network that is appropriate for a particular model (Kiesling et al. 2012).
In this work, we use a static network where connections are defined at the commencement of the simulation and remain unchanged (Macal & North 2010). Nonetheless, each iteration uses a newly simulated network. We used a static network because the model concentrates on changes to the level of acceptance owing to information diffusion. The network employed in this model can be any network that accurately describes social networks by which information about mine characteristics and impacts spreads through a community. Only qualitative descriptions of such networks exist in the literature (Boutilier 2011). Consequently, we made reasonable assumptions about such networks by using other social networks used to describe information diffusion in a variety of social interactions (Newman 2003).
This work uses a random graph algorithm that is altered to account for homophily (i.e. a higher possibility that individuals will be connected to other individuals who are similar to them). The most basic source of homophily is proximity, and people (agents, in this scenario) are more likely to have contact with those who are closer to them in geographic location than those who are distant (McPherson et al. 2001). The agent’s location (postal zip codes) is used as the criterion for modeling homophily. A zip code is assigned to an agent using Monte Carlo sampling from the zip code distribution over a given population. Agents are classified as "similar" if the difference between their zip codes is equal to or less than a "proximity" value defined by the modeler. Random networks have a binomial degree distribution (distribution of number of neighbors/friend is binomial) with probability of a connection, \(\gamma\). The authors modified the algorithm to change the probability of a connection between two agents by a ratio, \(\alpha\) (0 < \(\alpha\) <1) to allow a higher probability of connection between similar agents relative to dissimilar agents. Consequently, the probability of a connection was \(\alpha\)\(\gamma\) for pairs of similar agents and (1 - \(\alpha\)\(\gamma\)) for pairs of dissimilar agents.
Given the static network described here, the estimates of \(\gamma\) (i.e. average number of friends) and \(\alpha\) (close neighbor ratio) for a specific use are vital. This is because these parameters describe the nature of the social network. Hence, the model output is likely to be sensitive to these parameters. However, there is no data in the literature to allow an accurate estimation of these parameters when applying this social network to model the effect of diffusion of information on mining projects acceptance in mining community. And research to acquire data from which to estimate these parameters will be expensive and time consuming.
For the base case simulation in this work, the authors defined the "proximity" value as zero in this work. This means that agents are similar if they have the same zip code. Additionally, the probability was selected to be 50 divided by the number of agents (i.e. average number of friends of 50). We assumed the average number of friends to be 50 based on the fact that a social group size of 30 to 50 individuals is considered a typical size of social group such as overnight camps or a band society (Hill & Dunbar 2003; Zhou et al. 2005). To ensure homophily, \(\alpha\) which is termed the "close neighbor ratio", was set to 0.75.
Diffusion model
In this work, changes in perceptions are modeled as a diffusion process over a social network (i. e. word of mouth information transfer). The authors used the Bass model instead of other models such as SIR ("Susceptible, infected, removed") and SIS ("Susceptible, infected, susceptible") models. We used the Bass model because it agrees with the premise of this work. The Bass model hypothesizes that diffusion of innovation, as a contagion across network nodes (or agents), is random and the probability of becoming "infected" depends on the number of neighbors that an agent has and the state of those neighbors (Jackson 2008). The model accounts for the rate at which agents innovate or spontaneously adopt, and the rate at which they imitate other agents or adopt because others in their neighborhood have. Similarly, we assume that the probability of a person adopting the new perception of a mine’s social or socio-economic impact depends on the number of friends that person has and a stochastic process that is a function of the proportion of friends who have adopted the new perception. We assume that agent's innovation or spontaneous adoption is insignificant, which means diffusion is mainly by word of mouth (Buttle 1998; Rezvani et al. 2012). Thus, this model is limited to situations where there is no significant innovation and other factors such as public education and advertising which may drive changes in attitudes independent of social diffusion.
Due to this assumption, the number of agents who have this new perception (innovators or early adopters) should be specified as part of the initial conditions. It is important to note that adoption in this model is through imitation resulting from unidirectional (i.e. the model only allows interaction where the early adopters of the new perceptions convince agents who have not yet adopted to change their perception) word of mouth (Lilien et al. 2007). The model does not take into account bidirectional word of mouth information transfer.
We acknowledge that there are other information diffusion paradigms besides the simple diffusion model in our work, which are captured in other ABM research (e.g. Abdollahian et al. 2013). For instance, Berlo et al. (1969) proposed a model that describes how a receiver’s likelihood of receiving/accepting a message depends on whether they are exposed to it or not, their attentiveness, and their disposition to the sentiment of the message. Also, Social Judgment Theory postulates that the likelihood of an agent accepting a piece of information depends on the "distance" between the positions of the two agents involved in the communication (Siero & Doosje 1993). Other researchers have noted that the likelihood of an agent accepting a message also increases with repetition and the use of various channels of communication (Corman et al. 2007).
The framework in this work considers some aspects of these theories but not all. The probability of an agent in our model accepting the new information increases with time due to repeated communication. Similar to Berlo’s model, agents in our model cannot accept positions they are not exposed to through their network. Also, the agents can be described as attentive to agents in their network who communicate the new information. However, our model does not account for the disposition of an agent to the information they are exposed to. For example, if 20% of an agent’s "friends" have accepted the new information, that agent has the same probability of accepting the information regardless of their position on the proposed mining activity. Also, our model does not account for "distance" between the agents involved in the communication.
Regardless of these differences, we believe the framework presented here is adequate to explore the effect of information diffusion on dynamics of social license to operate in mining and makes a significant contribution to the discussion on social imperatives of mining. The algorithm used to update the agents’ perceptions of the mine’s impacts at every time step is presented in Figure 1. The main aspects of the algorithm are how to determine: (i) the agent’s active friends; and (ii) the probability that an agent will adopt.
The statuses of an agent’s friends are evaluated to establish whether they are active or not. If some of the agent’s active friends have adopted the new perception, then it is essential to assess the agent’s possibility of adopting the new perception based on strength of influence from his friends (Figure 1). In this study, the agent’s adoption decision follows the product adoption model in Equation 3 (Bonabeau 2002). Thus, a new perception’s (similar to a new product’s) value Vto the agent depends on the number of agents who have adopted it, N, in a total population of NT agents. \(\rho\) is the fraction of the population that has adopted the new perception, \(\theta\) is a characteristic value, and \(d\) is an exponent that determines the steepness of the function. \(\theta\) and d are set to 0.4 and 4, respectively, according to Bonabeau (2002).
| $$V(N)=V(\rho)=\frac{(1+\theta^d)\rho^d}{\rho^d+\theta^d}$$ | (3) |
V can be calculated for each agent if \(\rho\) modeled as the ratio of number of active friends who have adopted the new perception to total number of active friends. V is used to simulate the probability of the agent adopting the new perception in this study. Monte Carlo sampling is then used to decide whether or not the agent adopts the new perception in the current time step.
Calibration, validation and base case experiment
It is practically and scientifically difficult to validate ABM because it is unusual to have the empirical data for full validation (Klügl & Bazzan 2012). In order to completely validate an agent-based model with empirical data, researchers have to observe agents’ state at every discrete time step in a carefully documented scenario (Windrum et al. 2007). This data is often not available. This is the case in this work too. The available data (data from Salt Lake City, Utah, USA) is from a survey that only surveyed community residents at a particular time and pro-vides no data over time. We decided to validate the ability of the model to predict the level of acceptance at the initial time step with the data from Salt Lake City, Utah, USA (Que 2015). There was no need to calibrate the model input relevant to the initial level of acceptance since all input data for this experiment can be obtained from Que’s work and census data. Other input data (e.g. social network and diffusion model parameters) will require calibration in order to estimate reasonable input since these input are difficult to acquire with surveys. However, in order to calibrate these model input, we need data like Que’s data at different times in the same community. Such data does not exist at the moment. Hence, we chose to evaluate the sensitivity of the model to such input so as to understand how they affect the model output.
Que (2015) performed a discrete choice experiment (survey) in Salt Lake City to understand the determinants of individual's preferences within the local community related to mining projects [3]. In the survey, she asked respondents a series of demographic questions and also asked to indicate their preferred alternative from each of a series of choice sets (a set of mine development options). Que estimated the taste coefficients using a strata conditional logit model (Table 1) for the data from the respondents. We used these coefficients as the coefficients in Equations 1 and 2 to define agent's preferences based on the four demographic and 16 non-demographic attributes she found to be relevant. Tables 2, 3 and 4 show the demographics of the respondents to Que’s survey.
In validating the agent based model (at time \(t = 0\)), we modeled the level of acceptance of the base case alternative in Que (2015). We used data from Que (2015) as input to model for the demographic attributes of the agents (Tables 2, 3 and 4). In the experiments in this work, the ratio of male and female agents was equal.
For all non-demographic attributes, we used the same numeric codes used by Que to ensure the utility function is valid. For these attributes, Que used codes 1, 2 and 3, where 2 represented the base case alternative. There-fore, all non-demographic attributes are maintained at code 2 in the validation experiment. Tables 5 interprets code 2 for each of the 16 attributes (Que 2015).
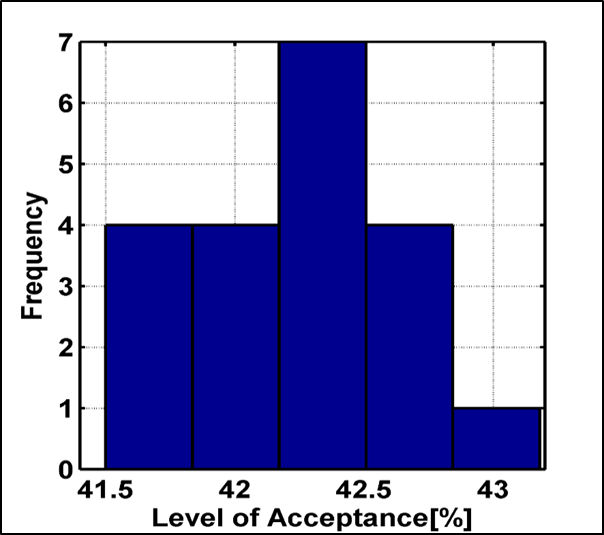
We used these inputs to carry out an experiment with 20,000 agents and 20 iterations to predict the level of acceptance for the base case alternative. Note that this experiment did not evaluate dynamic changes. We used 20,000 agents to balance the computational cost and a desire to achieve a reasonable coefficient of variation (1.6% for the validation experiment, which is below our target of 5%) after 20 iterations. The validation results (Figure 2) indicate that the mean level of acceptance for the base case alternative is 42.4%. Forty-four percent of the respondents in Que’s work selected this alternative. We admit that, basically, this experiment merely shows that the ABM predicts levels of acceptance consistent with the underlying utility function, which is based on Que’s discrete choice model. However, this still provides some confidence in the predictions of the ABM and its usefulness for exploring changes in the level of community acceptance. We did not aim to validate the diffusion model since there is no data available in the literature to validate the results. Nonetheless, there are many examples attesting to the fact that diffusion models based on the Bass model have been successful in demonstrating change in perceptions (Wu et al. 2015; Dodds 1973).
We also conducted a base case experiment to demonstrate how this model can be used to examine how, in a particular mining community, interactions between people, in the presence of changing perceptions of mine impacts, can influence acceptance of the mining project. The experiment assesses how an improvement in residents’ perception of air pollution levels (this is a highly visible impact in Salt Lake City as the particulate emissions are visible in the community) can affect their acceptance of the mining project. The level of air pollution is modeled to have improved by 1 on the scale used by Que (2015)[4]. As part of the initial conditions, all agents living in one specific zip code (this zip code makes up 3.6% of the population) were considered early adopters of the new perception of improvement in the air pollution condition.
| Attribute | Coefficient |
| Demographic attributes | |
| Age | 0.0028 |
| Gender | -0.0093 |
| Annual income | 0.0021 |
| Education | 0.0017 |
| Age | -0.0093 |
| Non-demographic attributes (Economic) | |
| Job opportunities | 1.3886 |
| Income increase | 1.2541 |
| Increase in housing costs | -1.7527 |
| Labour shortage for other business | -0.1117 |
| Non-demographic attributes (Environmental) | |
| Noise pollution | -1.6794 |
| Water pollution and shortage | -0.3471 |
| Land pollution and subsidence | -0.2707 |
| Non-demographic attributes (Social) | |
| Population increase | -0.257 |
| Infrastructure improvement | 1.1575 |
| Traffic increase | -0.1742 |
| Crime increase | -1.6939 |
| Non-demographic attributes (Governance and others) | |
| Permit approval decision making mechanism | -1.6939 |
| Crime increase | 0.2028 |
| Availability of information | 1.2606 |
| Mine buffer | 1.2141 |
| Mine life | 0.1402 |
| Code | Level of education | % Population |
| 1 | Less than high school | 14 |
| 2 | High school/GED | 18 |
| 3 | Some college, Vocational, or 2 year college degree | 27 |
| 4 | Bachelor’s degree and higher | 41 |
| Code | Annual Income | % Population |
| 1 | $5,000-$20,000 | 22 |
| 2 | $20,000-$39,000 | 23 |
| 3 | $40,000-$59,000 | 18 |
| 4 | $60,000-$200,000 | 37 |
| Code | Age group (years) | % Population |
| 1 | 18 to 25 | 18 |
| 2 | 26 to 34 | 26 |
| 3 | 35 to 54 | 31 |
| 4 | 65 to 120 | 12 |
| Environmental variable | Interpretation |
| Job opportunities | 600 people employed directly by the mine |
| Income increase | +$300 per month |
| Increase in housing cost | 5% increase every year in 10 years |
| Labour shortage for other business | Other businesses take longer to fill vacancies but don’t have to pay more |
| Noise pollution | Same as similar mine in the area |
| Water pollution and shortage | Same as similar mine in the area |
| Air pollution | Same as similar mine in the area |
| Population increase | Same as similar mine in the area |
| Infrastructure improvement | Moderate improvement |
| Traffic increase | Same as current rate |
| Crime increase | Same as current rate |
| Permit approval decision making mechanism | Final decision by government agency after significant public input |
| Availability of independent and transparent information on potential impacts of mine | Information reported/verified by government agency |
| Mine buffer (Home distance from mine) | 10 miles |
| Mine life | 30 years |
The same discrete choice model and input data in Tables 1, 2, 3, 5 were used for this experiment. Given that these experiments incorporate a dynamic simulation of the influence of information diffusion through the social network, extra input data including death rates and a comprehensive age distribution was necessary (Table 6). This age distribution and death rates are based on Salt Lake City demographics and death rate data for 2013 (National Center for Health Statistics 2014).
Besides, the model needs the time step per interaction as an input. The time step, in this case, is the time it takes for meaningful interaction between the agents on an issue possible. We set time step per interaction to 0.1 years (10 interactions on this subject per year). We assumed this rate of interaction was reasonable to represent frequent interaction. For instance, Friedman (2015) considers monthly meetings (12 meetings in a year) for two hours to be optimal to convene a wisdom circle involving members from the same neighborhood or part of the town. It is worth noting that, this experiment evaluated the changing level of acceptance over a four year period. We believe that this duration is short enough to maintain the validity of the discrete choice model.
| Age group (years)[5] | Percentage in population | Number of deaths |
| 0 to 17 | 22.6 | 47 |
| 18 to 24 | 13.4 | 99 |
| 25 to 34 | 20.2 | 218 |
| 35 to 54 | 24.4 | 667 |
| 55 to 64 | 9.7 | 780 |
| 65 to 120 | 9.7 | 4311 |
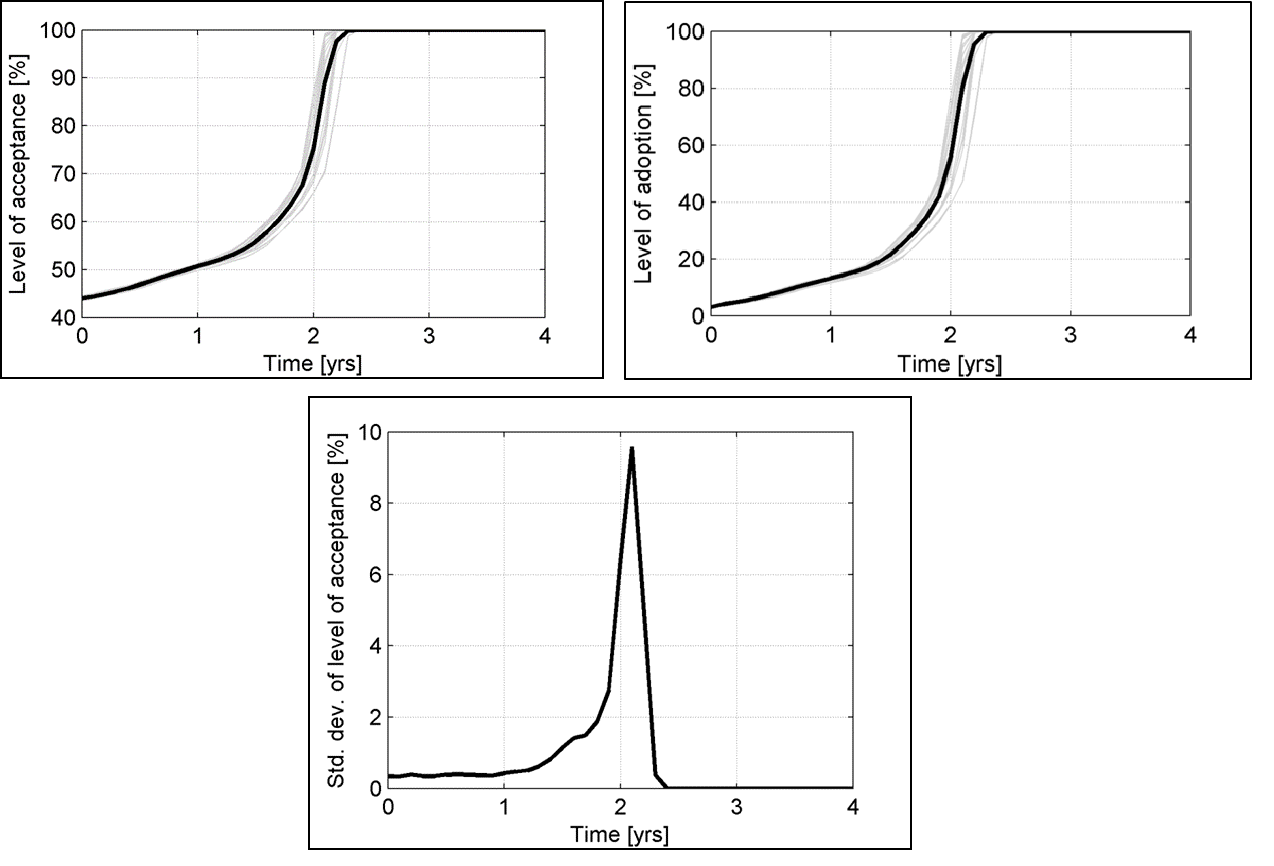
Figure 3 shows the results of the information diffusion base case experiment. It is important to observe that the mean level of acceptance has increased from 42.4% in the validation experiment to 44.0% during time zero. This is because some of the agents had an improved perception of air pollution, as per our initial condition, and this increased the mean level of acceptance.
The information diffusion results show the expected S-shaped curve (Figure 3b), which is characteristic of the Bass model. Information diffusion starts slowly, followed by a rapid adoption phase where the rate of adoption is high, and then slows again as the new perception saturates the entire network.
Figures 3a and b show that the mean level of acceptance of the mining project is driven mainly by the perception of air pollution impacts. The mean level of acceptance curve follows the behavior of the mean level of adoption of the new perception. The other simulated dynamic attributes (including ageing, maturity of younger agents and death of older agents) have relatively little effect on the level of acceptance. This is in agreement with the utility function since the coefficients of the non-demographic factors are much higher than those of the demo-graphic factors. For instance, the coefficient for air pollution impact is -1.8216 while that of age is 0.0028. A unit change in an agent’s age (i.e. changing from the 18 to 24 years age group to the 25 to 34 years age group) will raise the odds ratio by a factor of 1.0028 (e0:0028). However, if the same agent were to change its perception of air pollution from 2 to 1 (i.e. improvement), its odds ratio will rise by a factor of 6.18 (e1:8216) as represented in Equation 2. This implies that changing perceptions about the mine’s impacts, in this case, will result in much more significant impacts on level of acceptance, and subsequently social license to operate than changing demographics.
| Factor | Level | Value | Reference |
| Number of friends (A) | 0 | 30 friends | Zhou et al. (2005); Hill & Dunbar (2003) |
| 1 | 50 friends | ||
| Close neighbor ratio (B) | 0 | 0.55 | Based on reasonable assumptions |
| 1 | 0.75 | and preliminary experiments | |
| Number of early adopters (C) | 0 | 35% | Rogers (2002); Cho et al. (2002); Rizzo & Porfiri (2016); Bass (2004) |
| 1 | 69.4% | and reasonable assumptions |
The level of uncertainty surrounding the mean acceptance is shown in Figure 3c using the standard deviation of the level of acceptance. The increase in uncertainty during the rapid adoption stage is due to the several probabilities available for information to spread through the network.
Sensitivity Analysis
The main objective of this work is to evaluate the responsiveness of the model discussed in section 2 to key input parameters. In order to select these key input parameters, we initially conducted screening experiments on all the ABM parameters to analyze how these input parameters respond to the model output (level of acceptance). The results from the screening experiments show that varying the number of friends, close neighbor ratio, and number of early adopters have a significant effects on the results of the ABMl. Hence, the motivation to carry out the sensitivity analysis on these key input parameters.
Given that the level of acceptance, which is the output varies as the simulation continues, a time-based sensitivity analysis is appropriate (Ligmann-Zielinska & Sun 2010). In such an approach, the output at each time step is treated as a separate output and sensitivity indices are estimated for each output. To estimate the effect of changes in the input on the output, we used a design of experiments method used by many researchers in the literature (Saltelli & Annoni 2010; Anderson & Whitecomb 2015). We designed a two-level full factorial experiment for the three parameters. Table 7 shows the factors and their levels used in the experiment.
As explained earlier, the literature has considered a group size of 30 to 50 individuals as a typical size of social group such as overnight camps or a band society (Hill & Dunbar 2003; Zhou et al. 2005). We used these numbers as the limits of what could be considered an influential group that the agent (individual) belongs to.
In the case of close neighbor ratio, we set minimum value to 0.55 to ensure homophily and maximum value to 0.75 based on preliminary experiments (Figure 4). The ratio has to be greater than 0.5 to ensure higher probability of connections between "similar" agents as discussed in Section 2.2. We set a maximum value of 0.75 for close neighbor ratio by conducting screening experiments using 20,000 agents and 20 iterations, and keeping all the factors for the base case the same while varying the close neighbor ratio from 0.55 to 0.85 in the interval of 0.1. The preliminary experimental results indicate that beyond 0.75, the dynamic behavior of the mean level of acceptance changes (Figure 4). This is probably due to the extreme homophily modeled by 0.85, which likely leads to small-world networks.
Regarding number of early adopters in this work, 69.4% of the agents in a particular zip code where the information diffusion is initiated are considered innovators ("early adopters"). The 69.4% of agents in this zip code is equivalent to 2.5% of the total number of agents (total population) considered to be the number for innovators or "early adopter" according to literature. However, half of this percentage (i.e. 35% of agents in that particular zip code or 1.25% of the entire population) was assumed to be reasonably enough for the low level.
The experiment simulates all possible combinations of the factor levels (Table 8). From the output of these simulation runs, the primary (main), secondary and tertiary effects of each parameter can be estimated using well established approaches (Saltelli & Annoni 2010; Anderson & Whitecomb 2015). Assume, for example, that Z is the output (level of acceptance at a particular time instance) for given levels of the three factors (Table 7). Also assume that ZF1 represents the output when a particular factor F is set to level 1 and ZF0 represents the output when the same factor is set to level 0. Similarly, let nF1 and nF0 represent the number of experiments where the factor is set to 1 and 0, respectively. Then Equation 4 can be used to estimate the main effect of factor F . Similar equations exist for estimating the secondary and tertiary effects of the factors (Anderson & Whitecomb 2015). The secondary effects estimate the effect of interactions between two factors while the tertiary effects estimate the effect of interactions between three factors.
| $$Eff(F)=\frac{\sum Z^{F1}}{nF^1}-\frac{\sum Z^{F^0}}{nF^0}$$ | (4) |

| Exp. # | Level |
| 1 | (0,0,0) |
| 2 | (1,0,0) |
| 3 | (0,1,0) |
| 4 | (1,1,0) |
| 5 | (0,0,1) |
| 6 | (1,0,1) |
| 7 | (0,1,1) |
| 8 | (1,1,1) |
Although, the estimates of primary, secondary and tertiary effects can result in positive and negative numbers (Equation 4), we report in our results only absolute values of these estimates to facilitate easy comparison of the scale of the effects. The results of the sensitivity analysis are discussed in the next section.
Results and Discussions
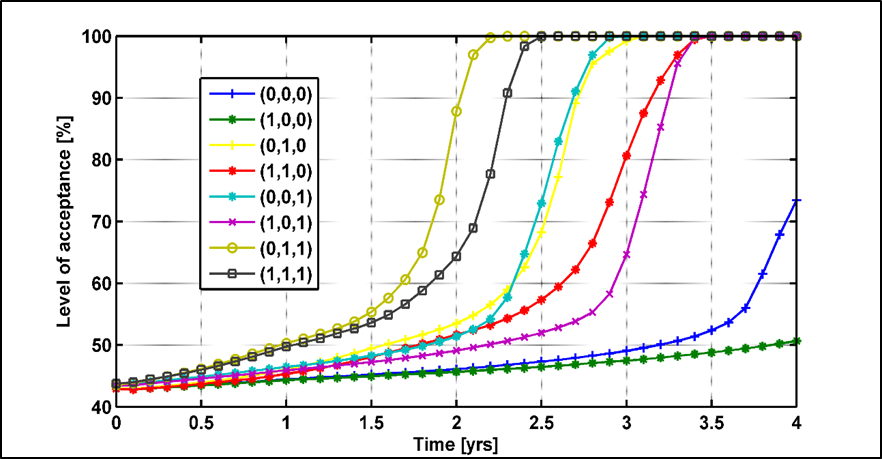
The results of the sensitivity analysis are shown in Figure 5 and (6. Figure 5 shows the level of acceptance for all the experiments while Figure 6 shows the estimated effects from the results in Figure 5. The reader should note that points in Figure 6 where a particular effect "pinches" out indicate a transition from negative to positive or positive to negative effects (the plot shows absolute values of the estimated effects). The total estimated effects (sensitivity metrics) gradually rise from almost zero at the beginning of the simulation to a maximum, just over 100, at 2.9 years. Subsequently, the uncertainty decreases slightly and stays near constant for the rest of the simulation. The level of acceptance (the output of the model) is near constant at the beginning of the simulation for all the experiments (Figure 5). Hence, the model output is not sensitive to the three factors. However, as the simulation proceeds, the effect of the three investigated factors on the output increases over time. This is because the level of acceptance over time is a function of agent's interaction and information diffusion, which is affected by the three factors. In particular, as shown in Figure 5, the onset and duration of the rapid adoption phase varies among the experiments in our experiments, depending on the input values for the three factors. The sensitivity results in Figure 6 follow a similar trend (i.e. the three factors have the most effect during the period between 1.5 to 3.5 years). After 3.5 years, however, with the exception of the first two experiments (Table 8), all the simulations have a constant level of acceptance (100%) as the entire community has adopted the new perception. This is what causes the reduction in the estimated effects and, thus, the model's sensitivity to the three factors.
From Figure 6, we observe that close neighbor ratio (B) and number of early adopters (C) are relatively more significant factors than number of friends (A). The main effects of close neighbor ratio and number of early adopters are significant contributors to the total sensitivity of the level of acceptance to the three factors. Additionally, the interaction of these two factors is more significant compared to any other interaction, including interactions of all the three factors. This means the model’s prediction of the level of acceptance is more sensitive to changes in close neighbor ratio and number of early adopters than to changes in number of friends. It is particularly important to note that, of the two network parameters, one (close neighbor ratio) is much more significant than the other (number of friends).

This is because close neighbor ratio, which is used to model homophily in the social network, influences the degree of clustering in the social network. It is known that innovations (a perception of improved air pollution, in this case) di use quicker in more clustered networks than in random networks due to individual’s exposure to more social influence (Kiesling et al. 2012). We confirmed the relationship between close neighbor ratio and clustering by analyzing the clustering coefficients of simulated networks with different close neighbor ra-tios using open-source Matlab routines for network analysis (Bounova & de Weck 2012). In this analysis, we estimated clustering coefficients of networks simulated with the network algorithm in this work using close neighbor ratios of 0.55, 0.65 and 0.75. The networks had 2,000 nodes (agents) and average degree (number of friends) of 50 to reduce the computational cost. The estimated mean clustering coefficients, for 10 networks each, were 0.0251, 0.0372 and 0.0536 for close neighbor ratios of 0.55, 0.65 and 0.75, respectively. We confirmed that increasing close neighbor ratio leads to a more clustered network. As the network becomes more clustered, diffusion as a result of social influence occurs at a faster rate, which increases level of acceptance.
On the other hand, the number of friends (average number of agent’s friends) affects the diffusion process in two ways. First, the higher the number of friends for an agent, the higher the probability that it is connected to some other agent who has already adopted the new perception. Second, the higher the number of friends, the lower the effect of each single connected agent in influencing the agent’s decision to adopt the new perception (Equation 3), which slows down diffusion. The combined effect of these two mechanisms on the diffusion process appears to result in the model’s lower sensitivity to the average number of friends than to the close neighbor ratio (within the ranges of the two factors).
| Exp. # | 1 | 2 | 3 | 4 | 5 | 6 | 7 | 8 | 9 | 10 | 11 | 12 | 13 | 14 | 15 | 16 |
| Level | 1,1 | 1,2 | 1,3 | 1,4 | 2,1 | 2,2 | 2,3 | 2,4 | 3,1 | 3,2 | 3,3 | 3,4 | 4,1 | 4,2 | 4,3 | 4,4 |
Unlike the two network parameters, the number of early adopters (innovators) is an initial condition for the simulation. The number of early adopters plays a role analogous to gatekeeping in launching a new idea (Rogers 1995). The "new idea" here is the change in perception (in this case, improvement in the air pollution impact). Basically, innovators are more influential at the beginning of the adoption process. Thus the model is, relatively, most sensitive to the number of early adopters at the beginning of the simulation. As the simulation progresses, the magnitude of the sensitivity index for number of early adopters increases but the overall contribution to-wards uncertainty is surpassed by the contribution of the close neighbor ratio (Figure 6).
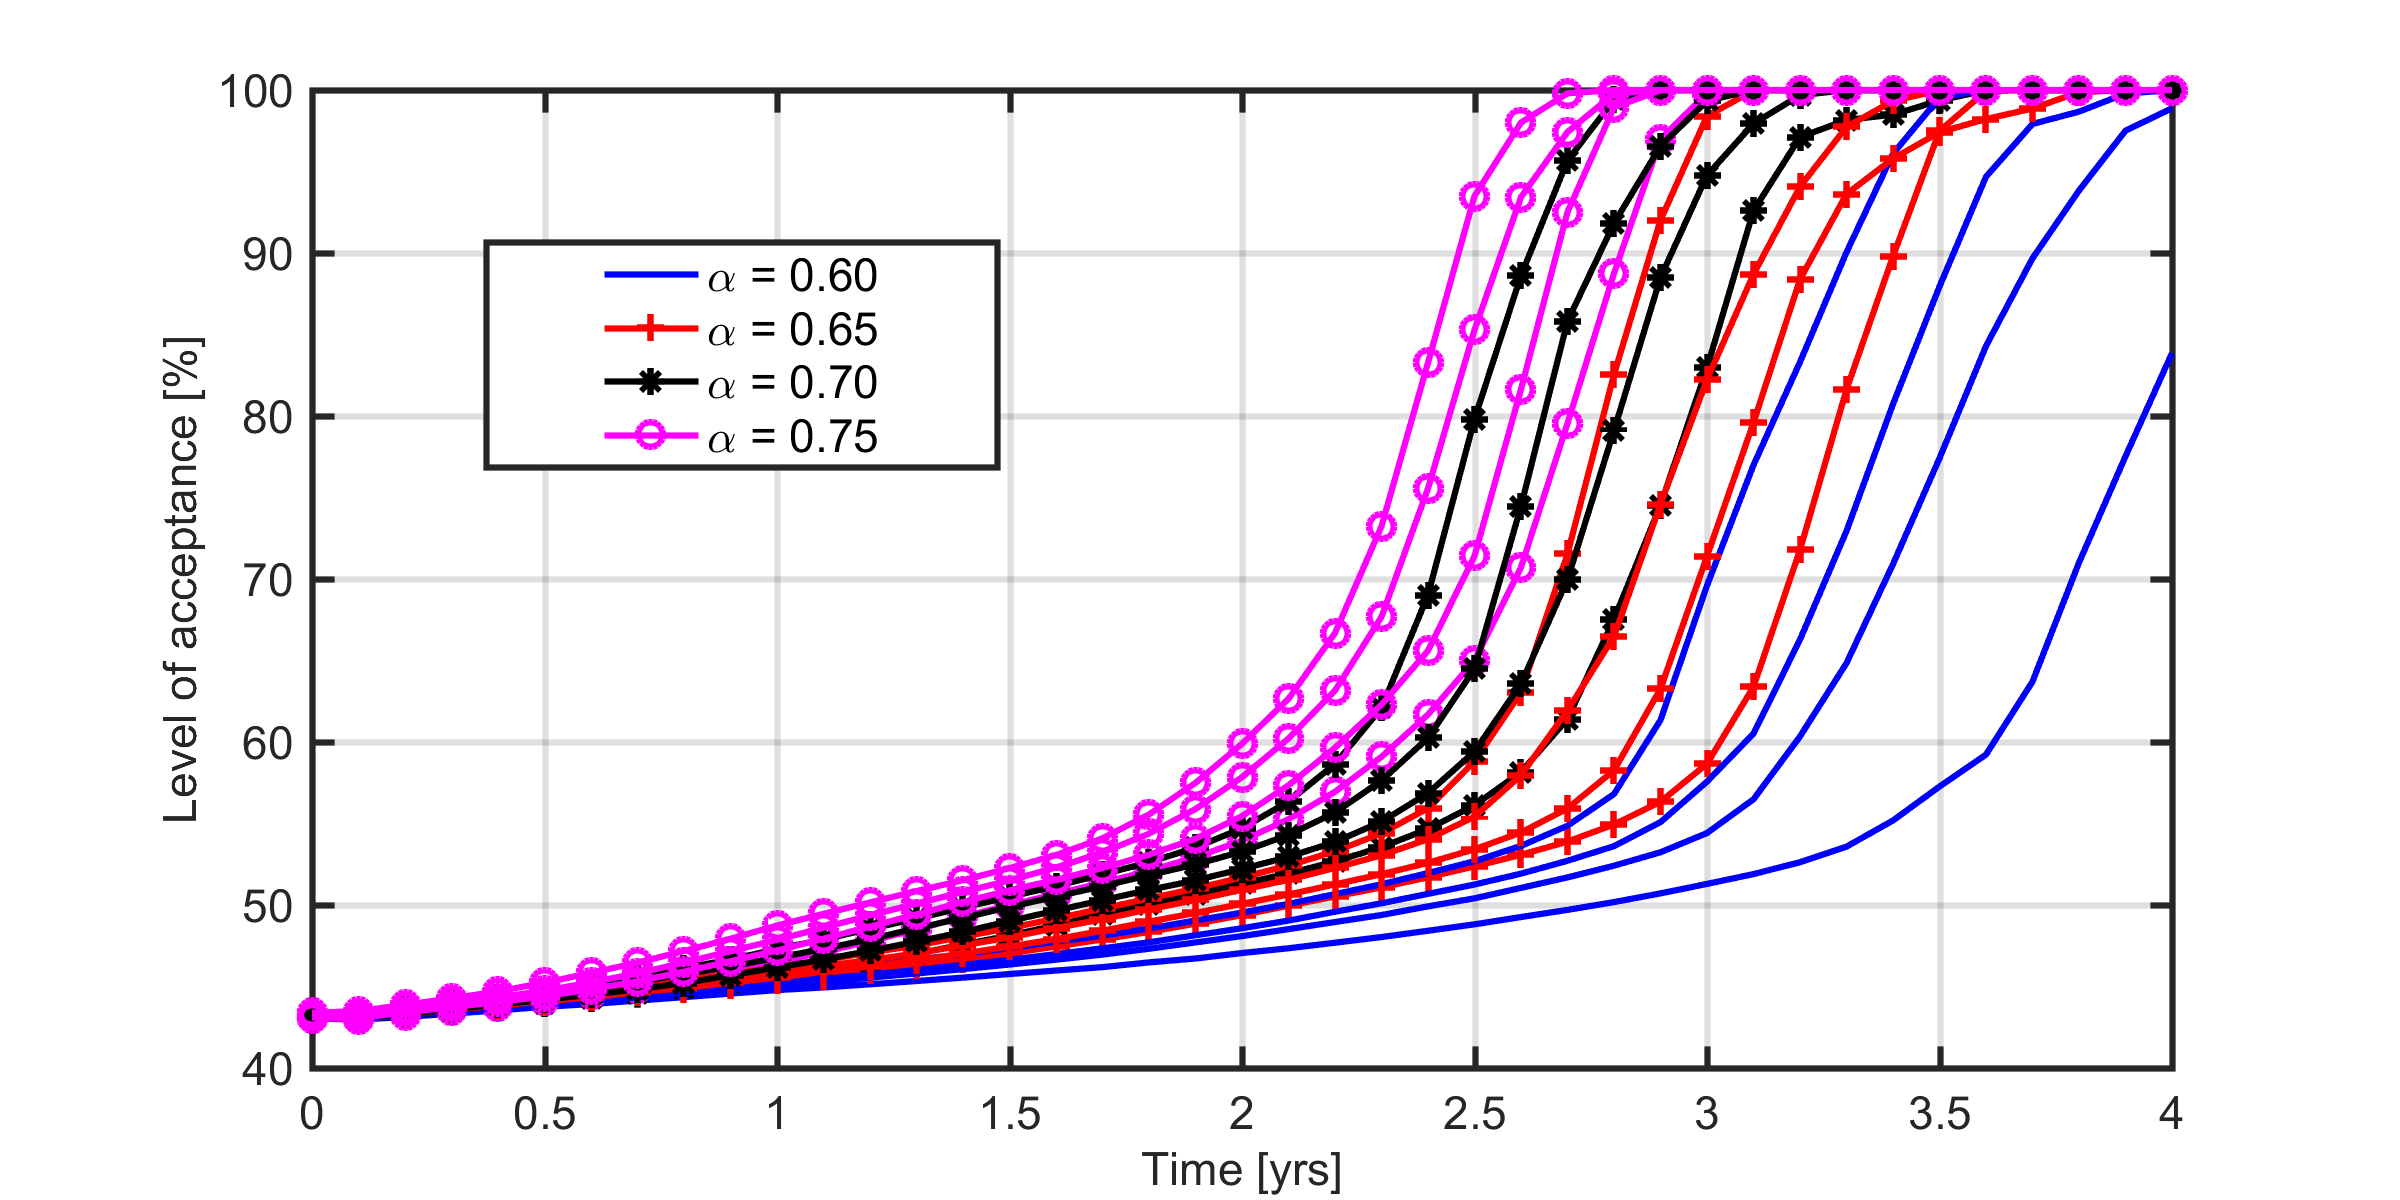
We investigated further the combined effects of close neighbor ratio and number of early adopters on the level of acceptance over time to clarify the relationship and effect on the output. We conducted experiments with four different levels of close neighbor ratio, "B" and number of early adopters "C". The inputs for close neighbor ratio were 0.60 to 0.75 with step size 0.05, and that for number of early adopters were 40% to 55% with step size 5%. These input figures are within the limits of the ranges used in the sensitivity analysis and provide the best insight based on our observations. Table 9 shows the 16 experimental runs for all possible combinations of the factor levels, which were set to 1 to 4 in order of increasing values. The results of these experiments (Figure 7) show that the level of acceptance increases as the close number ratio increases with a given number of early adopters.
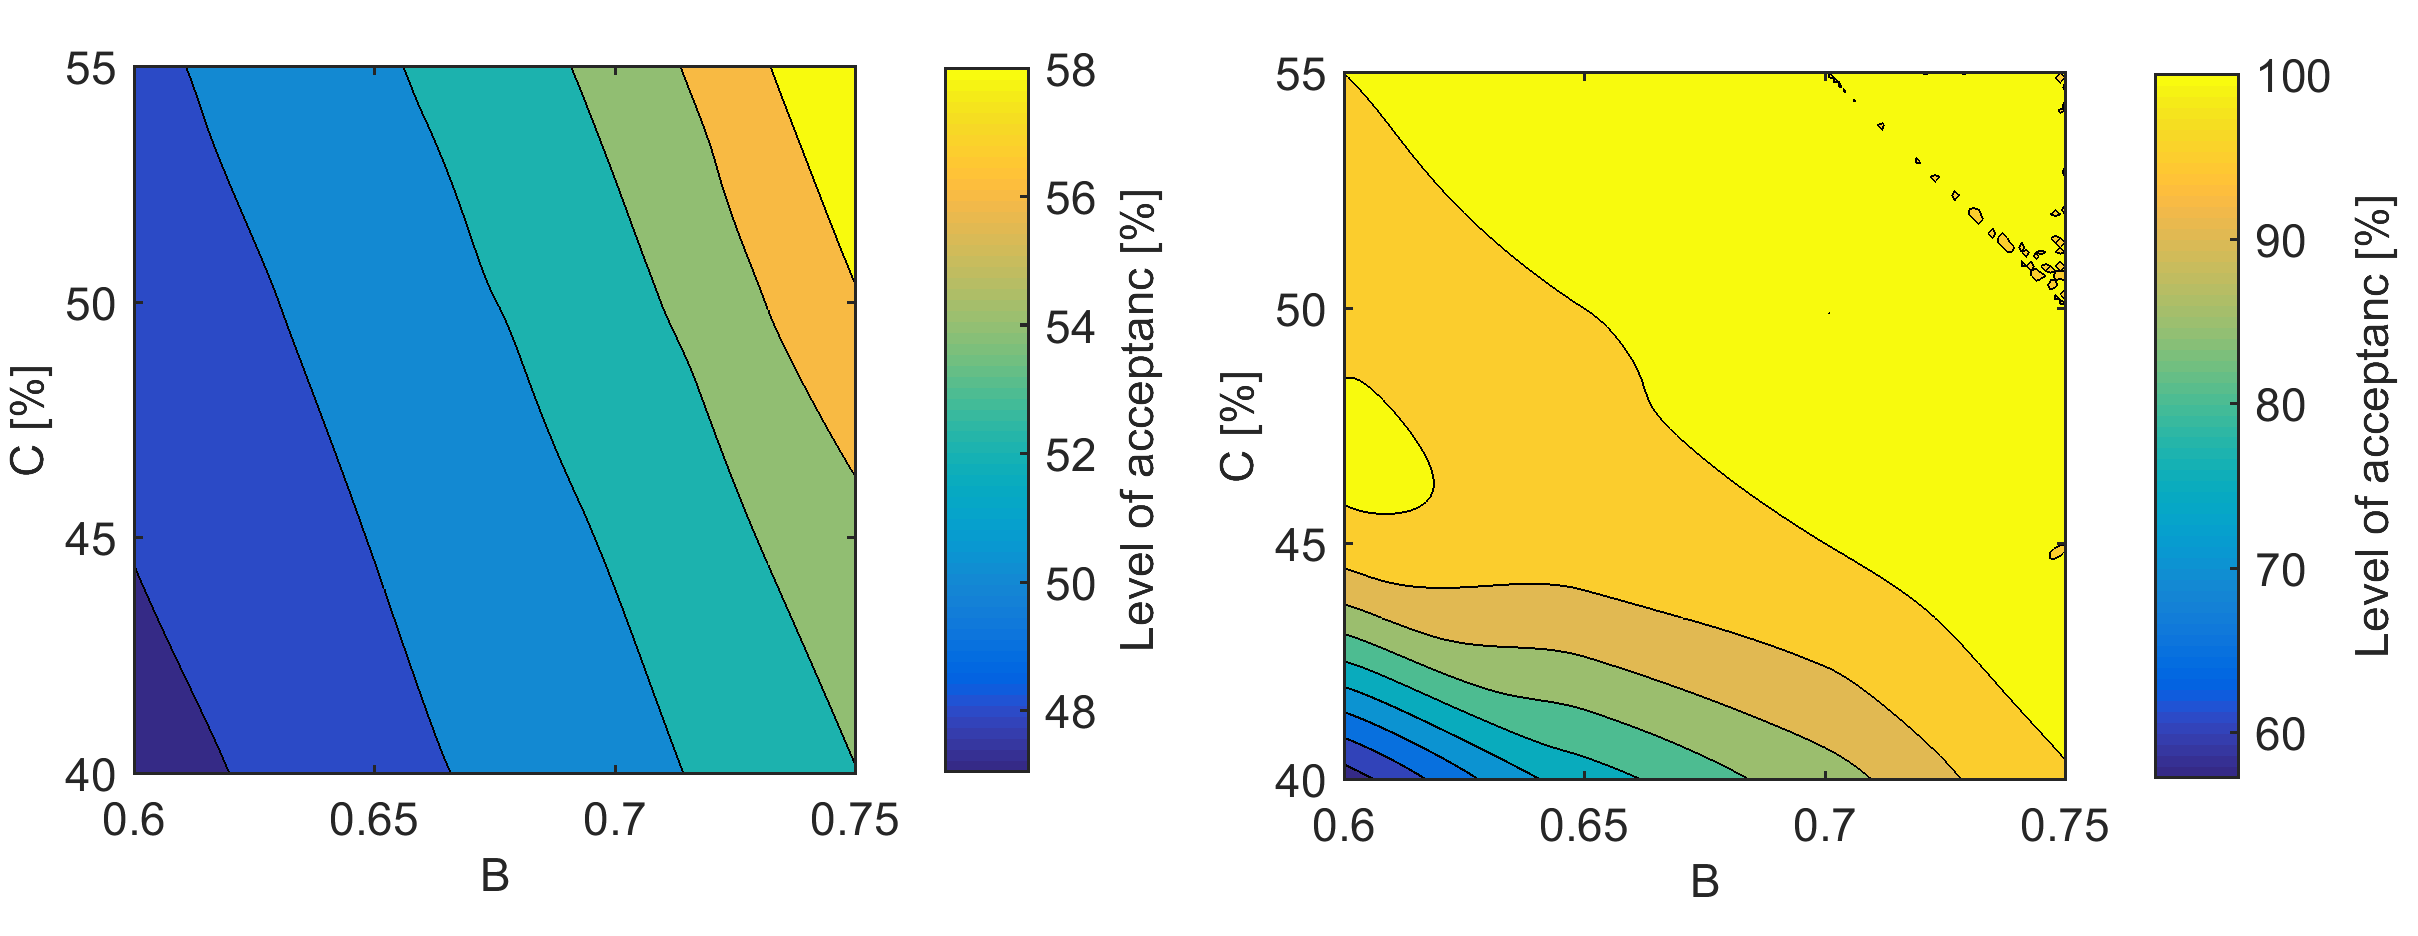
Figure 7shows how the two factors affect level of acceptance over time. It shows that as the close neighbor ratio (thus homophily) increases, the rate of adoption is faster leading to a faster rise in the level of acceptance. We examined the interaction between the two factors and the level of acceptance at each of the 41 time steps. We observe a wide range of effects ranging from no change in level of acceptance with changes in the two factors at time t= 0, to wide variation in level of acceptance during the rapid adoption phase to reduced level of variation towards the end of the simulation where most replications have 100% level of acceptance. Figure 8 shows the level of acceptance at t= 2 years and t= 3.5 years, which illustrate some of the observed trends. We selected 2 and 3.5 years because within this time, the level of acceptance significantly varies with varying close neighbor ratio and number of early adopters. At t= 2 years, level of acceptance increases as close neighbor ratio and number of early adopters increase (Figure 8a). At t= 3.5 years, the relation is a bit more nuanced. Though the level of acceptance increases as close neighbor ratio and number of early adopters increase, with numbers of early adopters set at 50% and 55%, level of acceptance by 3.5 years in the simulation is approximately 100% regardless of the close neighbor ratio. Hence, the sensitivity of the output in later years is diminished when the combined effect of the two variables significantly increases the rate of information diffusion and, thus, the rate at which the level of acceptance increases.
When using this model to understand the effect of information diffusion on changes in the level of community acceptance of mining, critical attention should be paid to the degree of homophily in the social network (close neighbor ratio) and number of early adopters (initial condition). The model is very sensitive to these factors and the reliability of the results depends on the accuracy of the estimates of these important input variables. It is therefore advisable that mine managers consider the costs and benefits of acquiring data to estimate these key parameters accurately so as to minimize uncertainties around their conclusions.
The information and estimates of number of early adopters are well documented in the literature (Rogers 2002; Cho et al. 2012; Rizzo & Porfiri 2016; Bass 2004). However, the information and estimates concerning the net-work parameters (number of friends and close neighbor ratio) can be obtained reliably only through a survey. For instance, during community engagement, individuals in the local mining community can be interviewed to document the people they are likely to discuss the relevant issue (relating to this mine) who are likely to affect their perceptions of the mine. Additionally, questions relating to the residence of those individuals would allow researchers to document the degree to which the type of homophily modeled in this work exists in the community. This will guide mine managers to estimate the number of friends and close neighbor ratio. Nonetheless, such a survey could be expensive, time consuming, and present difficulties in obtaining a good representative sample and reliable responses. Further research should focus on economic and reliable means of estimating these important input variables.
Although the work in Awuah-Offei et al. (2017) is similar in some respects, there are major differences as articulated in the introduction. Consequently, the input parameters examined by the two papers are different. Awuah-Offei and co-workers examined the sensitivity of their model to the probability of imitation, the probability of innovation, and the average degree of the network while this work examined the sensitivity of this model to close neighbor ratio, average degree, and number of initial adopters. The results of the two papers are different because the models and their inputs differ. For example, probability of innovation is not a parameter in this work (because the model assumes innovation is negligible) but it is a key input in Awuah-Offei et al. (2017). Similarly, the number of initial adopters is a key parameter in this work but is not an input in Awuah-Offei et al. (2017). It is important to note that both papers identify average degree of the network as an important input parameter. However, in both cases (even though the modeled homophily is different), the average degree is not as important as the other input parameters. In Awuah-Offei et al. (2017) the model is more relatively sensitive to probability of imitation than average degree (and probability of innovation). In this work, close neighbor ratio and number of early adopters are relatively more important than average degree. One could thus conclude that in spite of the different network homophily modeled in both papers, other input factors are relatively more important than average degree.
As previously discussed, the ABM in this work attempts to provide a framework for mine managers and other stakeholders to anticipate changes that can happen in community acceptance due to changes in opinions. These changing opinions occur due to changes in the society and individual's perceptions about these mines because of the mines’ environmental and social impacts. Hence, agent based models built based on this frame-work can be used by stakeholders to evaluate different scenarios and explore the likely effects of these scenarios in order to incorporate them into design, policy or government decisions. The results of the sensitivity analysis in this work will help stakeholders identify the key parameters of the model that contribute to uncertainty in the model output. This will guide modelers and decision makers on where to expend resources in order to obtain more reliable results.
Also, the ABM model presented in this work can be useful beyond mining as it is applicable to other fields including oil and gas and other large scale engineering projects such as construction of power stations. The framework can be applied in cases where the project has a relatively long duration (e.g. more than five years), substantial environmental and socio-economic impacts, and different stages (e.g. construction, operation and decommissioning) with diverse impacts.
Conclusions
This study investigated the responsiveness of mining community acceptance model to key parameter changes. The parameters investigated were average degree (average number of friends) of the social network, close neighbor ratio (a measure of homophily in the social network) and number of early adopters ("innovators"). The results indicate that the model is relatively more responsive to close neighbor ratio (homophily) and number of early adopters than average degree (number of friends). Therefore, the authors recommend that mine managers using this model to understand the effect of word-of-mouth information diffusion on the level of community acceptance of their projects pay particular attention to the estimates of close neighbor ratio and number of early adopters. This will minimize the uncertainty surrounding the inferences they draw from their simulation experiments. The literature on early adopters is mature and offers a reliable means to estimate the range of the number of early adopters. This is not the case for the social networks in mining communities and that will require more effort to reliably estimate the extent of homophily in the social networks. The authors recommend that future work addresses approaches to adequately characterize this, given its importance.
The proposed ABM framework will assist stakeholders to understand the effects of various scenarios on the rate of change of community acceptance so that they can incorporate them into design, policy or government decisions. The sensitivity analysis results have identified the ABM’s key parameters and how they affect the model output. This provides a useful guide for modelers and decision makers to determine how to spend scarce resources to improve the uncertainty of the results.
Notes
- "Community acceptance" in this case means the individuals (agents) prefer the project over the status quo. This may be more than "acceptance" but less than "approval", in SLO parlance (Thomson & Boutilier 2011).
- "Active friends" is used to refer to those agents connected to an agent that are participating in the decision (i.e. 18 years or older and alive).
- Salt Lake City is home to the Bingham Canyon Mine, a surface mine that produces mainly copper but also some gold, silver and molybdenum.
- This change means the perception of air pollution changes from "same as similar mine in the area" to "less than similar mine in the area".
- Age distribution data was obtained from 2009-2013 American Community Survey (American Community Survey, n.d.)
References
ABDOLLAHIAN, M., Yang, Z., Coan, T. & Yesilada, B. (2013). Human development dynamics: An agent based simulation of macro social systems and individual heterogeneous evolutionary games. Complex Adaptive Systems Modeling, 1(1), 1–17. [doi:10.1186/2194-3206-1-18]
ANDERSON, M. J. & Whitecomb, P. J. (2015). DOE Simplified: Practical Tools for Effective Experimentation (3rd ed.). Boca Raton, FL: CRC Press - Taylor & Francis Group [doi:10.1201/b18479]
AWUAH-OFFEI, K., Boateng, M. K. & Anani, A. (2017). Sensitivity analysis of agent-based model of mining community acceptance. Under Review
BASS, F. M. (2004). Comments on "A new product growth for model consumer durables: The Bass Model". Management Science, 50(12), 1833–1840 [doi:10.1287/mnsc.1040.0300]
BERLO, D. K., Lemert, J. B. & Mertz, R. J. (1969). Dimensions for evaluating the acceptability of message sources. Public Opinion Quarterly, 33(4), 563–576 [doi:10.1086/267745]
BOATENG, M. K. & Awuah-Offei, K. (2014). Agent-based modeling framework for community acceptance of mining projects (abstract). In SME Annual Meeting Preprint, Society of Mining, Metallurgy & Exploration. Salt Lake City, UT
BOATENG, M. K. & Awuah-Offei, K. (2017). Agent-based modeling framework for modeling the effect of information diffusion on community acceptance of mining. Technological Forecasting & Social Change, 117, 1-11. [doi:10.1016/j.techfore.2017.01.019]
BOATENG, M. K. & Awuah-Offei, K. (2015). An agent-based approach to evaluating the effect of dynamic age changes on community acceptance of mining projects. In Applications of Computers and Operations Research in the Mineral Industry. Proceedings of the 37th International Symposium, (pp. 280–286). The Society for Mining, Metallurgy and Exploration
BONABEAU, E. (2002). Agent-based modeling: Methods and techniques for simulating human systems. Proceedings of the National Academy of Sciences, 99(suppl 3), 7280–7287 [doi:10.1073/pnas.082080899]
BOUNOVA, G. & de Weck, O. (2012). Overview of metrics and their correlation patterns for multiple-metric topology analysis on heterogeneous graph ensembles. Physical Review E, 85(1), 016117
BOUTILIER, R. (2011). A Stakeholder Approach to Issues Management. New York, NY: Business Expert Press [doi:10.4128/9781606490983]
BROWNE, A. L., Stehlik, D. & Buckley, A. (2011). Social licences to operate: For better not for worse; for richer not for poorer? The impacts of unplanned mining closure for "fence line" residential communities. Local Environment, 16(7), 707–725 [doi:10.1080/13549839.2011.592183]
BUTTLE, F. A. (1998). Word of mouth: Understanding and managing referral marketing. Journal of Strategic Marketing, 6(3), 241–254 [doi:10.1080/096525498346658]
CHO, Y., Hwang, J. & Lee, D. (2012). Identification of effective opinion leaders in the diffusion of technological innovation: A social network approach. Technological Forecasting and Social Change, 79(1), 97–106 [doi:10.1016/j.techfore.2011.06.003]
CORMAN, S. R., Trethewey, A. & Goodall, B. (2007). A 21st century model for communications in the global war of ideas: From simplistic influence to pragmatic complexity. Consortium for Strategic Communication
DAVIS, R. & Franks, D. M. (2011). The costs of conflict with local communities in the extractive industry. In First International Seminar on Social Responsibility in Mining.
DODDS, W. (1973). An application of the Bass model in long-term new product forecasting. Journal of Marketing Research, 10(3), 308 [doi:10.2307/3149700]
FRIEDMAN, R. D. (2015). Jewish Wisdom for Growing Older: Finding Your Grit and Grace Beyond Midlife. Woodstock: Jewish Lights Publishing
GOLDENBERG, J., Libai, B. & Muller, E. (2001). Talk of the network: A complex systems look at the underlying process of word-of-mouth. Marketing Letters, 12(3), 211–223 [doi:10.1023/A:1011122126881]
HILL, R. A. & Dunbar, R. I. (2003). Social network size in humans. Human Nature, 14(1), 53–72 [doi:10.1007/s12110-003-1016-y]
HUNT, L. M., Kushneriuk, R., Lester, N. et al. (2007). Linking agent-based and choice models to study outdoor recreation behaviour: A case of the Landscape Fisheries Model in Northern Ontario, Canada. Forest Snow and Landscape Research, 81(1), 2
IVANOVA, G. & Rolfe, J. (2011). Assessing development options in mining communities using stated preference techniques. Resources Policy, 36(3), 255–264 [doi:10.1016/j.resourpol.2011.03.001]
IVANOVA, G., Rolfe, J., Lockie, S. & Timmer, V. (2007). Assessing social and economic impacts associated with changes in the coal mining industry in the Bowen Basin, Queensland, Australia. Management of Environmental Quality: An International Journal, 18(2), 211–228 [doi:10.1108/14777830710725867]
JACKSON, M. O. (2008). Social and Economic Networks. Princeton, NJ: Princeton University Press
KIESLING, E., Günther, M., Stummer, C. & Wakolbinger, L. M. (2012). Agent-based simulation of innovation diffusion: A review. Central European Journal of Operations Research, 20(2), 183–230 [doi:10.1007/s10100-011-0210-y]
KLÜGL, F. & Bazzan, A. L. (2012). Agent-based modeling and simulation. AI Magazine, 33(3), 29
LIGMANN-ZIELINSKA, A. & Sun, L. (2010). Applying time-dependent variance-based global sensitivity analysis to represent the dynamics of an agent-based model of land use change. International Journal of Geographical Information Science, 24(12), 1829–1850 [doi:10.1080/13658816.2010.490533]
LILIEN, G. L., Rangaswamy, A. & De Bruyn, A. (2007). The Bass Model: Marketing engineering technical note. In Principles of Marketing Engineering. State College, PA: DecisionPro
MACAL, C. M. & North, M. J. (2006). Introduction to agent-based modeling and simulation. Decision & Information Science Division, Argonne National Loboratory
MACAL, C. M. & North, M. J. (2010). Tutorial on agent-based modeling and simulation. Journal of Simulation, 4, 151–162 [doi:10.1057/jos.2010.3]
MAILLÉ, M.-E. & Saint-Charles, J. (2014). Fuelling an environmental conflict through information diffusion strategies. Environmental Communication, 8(3), 305–325 [doi:10.1080/17524032.2013.851099]
MCPHERSON, M., L. Smith-lovin, and J. M. Cook. (2001). Birds of a feather: Homophily in Social Networks. Annual Review of Sociology, 27, 415–444
MOFFAT, K. & Zhang, A. (2014). The paths to social licence to operate: An integrative model explaining community acceptance of mining. Resource Policy, 39, 61–70 [doi:10.1016/j.resourpol.2013.11.003]
NATIONAL CENTER FOR HEALTH STATISTICS (2014). Utah Department of Health Data Resources; advanced users dataset queries.(IBIS-PH Indicator-Based Information). Retrieved from: http://ibis.health.utah.gov/query/Index.html
NEWMAN, M. E. J. (2003). The structure and function of complex networks. SIAM Review, 45(2), 167–256 [doi:10.1137/S003614450342480]
PRNO, J. (2013). An analysis of factors leading to the establishment of a social licence to operate in the mining industry. Resource Policy, 38(4), 577–590 [doi:10.1016/j.resourpol.2013.09.010]
PRNO, J. & Slocombe, D. S. (2012). Exploring the origins of ’social license to operate’ in the mining sector: Perspectives from governance and sustainability theories. Resource Policy, 37(3), 346–357 [doi:10.1016/j.resourpol.2012.04.002]
QUE, S. (2015). Describing local community acceptance with discrete choice theory for enhanced community engagement. Doctoral Dissertations. Paper 2416. Missouri University of Science and Technology.
QUE, S., Awuah-Offei, K. & Samaranayake, V. A. (2015). Classifying critical factors that influence community acceptance of mining projects for discrete choice experiments in the United States. Journal of Cleaner Production, 87, 489–500 [doi:10.1016/j.jclepro.2014.09.084]
REZVANI, M., Hoseini, S. H. K. & Samadzadeh, M. M. (2012). Investigating the role of word of mouth on consumer based brand equity creation in Iran’s cell-phone market. Journal of Knowledge Management, Economics and Information Technology, 2(1), 1–15
RIZZO, A. & Porfiri, M. (2016). Innovation diffusion on time-varying activity driven networks. The European Physical Journal B, 89(1), 20 [doi:10.1140/epjb/e2015-60933-3]
ROGERS, E. M. (1995). Diffusion of Innovations. New York, NY: The Free Press
ROGERS, E. M. (2002). Diffusion of preventive innovations. Addictive Behaviors, 27(6), 989–993 [doi:10.1016/S0306-4603(02)00300-3]
SALTELLI, A. & Annoni, P. (2010). How to avoid a perfunctory sensitivity analysis. Environmental Modelling & Software, 25(12), 1508–1517
SALTELLI, A., Ratto, M., Andres, T., Campolongo, F., Cariboni, J., Gatelli, D., Saisana, M. & Tarantola, S. (2008). Global Sensitivity Analysis: The Primer. Chichester: Wiley
SCHOLL, H. J. (2001). Agent-based and system dynamics modeling: A call for cross study and joint research. In Proceedings of the 34th Annual Hawaii International Conference on System Sciences, 2001. IEEE [doi:10.1109/HICSS.2001.926296]
SIERO, F. W. & Doosje, B. J. (1993). Attitude change following persuasive communication: Integrating social judgment theory and the elaboration likelihood model. European Journal of Social Psychology, 23(5), 541–554 [doi:10.1002/ejsp.2420230510]
SOBKOWICZ, P. (2009). Modelling opinion formation with physics tools: Call for closer link with reality. Journal of Artificial Societies and Social Simulation, 12(1), 11: https://www.jasss.org/12/1/11.html.
SUO, S. & Chen, Y. (2008). The dynamics of public opinion in complex networks. Journal of Artificial Societies and Social Simulation, 11(4), 2: https://www.jasss.org/11/4/2.html.
TEN BROEKE, G., Van Voorn, G. & Ligtenberg, A. (2016). Which sensitivity analysis method should I use for my agent-based model? Journal of Artificial Societies & Social Simulation, 19(1), 5: https://www.jasss.org/19/1/5.html. [doi:10.18564/jasss.2857]
THIELE, J. C., Kurth, W. & Grimm, V. (2014). Facilitating parameter estimation and sensitivity analysis of agent-based models: A cookbook using NetLogo and R. Journal of Artificial Societies and Social Simulation, 17(3), 11: https://www.jasss.org/17/3/11.html. [doi:10.18564/jasss.2503]
THOMSON, I. & Boutilier, R. (2011). Social license to operate. In SME mining engineering handbook, (pp. 1779–96). Society for Mining, Metallurgy and Exploration, Colorado
WINDRUM, P., Fagiolo, G. & Moneta, A. (2007). Empirical validation of agent-based models: Alternatives and prospects. Journal of Artificial Societies and Social Simulation, 10(2), 8: https://www.jasss.org/10/2/8.html
WU, M., Wang, L. & Li, M. (2015). An approach based on the Bass model for analyzing the effects of feature fatigue on customer equity. Computational and Mathematical Organization Theory, 21(1), 69–89 [doi:10.1007/s10588-014-9177-2]
ZHOU, W.-X., Sornette, D., Hill, R. A. & Dunbar, R. I. M. (2005). Discrete hierarchical organization of social group sizes. Proceedings of the Royal Society of London B: Biological Sciences, 272(1561), 439–444 [doi:10.1098/rspb.2004.2970]