
Introduction
Scientists have for a long time puzzled over the proximate mechanisms underlying complex social behaviour and social structure of group-living animals. Group-living is assumed to have evolved due to the benefits individuals gain doing so, e.g. lower risks of predation (Crook et al. 1976). Obviously, when individuals live in groups they are forced to interact with their group members. From these interactions emerge patterns that seem more consistent within a group (or species) than between groups (or species). This patterning of interactions is commonly used to characterize the social structure of a group (Hinde & Stevenson-Hinde 1976). The social structure of a group or species may be constrained by ecological or genetic factors (Chapman & Rothman 2009; Crook et al. 1976; Di Fiore & Rendall 1994; Shultz et al. 2011). The macaque system is one of the best examples of an animal genus where social structure seems to be constrained by genetic/epigenetic factors (Thierry 2004). This genus comprises approximately twenty different species that, according to their social structure, can be arranged on a continuum from extremely despotic to extremely egalitarian (Thierry 2004). Social structure of despotic species is characterized by a steep dominance hierarchy, unidirectional conflicts, fierce aggression, high relative dominance of females to males, low frequency of reconciliation, frequent affiliation among kin, etc. Social structure of egalitarian species, on the contrary, is characterized by a shallow dominance hierarchy, bidirectional conflicts, mild aggression, low relative dominance of females to males, frequent reconciliation, and frequent affiliation among all group members (Thierry 2004). Despite these differences, in egalitarian and despotic species individuals seem to cooperate by reciprocating and/or interchanging social services, e.g. grooming and support in fights (Schino 2007; Schino & Aureli 2008). At an ultimate level, reciprocation and interchange are explained through kin selection (Hamilton 1964) and reciprocal altruism (Trivers 1971). At the proximate level, however, the mechanisms underlying these patterns are still controversial and different cognitive theories have been developed to explain them e.g. calculated reciprocity, symmetry-based reciprocity, emotional bookkeeping (for a review of these theories see: Brosnan & de Waal 2002).
Recently, we have shown, in an individual-based model that self-organization and simple behavioural rules suffice to generate patterns of complex social behaviour like those described in egalitarian and despotic societies of macaques (Hemelrijk & Puga-Gonzalez 2012; Puga-Gonzalez et al. 2009). In the model, called GrooFiWorld, individuals are free to move in space, but tend to remain in a group. When close-by, they interact by either fighting or grooming. Individuals fight if the risks of losing the fight are low, otherwise they may decide to groom, especially when anxious. With these simple behavioural rules, the model reproduces aggressive and affiliative patterns such as those described in macaques: individuals reciprocate grooming and support in fights, interchange grooming for the receipt of support and support for the receipt of grooming, reconcile and console fights, and reconcile and console more with those partners with whom they groom the most, i.e. their ‘friends’ (Hemelrijk & Puga-Gonzalez 2012; Puga-Gonzalez et al. 2014; Puga-Gonzalez et al. 2009). In addition, by changing ‘intensity of aggression’ from low to high, patterns change from those resembling egalitarian to those resembling despotic macaque species. The dominance hierarchy becomes steeper and aggression unidirectional; the degree of reciprocation of grooming decreases; relative dominance of females to males is higher; grooming is directed up the dominance hierarchy and towards individuals of similar rank; and reconciliation is less frequent (Hemelrijk & Puga-Gonzalez 2012; Puga-Gonzalez et al. 2009).
In GrooFiWorld, these patterns emerge due to the spatial structure which in turn is a consequence of aggression. Dominant individuals win most of their fights and chase away subordinates. Consequently, dominants appear to have a spatially central position whereas subordinates remain at the periphery of the group. Since individuals interact with those in their proximity, the spatial configuration influences the distribution of their social interactions. Individuals interact more with close-by members and this results in the emergence of complex behavioural patterns (Hemelrijk & Puga-Gonzalez 2012; Puga-Gonzalez et al. 2014; Puga-Gonzalez et al. 2009). Spatial centrality of dominants, however, is different at high than at low intensity of aggression. Whereas at high intensity there is a significance correlation between spatial centrality and dominance rank, at low intensity this correlation is non-significant (Puga-Gonzalez et al. 2009). This is due to the distribution of aggression among group members. At high intensity of aggression, aggression is unidirectional, from dominants to subordinates: dominants chase away subordinates and end up in the centre of the group. In contrast, aggression is bidirectional at low intensity, i.e. subordinates may counter-attack dominants. Hence, the spatial structure becomes more dynamic. Dominants chase away subordinates but subordinates counter-attack them and thus, centrality of dominants is less pronounced. Yet, at both intensities of aggression the spatial structure is crucial for the emergence of complex behaviour because when interactions occur at random most behavioural patterns disappear (Hemelrijk & Puga-Gonzalez 2012; Puga-Gonzalez et al. 2014; Puga-Gonzalez et al. 2009).
GrooFiWorld, then, suggests that in macaque societies, the spatial structure (in combination with simple behavioural rules) may underlie patterns of complex behaviour (Hemelrijk & Puga-Gonzalez 2012; Puga-Gonzalez et al. 2014; Puga-Gonzalez et al. 2009). In support of this is the fact that, besides resembling behavioural patterns, the model also resembles the structure of the social networks observed in empirical data of despotic and egalitarian macaques (Puga-Gonzalez & Sueur, unpublished data). As group size increases the density of the networks decreases and the modularity and centralization increase, as observed in societies of primates (Kasper & Voelkl 2009; Pasquaretta et al. 2014; Sueur et al. 2011c). Further, differences between the social networks emerging from high and low intensity of aggression are in the same direction as those found between social networks from despotic and egalitarian macaques. At high compared to low intensity of aggression individuals are more selective in their interactions: network density is lower, modularity is higher, the network is more centralized, and dominants are more central in the network (Pasquaretta et al. 2014; Sueur et al. 2011a). These results give further support to the hypothesis that spatial structure is a potential mechanism giving rise to complex social behaviour in societies of macaques, and indicate the importance of aggression shaping this spatial structure.
Yet, in GrooFiWorld individuals have no preference with whom they associate; instead, it is the spatial structure that influences with whom the individuals interact. In primates societies in contrast, it seems that individuals form long lasting associations with some partners rather than with others (Jaeggi et al. 2013; Sabbatini et al. 2012). This suggests that in primates the distribution of social interactions is influenced by the establishment of ‘social bonds’ or ‘friendships’; where ‘friendship’ refers to the positive social bond that may develop between individuals that groom the most (Massen et al. 2010; Silk 2007; Silk 2002). Research in this area has shown that ‘friendships’ seem beneficial for the individual because the more ‘friends’ an individual has, the better its survival chances (Berghaenel et al. 2011; Silk 2003), and the greater its influence in collective-movement decisions (Sueur & Petit 2008; Sueur et al. 2011b; Sueur et al. 2012). In light of this, we have recently implemented a mechanism in the GrooFiWorld model in which individuals categorize others as ‘friends’ or ‘non-friends’, and in which they actively seek proximity to their ‘friends’ (Puga-Gonzalez et al. 2015). We showed that seeking proximity to ‘friends’ reinforced cooperation among ‘friends’, i.e. patterns of reciprocation and interchange (Puga-Gonzalez et al. 2015). In this the model, however, the reinforcement of cooperation seemed to emerge from a combination of the effects of the spatial structure and those of ‘friendships’ on the distribution of interactions: aggression shaped the spatial structure and ‘friendships’ reinforced it because individuals established ‘friendships’ with those in their proximity. Thus, it remained unresolved whether ‘friendships’ alone are capable of generating a social structure that produces complex social behaviour as that observed in macaques. In order to disentangle the effects of spatial structure and ‘friendships’, in the present study we investigate the effects of ‘friendships’ alone in a new version of the GrooFiWorld model called ‘REAPER’ (reinforcement of affiliative preferences).
In ‘REAPER’ we omit the effects of spatial proximity on social interactions and let individuals develop a preference to interact with their ‘friends’, i.e. those with whom they groom the most (grooming given and received) (Massen et al. 2010; Silk 2002). This implies that in the model ‘friends’ may have imbalance grooming relationships, i.e. an individual giving more grooming than receiving it or vice versa. Note, that we could have defined as ‘friends’ those individuals with a balance grooming relationship; however, because this automatically implies some degree of reciprocation, and reciprocation is one of the patterns we expect to emerge in the model, we preferred not to do so. At the beginning of the simulation, individuals select interaction partners at random. However, as interactions go by, individuals start selecting predominantly their ‘friends’ as interaction partners (Equation 1 in methods). This mechanism produces a social structure that emerges via affiliation instead of aggression. Our aim is to study the consequences of this social structure on the emergence of complex behavioural patterns (i.e. patterns of dominant style, of affiliation, and of coalitions) and on the structure of the social networks. Importantly, for reasons of comparison, after selecting an interaction partner individuals follow the same behavioural rules as in GrooFiWorld: individuals fight if the risks of losing are low; otherwise, they consider grooming. Further, in order to mimic steep and shallow dominance hierarchies, as in egalitarian and despotic macaques respectively, we run simulations at high and low intensity of aggression. Our expectations are as follow. Differentiated social relationships will emerge via ‘friendships’. This will result in the emergence of patterns of reciprocation and interchange of grooming and support because some individuals will preferentially interact more with some than with others. At high intensity of aggression, due to the steep dominance hierarchy, we expect some degree of female dominance over males, grooming directed up the dominance hierarchy and towards individuals of similar rank, and uni-directional aggression (Hemelrijk & Puga-Gonzalez 2012; Puga-Gonzalez et al. 2009). As regards social networks, if the structure is similar to that of macaques, we expect that at high compared to low intensity of aggression, networks will be less dense and more modular; and that dominant individuals will have a higher network centrality (Pasquaretta et al. 2014; Sueur et al. 2011a). As regards the effects of group size, we expect that as group size increases the density of the networks will decrease and that the modularity and centralization of the networks will increase (Kasper & Voelkl 2009; Pasquaretta et al. 2014; Sueur et al. 2011a).
Methods
The model
The model was written in the NetLogo software platform, version 5.3 (Wilensky 1999). The model is event-driven and events have no relation with time. Thus, all grooming and fighting interactions are considered of the same duration. In order to compare models, the new version of the model is the same as the previous version of GrooFiWorld, except that in this version we omit the effects of space (see below). Here we mainly focus on the description of the “REAPER” model. For a full description of GrooFiWorld we refer to our previous studies (Hemelrijk & Puga-Gonzalez 2012; Puga-Gonzalez et al. 2009).
Selection of interaction partners
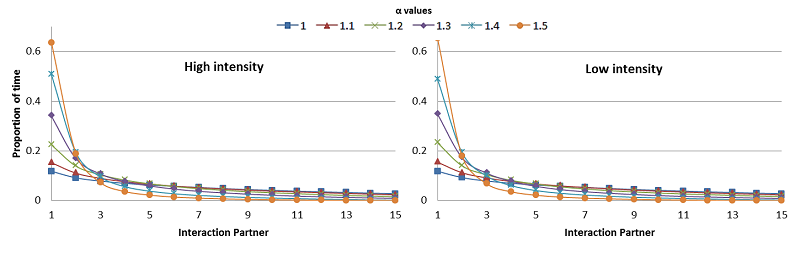
To study the effects of ‘friendships’ on the distribution of social interactions, the selection of interaction partners was based on the amount of grooming interchanged (grooming given and received). This is in accordance with the definition of ‘friends’ in primate literature (Massen et al. 2010; Silk 2002). Individuals are activated in a random order and they select an interaction partner based on the probability given by equation 1. Where \(P_{ij}\) is the probability of individual \(i\) interacting with partner \(j\); \(G_{ij}\) is the number of grooming bouts interchanged between individual \(i\) and \(j\); and the denominator is the sum of the number of grooming bouts individual \(i\) has interchanged with every group member. \(\alpha\) determines the degree of non-linearity in the probability of selecting a given partner, the higher the value of \(\alpha\), the higher the tendency of individuals to interact with their most frequent grooming partners, i.e. ‘friends’. At the beginning of the simulation, individuals select interaction partners at random since all individuals have the same probability of being chosen (no grooming interactions have occurred). However, as interactions go by, individuals will tend to select more frequently their ‘friends’ as interaction partners (Figure 1). Note that equation 1 does not imply reciprocal friendship relationships, i.e. if individual \(i\) prefers to interact mostly with individual \(j\), this does not necessarily mean that individual \(j\) also prefers to interact with individual of \(i\). After selecting an interaction partner, individuals follow the same interactions rules as in GrooFiWorld, they first decide whether they want to fight or not, if they decide not to fight, then they decide whether grooming or not its partner.
| $$P_{ij}=\frac{G_{ij}^{\propto}}{\sum_{a\neq i}^{N-1} G_{ia}^{\propto}} $$ | (1) |
Fighting Interactions
Fighting interactions are modelled as in Hemelrijk (1999) and are an extension of the DoDom rules of Hogeweg (1988). Each individual has a dominance value, Dom (Table 1), which represents its capacity to win. A fighting interaction takes place only if an individual expects to be victorious, i.e. individuals avoid risks. These risks are estimated by means of a ‘mental battle’, i.e. a representation of a real fight. During a ‘mental battle’ an individual \(i\) compares its dominance value (Domi) relatively to that of his opponent \(j\) (Domj) to a random value drawn from a uniform distribution between zero and one (Equation 2). This process may be repeated once or several times depending on the degree of sensitivity to risks (RiskSens, Table 1). In the current simulation RiskSens is set to 2, thus individuals have to win a mental battle twice before engaging in a real dominance interaction.
| $$w_i= \begin{cases} 1 & \frac{DOM_i}{DOM_i + DOM_j}> RND(0,1)\\ 0 & \text{else} \end{cases}$$ | (2) |
If in both ‘mental battles’ individual \(i\) expects to be victorious, then a real fight interaction occurs. The outcome of the real fight is again decided according to Equation 2. To reflect self-reinforcing effects of victory and defeat (Barchas & Mendoza 1984; Franz et al. 2015; Hsu & Wolf 1999), dominance values are updated by increasing the dominance value of the winner and decreasing that of the loser by the same amount (Equation 3). This positive feedback is ‘dampened’ because a victory of a higher ranking opponent increases its relative Dom-value only slightly, whereas a victory of a lower ranking individual increases its relative dominance value by a greater change. To keep Dom-values positive, their minimum value is, arbitrarily, set at 0.01.
| $$\begin{split} DOM_i & = DOM_i+ \biggl(w_i-\frac{DOM_i}{DOM_i + DOM_j}\biggr) \ast STEPDOM\\ DOM_j & = DOM_j+ \biggl(w_i-\frac{DOM_j}{DOM_i + DOM_j}\biggr) \ast STEPDOM\\ \end{split}$$ | (3) |
The change in Dom-values is multiplied by a scaling factor, StepDom (Table 1), which represents intensity of aggression (Hemelrijk 1999). StepDom values range from 0 to 1. High values indicate fierce aggression and cause a big change in Dom-values after a fight. Low values represent mild aggression and have a lower impact in Dom-values.
Coalitions
As in our previous studies, coalitions were recorded when two different individuals attack the same target in two consecutive activations (Hemelrijk & Puga-Gonzalez 2012). Where the individual attacked twice is the target of the coalition, the individual attacking the first time is the recipient of support and the individual attacking the second time the supporter.
Grooming Interactions
When individuals ‘decide’ not to fight; then, they consider whether or not to groom their partner. Grooming is induced by the level of Anxiety (Table 1), which ranges from very relaxed to very tense, i.e. on a scale from 0 to 1. Individuals groom their partners if their level of Anxiety is higher than a random number between 0 and 1; otherwise, they do nothing. The stochastic effect is introduced to allow for errors in decisions. As indicated by empirical studies, grooming (given and received) reduces anxiety and thus the tendency to groom (Aureli et al. 1999; Shutt et al. 2007; Troisi et al. 1989). It does so more strongly in the groomee (AnxDcrGree) than in the groomer (AnxDcrGrmr) (Table 1). During periods without grooming, individuals increase their Anxiety with AnxInc (Table 1) and thus, their motivation to groom as demonstrated in empirical studies (Graves et al. 2002; Keverne et al. 1989; Martel et al. 1995). Further, because in primates anxiety increases after a fight (Aureli et al. 2002); in the model, Anxiety increases as well in both opponents after a fight (AnxIncFight, Table 1).
Model Parameters
All parameters’ values were kept the same as in previous studies (Hemelrijk & Puga-Gonzalez 2012; Puga-Gonzalez et al. 2009). Note that intensity of aggression (StepDom, Table 1) differs between dominance styles. This value ranges between 0 and 1. The higher the value of StepDom, the bigger the change in the dominance values of individuals after winning or losing a fight. At high intensity of aggression, StepDom is set to 1.0 for males and 0.8 to females; and at low intensity of aggression to 0.1 and 0.08 for males and females respectively (Table 1). This reflects the tendency of individuals in despotic societies to bite and physically attack more than in egalitarian ones (Hemelrijk 1999; Thierry 2004). The difference in intensity of aggression between males and females (females’ StepDom is 80% that of males) reflects sexual dimorphism (i.e. stronger musculature and fighting power from differences in body weight and physiology). For the same reason, initial dominance values for females are set at 16 and for males at 32 (Hemelrijk 1999). Furthermore, since in empirical studies the percentage of females is lower in egalitarian (~ 70%) than in despotic macaques (~80%), in the model we set this sex ratio accordingly at low and high aggression intensity. To study the effects of group size on social networks, we chose five different groups sizes: n=10, 20, 30, 40, 50. Values of \(\alpha\), i.e. the degree of selectivity of interaction partners, were varied between 1.0-1.5 by increments of 0.1 (Table 1). For each combination of group size (n=10, 20, 30, 40, 50), intensity of aggression (high or low), and α (1.0-1.5 by increments of 0.1) we ran 20 replicates. Thus, we ran a total of 1.200 simulations. The results shown here are the averages of 20 simulations per combination of parameters’ set. Note, however, that due to space constraints here we only reported the results for each combination of group size and intensity of aggression with a value of \(\alpha\) = 1.3. We considered pertinent to choose this value of alpha because from the primate literature it is known that individuals usually have approx. 5 preferred interaction partners (Sueur et al. 2011a); and with this value of alpha individuals allocated >50% of their interaction time to their top 5 interaction partners at all values of group size. Note, however, that all results of social network analyses and most of the behavioural patterns analyses remained qualitatively the same for all other values of \(\alpha\).
| Parameter | Description | Females | Males |
| General Parameters | |||
| Sex ratio at high intensity | Percentage of individuals | 80% | 20% |
| Sex ratio at low intensity | Percentage of individuals | 70% | 30% |
| Alpha (α) | Degree of selectivity of interaction partners | 1.0-1.5 | |
| Dominance Parameters | |||
| InitDom | Initial Dom value | 16 | 32 |
| RiskSens | Number of ‘mental battles’ | 2 (Equation 2) | |
| StepDom (high intensity) | Scaling factor for aggression intensity | 0.8 | 1 |
| StepDom (low intensity) | Scaling factor for aggression intensity | 0.08 | 0.1 |
| Grooming Parameters | |||
| InitAnx | Initial anxiety value | 0.5 | 0.5 |
| AnxInc | Increase in anxiety after every activation | 1% | 1% |
| AnxDcrGree | Decrease of anxiety of groomee | 0.15 | 0.15 |
| AnxDcrGrmr | Decrease of anxiety of groomer | 0.1 | 0.1 |
| AnxIncFight | Increase of anxiety after fighting | 0.1 | 0.1 |
Data collection
Every run consisted of 260 periods and each period consisted of (Group_Size * 8) activations. We chose 8 activations because we want to compare results with GrooFiWorld and in GrooFiWorld individuals interact approx. 8 times per period. Data were collected from period 200 onwards to exclude any bias caused by transient values. For the social network analysis, we collected data from 3,000 individual activations. We chose this value since it has been shown that a minimum of 2,000 observations is necessary to obtain meaningful network statistics and because higher values would increase network density beyond values observed in empirical data (Voelkl et al. 2011). Data collection consisted of every social interaction: dyadic fights, coalitions, and grooming behaviour. We recorded, for fighting interactions the identities of (1) the attacker and its opponent, (2) that of the winner/loser, (3) the updated Dom values of the individuals; for coalitions, identities of (4) target, (5) recipient of support, and (6) supporter; and for grooming interactions, the identities of (7) groomer, (8) the groomee, and (9) the updated Anxiety values.
Analyses of socio-behavioural patterns
Analyses of social behaviour were performed only among females for reasons of comparison. In both, empirical studies and GrooFiWorld, the focus of study is usually females. The hierarchical differentiation among females was measured by the coefficient of variation of Dom values among individuals and this was averaged over 20 runs. Higher values indicate greater rank distances between individuals (Hemelrijk 1999). The degree of female dominance was measured as the relative position of females over males in the dominance hierarchy. It is calculated by means of the standardized Mann-Whitney-U-Value (Hemelrijk et al. 2003): The number of males ranking below each female is counted; then, the value of the statistic is computed as the sum of these counts, divided by the maximum possible value for a specific sex ratio and group size. Female dominance ranges from 0 (no female dominant over a male) to 1 (all females dominant over all males). The percentage of coalitions was calculated as the total number of coalitions divided by the total number of fights. Correlations between the distribution of grooming, aggression and support among individuals were computed by means of the matrix Tau-Kr correlation, as described by Hemelrijk (1990). The level of significance was calculated using 2000 permutations. Matrices of support were corrected for opportunity (number of fights) to support each partner. We tested for reciprocity of grooming and support in fights; for uni-directionality of aggression; and for interchange of grooming and support by correlating an actor and receiver matrix with the Tau-Kr correlation. Further, whether grooming was directed up the dominance hierarchy or towards partners of similar rank was computed, respectively, by correlating the grooming given matrix with the matrix of the rank of partners and the matrix of partners of similar rank (filled with zeros apart from the partners closest and second closest in rank, which are indicated as 1’s). The rank of individuals was calculated as the average Dom value of each individual during the data collection period. Individuals with high ordinal ranks are individuals with high dominance.
Analyses of social networks
Social network analyses (SNA) were performed using R statistical software, version 3.2.2 (2015) and packages SNA (Butts 2008) and igraph (Csardi & Nepusz 2006). From the collected data, we constructed directed matrices of grooming given. Values in the cell of the matrices were the absolute frequencies of grooming given from the actor (rows) to the receiver (columns). These directed matrices were either used as such or transformed to adjacency graphs with the igraph package; then, the analysis of social networks was performed. In order to compare with previous findings in empirical data, we calculated the following network metrics.
Density: the number of observed edges divided by the number of possible edges (n2-n where n is equal to group size).
Modularity: the difference between the proportion of the total association of individuals within clusters (i.e. subgroups) and the expected proportion, given the summed associations of the different individuals (Newman 2004). The coefficient value ranges from 0 to 1: the higher the value, the higher the division of the network in different clusters or subgroups. Thus, high modularity means a high number of contacts within a subgroup, but few contacts between subgroups and low modularity means a homogeneous distribution of contacts between all group members.
Individual eigenvector centrality: it is a measure of the centrality of an individual within the network. It is calculated by taking into account not only the number and strengths of connections of the individual but also those of the partners to which it is connected. Since we used directed matrices for the analysis, a high eigenvector centrality means that an individual received and had strong connections to other individuals who themselves received grooming frequently (Whitehead 2008).
Average eigenvector coefficient of the group: the average of individual’s eigenvector centrality coefficients per group.
Centralization indexes: for each network, we calculated two different centralization indexes. Centralization index A (CIA) was equal to the difference between the eigenvector centrality coefficient of the top-ranking individual of the group and the average eigenvector centrality coefficient of the rest of the group members (Sueur et al. 2011a). It ranges between -1 and 1. It is close to 0 for networks where all individuals would have equal relationships, and 1 for networks where individuals would have social relationships only with the top-ranking individual. Centralization index B (CIB) was calculated according to Equation (4), where Cmax is the highest eigenvector centrality in the group and Max is the value obtained if the network were a star, i.e. the highest centralization possible (Pasquaretta et al. 2014). Hence, the highest the CIB value the more centralized is the network around one or several individuals.
| $$CIB=100\ast \frac{\sum_i^n(c_{\max}-c_i)}{Max\sum_i^n(c_{\max}-c_i)}$$ | (4) |
Statistical analyses of social networks
All analyses were performed in R statistical software version 3.2.2 (2015). We analysed the effects of group size and intensity of aggression on each network metric. To do so, we built General Linear Mixed Models (GLMM). For all metrics, we used Gaussian distributions and identity link functions except for modularity. We transformed the values of density since otherwise the assumption of a normal distribution of the residuals was not met (Box-cox transformation, see: Peltier et al. 1998). As regards the analysis of values of modularity, due to the high frequency of zero values at low group sizes, we built two different GLMMs. First, we modelled the zero and non-zero data using a binomial distribution with a logit link function. Then we modelled the non-zero data (n=168) using a gamma distribution with a log link function. We chose a gamma distribution due to the highly negative skewness in the distribution of the modularity values. In all models, we included group size and intensity of aggression (high intensity as reference category) as predictors variables. We checked for multicollinearity of the predictor variables by calculating the variance inflation factor (vif). In all cases, the predictor variables had a vif value of 1.000, indicating, thus, that the predictor variables were not correlated.
Results
Selection of interaction partners
As show in Figure 1, individuals were selective when choosing their interaction partners and the higher the value of \(\alpha\), the higher their degree of selectivity. Due to space constraints, the results presented in sections 3.2 and 3.3 correspond to simulations run with an alpha (\(\alpha\)) value = 1.3 (see Model parameters in methods for further clarification).
Patterns of dominant style, affiliation and coalitions
In the ‘REAPER’ model, most patterns of dominant style, affiliation and coalitions resembled those previously found in empirical data and GrooFiWorld (Hemelrijk & Puga-Gonzalez 2012; Puga-Gonzalez et al. 2009); some patterns, however, differed (Table 2). At high intensity of aggression, for instance, aggression was bidirectional rather than uni-directional (2 in Table 2) and grooming was not more often directed to others of similar rank than to those of distant rank (6 in Table 2). In addition, at low intensity of aggression, most correlations between grooming given and support received and vice versa did not reach statistical significance (9, 10 in Table 2). Similarly, at high intensity of aggression, two correlations between support given and groom received were not significant (10 in Table 2). The REAPER model, thus, failed to reproduce some of the typical behavioural patterns found in egalitarian and despotic societies of macaques and in the GrooFiWorld model.
| High intensity of Aggression | Low intensity of Aggression | |||||||||
| Group Size | 10Ind | 20Ind | 30Ind | 40Ind | 50Ind | 10Ind | 20Ind | 30Ind | 40Ind | 50Ind |
| Dominant Style | ||||||||||
| 1) Gradient of the Hierarchy (CV) | 0.79 | 0.66 | 0.71 | 0.78 | 0.73 | 0.09 | 0.08 | 0.08 | 0.08 | 0.08 |
| 2) Uni- (bi-) directional aggression | 0.46** | 0.41** | 0.33** | 0.26** | 0.25** | 0.77** | 0.71** | 0.66*** | 0.64*** | 0.59*** |
| 3) Relative female dominance | 0.21 | 0.23 | 0.30 | 0.23 | 0.26 | 0.00 | 0.00 | 0.00 | 0.00 | 0.00 |
| Affiliative Patterns | ||||||||||
| 4) Reciprocity of Grooming | 0.61** | 0.60*** | 0.54*** | 0.49*** | 0.48*** | 0.80*** | 0.78*** | 0.74*** | 0.71*** | 0.69*** |
| 5) Grooming up the hierarchy | 0.24** | 0.18** | 0.19** | 0.21*** | 0.20*** | 0.01 | 0.02 | 0.01 | 0.01 | 0.01 |
| 6) Grooming partners of similar rank rank | 0.02 | 0.04 | 0.02 | 0.04 | 0.02* | -0.07 | -0.03 | 0.00 | -0.01 | 0.00 |
| Coalition Patterns | ||||||||||
| 7) Percentage of coalitions | 12.70 | 7.50 | 5.20 | 4.10 | 3.20 | 9.10 | 5.90 | 4.20 | 3.10 | 2.50 |
| 8) Reciprocity of Support | 0.40** | 0.29** | 0.15** | 0.14** | 0.11** | 0.37** | 0.18** | 0.15** | 0.08* | 0.10** |
| 9) Groom Given for Support Received | 0.19* | 0.09* | 0.09** | 0.08** | 0.08** | 0.02 | 0.04 | 0.05 | 0.01 | 0.03* |
| 10) Support Given for Groom Received | 0.10 | 0.09 | 0.08** | 0.07** | 0.07** | 0.08 | 0.07* | 0.07* | 0.02 | 0.03 |
Social networks analyses
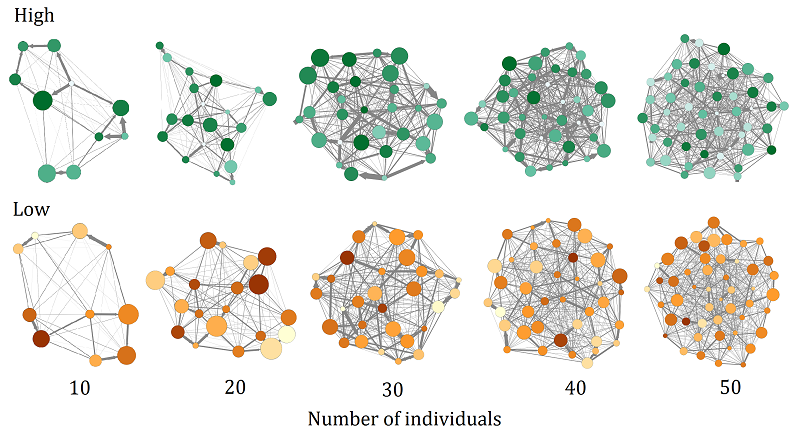
Since in empirical studies the analysis of social networks concerned all individuals (males and females), the results presented in this section concerned all individuals as well (males and females). In Figure 2, we present a graphic description of the social networks emerging in the “REAPER” model.
Effects of group size
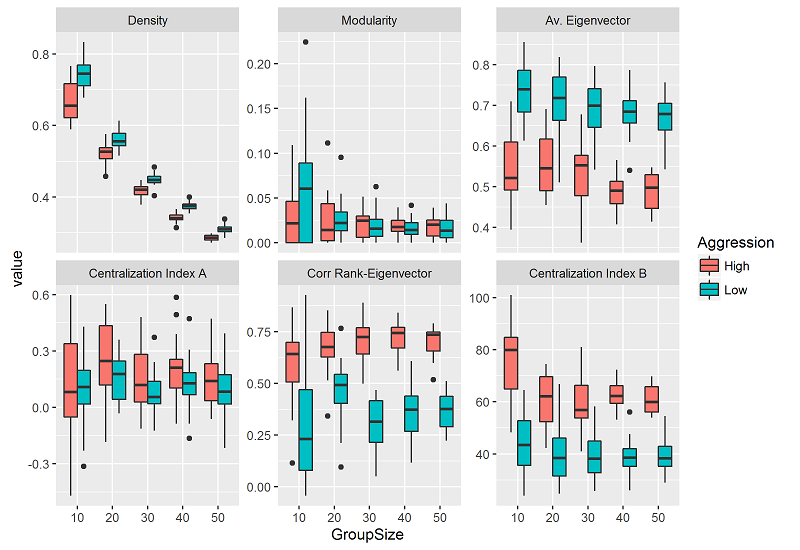
Group size had a negative effect on 1) density, 2) average eigenvector of the group, and 3) centrality index B. As group size increased the values of these metrics decreased (Figure 3; A-B, E in Table 3). Group size had no effect on the centralization index A and on the Spearman rank correlation coefficient between rank and eigenvector centrality (C-D in Table 3).
Effects of intensity of aggression
Compared to high intensity, low intensity of aggression had a positive effect on 1) density and 2) average eigenvector centrality (A-B in Table 3). Hence, at constant group sizes, networks emerging from simulations at low intensity had higher density and higher average eigenvector centrality than networks emerging from simulations at high intensity of aggression (Figure 3). In contrast, low intensity of aggression, had a negative effect on the Spearman rank correlation coefficient between dominance rank and eigenvector centrality, and both centrality indexes, A and B (C-E in Table 3). At constant group sizes, simulations at low intensity of aggression had lower values of the correlation coefficient between dominance rank - eigenvector centrality and of centralization indexes A and B than simulations at high intensity (Figure 3).
| Network metric | Factor | Coefficient ± SE | t-value | p-value |
| A) Density | Intercept | -0.113 ± 0.0139 | -8.13 | <0.001 |
| Low intensity of Aggression | 0.145 ± 0.0109 | 13.31 | <0.001 | |
| Group Size | -0.035 ± 0.0003 | -92.04 | <0.001 | |
| B) Average Eigenvector | Intercept | 0.572 ± 0.0118 | 48.333 | <0.001 |
| Low intensity of Aggression | 0.174 ± 0.0093 | 18.699 | <0.001 | |
| Group Size | -0.002 ± 0.0003 | -5.114 | <0.001 | |
| C) Corr. coeff. rank –eigenvector centrality | Intercept | 0.636 ± 0.0269 | 23.69 | <0.001 |
| Low intensity of Aggression | -0.328 ± 0.0211 | -15.56 | <0.001 | |
| Group Size | -0.002 ± 0.0007 | 2.13 | 0.054 | |
| D) Centralization Index A | Intercept | 0.173 ± 0.0325 | 5.338 | <0.001 |
| Low intensity of Aggression | -0.064 ± 0.0254 | -2.510 | 0.013 | |
| Group Size | -0.0001 ± 0.009 | -0.018 | 0.986 | |
| E) Centralization index B | Intercept | 69.923 ± 1.780 | 39.272 | <0.001 |
| Low intensity of Aggression | -23.434 ± 1.397 | -16.778 | <0.001 | |
| Group Size | -0.198 ± 0.049 | -4.019 | <0.001 |
Modularity
Due to the high frequency of zero values of modularity at low group sizes (Figure 3), two different GLMM models were built (see methods). A GLMM model with binomial distribution and logit link function was built using the zero-nonzero data. This model showed that group size had a positive effect on the probability of finding a value above 0 for modularity (Table 4). As group size increased the odds of finding a non-zero value increased. No effect of intensity of aggression was found (Table 4). With the non-zero data (n=168), a GLMM model with gamma distribution and log link function was built. The model showed that group size had a negative effect on modularity. As group size increased the values of modularity decreased (Table 4, Figure 3). No effect of intensity of aggression was found (Table 4).
| Model | Factor | Coefficient ± SE | z-value | p-value |
| Binomial logit link | Intercept | 0.324 ± 0.457 | 0.709 | 0.479 |
| Low intensity of Aggression | 0.314 ± 0.398 | 0.788 | 0.431 | |
| Group Size | 0.044 ± 0.015 | 2.910 | 0.004 | |
| Gamma log link | Intercept | -2.730 ± 0.150 | -18.238 | <2.00E-16 |
| Low intensity of Aggression | 0.080 ± 0.110 | -2.987 | 0.47 | |
| Group Size | -0.029 ± 0.004 | 12.033 | <1.00E-11 |
Discussion
As expected, in the ‘REAPER’ model the tendency of individuals to interact more with their ‘friends’ than with ‘no-friends’ resulted in the emergence of reciprocation of grooming and support and to a lesser degree in the interchange of grooming for support (Table 2). This mimics the results found in other theoretical studies in which differentiated relationships (i.e. the more frequent interactions among some individuals than with others) also resulted in reciprocation and interchange of social services (Campenni & Schino 2014; Evers et al. 2015; Hemelrijk & Puga-Gonzalez 2012; Puga-Gonzalez et al. 2015; Puga-Gonzalez et al. 2009; van Doorn & Taborsky 2012). Remarkably, in the ‘REAPER’ model, reciprocation and interchange emerged without individuals intending to do so, i.e. individual did not keep track of the balance of their grooming relationship. Instead, reciprocation emerged from the more frequent interactions among some partners than with others.
The REAPER model, however, failed to reproduce some socio-behavioral patterns typical of despotic and egalitarian macaque societies (Thierry 2004). For instance, at high intensity of aggression, aggression was bidirectional instead of unidirectional, and individuals did not groom more frequently partners of similar rank (2,6 in Table 2). Further, at low intensity of aggression individuals did not appear to interchange grooming for support and/or vice versa (9-10, Table 2). Furthermore, analyses of social networks from the REAPER model revealed that the structure of these networks bore little resemblance to the structure found in social networks from empirical data and the GrooFiWorld model. For example, in the REAPER model, the modularity of the networks did not differ between simulations at high and low intensity of aggression, had low values, and decreased as group size increased (Table 4, Figure 2); and the centralization of the networks decreased as group size increased (E in Table 3, Figure 2). This is contrast with findings in empirical data (Kasper & Voelkl 2009; Pasquaretta et al. 2014; Sueur et al. 2011a) and the GrooFiWorld model (Puga-Gonzalez & Sueur, unpublished data). In both, empirical data and GrooFiWorld, networks from despotic societies have higher modularity than those of egalitarian societies and, independent of dominant style, as group size increases so does the modularity and centralization of the network. Overall, thus, our results suggest that the mechanism of preferentially interacting more with ‘friends’ than with ‘no-friends’ is enough to generate patterns of cooperation (reciprocation and interchange), but not to generate other socio behavioural patterns and social network structure observed in macaque societies. This suggests that the spatial structure of the group may have a bigger effect than preferential interactions with ‘friends’ on the distribution of social interactions.
In the REAPER model, two behavioural patterns typical of despotic societies of macaques did not emerge at high intensity of aggression. The first pattern concerns aggression. In the REAPER model aggression was bidirectional at high intensity of aggression (2 in Table 2); whereas in GrooFiWorld (Hemelrijk & Puga-Gonzalez 2012; Puga-Gonzalez et al. 2009) and in despotic macaque societies aggression is unidirectional (Balasubramaniam et al. 2012). This result was surprising given that at high intensity of aggression the steepness of the hierarchy was high (CV ~ 0.7, 1 in Table 2), and within the range of values obtained in GrooFiWorld (Hemelrijk & Puga-Gonzalez 2012; Puga-Gonzalez et al. 2009). A steep hierarchy indicates a big differentiation among the dominance values of the individuals and thus, that individuals should be cautious and refrain from attacking dominant partners (Eq. 2). A closer inspection of the results, however, shows that bidirectional aggression seemed to depend on the degree of partner selectivity, i.e. on the values of alpha (\(\alpha\)): the higher the value of alpha, the higher the degree of bidirectional aggression. Only when the value of alpha was equal to 1, aggression became slightly unidirectional (TauKr correlation between aggression given and received: -0.08; p<0.05). This suggests that bidirectional aggression resulted from a higher frequency of interactions between preferred partners (‘friends’). The second pattern that the REAPER model failed to reproduce at high intensity of aggression was grooming directed towards partners of similar rank. This, we believe, was due to the lack of a spatial structure since in GrooFiWorld this pattern usually emerges. In GrooFiWorld, due to the spatial structure with dominants in the center and subordinates at the periphery, individuals of similar rank are closer and thus interact more frequently giving then rise to this correlation (Puga-Gonzalez et al. 2009).
As regards the analyses of social networks, results show that the features of the social networks in the REAPER model were not similar to those found in empirical data. Group size had a negative effect on the modularity and centralization of the networks (E in Table 3; Table 4); and intensity of aggression had no effect on the modularity of social networks. This is in contrast with findings from empirical data and the GrooFiWorld model. In societies of despotic macaques, a higher modularity is thought to be the result of the higher frequency of interactions among kin than non-kin related individuals (Sueur et al. 2011a). Further, several studies have shown that the higher the group size the higher the modularity and centralization of the network (Kasper & Voelkl 2009; Sueur et al. 2011a). In GrooFiWorld, modularity and centralization of the networks increase with group size because as group size increases it becomes more difficult for individuals to meet those far away and thus, interactions among all group members become more irregular and sparse. Consequently, interactions become more clustered (modularity increases), and networks become more centralized (Puga-Gonzalez & Sueur, unpublished data). As regards the higher modularity of networks at high than at low intensity of aggression, in GrooFiWorld this is a result of the higher centralization of dominants individuals, i.e. a more rigid spatial structure (Puga-Gonzalez et al. 2009). Unexpectedly, in the ‘REAPER’ model preferential interactions with ‘friends’ did not result in modular social networks. A possible explanation for this pattern is that in the ‘REAPER’ model individuals do not share the same ‘friends’, i.e. individuals do not interact preferentially with friends of their friends and therefore, no clusters of ‘friendships’ emerge. In primates, on the contrary, triadic closure (i.e. three individuals having strong grooming relationships among each other) is a phenomenon usually observed (Borgeaud et al. 2016). Hence, it seems that some other process is missing in the ‘REAPER’ model. This process may be simple or complex. For instance, triadic closure may result from the spatial structure of the group and proximity-based interactions; triad of individuals spending more time in proximity will interact more often and thus they may become ‘friends’ of each other. Triadic closure therefore, may already be an emergent property in the GrooFiWorld and GrooFiWorld with ‘friendships’ models. Alternatively, triadic closure may result from the strategic relationships individuals are presumed to establish in order to build coalitions and increase their dominance rank and/or have better access to resources (Dunbar 2003). Analysis of triadic closure in the different versions of the GrooFiWorld model as well as extensions of the model with more cognitive complex processes are a natural follow up of our research.
In this study, we modified a previous individual-based model of primate social behaviour to investigate the effect of ‘friendships’ on patterns of social behaviour and structure of social networks. Our main goal was to disentangle the effects of spatial structure from those of social bonding or “friendships”. Our results showed that although preferential interactions with ‘friends’ indeed result in high levels of cooperation (reciprocation and interchange) at the group level; this mechanism alone is not sufficient to reproduce other patterns of social behaviour and structure of social networks like it has been described in societies of macaques. It seems thus that a process(es) is missing. This may be a simple process such as spatial structure and proximity-based interactions or a more cognitive one as suggested by the ‘social brain’ hypothesis (Dunbar 2003). Hopefully future analyses and implementations in the model will help clarify this matter.
Acknowledgements
I.P.G. was supported by a post-doctoral research grant from the National Council of Science and Technology (CONACYT) of Mexico.References
AURELI, F., Cords, M., & Van Schaik, C. P. (2002). Conflict resolution following aggression in gregarious animals: A predictive framework. Animal Behaviour, 64, 325-343. [doi:10.1006/anbe.2002.3071]
AURELI, F., Preston, S. D., & de Waal, F. B. M. (1999). Heart rate responses to social interactions in free-moving rhesus macaques (macaca mulatta): A pilot study. Journal of Comparative Psychology, 113(1), 59-65.
BALASUBRAMANIAM, K. N., Dittmar, K., Berman, C. M., Butovskaya, M., Cooper, M. A., Majolo, B., et al. (2012). Hierarchical steepness, counter-aggression, and macaque social style scale. American Journal of Primatology, 1-11. [doi:10.1002/ajp.22044]
BARCHAS, P. R., & Mendoza, S. D. (1984). 'Emergent hierarchical relationships in Rhesus macaques: An application of Chase's model'. In P. R. Barchas (Ed.), Social hierarchies: Essays towards a sociophysiological perspective (pp. 81-95). Westport, CT: Greenwood Press.
BASTIAN, M., Heymann, S., & Jacomy, M. (2009). Gephi: An open source software for exploring and manipulating networks. Association for the Advancement of Artificial Intelligence: https://gephi.org/publications/gephi-bastian-feb09.pdf.
BERGHAENEL, A., Ostner, J., Schroeder, U., & Schuelke, O. (2011). Social bonds predict future cooperation in male barbary macaques, macaca sylvanus. Animal Behaviour, 81(6), 1109-1116.
BORGEAUD, C., Sosa, S., Bshary, R., Sueur, C., & van de Waal, E. (2016). Intergroup variation of social relationships in wild vervet monkeys: A dynamic network approach. Frontiers in Psychology, 7, 915. [doi:10.3389/fpsyg.2016.00915]
BROSNAN, S., & de Waal, F. (2002). A proximate perspective on reciprocal altruism. Human Nature-an Interdisciplinary Biosocial Perspective, 13(1), 129-152.
BUTTS, C. (2008). Social network analysis with SNA. Journal of Statistical Software, 24(1)
CAMPENNI, M., & Schino, G. (2014). Partner choice promotes cooperation: The two faces of testing with agent-based models. Journal of Theoretical Biology, 344, 49-55.
CHAPMAN, C. A., & Rothman, J. M. (2009). Within-species differences in primate social structure: Evolution of plasticity and phylogenetic constraints. Primates, 50(1), 12-22. [doi:10.1007/s10329-008-0123-0]
CROOK, J. H., Ellis, J. E., & Gosscustard, J. D. (1976). Mammalian social-systems - structure and function. Animal Behaviour, 24(MAY), 261-274.
CSARDI, G., & Nepusz, T. (2006). The igraph software package for complex network research. InterJournal, Complex Systems, 1695.
DI FIORE, A., & Rendall, D. (1994). Evolution of social organization: A reappraisal for primates by using phylogenetic methods. Proc Natl Acad Sci USA, 91, 9941-9945.
DUNBAR, R. I. M. (2003). The social brain: Mind, language, and society in evolutionary perspective. Annual Review of Anthropology, 32, 163-181. [doi:10.1146/annurev.anthro.32.061002.093158]
EVERS, E., de Vries, H., Spruijt, B. M., & Sterck, E. H. M. (2015). Emotional bookkeeping and high partner selectivity are necessary for the emergence of partner-specific reciprocal affiliation in an agent-based model of primate groups. PloS One, 10(3), e0118921.
FRANZ, M., McLean, E., Tung, J., Altmann, J., & Alberts, S. C. (2015). Self-organizing dominance hierarchies in a wild primate population. Proceedings of the Royal Society of London B: Biological Sciences, 282(1814) [doi:10.1098/rspb.2015.1512]
GRAVES, F. C., Wallen, K., & Maestripieri, D. (2002). Opioids and attachment in rhesus macaque (macaca mulatta) abusive mothers. Behavioral Neuroscience, 116(3), 489-493.
HAMILTON, W. D. (1964). The genetical evolution of social behaviour. I. Journal of Theoretical Biology, 7, 1-16. [doi:10.1016/0022-5193(64)90038-4]
HEMELRIJK, C. K., & Puga-Gonzalez, I. (2012). An individual-oriented model on the emergence of support in fights, its reciprocation and exchange. PLoS ONE, 7(5), e37271.
HEMELRIJK, C. K. (1999). An individual-oriented model on the emergence of despotic and egalitarian societies. Proceedings of the Royal Society London B: Biological Sciences, 266, 361-369. [doi:10.1098/rspb.1999.0646]
HEMELRIJK, C. K., Wantia, J., & Daetwyler, M. (2003). Female co-dominance in a virtual world: Ecological, cognitive, social and sexual causes. Behaviour, 140, 1247-1273.
HEMELRIJK, C. K. (1990). Models of, and tests for, reciprocity, unidirectional and other social interaction patterns at a group level. Animal Behaviour, 39, 1013-1029. [doi:10.1016/S0003-3472(05)80775-4]
HINDE, R. A., & Stevenson-Hinde, J. (1976). Towards understanding relationships: Dynamic stability. In Growing Points in Ethology, (pp. 451–479). Cambridge, UK: Cambridge University Press
HOGEWEG, P. (1988). 'MIRROR beyond MIRROR, puddles of LIFE'. In C. Langton (Ed.), Artificial life, SFI studies in the sciences of complexity (pp. 297-316). Redwood City, California: Adisson-Wesley Publishing Company.
HSU, Y., & Wolf, L. L. (1999). The winner and loser effect: Integrating multiple experiences. Animal Behaviour, 57, 903-910.
JAEGGI, A. V., De Groot, E., Stevens, J. M. G., & Van Schaik, C. P. (2013). Mechanisms of reciprocity in primates: Testing for short-term contingency of grooming and food sharing in bonobos and chimpanzees. Evolution and Human Behavior, 34(2), 69-77. [doi:10.1016/j.evolhumbehav.2012.09.005]
KASPER, C., & Voelkl, B. (2009). A social network analysis of primate groups. Primates, 50(4), 343-356.
KEVERNE, E. B., Martensz, N. D., & Tuite, B. (1989). Beta-endorphin concentrations in cerebrospinal-fluid of monkeys are influenced by grooming relationships. Psychoneuroendocrinology, 14(1-2), 155-161. [doi:10.1016/0306-4530(89)90065-6]
MARTEL, F. L., Nevison, C. M., Simpson, M. J. A., & Keverne, E. B. (1995). Effects of opioid receptor blockade on the social behavior of Rhesus monkeys living in large family groups. Developmental Psychobiology, 28(2), 71-84.
MASSEN, J. J. M., Sterck, E. H. M., & de Vos, H. (2010). Close social associations in animals and humans: Functions and mechanisms of friendship. Behaviour, 147, 1379-1412. [doi:10.1163/000579510X528224]
NEWMAN, M. E. J. (2004). Analysis of weighted networks. Phys.Rev.E, 70(5), 056131.
PASQUARETTA, C., Leve, M., Claidiere, N., van de Waal, E., Whiten, A., MacIntosh, A. J., et al. (2014). Social networks in primates: Smart and tolerant species have more efficient networks. Scientific Reports, 4, 7600. [doi:10.1038/srep07600]
PELTIER, M., Wilcox, C., & Sharp, D. (1998). Technical note: Application of the box-cox data transformation to animal science experiments. Journal of Animal Science, 76(3), 847-849.
PUGA-GONZALEZ, I., Hoscheid, A., & Hemelrijk, C. K. (2015). Friendships, reciprocation and interchange in an individual-based model. Behavioral Ecology and Sociobiology, 69(3), 383-394. [doi:10.1007/s00265-014-1850-4]
PUGA-GONZALEZ, I., Butovskaya, M., Thierry, B., & Hemelrijk, C. K. (2014). Empathy versus parsimony in understanding post-conflict affiliation in monkeys: Model and empirical data. PLoS ONE, 9(3), e91262.
PUGA-GONZALEZ, I., Hildenbrandt, H., & Hemelrijk, C. K. (2009). Emergent patterns of social affiliation in primates, a model. Plos Computational Biology, 5, e1000630. [doi:10.1371/journal.pcbi.1000630]
SABBATINI, G., Vizioli, A. D. B., Visalberghi, E., & Schino, G. (2012). Food transfers in capuchin monkeys: An experiment on partner choice. Biology Letters, 8(5), 757-759.
SCHINO, G. (2007). Grooming and agonistic support: A meta-analysis of primate reciprocal altruism. Behavioral Ecology, 18(1), 115-120. [doi:10.1093/beheco/arl045]
SCHINO, G., & Aureli, F. (2008). Grooming reciprocation among female primates: A meta-analysis. Biology Letters, 4(1), 9-11.
SCHINO, G., & Aureli, F. (2010). Primate reciprocity and its cognitive requirements. Evolutionary Anthropology, 19, 130-135 DOI 10.1002/evan.20270. [doi:10.1002/evan.20270]
SHULTZ, S., Opie, C., & Atkinson, Q. D. (2011). Stepwise evolution of stable sociality in primates. Nature, 479(7372), 219-U96.
SHUTT, K., MacLarnon, A., Heistermann, M., & Semple, S. (2007). Grooming in barbary macaques: Better to give than to receive? Biology Letters, 3(3), 231-233. [doi:10.1098/rsbl.2007.0052]
SILK, J. B. (2007). Social components of fitness in primate groups. Science, 317(5843), 1347-1351.
SILK, J. B. (2002). Using the "F"-word in primatology. Behaviour, 139, 421-446. [doi:10.1163/156853902760102735]
SILK, J. B., Alberts, S. C., & Altmann, J. (2003). Social bonds of female baboons enhance infant survival. Science, 302, 1231-1234.
SUEUR, C., Deneubourg, J. L., & Petit, O. (2011a). From the first intention movement to the last joiner: Macaques combine mimetic rules to optimize their collective decisions RID A-4020-2011. Proceedings of the Royal Society B-Biological Sciences, 278(1712), 1697-1704.
SUEUR, C., Deneubourg, J., & Petit, O. (2012). From social network (centralized vs. decentralized) to collective decision-making (unshared vs. shared consensus). Plos One, 7(2), e32566.
SUEUR, C., Deneubourg, J., Petit, O., & Couzin, I. D. (2011b). Group size, grooming and fission in primates: A modeling approach based on group structure. Journal of Theoretical Biology, 273(1), 156-166. [doi:10.1016/j.jtbi.2010.12.035]
SUEUR, C., & Petit, O. (2008). Organization of group members at departure is driven by social structure in macaca. International Journal of Primatology, 29(4), 1085-1098.
SUEUR, C., Petit, O., De Marco, A., Jacobs, A. T., Watanabe, K., & Thierry, B. (2011c). A comparative network analysis of social style in macaques. Animal Behaviour, 82(4), 845-852. [doi:10.1016/j.anbehav.2011.07.020]
R CODE TEAM (2015). R: A language and environment for statistical computing. Vienna, Austria: R Foundation for Statistical Computing.
THIERRY, B. (2004). 'Social epigenesis'. In B. Thierry, M. Singh & W. Kaumanns (Eds.), Macaque societies: A model for the study of social organisation (pp. 267-289). Cambridge: Cambridge University Press.
TRIVERS, R. L. (1971). The evolution of reciprocal altruism. Quarterly Review of Biology, 46, 35-57.
TROISI, A., Schino, G., & Aureli, F. (1989). Allogrooming and interindividual proximity in two species of macaques (macaca fascicularis and M. nemestrina). Behaviour, 111, 196-207. [doi:10.1163/156853989X00655]
VAN DOORN, G. S., & Taborsky, M. (2012). The evolution of generalized reciprocity on social interaction networks. Evolution, 66(3), 651-664.
VOELKL, B., Kasper, C., & Schwab, C. (2011). Network measures for dyadic interactions: Stability and reliability. American Journal of Primatology, 73(8), 731-740. [doi:10.1002/ajp.20945]
WHITEHEAD, H. (2008). Analyzing animal societies: Quantitative methods for vertebrate social analysis. Chicago: University of Chicago Press.
WILENSKY, U. (1999). NetLogo. http://Ccl.northwestern.edu/netlogo/. center for connected learning and computer-based modeling, Northwestern University. Evanston, IL.