
Introduction
Due to mass migration, many societies have witnessed a strong increase in ethnic and cultural diversity in recent decades. Rising levels of ethnic diversity are accompanied by ethnic segregation between and within cities and between and within neighborhoods (Phillips 2007). Furthermore, in many western countries, ethnic residential segregation has developed alongside with a rise of anti-immigrant attitudes and support for radical right-wing parties. This has renewed public and scholarly interest in the societal consequences of diversity. Pundits identify ethnic residential segregation as one potential source of polarization between ethnic groups in terms of opinions about salient societal issues, such as cultural values and those regarding immigration and integration policies (Semyonov & Glikman 2008). Scholars inquire if and how ethnic segregation may actually be causally related to the emergence of extreme attitudes towards ethnic minorities (Edwards 2016; Semyonov & Glikman 2008; Valdez 2014; van der Waal, de Koster & Achterberg 2013). Segregation in other societal realms has also been linked to polarization. For example, scholars suggested that spatial seating arrangements and segregated networks of party affiliations in the U.S. senate relates to patterns of polarization in the voting behavior of parliamentarians (Liu & Srivastava 2015). Yet, despite many empirical studies of the relationship between spatial segregation and opinion polarization, there is no consensus in the literature on whether segregation is a sufficient condition for opinion polarization to arise and on the causal mechanisms linking these two phenomena.
We address the segregation polarization relationship theoretically by framing the puzzle in a formal fashion and adopting a generative approach (Epstein 2006). We study how, when and where spatial segregation based on a static demographic characteristic leads to the emergence of opinion polarization. We test different causal pathways by explicating alternative micro-level mechanisms (i.e. how) under different initial segregation patterns (i.e. when) and by assessing the extent of opinion polarization between and within demographic groups both at the global and local level (i.e. where).
Literature overview
Following the line of previous conceptualizations of polarization (DiMaggio, Evans & Bryson 1996; Esteban & Ray 1994), we define opinion polarization as a process in which a population gradually falls apart into subgroups in an opinion space with increasing disagreement between the opinion subgroups, and increasing agreement within them. When opinions are only polarized between the different demographic groups but not within each specific demographic group, we speak of strong alignment between opinions and demographic groups. Spatial segregation implies different group compositions in different (sub)localities, subsequently patterns of polarization may differ between local regions but also between groups at the global level.
The challenge of modelling opinion polarization as an emergent phenomenon within an agent-based computational modelling framework has attracted increasing attention from scholars in recent years. Some (Alizadeh et al. 2014; Huet, Deffuant & Jager 2008) develop agent-based models of opinion polarization building on classic bounded confidence models (Deffuant & Amblard 2002; Hegselmann & Krause 2002). Others propose models that generate opinion polarization as result of agents’ biased-assimilation to social influences (Dandekar, Goel & Lee 2013). Two further prominent classes of models in the literature on opinion polarization are the models of negative influence (Flache & Macy 2011b; Macy et al. 2003) and of social influence based on persuasive arguments (Mäs & Flache 2013; Mäs et al. 2013) both of which root in classic sociological and psychological theories of polarization processes (Myers 1982).
We will align and compare these two types of models in a model-to-model analysis (Axtell et al. 1996; Hales, Rouchier & Edmonds 2003). These classes of models share two features that make them highly suitable for the aim of our investigation. First, in order to generate opinion polarization, strong initial opinion disagreement between agents from different groups is not a necessary condition. This feature is crucial because it allows understanding how polarization may arise from minimal conditions, even when there is no prior disagreement separating groups. Secondly, models drawing on negative influence and persuasive argument processes allow linking the change of agents’ opinions to both (dynamic) opinions and (static) demographic characteristics of interacting agents. A static attribute (e.g. ethnicity) allows to incorporate spatial group segregation as an exogenously imposed social condition in a model of opinion dynamics in which exposure to outgroup members will decrease with increasing segregation between groups.
Previous research suggests that these two classes of models support opposite intuitions about the role that spatial segregation plays for opinion polarization with fundamentally different substantive implications. Models of negative influence point to the intuition that polarization between groups may best be avoided by preventing the exposure of individuals to a negatively evaluated outgroup. Conversely, models of persuasive arguments suggest that exposure to the outgroup may be crucial in preventing polarization (Flache & Mäs 2008a; Mäs et al. 2013). To the extent that spatial proximity is a determinant of chances of interaction between people (Backstrom, Sun & Marlow 2010; Balland 2012; Hipp & Perrin 2009), this leaves us with opposite implications for the relation between spatial group segregation and polarization. However, previous modelling work also is far from conclusive about this. In earlier studies, segregation was at best manipulated indirectly, with highly stylized patterns of segregation in the distribution of fixed attributes in small-scale interaction networks. Our study puts at test whether and to what extent the conflicting predictions of the models of negative influence and persuasive arguments remain robust when much larger (N =6400) and more realistic network topologies are taken into account. We impose different initial residential segregation patterns, which vary in cluster size and cluster homogeneity, and we investigate how group segregation affects the emergence of opinion patterns between and within demographic groups at both the global level (i.e. the entire network or ‘country’) and at the local level (i.e. within specific subparts of our network or ‘neighborhoods’).
Thus our research provides new insights into the conditions under which different levels of segregation may foster (or prevent) polarization and into the patterns through which the two competing sets of assumptions predict polarization to emerge.
Formal models incorporating the negative influence mechanism build on classical computational models of social influence (Abelson 1964; French 1956; Harary 1959). The latter only assume positive social influence – that is, interacting individuals tend to reduce their opinion differences. In line with the homophily principle (McPherson, Smith-lovin & Cook 2001), more recent extensions (Axelrod 1997) assume that interactions between more similar individuals are more likely to occur or more strongly affect opinions than interactions between less similar ones. Models of negative influence add that individuals are not only homophilic, but xenophobic, too. This can be derived from cognitive theories (Festinger 1957; Heider 1946), which assume that individuals strive for balanced cognitions. They tend to like similar people and dislike dissimilar ones. In models building on negative influence, being exposed to dissimilar others evokes negative influence, defined as the tendency of individuals to adjust their opinions in a way to increase opinion differences to negatively evaluated others (Macy et al. 2003). The negative influence is assumed to be stronger when attitudinal and demographic dissimilarity is stronger or more salient. For negative influence models, negative influence of dissimilar others in combination with positive influence of similar others is the key mechanism for explaining the emergence of opinion polarization in a population (Baldassarri & Bearman 2007; Flache & Macy 2011b; Flache & Mäs 2008b).
In case of an exogenously imposed segregation of agents by a demographic characteristic, a model of negative influence makes the counterintuitive prediction that lack of group segregation fosters opinion polarization between the groups. The reason is that members of segregated groups have less chance to be exposed to dissimilar others (members of the outgroup), and thus less chances to get negatively influenced and maximize opinion distance to outgroup members. We thus want to assess in this study whether and to what extent the negative influence model implies that there is a negative relationship between the level of spatial segregation by a demographic characteristic and the emergence of opinion polarization.
Compared to the negative influence model, the model of persuasive arguments (Mäs & Flache 2013) employs a very different mechanism. It combines the homophily principle and the assumption that individuals sharing opinions also share arguments supporting such opinions (Vinokur & Burnstein 1978). Two interacting partners with similar opinions keep on providing each other new arguments supporting their initial tendencies. Previous modeling work showed how this results in their opinions slowly shifting towards the extreme end of the opinion scale they initially leaned to. As different network regions may develop different extreme opposite opinions, the exchange of persuasive arguments can lead to opinion polarization at the macro level without the assumption of negative influence or even without interaction between members of different demographic groups (Mäs & Flache 2013; Mäs et al. 2013).
Assuming that agents of the same demographic group (ingroup) exert a stronger influence than outgroup ones, we expect that the model of persuasive arguments predicts more opinion polarization for increasing levels of spatial segregation. This is because, under conditions of spatial segregation based on a demographic characteristic, agents will be more exposed to their demographic ingroup members and less exposed to demographic outgroup members. To the extent that demographic subgroups have different initial opinion tendencies (Mäs et al. 2013), this increased exposure to demographic in-group members will lead to a reinforcement of initial opinion tendencies within a demographic subgroup and to increasing differences between demographic subgroups. Our study investigates whether and to what extent there is a positive relationship between the level of spatial segregation by a demographic characteristic and the emergence of opinion polarization.
While previous work points to opposite implications for these types of models, it remains unclear how and under what conditions segregation has opposite effects. In both models polarization depends on a range of further conditions such as sufficiently strong levels of homophily (Mäs et al. 2013), or sufficient spatial connectedness (Flache & Macy 2011b) and the spatial settings employed in previous work were either highly stylized (Flache & Macy 2011b) or assumed no spatial segregation at all (Mäs et al. 2013).
To address this gap we develop a formal and computational model[1], implemented in NetLogo (Wilensky 1999), which incorporates the two mechanisms of negative influence and persuasive argument exchange within one framework. This allows us to compare how different levels of segregation affect emergent opinion polarization under each of the two different mechanisms of polarization. Then we compare in more detail the patterns through which polarization emerges according to both mechanisms: we explore the extent to which they produce alignment between group membership and opinions and how segregation affects polarization both at the global and at the local level. Thus, we provide a better understanding of the conditions under which according to two prominent formal theories of opinion polarization, segregation fosters or represses opinion polarization.
Formal and computational model
Our model defines agents as cells of a toroidal grid (size: 802 = 6400 agents)[2]. Interactions between agents can be regarded as exposure events (Pettigrew & Tropp 2006) – these take place in discrete time points and only between spatial neighbors. Each agent’s neighborhood (or interaction network) is defined as the set of n closest agents (based on a Euclidean distance). The neighborhood size n is an exogenously given model parameter and equal for all agents. We start by considering a baseline scenario with Moore neighborhoods (neighborhood size = 8).Previous work points out that both the size of the neighborhood (Flache & Macy 2011a) and the presence of interaction noise (Mäs Flache & Helbing 2010) may profoundly affect opinion dynamics. Interaction noise implements a small chance that agents may interact with agents outside their neighborhood or who are too dissimilar to otherwise allow for interaction under the rules of the model. Thus, we also explore the robustness of model results to variation in both neighborhood size, and presence of interaction noise.
Our main interest is in opinion polarization dynamics that revolve around one dominant issue and where groups are defined by one salient demographic feature. To capture this, we assume that agents only have a single varying and a single static characteristic representing their opinion on an issue and their group membership, respectively. An agents’ opinion, o, is a continuous variable with range [-1,+1]. An agent’s group membership, g, is represented by a dichotomous variable {-1,+1}.
Our model represents the homophily principle in two ways: structurally and behaviorally (McPherson et al. 2001). Structural homophily is imposed through the spatial segregation of the two groups. Due to the segregated environment, individuals’ neighborhoods are structurally more likely to comprise ingroup members. Stronger segregation implies reduced chances of contact with and exposure to outgroup members and increased chances of contact with and exposure to ingroup members.
Behavioral homophily is modeled as part of the opinion dynamics processes. Drawing from cognitive theories, we model behavioral homophily such that positive influence is stronger between more similar neighbors than between dissimilar neighbors (Festinger 1957; McPherson et al. 2001).For the negative influence model only, we also assume that negative influence is stronger for more dissimilar neighbors (Flache & Macy 2011b).
In other words, homophily affects the degree of influence between two individuals, where stronger influence implies stronger opinion changes. In this sense, the way we implement homophily is very much similar to the role that trust has in other modeling work (Grandi, Lorini & Perrussel 2015): here, influence on individuals’ opinions is assumed to be stronger between individuals who trust each other more. While individuals may not necessarily always trust those more who are more similar to them, empirical studies point to a tendency of people to evaluate similar others more favorably (Byrne 1997) and to be more open to positive influence from similar others (Burnstein, Stotland & Zander 1961). Finally, it should be noted that an alternative approach to implement behavioral homophily would be to assume that neighborly interactions are more likely between similar neighbors (Axelrod 1997; Flache & Macy 2011a).
Model initialization: the segregation procedure
Each simulation run is initialized by segregating agents based on their group membership by means of a residential segregation model. Agents are divided into two equally sized groups. Building on previous research (Stoica & Flache 2014), we model the environment with an exogenously imposed level of segregation by running a Schelling-like model of residential segregation. Our segregation model builds on and adapts Schelling’s (1971) in that agents decide whether to move to a different location based on a utility function (Zhang 2004) that allows to gradually differentiate the strength of a preference for a local ingroup concentration. For a detailed description of the residential segregation model we make use of, see Appendix I.
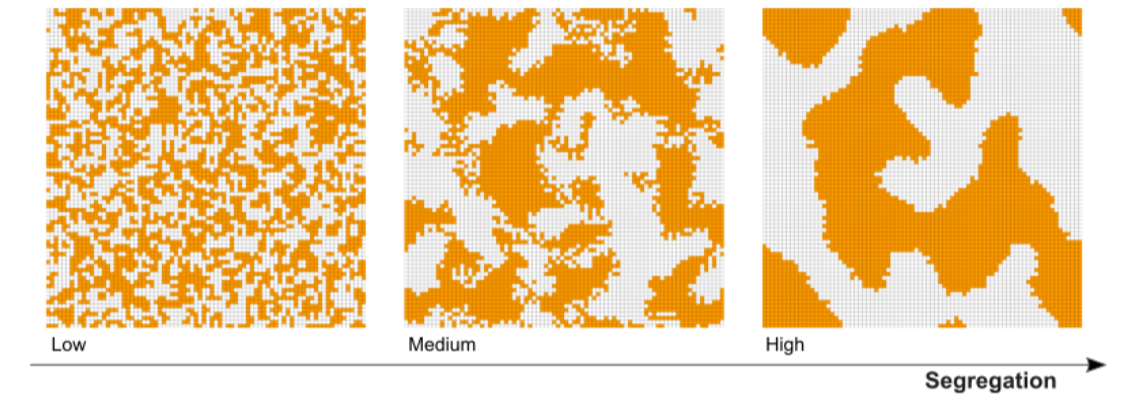
We initialize our opinion formation model with three predetermined levels of group segregation, denoted low, medium and high. As exemplified in Figure 1, an increasing level of segregation implies bigger and more homogeneous group agglomerations. As reported in greater detail in Appendix I, the substantive difference between these three settings differs quantitatively, too: across all simulation runs, the dissimilarity (or ‘concentration’) index D by Massey and Denton (1988) scores 0.29 (std = 0.11) for low-segregated settings; 0.68 (std =0.11) for medium segregation, and 0.83 (std = 0.07) for high segregation. Intuitively, this index indicates the fraction of the population that would need to be relocated to achieve equal group distributions in all neighborhoods in the world.
Opinion dynamics
Once the residential segregation model terminates, we run the model of opinion formation. Each agent’s initial opinion is randomly assigned based on a uniform probability distribution. At each unit of time, one agent i is selected at random to pick one other agent j randomly selected from her neighborhood for one dyadic interaction (or ‘exposure event’). Interactions result in the initiating agent i updating her opinion. How agents update their opinion depends on the specific mechanism under consideration, the negative influence or persuasive argument exchange.
Negative influence
Like in the original model of negative influence (Flache & Macy 2011b; Macy et al. 2003), the influence of a neighboring agent j on the opinion of the focal agent i is mediated by a weight, w, measuring the similarity between the two interacting agents ranging between -1 and +1. Similarity is based on difference in opinion as well as in group membership. Formally, after having been selected for an influence event at time point t, agent i updates her weight w toward her selected neighbor j as follows.
| $$W_{ij,t} =1-\frac{|o_{j,t}-o_{i,t}|H+|g_{j}-g_{i}|}{1+H}$$ | (1) |
H is the behavioral homophily parameter – it captures the relative importance of group membership and opinion in determining the weight w. We will assume that H > 1. This allows for the possibility that the weight between agents belonging to the same demographic group and to different ethnic groups can both be negative and positive. Along with the other robustness tests, we will discuss effects of assuming various different values of H (Appendix III). A higher weight w signifies a stronger similarity between i and j, and vice versa. The highest similarity (w = 1) occurs when i and j belong to the same group and have an identical opinion. Conversely, the highest dissimilarity (w = -1) is between two agents belonging to different groups and having opposite extreme opinions.
In line with previous models, agents update their opinion using w in order to weight the extent of positive or negative influence to which they are exposed. Neighbors very similar to i (in case of w close to 1), or very dissimilar (in case of w close to -1), exert a stronger impact on i’s change of opinion. The weight w is used to model behavioral homophily (for 0<w<1) and xenophobia (-1<w<0), as shown in equation 2. In equation 2, \(\Delta o_{i,t}\) represents the raw opinion change resulting from an interaction of i with j at time t based on the negative influence mechanism.
| $$\Delta o_{i,t} =\frac{1}{2}(o_{j,t}-o_{i,t})w_{ij,t}$$ | (2) |
We call \(\Delta o\) "raw" opinion change because with \(-1 ≤ \Delta o ≤ 1\) it cannot be guaranteed that\(o_i\) remains within the interval [-1,+1] after adding \(\Delta o\) to the prior opinion. Accordingly, \(o_{i,t+1}\) is defined as \(o_{it}+\Delta o_{it}\) unless this sum exceeds the boundaries of [-1,+1]. Otherwise, \(o_{i,t+1}\) is set to the interval boundary nearest to \(o_{it}+\Delta o_{it}\). Equations 1 and 2 jointly implement the effects of homophily, xenophobia and social influence. For 0<w<1, the raw opinion change \(\Delta o\) is positive. According to the behavioral homophily principle, greater similarity w produces stronger positive influence: the more similar i and j, the more i shifts her opinion towards j’s opinion (positive influence). For -1<w<0, xenophobia holds: greater dissimilarity between i and j triggers more negative influence, with i moving her opinion further away from j’s.
Persuasive argument
The mechanism of persuasive argument exchange mimics the previous agent-based models grounded in the so-called Argument-Communication Theory of Bipolarization (Mäs et al. 2013). As we use a much larger population size than previous studies, we developed a slightly simplified but computationally more efficient implementation. In Appendix II we show how our version produces largely the same behavior than the original model, but we also discuss some small differences. As in the original model, we assume that agents’ opinion depends on the arguments they possess in favor or against a certain issue. An agent with mostly positive (negative) arguments on the issue at stake has a positive (negative) opinion about it. We also assume that agents have a finite memory capacity, so that they can only know S arguments simultaneously. Because of this, every time i receives a new argument from j, she drops, or 'forgets', an old argument. Furthermore, S≥2: that is, agents actually have a memory, and a new argument does not entirely determine their new opinion. Because in our model the opinion range equals 2, we define 2/S as the maximal change a new argument can cause in i’s opinion. Variable a represents the opinion push of a new argument that i gets from j: a therefore assumes values {+2/S, 0, -2/S}, causing a positive, null or negative opinion change. In our baseline scenario an agent’s memory capacity S contains 7 items. A discussion of the effects of a smaller memory can be found in Appendix III.
The argument exchange during an interaction takes place as follows. Variable a depends on the outcome of two events: agent j picking a pro or con argument, and agent i dropping a pro or con argument. All pro arguments have the same impact on the opinion and so have all con arguments. The probability that a pro argument gets picked from an agent’s set of current arguments is
| $$Probability\,of\,picking\,a\,pro\,argument =\frac{(o_{j,t}+1)}{2}$$ | (3) |
| $$ Probability\,of\,picking\,a\,con\,argument =1-\frac{(o_{j,t}+1)}{2} $$ | (4) |
If i drops (forgets) the same kind of argument that j picks (suggests), i’s opinion is unaffected by the argument exchange. We denote this outcome 'ineffective argument exchange'. Conversely, if i drops an argument of a different kind than the one j picks, then i’s opinion changes according to the kind of argument suggested by j. Equation 5 specifies the rules that determine the value of a:
| $$a_{i,t}\begin{cases} \frac{2}{S} & for\,j\,picking\,a\,pro\,and\,i\,dropping\,a\,con\,argument\\ 0 & for\,ineffective\,argument\,exchange\\ -\frac{2}{S} & for\,j\,picking\,a\,con\,and\,i\,dropping\,a\,pro\,argument \end{cases} $$ | (5) |
| $$ \Delta o_{i,t} =a_{i,t}\frac{w_{ij,t}+1}{2} $$ | (6) |
The weight w is the same weight as defined in Equation 1 for the negative influence model. However, w is here manipulated by adding 1 and dividing by 2. This reflects the fact that, for the model of persuasive arguments, the weight w should only capture homophily and not xenophobia: greater similarity between i and j implies stronger effect of the argument a on the raw opinion change \(\Delta o\), whereas greater dissimilarity implies a smaller (but not negative) impact of a. Furthermore, this equation allows argument exchanges to take place between very different actors, even those with negative weights w. For S≥2, Equations 5 and 6 bind \(\Delta o\) to range between -2/S and 2/S.
The interaction event is concluded with calculating the updated opinion \(O_{i,t+1}\) from \(o_{i,t}+\Delta_{i,t}\) with the same rule used for the negative influence model.
Outcome measures
The most important model outcome is the degree of opinion polarization. We measure opinion polarization in two ways. First, we compute as an intuitive measure the variance of opinions in the whole population. Second, we follow the line of previous research using similar models (Flache & Mäs 2008b, 2008a), and operationalize polarization as the variance in the distribution of the pairwise opinion differences \((d_{ij})\) across all dyads of agents. For computational efficiency, we compute the polarization index on a random sample of dyads. Tests showed that a sample of 64 agents (1% of the population) suffices to estimate the polarization index in the population with sufficient accuracy. Formally, the polarization of opinions in the population at time point t is defined as:
| $$P_{t} =\frac{1}{N(N-1)}\Sigma_{ij\in N,i\neq j}(d_{ij,t}-\overline{d_{t}})^{2} $$ | (7) |
This index scores between 0 and 1, where \(P_t =0\) corresponds with full consensus in the population and the maximum of \(P_t ≈1\) is approximated by a population that is divided equally between the extreme opinions of -1 and +1 (for more details, see Flache & Macy 2011b).
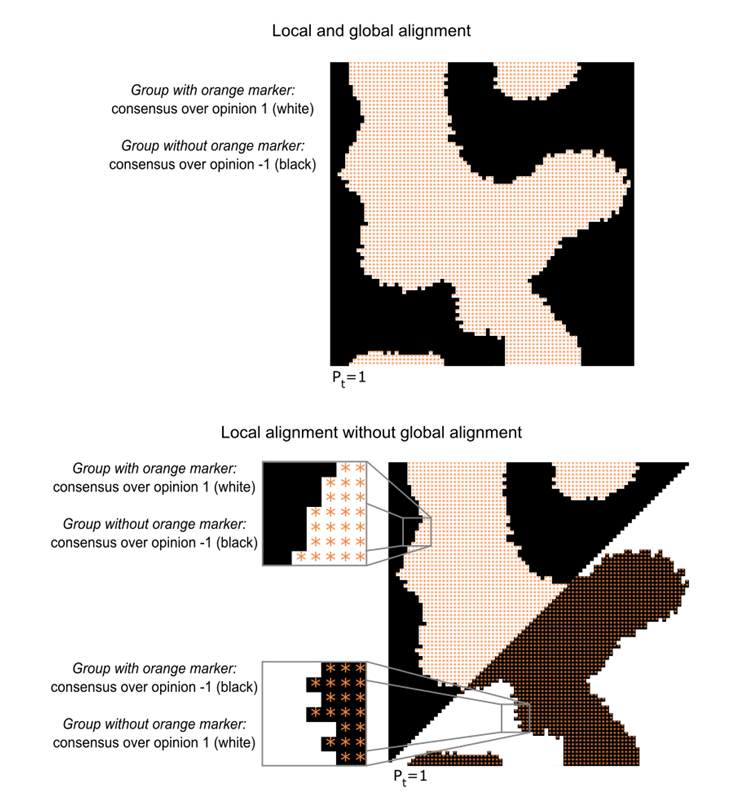
Along with opinion polarization, we also want to measure the extent to which demographic group membership and opinions overlap – in other words, to which extent opinion differences between agents are aligned with differences in group membership. When group membership and opinion are perfectly aligned, all agents belonging to the same demographic group hold exactly the same opinion which is maximally different from the opinion of agents of the other demographic group. However, such alignment can arise differently in different spatial regions of the world. That is, in some areas members of group 1 may share a positive opinion and members of group -1 share a negative opinion, while in other areas of the map members of the two groups may share the opposite opinions. Figure 2 visualizes with stylized examples the difference between a scenario in which opinion alignment occurs both at the local and global (upper pane) level, and a setting where this alignment occurs only at the local level (lower pane). In the latter case, between-group differences in opinions may not be large in the population as a whole, but nevertheless there is large polarization between different groups in any particular local region. To disentangle effects of spatial segregation on local and global alignment, we scrutinize in the following first the presence of alignment at the level of the entire population (hereafter, 'global alignment'), and second the presence of alignment within sample neighborhoods (‘local alignment’).
We capture global alignment by the difference between opinion variance measured on the entire population, and opinion variance measured within the two groups separately. The more opinion variance in the population as a whole exceeds the opinion variance within the two groups, the stronger is global alignment. Conversely, a lack of global alignment corresponds to no differences between these variances.
In order to measure local alignment, we sample 1% of agents (N = 64) at time point 2000 of each simulation run. We need to look into the opinion distribution within individual neighborhoods. Because neighborhoods may overlap, and because a demographic group might be underrepresented in some neighborhoods, we cannot rely on opinion variances as we did for measuring global alignment. Instead, we measure local alignment by computing the average opinion distance between the sampled agents and their local ingroup neighbors, as well as their local outgroup neighbors, based on the given neighborhood size. Local alignment is operationalized as the difference between these two measures. When group membership and opinions are locally aligned, this shows through smaller differences in opinion between agents and their ingroup neighbors, and bigger differences between them and their outgroup neighbors.
Results
We ran 14400 independent simulations, 7200 for each of the two opinion formation mechanisms. For each run we executed 2000 iterations – more than the few hundreds iterations typically needed for the system to reach a state in which no further systematic change could be discerned within the time frame simulated. For the negative influence model we conducted 200 runs for each parameter combination, and 100 in the case of the model of persuasive arguments (as this model has one extra parameter to explore, S). The parameters we varied are: level of segregation (low, medium, high), H (1, 3), neighborhood size (8, 36), presence of interaction noise (0%, 1%, 5%) and, for the persuasive argument model solely, the parameter S (3, 7). Our main substantive interest was in the effects of the level of segregation. We first present these effects for a well-defined ‘baseline scenario’, keeping all other parametersfixed. Subsequently, effects of the variation of further parameters will be discussed. The ‘baseline scenario’ is characterized by the following vector of parameters:
- H = 3: this represents the baseline assumption that, compared to agents’ group membership, their opinion has a bigger impact on the similarity weight w. It follows from equation 1 that, if two agents have maximally different opinions, the magnitude of their negative weight is twice as big for agents belonging to different demographic groups (-1) than for agents belonging to the same group (-0.5). Similarly, this assumption allows both negative and positive weights regardless of agents’ group membership. For H = 3, an opinion difference \(|o_{j,t}-o_{i,t}|≥1.4\) between two agents belonging to the same group (thus \(|g_j-g_i| =0)\) is enough to yield a negative weight; similarly, an opinion difference smaller than 0.7 between outgroup agents produces a positive weight.
- S = 7: this is the maximum memory length inspected in earlier studies of the original model. We take this value in order to best approximate the continuity of the opinion space.
- neighborhood size equals 8: thus we imposed a Moore neighborhood, reflecting the assumption of strongly local interaction.
- no interaction noise.

For illustration, Figure 3 depicts for both models a typical run under the baseline scenario with medium segregation. As visible here, under the negative influence mechanism polarization emerges from the boundaries that separate clusters of the two different groups. Agents located at these boundaries are highly likely to have negative interaction weights with their outgroup neighbors, due to the difference in group membership. As a consequence, they are likely to be negatively influenced by these neighbors and to shift their opinions towards the extreme end of the scale opposing their neighbors’ opinions. Then, as time proceeds, positive influence between ingroup members spreads the extreme opinions of agents on the boundaries towards the interior area of their in group cluster. Eventually, all group boundaries become opinion boundaries, too. The animation shows that polarization is likely to occur at boundaries between groups, but it also illustrates that opinion splits can develop within a spatial cluster. This is possible because different local alignments can occur at different boundaries of a cluster. From these different boundaries, opposite extreme opinions will then further spread within a cluster until their incumbents become direct neighbors who are too different to further influence each other or are separated by a small zone of fellow group members adopting intermediating positions on the opinion scale.
The spatial arrangement of opinion clusters generated by the persuasive argument mechanism looks rather different: here, polarization cascades are not triggered by agents lying on group clusters’ boundaries. In addition, emerging opinion clusters appear to be overall less polarized, and their boundaries are less sharp. Thus, group clusters and opinion clusters show little overlap. This result seems to contradict earlier work based on the model of persuasive arguments that revealed how sharp opinion polarization can quickly arise between demographically different subgroups (Mäs et al. 2013). We expect that this difference is largely due to the fact the we employ a much larger population size than previous studies. This greatly increases the coordination complexity of the sequence of events that is required to produce alignment of the arguments within and between groups. Mäs et al. (2013) showed how already with a population of N = 20 several thousands of interaction events were required to generate high levels of polarization between groups in their model. We further explored this explanation and the robustness of our results in additional experiments (see also appendices II and III).
To systematically assess effects of segregation in the baseline scenario, we proceeded by first investigating the effects of different levels of segregation on the emergence of opinion polarization according to the two models. Then, we focused on the patterns through which polarization is generated, and distinguished global from local alignment between opinions and group membership. Because in the baseline scenario the outcome measures are quasi-normally distributed, we analyze the simulations’ output through analyses of variance.
Segregation and opinion polarization
We wanted to test whether the negative influence model predicts that segregation reduces polarization, whereas the persuasive argument model implies the opposite relationship.

Figure 4 shows, for two typical simulation runs, the effects of different levels of segregation on the models’ outcome. High segregation implies smaller chances of contact between and exposure to outgroup members. For the negative influence model, this translates to agents’ decreased chances of being exposed to negative influence, and thus leads to less polarization. In fact, at time = 2000 we observe strong polarization on the borders of group clusters, where intergroup contacts take place; both in the low and in the high segregation condition. However, this translates into less overall polarization in the high segregation condition, because here the inner areas of group clusters are larger, where intergroup contacts are inhibited and agents are therefore more likely to share a moderate opinion. For the model of persuasive arguments, more segregation translates to more chances for agents to end up in a mutual reinforcement loop with similar agents (who exert stronger influence). Thus, this should lead to more polarization. However, Figure 4 shows no visually discernible effect of segregation on the emergence of opinion polarization under the assumption of persuasive argument exchange. Next, we computed quantitative measures of polarization for the different levels of segregation, in order to obtain a more precise assessment of the effects of segregation.
Figure 5 charts the effects of segregation on the measures of opinion polarization in the population, averaged across all simulation runs conducted for the baseline scenario. We see that the negative influence model generates a clear negative relationship between segregation and polarization, whereas the association is very weakly positive for the model of persuasive arguments. This supports the intuitions that earlier work suggests for the more complex and realistic setting investigated here. According to a negative influence process, increasing spatial segregation results in less opinion polarization. The model of persuasive arguments hints at the opposite prediction. Here, spatial segregation shows a very weak positive effect on polarization.
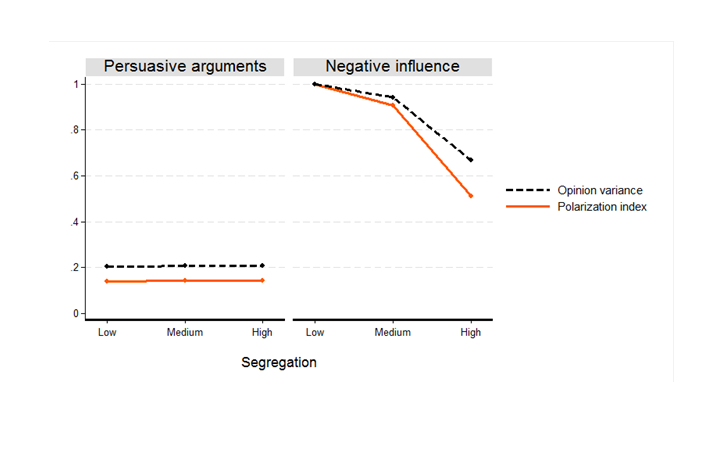
An ANOVA on the measures of polarization for all simulation runs (baseline scenario, t=2000) for the three different levels of segregation further supports this interpretation. The results for the model of negative influence show that higher levels of segregation result in significantly lower values of the polarization index \((\eta^2 =0.871, p<.001)\) and opinion variance in the whole population \((\eta^2 =0.862, p<.001)\). For the model of persuasive arguments, results differ. The results suggest that higher segregation can foster polarization: whereas segregation shows no significantly positive effect on the polarization index, it produces significantly higher opinion variance \((\eta^2 =0.133, p <.001)\). Results for the model of persuasive arguments show a much weaker effect: the increase of the polarization index between low and high levels of segregation is on average only 0.004, compared to 0.478 for the other model. This confirms our earlier result that with our larger population and more realistic segregation patterns, the model of persuasive arguments generates considerably lower levels of polarization than in previous studies even when high spatial segregation is imposed.
Alignment of group membership and opinion
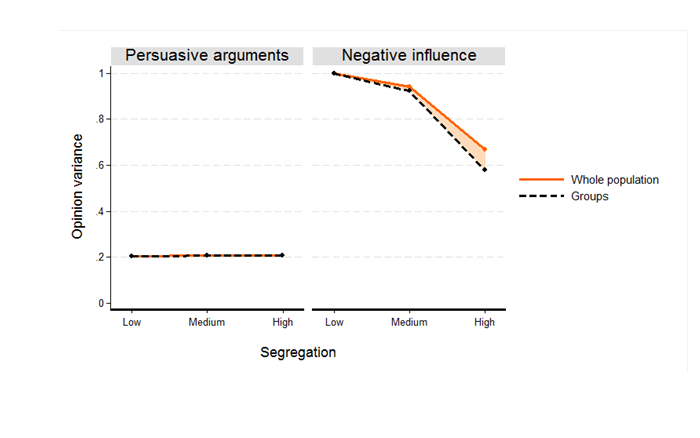
Next, we explored the difference between global and local alignment of group differences and opinion under both models. Figure 6 shows a clear difference in the degree of global alignment between the two models. In the baseline scenario only the negative influence mechanism generates global alignment, whereas there is virtually no global alignment under the model of persuasive arguments. Simulations also show that according to the negative influence model, stronger spatial segregation results in increasing global alignment – the difference between population opinion variance and the within-groups opinion variance becomes larger \((\eta^2 =0.237, p<.001)\). For the model of persuasive arguments there is no discernible relation to segregation.
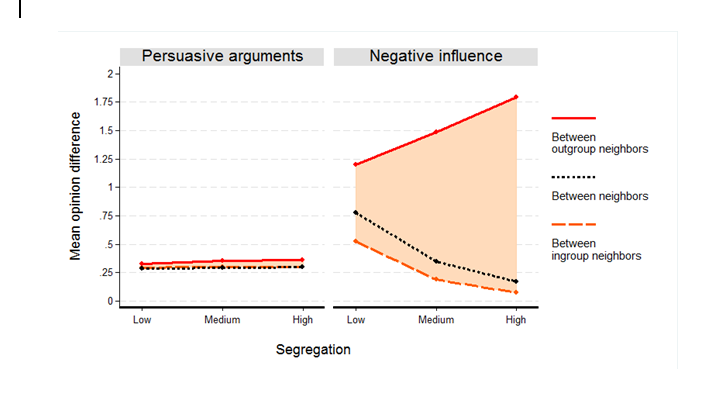
To distinguish local alignment from global alignment, we compared mean opinion differences between agents and their in- and outgroup neighbors. Figure 7 shows, for the baseline scenario, that the two models differ in terms of alignment at the local level, too. Negative influence generates more local alignment than the model of persuasive arguments. Moreover, the model implies increasing alignment for increasing levels of segregation at the local level, too. At the same time, the results highlight an important difference: while increasing segregation reduces the global variance of opinions both in the population as a whole and within the two groups, we find that at the local level higher segregation elicits a larger difference of opinions between groups and a smaller difference within groups. In other words, according to the negative influence model, higher segregation increases polarization between groups at the local level, but reduces polarization at the global level. For the model of persuasive arguments, levels of local alignment are again low and are hardly related to segregation. The difference between the models is further confirmed by an analysis of variance of the measure of local alignment \((\eta^2 =0.767,p<.001)\).
Robustness
We carried out a number of robustness tests to assess effects of the other model parameters on the relation between segregation and polarization. The parameters we considered are: the neighborhood size, the presence of interaction noise, the homophily parameter H, and the length of agents’ memory, S. Here we report the main findings – a detailed discussion of the tests can be found in Appendix III.
The relationship between spatial segregation and opinion polarization shows to be robust against the assumption of different neighborhood sizes and a lower value of H and S. This relationship remains negative according to the negative influence model, and mildly positive under the model of persuasive arguments. However, only the model of persuasive arguments is robust against the introduction of interaction noise, whereas the negative influence model is not.
For the negative influence model, the assumption that 1% of interactions occur between random dyads of agents is enough to exhibit strong polarization (both between and within groups and both globally and locally) regardless of the level of segregation, such that the negative relationship between segregation and polarization is canceled out. This can be explained firstly by the fact that random interactions bypass the interaction structure as imposed by the segregation pattern. Secondly, our assumption of interactions as dyadic is crucial. Previous modelling work has shown how multilateral local interactions can have a stabilizing effect when interaction noise exposes agents to occasional influence from outside ‘deviants’ (Flache & Macy 2011a). It follows that, assuming dyadic interactions, we make it more likely that an agent’s random exposure to the negative influence of an outgroup member triggers a polarizing cascade.
Conclusions
We developed a formal and computational model aligning two ABMs of opinion formation: a model of simultaneous positive and negative influence, and a model of persuasive argument exchange. Our study shows that these two models make conflicting predictions about the relationship between spatial group segregation and the emergence of opinion polarization in a population. Future work can build on these insights and test the conflicting model implications against empirical data on, for example, residential ethnic segregation and the spatial distribution of extreme opinions about issues that are salient to interethnic relations in a diverse society.
The key hypotheses we deduced from the model of negative influence are that stronger group segregation generates less opinion polarization in the whole population. However, this goes hand in hand with a stronger alignment of opinions and demographic group membership, both globally and locally. With more spatial segregation, the opinions of demographic groups differ more. These predictions are vulnerable to interaction noise: only 1% random interaction sufficed to generate strong polarization and global alignment regardless of the level of segregation. While this points to the possibility that the effects we found for negative influence may be of limited generalizability, it should be kept in mind that with the assumption of dyadic interaction we chose for a model specification that is highly sensitive to noise. Model specifications conventionally used in the literature (e.g. Flache & Macy 2011b) typically use multi-lateral influence. Future work should test whether – as previous studies suggest – a combination of the assumptions of multilateral interaction with the negative influence model entails more robust effects of spatial segregation.
For the model of persuasive arguments we found a very weakly positive effect of spatial segregation on the emergence of opinion polarization and the alignment of opinion differences with group differences. This weak relationship turned out to be stable and statistically significant against all of the parameter combinations we used in our robustness tests. Whereas previous work showed that the persuasive arguments mechanism generates high levels of polarization, our results do not reflect this. A possible explanation is that we used a much larger population than previous studies, which makes the coordination needed to generate a sequence of argument exchanges that produces large intergroup differences and high levels of polarization less likely. A more detailed analysis of this explanation is provided in Appendix II.
Our analyses not only tested intuitions suggested by previous work on how spatial group segregation relates to opinion polarization, but we also discovered an intriguing new effect of spatial segregation. While previous modelling work using small populations only focused on the degree of polarization and its alignment with intergroup differences in the population as a whole, we employed a population large enough to reveal that effects of segregation on polarization may be different at the global and the local level. We distinguished between global and local alignment, where global alignment refers to the association between group membership and opinion in the population as a whole, whereas local alignment refers to the same relationship inside individual neighborhoods. Both at the global and local level, negative influence is shown to generate alignment. We also demonstrated that under negative influence, more segregation actually reduces polarization in the whole population and within each demographic group at the global level. At the same time, higher segregation increases alignment of opinions with demographic group membership at the global and local level. In contrast, for the model of persuasive arguments we found support for a mildly positive effect of segregation on the emergence of alignment only at the local scale.
We started our paper with the questions how and through which processes ethnic residential segregation may relate to potential intergroup polarization in diverse societies. Our abstract models do of course not capture all complexities involved in interethnic relations, but we focused on a scenario representing the situation of a society in which opinions divide around one salient issue related to intergroup differences (e.g. immigration policy) and one salient intergroup distinction (e.g. immigrant vs. native). For this scenario, our study highlighted different potential societal conflicts that could result from people adjusting their opinions according to the two processes we studied. When individuals form their opinion by exchanging arguments, ethnic segregation may result in more individuals adopting either markedly moderate or markedly extreme positions on the issue at stake. By contrast, the negative influence process points to other potential threats of segregation for intergroup relations.
The spatial segregation of two ethnic groups, according to this model, has two effects: first, it decreases polarization on the issue at stake, and second, it makes group differences more pronounced: individuals belonging to the same ethnic group are expected to develop a common attitude on the issue, opposite to the attitude held by the other group. In sum, the negative influence model points at a trade-off between striving for more moderate opinion differences between two ethnic groups (by enforcing their residential integration), or striving for less opinion polarization in the population as a whole (by allowing ethnic residential segregation).For policy makers, this might represent a dilemma.
This study represents a theoretical step toward the systematization and comparison of the predictions that two prominent opinion formation models make for the effects of spatial segregation on opinion polarization in a society. We believe that the potential threats of segregation for intergroup relations identified by our study warrant both more theoretical analysis and careful empirical research testing implications of these two processes on data about interethnic spatial segregation and opinion divisions between ethnic groups in diverse societies.
Appendix
Appendix I: The segregation procedure
In line with previous research (Stoica & Flache 2014 ), we modeled the environment with an exogenously imposed level of segregation by running a Schelling-like model of residential segregation in NetLogo. The model takes as input several parameters: first, a radius r, conditioning the size of agents’ neighborhood. In effect, an agent’s neighborhood of size n is defined as the set of agents lying within a radius r. Second, a satisfaction threshold T, consisting in the maximum tolerated share of outgroup members in an agent’s neighborhood. We ran the segregation model imposing a mild satisfaction threshold T = 0.5. This model of residential segregation differs from the original model (Schelling 1971) in the fact that agents decide whether to move to a different location based on a utility function (Zhang 2004):
| $$ U(x) =\begin{cases} \frac{x}{pn}, & x\leq pn\\ m+\frac{(n-x)(1-m)}{n(1-p)}, & x>pn \end{cases} $$ | (8) |
In equation 8, m is a constant factor representing the desirability of a neighborhood of only ingroup members, and p represents the optimal fraction of ingroup members in the neighborhood of size n. It follows that agents enjoy the highest utility when the proportion of ingroup members equals p. Proportions greater than p may result in a lower utility, if m<p.
The segregation procedure starts with the torus’ cells being randomly assigned to one of the two groups, except for 15% of them which remain unassigned and serve as empty space for future moving of agents (called ‘buffer’). At each iteration, the software identifies a set of agents whose neighborhood composition is unsatisfactory (U<T). Each unsatisfied agent first scans the buffer in search for locations where the expected utility would be greater than T, thus satisfactory. If such a location exists, the agent moves to one of the satisfactory locations. If no satisfactory locations are available, the agent scans again the buffer in search for a location where the expected utility is greater than the utility she enjoys at her current location, even if the expected utility falls below the satisfaction threshold T. If a better location is found, the agent moves to the better location, otherwise does not move.
The segregation procedure terminates when at least one of the three following conditions is met: (1) the segregation procedure has gone through 50 iterations; (2) the segregation procedure has gone through 3 iterations without agents moving; (3) there are no unsatisfied agents left to move.
At the end of the procedure, buffer cells are assigned to group 1 with a probability equal to the proportion of neighboring cells already assigned to group 1 out of the whole neighborhood. With the complementary probability, cells are assigned to group -1.
This segregation model allowed us to model two main dimensions of the concept of segregation. Such dimensions are:
- Cluster homogeneity. Variations in the given value of parameter p result, at the end of the segregation procedure, in different levels of homogeneity within the group clusters. Higher values of p produce more homogeneous clusters. Our predetermined segregation levels are generated with three values of p, for \(p\epsilon{0.7, 0.8, 0.9}\) for low, medium and high segregation respectively (see Figure 1).
- Cluster size. Variations in the given value of r result in agents clustering in agglomerations of different sizes. Bigger radii r generate bigger clusters. In our settings we vary cluster sizes, for \(r\epsilon{1, 3, 5}\), for low, medium and high segregation respectively.
The three stylized settings we used can be shown to differ quantitatively in the group composition of agents’ neighborhoods. We show this through an intuitive and established measure of spatial segregation, the dissimilarity (or ‘concentration’) index D proposed by Massey and Denton (1988). For this, we divide the world into L equally large local units l. The size of such local units is meant to mirror the range at which local interactions take place: therefore, we define the size of the local units based on the neighborhood size. In our baseline scenario the neighborhood size is 8 (Moore neighborhoods), and local units l are sized 3x3.
| $$ D =\frac{1}{2}\sum_{l\epsilon L}|\frac{N_{la}}{N_{a}}-\frac{N_{lb}}{b}| $$ | (9) |
\(N_{la}\) and \(N_{lb}\) are the number of agents in local unit l for group a and b respectively; \(N_a\) and \(N_b\) are the total sizes of both groups across all local units. The theoretical range of D is {0,1}. The more dissimilar local neighborhood compositions are on average to the population composition, the higher is D. The dissimilarity index D takes on average values of 0.29 (std = 0.11) for low-segregated settings; 0.68 (std = 0.11) for medium segregation, and 0.83 (std = 0.07) for high segregation.
Appendix II: Comparison with the original persuasive argument model
In this appendix we list the differences between our implementation of the model of persuasive argument sand the original model, discuss their compatibility, and further elaborate and test a tentative explanation of why, in our baseline scenario, the persuasive argument exchange generates less opinion polarization than expected.
The implementation of the persuasive argument exchange outlined in this paper is a simplified version of the model as first formalized (hereafter, 'original model')(Mäs & Flache 2013; Mäs et al. 2013).The reason why we implemented the process differently is of a very practical nature. While crafting a common formal framework for the models of negative influence and persuasive argument exchange, we were constrained by the need for a computationally efficient design and for a clear and simple formalization. Thus, we pursued parsimony in the number of the model’s parameters and simplicity in its definition. The differences between our implementation and the original model follow from the trade-off between computational efficiency (and simplicity) and fidelity to the original model.
The first difference concerns the implementation of the homophily principle, the individuals’ tendency to interact more, or more often, with similar alters. In the original model, homophily is implemented through homophilous selection: the probability of interaction between two agents is function of their relative similarity in their opinion or demographic attributes. The more similar a neighbor is to the focal agent compared to other neighbors, the more likely it is that they engage in an interaction and exchange arguments. In our current model, interactions take place with a uniform probability between neighboring agents. The homophily principle is captured by the weight w, instead. This weight is a measure of the similarity between dyads of agents and rules the effectiveness (or salience) of the interaction on an agent’s shift in opinion (equation 6).The more similar two agents are, the stronger the effect of the exchanged argument on their opinion. Thus, unlike in the original model, in our implementation new arguments do not always have the same effect on agents' opinion.
A second difference can be found in the definition of agents’ memory S. In the original model, the authors modeled the agents’ memory S as a vector (ordered list). Here, we modeled S as a set (unordered list). The two solutions differ in the way an agent drops an argument during an interaction. According to the original model, the agent drops the oldest argument of the list; in our model, an agent drops a randomly chosen argument from the set.
Additionally, in the original model arguments are countable items from a set of pro (or con) arguments: this means that, after repeated interactions, some of those arguments can be wiped out of every agent's memory vector, and thereafter have no chance of being exchanged again. In our model arguments are simply fractions of an agent’s opinion, and have a probability of being positive or negative depending on the sign of the opinion. This difference has two implications. The first implication is that our implementation does not produce the depletion of arguments being exchanged that is produced by the original model.
The second implication is that the system could require a reduced number of interactions for it to converge. This is the case for a situation where all agents hold the same extreme opinion (-1 or +1): in our implementation, this can only happen when the system has converged and no more interactions are possible. However, in the original model (with arguments modelled explicitly), this could happen when all agents have the same arguments vector, or if agents have different argument vectors, but the same proportion of pro arguments in that vector. In this latter case, the system has not yet converged because agents can still receive new arguments while interacting. Because opinion consensus on an extreme opinion is a convergence state in our implementation but not necessarily in the original model, it is possible that the outcome of convergence on extreme consensus is more likely for our implementation of the persuasive arguments model, than for the original model.
The last, and arguably most important difference is the population size. The original model assumes a complete network of 20 nodes, whereas in our simulations the interaction network has \(80^2 =6400\) nodes – as result of the need to model different, non-overlapping neighborhoods, with distinct spatial segregation patterns.
To assess whether our implementation behaves consistently with the original model, we aligned it with the conditions simulated in previous studies and replicated their key simulation experiments (hereafter, ‘replication study’). This is not an analytical test of model equivalence, nor a proof that the two versions generate similar outcomes when assuming large populations. However, it shows that the two model versions generate very similar model behavior under comparable conditions – in this case, the conditions assumed in the original model.
To imitate the population size and interaction structure of the original model (Mäs et al. 2013) in the replication study (a complete network of 20 nodes), we assumed a two-dimensional world sized 4x5, and a neighborhood size equal to 19. Because every agent’s neighborhood comprises the entire population, and because neighbors are chosen with a uniform probability for interaction, the initial level of spatial group segregation has no effects on the interaction structure. Similarly, interaction noise can’t play any role in altering the interaction structure, so we ruled it out. Furthermore, the original model assumed three demographic attributes and one opinion dimension: to approximate this proportion, we assumed H = 0.33. We varied S for S = {2, 4, 7}, respecting the variation range of the memory length in the original model. We ran 3000 simulations, and each run only terminates once the system has reached equilibrium (perfect polarization or perfect consensus).
Compatibly with the original model, all of the simulation runs developed perfect consensus on extreme opinions (with every agent sharing an opinion 1 or -1). For S = 4, convergence needed on average 129527 iterations (std = 125897) each of which comprises 20 interaction events. Moreover, similarly to what the original model generated, we found that S, under this specific set of conditions, has no qualitative effect on the conditions that affect the degree of polarization. Our model succeeded at replicating the original model’s dynamics – in particular, under the same conditions, it generated perfect extreme opinion consensus in every simulation run.
The fact that perfect consensus on extreme opinions was always reached in the replication study clashes with the fact that it was never reached in the baseline scenario studied in this paper. The reason why our model did not generate perfect polarization or perfect consensus in the baseline scenario lies in the different conditions between the baseline scenario and the conditions imposed for the replication study. Two conditions discriminate between the two cases: the number of iterations allowed in the model, and the population size.
Number of iterations and population size
Whereas under conditions of the replication study our model takes on average 129527 iterations for convergence to equilibrium, the baseline scenario is run only up to 2000 iterations. Whereas we cannot exclude that our model may converge to an equilibrium state (perfect polarization or perfect consensus) after a much larger number of iterations, these results suggest that the time needed for such convergence would be prohibitively long and also far too long for reflecting empirically plausible time scales. To recall, we assumed in the baseline scenario a population size of N = 6400 agents, 320 times as large the N = 20 used in the replication study. In all likelihood, time to convergence increases far more than linearly in the number of agents in a population. Hence, the average time to convergence can be expected to be far more than about 41 million iterations (320 times 129527, the average number of iterations for convergence under N = 20).While the results for the baseline scenario may not necessarily reflect equilibrium behavior, we find that they reflect a metastable state of the model that can be expected to endure for a large period of time before eventually an equilibrium may arise. We observe that the polarization tendency stabilizes during the first few hundreds iterations, and exhibits no discernible trend thereafter.
We acknowledge that the effects of the network size and structure on the model of persuasive arguments remain largely unexplored, and deserve further research.
Appendix III: Robustness tests
Here we discuss in detail the effects of model’s parameters on the relation between segregation and polarization.
Neighborhood size
To assess effects of neighborhood size, we ran half of the simulations imposing a Moore neighborhood (neighborhood size = 8), and the other half imposing a bigger neighborhood (sized 36). Previous work suggests different effects of this parameter for the two processes of opinion formation. Under negative influence, bigger neighborhoods signify bigger chances for an agent to end up interacting with a dissimilar interaction partner, which increases chances of polarization. Despite of this, simulation results for the negative influence model show no significant effect of the neighborhood size on the polarization index and opinion variance. However, there is a significant effect on the measures of alignment: the relationship between neighborhood size and global alignment is positive \((\eta^2 =0.055, p<.001)\), and negative in the case of local alignment \((\eta^2 =0.206,p<.001)\).
For the model of persuasive arguments we expected that bigger neighborhoods reduce polarization. Increased chances to meet interaction partners with different opinion should result in agents receiving more moderating arguments. This is confirmed by our simulations: ceteris paribus, for the model of persuasive arguments bigger neighborhoods result in reduced polarization \((\eta^2 =0.444, p<.001)\) and lower opinion variance \((\eta^2 =0.931, p<.001)\). Moreover, higher neighborhood size reduces local alignment of group membership and opinion \((\eta^2 =0.085, p<.001)\).
Most importantly, the relationship between initial level of segregation and opinion polarization that we identified for the baseline scenario is robust against increasing neighborhood size. For the negative influence model, the assumption of a bigger neighborhood does not alter the negative relationship of segregation on the polarization index \((\eta^2 =0.495, p<.001)\) and opinion variance \((\eta^2 =0.452, p<.001)\). Similarly, for the model of persuasive arguments, segregation still has a non-significantly positive effect on the polarization index and a positive effect on the opinion variance \((\eta^2 =0.447, p<.001)\).
Interaction noise
We introduced interaction noise by assuming that at each point in time a fraction of 1% (N=64) or 5% (N=320) of the agents is selected to interact with a random agent. Dyads were randomly selected from the set of nonneighboring dyads with a uniform probability.
The effects of interaction noise on the two processes are expected to be similar to the effects of increasing the neighborhood size. In the case of the negative influence mechanism, the presence of interactions with random partners makes it more likely to trigger the mutual repulsion which makes them move to a more extreme opinion. Conversely, in the case of persuasive argument exchange, random interactions increase the chances that agents receive moderating arguments, thus reducing polarization in the population. Coherently, simulations (for H = 3, S = 7, and neighborhood size = 8) show that the introduction of random interactions results, at t=2000, in higher scores of the polarization index for the model of negative influence \((\eta^2 =0.197, p<.001)\), and smaller scores for the model of persuasive arguments \((\eta^2 =0.100, p<.001)\).
The mildly positive relationship between segregation and opinion variance generated by the model of persuasive arguments is robust against the introduction of interaction noise (1% noise: \(\eta^2 =0.318, p<.001\); 5% noise: \(\eta^2 =0.558, p<.001)\). One of the features of the implementation of this model (discussed in Appendix II) could, at least partly, explain its robustness to interaction noise. Specifically, in this implementation, we mimic the argument exchange dynamics as if new arguments took the place of one randomly chosen argument from the set. However, in the original model, when the agent receives a new argument she drops the oldest argument of the memory vector, and not a randomly chosen one. This means that, in our implementation, at any point in time a new argument has equal chances to be forgotten as any other argument. In the original model, a new argument has less chances to be forgotten soon. As a result, arguments that are adopted during an interaction with a random alter are more likely to be forgotten soon (and thus to have a smaller effect) in our implementation of the model, than in the original model.
The negative influence model, however, appears to be less robust to interaction noise. Regardless of the level of segregation, random interactions under the assumptions of negative influence produce very high scores on the polarization index, such that the negative relationship between segregation and polarization is canceled out. Our explanation is that under our implementation of negative influence, a small number of interaction events that trigger negative influence can suffice to set off a self-reinforcing cascade of increasing polarization. Spatial segregation confines this process to boundaries between spatial clusters and shelters agents in the interior of clusters from interactions with outgroup members that are likely to trigger negative influence. Random interaction breaks the effect of spatial boundaries and thus triggers the emergence of polarization also in less segregated scenarios. Furthermore, simulation results show that interaction noise also has a positive effect on the emergence of global alignment \((\eta^2 =0.064, p<.001)\). In sum, agents’ exposure to random interactions increases the likelihood that the two groups develop internal consensus on two opposite extreme opinions, as indicated by the emerging strong polarization and strong global alignment. We expect that there is a critical lower boundary for the degree of interaction noise below the levels that we inspected, such that below this boundary spatial segregation can still temper the emergence of polarization and alignment also under the negative influence model.
We also think that our implementation of negative influence may be more sensitive to these effects of interaction noise than the models used in previous work (Flache & Macy 2011b). An important difference is that our model assumes a dyadic interaction mechanism, in which an agent’s opinion is influenced by one interaction partner at a time. We adopted this assumption for consistency with the framework used in the literature on the model of persuasive arguments (Mäs et al. 2013). However, previous models of negative influence typically assume that opinion shifts result from the weighted average of the simultaneous influences of all neighbors. This makes it more likely that in our implementation a single interaction event with an outgroup member can elicit extreme opinion shifts. The reason is that in this situation agents’ opinions are not tempered by the simultaneous influence of their ingroup neighbors in the interior of a cluster, which in a segregated setting are on average more frequent and are more likely to hold moderate opinions. Previous work based on Axelrod’s model of cultural dissemination demonstrated a similar stabilizing effect of multilateral as opposed to bilateral interactions against the influence of interaction noise (Flache & Macy 2011a).
Homophily parameter H
In the original model of negative influence with group differences (Flache & Mäs 2008b), the authors assumed that all attributes (opinion dimensions and demographic attributes) have the same weight, but the number of opinion dimensions is bigger than the number of demographic attributes. As a result, opinion differences matter more than group differences. To reflect this, for the baseline scenario we imposed H = 3, assuming that agents’ opinion differences matter more than their group differences in defining the weight w of an interaction (equation 1). In this way we allowed positive weights between out-group agents, as well as negative weights between ingroup agents. In case there is only one relevant opinion dimension, and one relevant demographic attribute, the original model works the same as our implementation with H =1. For this reason, we test the implications of assuming H = 3 instead of H = 1. Because for H =1 agent’s group membership plays a bigger role, we expect that under both models, H = 1 implies stronger ingroup agreement and outgroup disagreement (that is, stronger alignment).
In line with our expectations we find that, in a ceteris-paribus replication of the baseline scenario, at t = 2000, H has a significant negative effect on measures of alignment both for negative influence (local alignment: \(\eta^2 =0.287\), p<.001; global: \(\eta^2 =0.023\), p<.001) and the model of persuasive arguments(local alignment: \(\eta^2 =0.019\), p =.001). Most importantly, we observe no significant effect of this parameter on the relationship between segregation and polarization under both models: for H =1, under the negative influence model segregation has a negative effect on the polarization index (\(\eta^2 =0.866\), p<.001) and opinion variance (\(\eta^2 =0.867\), p<.001); under the model of persuasive arguments, we observe a mildly positive relationship between segregation and polarization index (\(\eta^2 =0.033\), p<.01) and opinion variance (\(\eta^2 =0.310\), p<.001).
Agent’s memory S
Lastly, we consider the length of agents’ memory S used for the model of persuasive arguments. In our simulations we modeled two kinds of memory, a shorter (S =3) and a longer one (S =7). A shorter memory implies that a new argument has a bigger impact on opinion change. This suggests that shorter memories foster polarization, as also shown by Mäs and his co-authors (2013, Online Appendix). In line with their findings, our simulations reveal that at time 2000, simulations conducted with the higher value of S generate lower polarization (\(\eta^2 =736\), p<.001) as well as lower opinion variance (\(\eta^2 =989\), p<.001). However, these effects of S do not change the qualitative relationship between segregation and polarization that we identified for the baseline scenario under the model of persuasive arguments: in fact, assuming S =3, the relationship between segregation and polarization remains mildly positive (polarization index: \(\eta^2 =0.044\), p =.001; opinion variance: \(\eta^2 =0.314\), p<.001).
Notes
- The model code can be found at https://www.openabm.org/model/4979/version/1/view.
- This population size is much larger than in previous formal modelling work, allowing for variation in spatial segregation patterns. The difference in population size has important consequences for model behavior of persuasive argument exchange, as discussed in Appendix II.
References
ABELSON, R. P. (1964). Mathematical models of the distribution of attitudes under controversy. In N. Frederiksen & H. Gulliksen (Eds.), Contributions to mathematical psychology (pp. 142–160). New York: Holt, Rinehart & Winston.
ALIZADEH, M., Coman, A., Lewis, M., & Cioffi-Revilla, C. (2014). Intergroup Conflict Escalation Leads to More Extremism. Journal of Artificial Societies and Social Simulation, 17(4), 4: https://www.jasss.org/17/4/4.html.
AXELROD, R. (1997). The dissemination of culture a model with local convergence and global polarization. Journal of Conflict Resolution, 41(2), 203–226. [doi:10.1177/0022002797041002001]
AXTELL, R., Axelrod, R., Epstein, J. M., & Cohen, M. D. (1996). Aligning Simulation Models: A Case Study and Results. Computational and Mathematical Organization Theory, 1(2), 123–141.
BACKSTROM, L., Sun, E., & Marlow, C. (2010). Find me if you can: improving geographical prediction with social and spatial proximity. Proceedings of the 19th International Conference on World Wide Web, 61–70. [doi:10.1145/1772690.1772698]
BALDASSARRI, D., & Bearman, P. (2007). Dynamics of political polarization. American Sociological Review, 72, 784–811.
BALLAND, P.-A. (2012). Proximity and the Evolution of Collaboration Networks: Evidence from Research and Development Projects within the Global Navigation Satellite System (GNSS) Industry. Regional Studies, 46(6), 741–756. [doi:10.1080/00343404.2010.529121]
BURNSTEIN, E., Stotland, E., & Zander, A. (1961). Similarity to a model and self-evaluation. The Journal of Abnormal and Social Psychology, 62(2), 257–264.
BYRNE, D. (1997). An overview (and underview) of research and theory within the attraction paradigm. Journal of Social and Personal Relationships, 14(3), 417–431. [doi:10.1177/0265407597143008]
DANDEKAR, P., Goel, A., & Lee, D. T. (2013). Biased assimilation, homophily, and the dynamics of polarization. Proceedings of the National Academy of Sciences of the United States of America, 110(15), 5791–6.
DEFFUANT, G., & Amblard, F. (2002). How can extremism prevail? A study based on the relative agreement interaction model. Journal of Artificial Societies and Social Simulation, 5(4), 1: https://www.jasss.org/5/4/1.html.
DIMAGGIO, P., Evans, J., & Bryson, B. (1996). Have American’s Social Attitudes Become More Polarized? American Journal of Sociology, 102(3), 690.
EDWARDS, L. (2016). Homogeneity and Inequality: School Discipline Inequality and the Role of Racial Composition. Social Forces, 95(1), 55–76.
EPSTEIN, J. (2006). Generative social science: Studies in agent-based computational modeling. Princeton University Press.
ESTEBAN, J.-M., & Ray, D. (1994). On the measurement of polarization. Econometrica: Journal of the Econometric Society, 62(4), 819–851. [doi:10.2307/2951734]
FESTINGER, L. (1957). A theory of cognitive dissonance. Scientific American (Vol. 207).
FLACHE, A., & Macy, M. W. (2011a). Local Convergence and Global Diversity: From Interpersonal to Social Influence. Journal of Conflict Resolution, 55(6), 970–995. [doi:10.1177/0022002711414371]
FLACHE, A., & Macy, M. W. (2011b). Small Worlds and Cultural Polarization. The Journal of Mathematical Sociology, 35(1–3), 146–176.
FLACHE, A., & Mäs, M. (2008a). Why do faultlines matter? A computational model of how strong demographic faultlines undermine team cohesion. Simulation Modelling Practice and Theory, 16(2), 175–191. [doi:10.1016/j.simpat.2007.11.020]
FLACHE, A., & MäS, M. (2008b). How to get the timing right. A computational model of the effects of the timing of contacts on team cohesion in demographically diverse teams. Computational and Mathematical Organization Theory, 14(1), 23–51.
FRENCH, J. R. (1956). A formal theory of social power. Psychological Review, 63(3), 181–194. [doi:10.1037/h0046123]
GRANDI, U., Lorini, E., & Perrussel, L. (2015). Propositional opinion diffusion. In I. F. for A. A. and M. Systems (Ed.), Proceedings of the 2015 International Conference on Autonomous Agents and Multiagent Systems (pp. 989–997).
HALES, D., Juliette, R., & Edmonds, B. (2003). Model-to-model analysis. Journal of Artificial Societies and Social Simulation, 6(4), 5: https://www.jasss.org/6/4/5.html.
HARARY, F. (1959). A criterion for unanimity in French’s theory of social power. In D. Cartwright (Ed.), Studies in social power (pp. 168–182). Ann Arbor: Institute for Social Research.
HEGSELMANN, R., & Krause, U. (2002). Opinion Dynamics and Bounded Confidence: Models, Analysis and Simulation. Journal of Artificial Societies and Social Simulation, 5(3), 2: https://www.jasss.org/5/3/2.html.
HEIDER, F. (1946). Attitudes and cognitive organization. The Journal of Psychology, 21, 107–112. [doi:10.1080/00223980.1946.9917275]
HIPP, J. R., & Perrin, A. J. (2009). The simultaneous effect of social distance and physical distance on the formation of neighborhood ties. City and Community, 8(1), 5–25.
HUET, S., Deffuant, G., & Jager, W. (2008). A Rejection Mechanism in 2D Bounded Confidence Provides More Conformity. Advances in Complex Systems, 11, 529. [doi:10.1142/S0219525908001799]
LIU, C. C., & Srivastava, S. B. (2015). Pulling Closer and Moving Apart: Interaction, Identity, and Influence in the U.S. Senate, 1973 to 2009. American Sociological Review, 80(1), 192–217.
MACY, M. W., Kitts, J. A., Flache, A., & Benard, S. (2003). Polarization in Dynamic Networks: A Hopfield Model of Emergent Structure. Dynamic Social Network Modeling and Analysis, 162–173.
MÄS, M., & Flache, A. (2013). Differentiation without distancing. explaining bi-polarization of opinions without negative influence. PloS ONE, 8(11), e74516.
MÄS, M., Flache, A., & Helbing, D. (2010). Individualization as driving force of clustering phenomena in humans. PLoS Computational Biology, 6(10), e1000959. [doi:10.1371/journal.pcbi.1000959]
MÄS, M., Flache, A., Takács, K., & Jehn, K. (2013). In the short term we divide, in the long term we unite: Demographic crisscrossing and the effects of faultlines on subgroup polarization. Organization Science, 24(3), 716–736.
MASSEY, D. S., & Denton, N. A. (1988). The Dimensions of Residential Segregation. Social Forces, 67(2), 281–315. [doi:10.2307/2579183]
MCPHERSON, M., Smith-lovin, L., & Cook, J. M. (2001). Birds of a feather: Homophily in Social Networks. Annual Review of Sociology, 27, 415–444.
MYERS, D. G. (1982). Polarizing Effects of Social Interaction. In H. Brandstätter, J. H. Davis, & G. Stocker-Kreichgauer (Eds.), Group Decision Making (pp. 125–161). London: Academic Press.
PETTIGREW, T. F., & Tropp, L. R. (2006). A meta-analytic test of intergroup contact theory. Journal of Personality and Social Psychology, 90(5), 751–783.
PHILLIPS, D. (2007). Ethnic and Racial Segregation: A Critical Perspective. Geography Compass, 1, 1138–1159.
SCHELLING, T. C. (1971). Dynamic models of segregation. Journal of Mathematical Sociology, 1, 143–186. [doi:10.1080/0022250X.1971.9989794]
SEMYONOV, M., & Glikman, a. (2008). Ethnic Residential Segregation, Social Contacts, and Anti-Minority Attitudes in European Societies. European Sociological Review, 25(6), 693–708.
STOICA, V. I., & Flache, A. (2014). From Schelling to Schools: A Comparison of a Model of Residential Segregation with a Model of School Segregation. Journal of Artificial Societies and Social Simulation, 17(1), 5: https://www.jasss.org/17/1/5.html. [doi:10.18564/jasss.2342]
VALDEZ, S. (2014). Visibility and votes: A spatial analysis of anti-immigrant voting in Sweden. Migration Studies, 2(2), 162–188.
VAN DER WAAL, J., de Koster, W., & Achterberg, P. (2013). Ethnic Segregation and Radical Right-Wing Voting in Dutch Cities. Urban Affairs Review, 49(5), 748–777.
VINOKUR, A., & Burnstein, E. (1978). Depolarization of attitudes in groups. Journal of Personality and Social Psychology. Linnaeus University. [doi:10.1037/0022-3514.36.8.872]
WILENSKY, U. (1999). NetLogo. http://ccl.northwestern.edu/netlogo/. Center for Connected Learning and ComputerBased Modeling Northwestern University Evanston IL, 2009 (26.02.2009), Evanston, IL.
ZHANG, J. (2004). Residential segregation in an all-integrationist world. Journal of Economic Behavior and Organization, 54(4), 533–550. [doi:10.1016/j.jebo.2003.03.005]