
Introduction
Marketing and business strategy scholars frequently note that individuals have developed a strong tendency to search for and diffuse product information using online social networks. This tendency, also known as social commerce, characterises various types of online social networks, such as Facebook, Twitter, and WeChat. Studies have suggested that marketing through online social networks is crucial for online businesses, given that consumers are more likely to trust product information from their friends than firm advertisements (Ahrens et al. 2013). Online social networks are useful in establishing connections between offline strangers, and online weak ties can yield a large amount of heterogeneous information (Kaplan & Haenlein 2010; Albuquerque et al. 2012; Fader & Winer 2012). The information individuals receive and attitudes they form as a result are significantly influenced by individuals within their social network (Iyengar et al. 2011; Lopez & Sicilia 2013; Lee 2014).
The advances in information technology have profoundly changed the way information transmitted, and have transcended the traditional limitations of word-of-mouth (Duan et al. 2008). Consumers can now easily and freely access information and exchange opinions on companies, products, and services on an unprecedented scale in real time. Advance selling is a marketing practice in which the seller offers buyers the opportunity to make purchase commitments prior to consumption (Xie & Shugan 2001; Zhao & Stecke 2010). Many companies, among which are Apple, Microsoft, and Samsung, have adopted advance selling strategies to market their new products (e.g., Apple Watch, Surface Pro 3, and Samsung Galaxy Note 4). Using advance selling strategies, firms aim to identify who these influential consumers and incentivize them to spread product information in social networks. Product information diffused across social networks help consumers decide whether they should buy the product and do so online. This makes it easier to collect the data on market demand and the feedback on product improvement for firms before production.
This study attempts to interpret advance selling strategy in the context of product diffusion on a social network. In reality, diffusion performance varies by product type and thus, we focus on two types of product: non-durable and durable products. Durable products are a category of consumer products that do not need to be purchased frequently because they are made to last for a long time. Products that are consumed within a short time are classified as non-durable, such as clothing, shoes, and small electronic devices. In particular, we examine the extent to which factors affect product adoption, suitable product types for advance selling, and suitable advance selling strategies for various products types. To do so, we draw on previous research by first extending the susceptible–infected–removed (SIR) model and adding a buyer (SIRB) component to it. We then develop an advance selling model, which posits that the distribution of consumers’ purchasing times varies by product. Thereafter, we combine product diffusion with an advance selling strategy to identify factors influencing sellers’ profits.
The objectives of this study are as follows. First, we describe issues in online product purchases and develop an advance selling model, using a profit function to analyse the diffusion effect, rather than the infected or adopted quantity. Second, we develop a model to describe product diffusion in online social network and conduct an in-depth analysis of transmission probability \((\beta)\) and purchase probability \((\lambda)\). In this study, the SIRB model considers consumers’ product adoption and analyses their online behavior based on four states: product information susceptibility, information owners, information removers, and product buyers. Finally, we examine sellers’ advance selling decisions by discussing the influence of four parameters on profits: product quality, cost reduction, promotional effort and lead time.
Theoretical Background
A fundamental assumption in network marketing is the presence of social influence or contagion among customers. In the battle to retain existing customers, as well as maximize new customer acquisition, marketers find themselves challenged with how best to apply new technologies for customer acquisition and retention. Consumers are no longer passive receivers of information from marketers, whether it is advertising or products featured on e-commerce sites; instead, their purchasing decisions are influenced by interactions with each other (Fader & Winer 2012), which include product reviews, product usage descriptions, "homemade advertising" blogs, and other consumer-initiated contributions on online social networks (Kaplan & Haenlein 2010; Smith et al. 2012; Zhang et al. 2013). Online information seekers claim that product and service information provided by other consumers through social networking sites is more valuable than that by marketers (Abrantes et al. 2013; Gentina & Bonsu 2013). Thus, consumer recommendations are considered more trustworthy than those of sellers (Huang & Chen 2006).
Advance selling strategies help firms increase their market share and decrease production cost. For instance, Moe and Fader (2002) analysed the effects of an advance period on new product diffusion and found that the order data gathered from the advance period will contribute to demand forecast. Weng and Parlar (1999) integrated discounts with an advance selling strategy, assuming that demand depends on the discount rate during the advance period, and studied sellers’ decision regarding optimal order quantity. Advance selling strategies not only help retailers in acquiring sales money in advance, reducing inventory risk, and updating demand information, but also benefit consumers through high value-added performance, price discounts, and free gifts (Zhao & Stecke 2010). In addition to product quality, advance selling strategies are influenced by lead time, promotional effort, and cost reduction. Lead time is the period between placing a product order and delivery and has important implications for cost reduction. Promotional efforts include referrals to diffuse products and rewards from firms (Kivetz & Simonson 2002).
The expansion of Internet technology over the past decade has brought convenience for business with the timing strategy or the advance selling strategy. People are tending to be more susceptible to the influence of the friend from online social network, and the product adoption decision-making is relevant to the advice or opinion from online users. However, there are some differences between the timing strategy and the advance selling strategy. In the timing strategy, time-to-market and time-to-discount are important parameters that can be adjusted to improve sales or profits (Lee et al. 2014). In the advance selling strategy, product is published in the market before quantity production, so firms can obtain the more precise demand of products. However, not all consumers are willing to pay for the product in advance, because it is going to take a period of time to wait for the product manufacturing and distribution. Lead-time is an important factor in the advance selling strategy, which affects the decision-making of consumers’ purchases. The acceptable time a customer can wait is different for different types of products. In generally, consumers are willing to buy non-durable products in early stage, but they are not anxious to durable products (Lee et al 2013). In order to make purchase decision, consumers need to compare the lead-time with their acceptable waiting time. The distribution of acceptable waiting time among consumers is accord with the regular rules. According to Lee et al. (2013), the product adoption time shows a shifted Gompertz distribution.
The diffusion of advance selling products is similar to the spread of viruses on a computer network, infectious diseases in a crowd, or rumours in a society. In epidemic models, behaviours spread to other individuals in a manner similar to an infectious disease (Watts & Dodds 2007). Kermack and Mckendrick (1927) proposed the SIR model to study the Black Death in London and plague in Mumbai. In an SIR model, individuals undergo three states and changes in these states can be perceived as the epitome of an individual’s "goal and preference, and perception of situation" (Granovetter 1978). From the perspective of a complex network, infectious diseases spread among connected individuals; this is different from the assumption in regular networks in which each individual has the same probability of coming in contact with an infected individual. Physicists Pastor-Satorras and Vespignani (2001, 2002) have carried out pioneering work on the theory of infectious diseases in complex networks. Based on the susceptible-infected (SI) model, Huang & Li (2007) found that the infection rate in a scale-free network with a community structure is much lower than that in a general scale-free network. The research by Yin-Zuo et al. (2007) on the susceptible-infected-susceptible (SIS) and susceptible-infected-removed-susceptible (SIRS) models showed that the network density leans toward stability as the diffusion rate increases. Based on the different situations and diffusion processes, several types of epidemic models can be derived, such as the SI, SIS, SIR, SIRS.
As a special form of complex network, online social network is based on the relationship between online users. Online comments can influence product sales through either awareness effects or persuasive effects (Duan et al. 2008). Awareness effects indicate that feedback conveys the existence of the product so entering in the choice set of consumers. Persuasive effects, in contrast, are to shape consumers' attitudes and evaluation towards the product and ultimately influence their purchase decision. Park and Kim (2008) investigated the dual-characteristic of online reviews and found that online reviews not only provide information to consumers, but also stimulate product adoption. The adoption process shows that potential buyers have no knowledge about one product at the beginning, but can search for information or receive advice from others in the social network. As potential buyers get to know the product, they will share their opinion with others and make the decision on whether to buy or not the product. The prospect theory (Kahneman & Tversky 1979) shows that individuals are more influenced by relative value from reference point, rather than the absolute value. That is to say, the gap (gains or losses relative to the reference point) is key for decision-making. Reference point is the benchmark of customers’ evaluation to products. Reference point can be both the current and the prospect situation (Kahneman & Tversky 1979). The reference point in Lee et al (2014)’s research is the evaluation of the product in use. In general, consumers may not buy the product unless their expect utility higher than reference point.
Model
Product Diffusion Model (SIRB)
In the SIR model, individuals undergo three states—susceptible, infected, and removed—and two state transitions \( (S→I, I→R) \). In line with the recent literature (Huang 2015), this study extends this model to an individual’s personal network to represent individual opinions on online products, given than people are most easily influenced by others close to them. Consumers in the S state (susceptible to product information) may transition into the I state if one of their neighbour nodes is in the I state. Those in the I state are product information owners and may pass information through a social network to neighbour nodes. Consumers in the R state (product information remover) do not receive or transmit product information and therefore, do not buy products online or influence others. The information owner may not be the product buyer, so the components of the SIR model have limited applications for product diffusion analysis. Therefore, another state needs to be added to describe product buyers.
Drawing on the SIR model and the above discussion, retaining the three basic states, we added a fourth, the buy state, with three state transitions: \(S→I\), \(I→R\), and \(I→B\). It can be seen from the state transitions differential equation (1),consumers in the \(I\) state transition to the \(B\) state when they buy the product (first and fourth lines in equation 1), the product buyer can then share the product information through his/her social network to the neighbouring nodes (second line in equation 1). However, those in the B state cannot transition back to the \(S\) state.
| $$ \begin{cases} \frac{ds(t)}{dt}= & -\beta(i(t)+b(t))s(t),\\ \frac{di(t)}{dt}= & \beta s(t)(i(t)+b(t))-\gamma i(t)-\lambda i(t),\\ \frac{dr(t)}{dt}= & \gamma i(t),\\ \frac{db(t)}{dt}= & \lambda i(t). \end{cases} $$ | (1) |
In the initial period of new product launch, firms provide sample products to consumers (testers). Testers get to know product attributes by using the product and accordingly, decide whether they should diffuse related information in their online social network. In time \(t\), the proportions of the four states are denoted by \(s(t)\), \(i(t)\), \(r(t)\), and \(b(t)\). \(\beta\) is the probability of an individual within the social network receiving product information \((S→I)\), \(γ\) is that of an individual who owns the product information not accepting and diffusing the product \((I→R)\), and \(\lambda\) denotes the probability of an individual in the social network purchasing the product after receiving product information \((I→B)\). The SIRB model can simulate the evolution of production diffusion,especially involving product adoption and product information diffusion rather than the traditional model which can only simulate the information diffusion such as SIR or BASS. If \(\lambda≠0\), \(\lambda\) indicates the probability of consumer in \(I\) state transform to \(B\) state. Therefore, SIRB model degrade to SIR model when set \(\lambda=0\) to all the consumers. The degradation model can only simulate information diffusion.
Individuals are more easily affected by the relative value compared to reference point, rather than the absolute value (Kahneman & Tversky 1979). They may not buy the product unless their expect utility higher than reference point. Therefore, reference point is the key element of the transformation from I state to product buyer (\(B\) state).
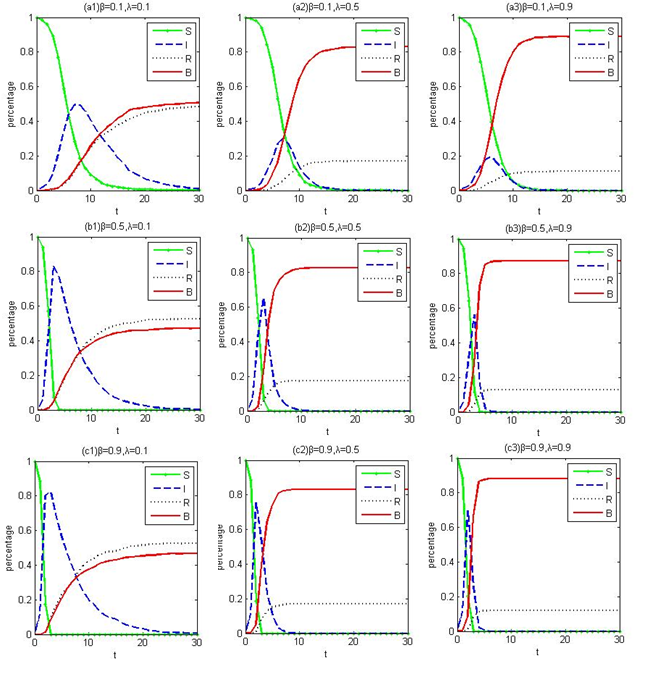
Transmission probability \(\beta\) and purchase probability \(\lambda\) are the important variables in product diffusion. In order to observe the four states change in network, we set \(\beta\) and \(\lambda\) to 0.1, 0.5 and 0.9 respectively, \(γ\) is fixed at 0.1. Figure 1 shows the population percentage of four states is changed with time in BA network with 1000 nodes. With \(\beta\) unchanged, the increase of \(\lambda\) will decrease the percentage of population in I and R state. With \(\lambda\) unchanged, the percentage of population in \(I\) state becomes steep with the increase of \(\beta\). When \(\beta\) and \(\lambda\) increases at the same time, \(S\) population proportion change trend is falling rapidly, \(I\) state proportion change trend is steep, \(R\) population proportion will decline, \(B\) state proportion will rise. Results show that the diffusion can reach a steady state in 30 steps.
Advance Selling Strategy Model
(1) Basic model
Advance selling strategies are more prevalent in e-ecommerce marketing. For instance, mobile phone manufacturers tend to offer finished or semi-finished products before formally marketing them, also known as engineer samples. Engineer samples are "not for sale" and only available to professionals and brand loyalists. Then, using feedback from these users, manufacturers test their product, improve functions, and initiate product diffusion. Product information diffused across social networks help consumers decide whether they should order the advance selling product and do so online.
In general, an advance selling process involves two stages (Figure 2): consumers purchase the product in the first stage and product consumption occurs in the second stage. In the first stage, or advance period, the firm only completes the product design and delivers product information to influential consumers, who then share this information across their online social network. Only consumers who receive product information and wish to buy the product may order it. Firms must make promotional effort (\(h\)) to provide these consumers with samples, respond to feedback, and even pay a fee to stimulate the consumers to diffuse positive information.
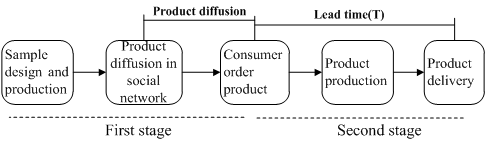
In the second stage, advance buyers order the product online. Production begins once market demand information has been collected, and following which firms deliver the products to consumers. The period between ordering and delivery is called the lead time. Moore’s (1965) law refers to the gradual decrease in production cost over time: the longer the lead time \((T)\), the higher the potential for cost reduction.
Firms have few months between product order and delivery, and this time lag provides an opportunity for cost reduction. Following is the cost reduction function, where \(ξ\) is the cost reduction parameter, and the higher value of \(ξ\) the greater the capacity for cost reduction:
| $$c_{1}=c_{0}(1\text{−}ξ)^{T},\,(0\text{≤}ξ\text{≤}1)$$ | (2) |
| $$ π=pn\text{−}c_{1}\tau n\text{−}c_{2}h $$ | (3) |
A firm’s total cost is \(c_1 \tau n + c_2 h\), where \(c_1\) is the production cost related to product quality \(\tau\) and \(c2\) is the cost of promotional effort \((h\)). The market price of the product is denoted by \(p\) and there are \(n\) consumers who ultimately buy the product. The number of people willing to purchase the product is influenced by the diffusion effect from online social networks. In the following section, we discuss the parameter setting in SIRB model.
(2) Transmission probability
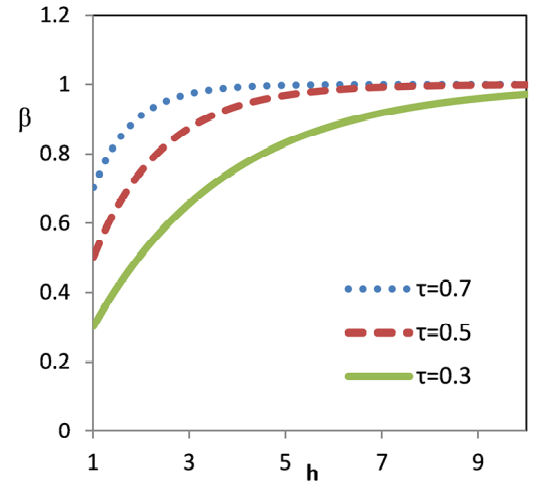
Product quality \(\tau\) and firm promotional effort (\(h\)) are key factors influencing consumers’ feelings and transmission probability, \(\beta\). Therefore, after using a product, the probability of a tester’s willingness to spread the product is \(\beta,\beta=1\text{−}(1\text{−}\tau)^{h},(0<\tau<1)\). This equation satisfies the effect of diminishing marginal product quality and effort (Choudhary 2007). Figure 3 shows that with a given product quality, \(\beta\) depicts an increasing trend and then remains stable with an increase in effort. This means that the more promotional effort a manufacturer exerts, the higher the transmission probability.
(3) Purchase probability
Consumer’s reference point is different, for the adoption decision of different types of products are different. In advance selling strategy, the product information owners (\(I\) state) make a decision on whether to buy or not to buy the product by comparing the reference point with lead time. The acceptable lead time for consumer \(i\) is \(ALT_i\), and consumer\(i\) will not buy the product when lead time (\(T\)) is greater than \(ALT_i\). However, consumers’ product purchase time tend to vary by product type and lead time. Consumers’ product purchase times are randomly assigned using the shifted Gompertz distribution, a well-known purchase time distribution with various shapes (Bemmaor & Lee 2002). Lee et al. (2013) presents the general form of the shifted Gompertz distribution:
| $$ F(T;b;u)=(1-e^{-bT})e^{-\mu e^{-bT}},\,T>0$$ | (4) |
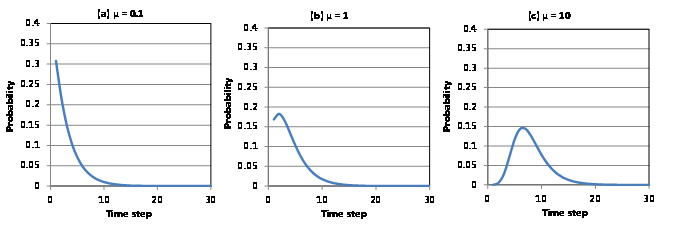
Figure 4 depicts the shift in Gompertz distributions when the shape parameter (\(mi\)) is set to 0.1, 1, and 10. The scale parameter (\(b\)) is fixed at 0.4 (Lee et al. 2013). Some products will last for many years, whereas other products are consumed as soon as they are purchased. To firms and economists, these are known as durable and non-durable products. Customers’ tendency to buy non-durable products can be modeled using the shifted Gompertz distribution with \(μ = 0.1\), which resembles an exponential distribution. However, the shifted Gompertz distribution with \(μ = 10\) has a shape similar to a normal distribution and satisfactorily explains the purchase times of durable products. Therefore, the probability of an individual purchasing the product is \(\lambda = 1 − F(T)\). As can be seen in Figure 4, the adopting probability of non-durable products reduced significantly with the increase of time step. It means that consumers would like to get these products earlier than the durable products.
Experimental Design
Network generation
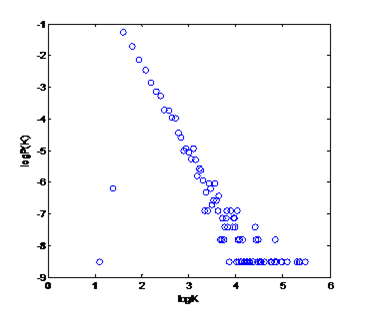
An online social network has a scale-free feature, which means the majority of users have less social relationships and the minority users have more social relationships (Fu et al. 2008). The Barabási–Albert (BA) model is the algorithm to generate random scale-free networks based on the preference attachment (Albert & Barabási 2002). Experimental network in this article is generated by the algorithm of BA network into three steps as follows: (1) initialize the network with 10 nodes; (2) add a new node and 5 edges in every step; (3) the new node add links to the old node with the preferential attachment probability \( ∏ ( k_i ) = k_i /∑_j k_j \), where \(k_i\) is the degree of old node \(i\). In the end, the experimental network has 5000 agents, with an average degree of 1125 and clustering coefficient of 0.231. Figure 5 is the degree distribution of the network, and its power-law exponent is -2.4056. The degree correlation coefficient of experimental network is -0.0735. The degree correlation less than zero means that the network has the character of disassortativeness (high degree nodes tend to attach to low degree nodes), this character is in consistent with many online social networks (Fu et al. 2008).
Simulation
Agent-based models (ABMs) are commonly used in social sciences to represent individual actors in a dynamic adaptive system (Amaral & Uzzi 2007; Hua & Wang 2014), for example, the diffusion process between networked heterogeneous agents (Janssen & Jager 2003; Nyblom et al. 2003; Delre et al. 2007). Meanwhile, marketing and diffusion research emphasizes the role of an influential minority who can influence an exceptional number of their peers in the formation of public opinion.
All agents are initially in the \(S\) state and agents whose degrees are the highest in the network transition to the \(I\) state. While \(I\) state agent exists, the loop for each agent with corresponding probability must be established. Next, running the four differential equations with an initial status for the population, we observe how the proportion of these four groups changes with time, and accordingly, calculate the profits earned in this advance selling process. Each combination was run 100 times. In each simulation, individual-level data on whether consumers decide to buy a product and the simulation period during which they do so were gathered.
The pseudo-code is shown in Table1. The program was implemented in Matlab and is available at https://www.openabm.org/model/5113.
The parameter settings are shown in Table 2. In Figure 3, the probability is very small when T greater than 10. Therefore, T is limited in the interval (1-10) in analysis. In Figure 2, the transmission probability \(\beta\) is stable when h approach 10. Consequently, h is limited in the interval (1-10) in the following analysis. Product quality \((\tau)\) is distributed in [0-1], where 0 means the lowest quality and 1 means the highest quality (Li et al. 2013). We set product quality \((\tau\)) to 0.3, 0.5, and 0.7 in turn, so as to represent low quality, medium quality, and high quality.
| Parameter | Interpretation | Value, if constant |
| N | Number of agents | 5000 |
| T | lead time | 1 to 10 in intervals of 0.05 |
| h | Firm’s promotional effort | 1 to 10 in intervals of 0.05 |
| \(\tau\) | Product quality | 0.3, 0.5, 0.7 |
| ξ | cost reduction parameter | 0 to 1 in intervals of 0.02 |
| c1 | Production cost per product | 100 |
| c2 | Cost of firm’s effort | 100 |
| p | Market price of product | 100 |
| \(\beta\) | Transmission probability of S→I | 1 - (1 – \(\tau\)) h |
| γ | Transformation probability of I→R | 0.1 |
| \(\lambda\) | Transformation probability of I→B | 1-F(T) |
| μ | Product category | 0.1 or 10 represent non-durable products or durable products |
| n | The market demand | collected by simulation |
| π | Profit | collected by simulation |
Profit maximization is the objective function for firms. Therefore, we focus on the influence mechanism of factors on profit in the next section, such as lead time, promotional effort, cost reduction and product quality. Moreover, the product category is considered in simulation includes the non-durable and durable products.
Results and Discussion
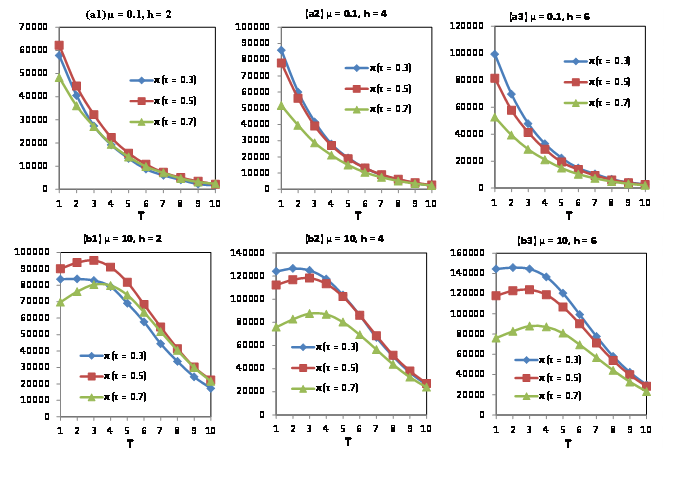
Impact of lead time
The impact of lead time \((T)\) is shown in Figure 6.
For non-durable products (\(µ=0.1\)), when promotional effort is relatively low (\(h=2\)), firms’ profits show a rapid decrease with an increase in lead time. When lead time is relatively short, profits from high-quality products (\(\tau=0.7\)) are lower than those from low-quality ones (\(\tau=0.3\)) and the opposite holds true when the lead time is long. The disparity in profits between product quality conditions decreases with an increase in lead time. This is because consumers are willing to buy non-durable products at an early stage, and therefore, an increase in lead time will lead to a decline in sales and profit. In general, low product quality brings high profits for firms owing to low costs. Moreover, the high purchase rate of non-durable products in the early stages delivers high profits. Overall, an increase in lead time reduces not only production costs but also sales, with the latter declining far more significantly. Therefore, advance selling may not be a suitable strategy for non-durable products.
For durable products \((µ= 10\)), firms’ profits show a gradual increase, followed by a decline with an increase in lead time. Using advance selling, firms can maximize their profits with an appropriate lead time. In the case of a relatively low lead time, profits from high-quality products (\(\tau= 0.7\)) are lower than those from low-quality ones (\(\tau = 0.3\)); the opposite holds true when the lead time is long. In sum, the gap in profits between product quality conditions increases and then declines with an increase in lead time. This is because the purchase rate of durable products rises relatively late and production costs decrease with increases in lead time.
Impact of promotional effort
Figure 7 depicts the impact of promotional effort.
For non-durable products, when lead time is relatively low (\(T = 3\)), firms’ profits show a rapid increase with an increase in promotional effort, but this effect is not significant for high-quality products. When promotional effort is relatively low, profits from medium-quality products are the highest; this is also the case for relative long lead time (\(T = 9\)). Profits from low-quality products increase and those for high-quality products level off with an increase in promotional effort. For durable products (\(µ = 10\)), profits from low-quality products increase with an increase in promotional effort, but this effect is not obvious for high-quality products. When effort is relatively low, profits are the highest from medium-quality products, and when promotional effort is relatively high, those from low-quality products are the highest.
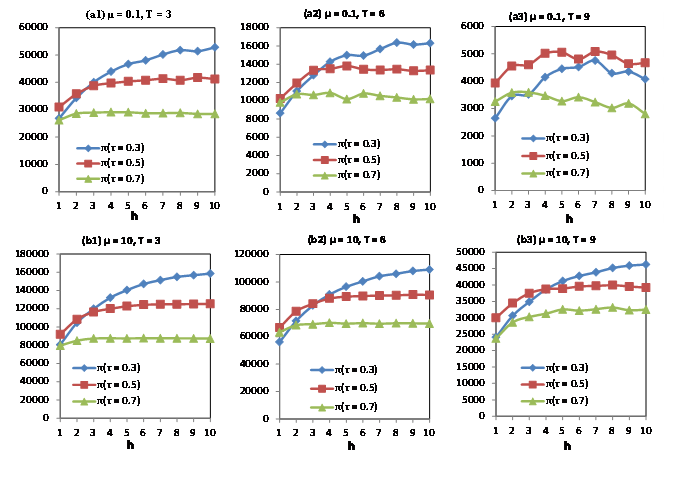
It can be observed that when lead time is low, increases in promotional effort enhance profits for both non-durable and durable products; this effect is particularly obvious for low-quality products. This result can be attributed to an increase in effort: the marginal increase effect of transmission probability (\(\beta\)) is low for high-quality products, although production cost increases in the meantime. Therefore, high effort may not be the best choice under high-quality conditions. When lead time is very long, the purchase probability (\(\lambda\)) is small for non-durable and durable products and an increase in effort is not effective for profit enhancement.
| T=3 | T=6 | T=9 | |
| Low h | \(µ\) = 0.1:medium quality | \(µ\) =0.1:medium quality | \(µ\) =0.1:medium quality |
| \(µ\) = 10:medium quality | \(µ\) = 10:medium quality | \(µ\) = 10:medium quality | |
| High h | \(µ\) = 0.1:low quality | \(µ\) = 0.1:low quality | \(µ\) = 0.1:medium quality |
| \(µ\) = 0.10:low quality | \(µ\) = 0.10:low quality | \(µ\) = 0.10:low quality |
On the basis of the analysis of \(h\) and \(T\), we obtain the selection set presented in Table 3. Medium and low quality appears to be the best option under certain conditions. High quality is not included in firms’ selection set because the cost reduction parameter \((ξ)\) is fixed at 0.05 in the simulation. The following section further explains this phenomenon with a dynamic \((ξ)\) effect on profits.
Impact of cost reduction
Figure 8 depicts the working of cost reduction parameter.
Irrespective of non-durable \((µ = 0.1)\) or durable \((µ = 10)\) products, firms’ profits show a slow increase and then begin to level off with increases in the cost reduction parameter \((ξ)\). The profit increase rate for high-quality products is faster that of other quality products. When the cost reduction parameters are relatively low, the profits for medium-quality products are relatively high; however, when the cost reduction parameters are relatively high, profits from high-quality products are relatively large.
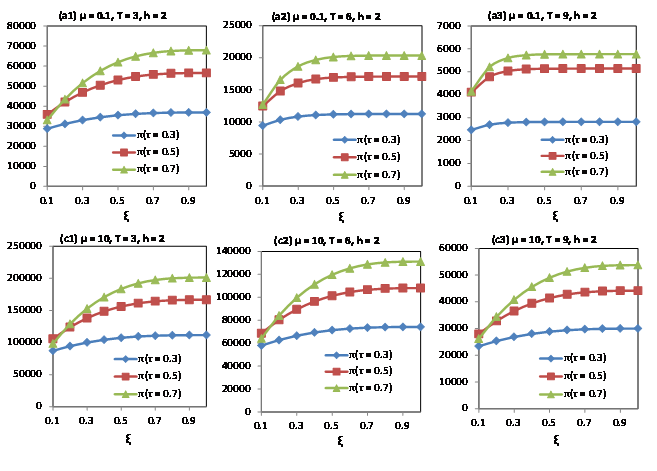
It can be seen that when the cost reduction parameter is set to 0.05, profits under the medium-quality condition are the highest under different \(µ\) and \(T\) combinations. This finding is consistent with those from the analyses of effort and lead time effects. Next, we attempt to identify the underlying mechanism for profits to be optimal under medium-quality conditions. We find that when \(ξ=1\), profits under high-quality conditions are higher than those under the other two conditions. This indicates that the capacity of cost reduction is important in decision making regarding product quality. Firms with a high \(ξ\) have greater incentives to offer high-quality products, whereas those with a low \(ξ\) have greater incentives to offer medium- and low-quality products.
| Non-durable product (\(µ\) = 0.1) | Durable product (\(µ\) =10) | |
| Low ξ | medium quality | medium quality |
| High ξ | *High quality | *High quality |
| Notes: *indicates one’s optimal choice | ||
Analysing profits under different \(ξ\) and \(T\) conditions, we obtain the selection set presented in Table 4. A low cost reduction parameter \(ξ\) limits the effectiveness of advance selling. When \(ξ\) is high, irrespective of non-durable \((µ = 0.1)\) or durable \((µ = 10)\) products, firms have an incentive to offer high quality.
Robust Regression Analysis
We adopt a statistical method to test for robustness and verify the relationship between the parameters and profits. A robust regression can reduce the influence of heteroscedasticity in a regression analysis. Therefore, lead time \((T)\), quality \((\tau)\), promotional effort \((h)\), and cost reduction \((ξ)\) are incorporated in the robust regression model. In Table 5, M1–M4 are the robust regression of non-durable products and M5–M8 are the analyses of durable products.
For low-quality non-durable products, the coefficient for T-squared is positive and significant \((\beta=1.8738, p < 0.01)\), whereas that for h-squared is negative and significant \((\beta=−0.4644, p < 0.01)\), indicating that T has a U-shaped relationship with profits and h has an inverted U-shaped relationship. For high-quality non-durable products, the coefficient for T-squared is positive and significant \((\beta=1.1940, p < 0.01)\), whereas that for \(ξ\)-squared is negative and significant \((\beta=−0.5136, p < 0.1)\), suggesting that T has a U-shaped and \(ξ\) an inverted U-shaped relationship with profits.
For low-quality durable products, the coefficient for T-squared \((\beta=−0.6652, p < 0.01)\), h-squared \((\beta=−0.7090, p < 0.01)\), and \(ξ\)-squared \((\beta=−0.1863, p < 0.01)\) are negative and significant, implying an inverted U-shaped relationship with profits. For high-quality durable products, the coefficient for T-squared \((\beta=−0.9976, p < 0.01)\) and ξ-squared \((\beta=−0.7061, p < 0.05)\) are negative and significant, whereas that for h-squared is non-significant, which indicates that only \(T\) and \(ξ\) have an inverted U-shaped relationship with profits.
The coefficient for h is significant under the low-quality condition, but non-significant for the high-quality condition, indicating that to some degree, there is substitution relationship between \(\tau\) and \(h\). This relationship is consistent with the discussion for transmission probability in this paper. In addition, according to the graphically represented regression results, T shows a U-shaped relationship in the case of non-durable products and an inverted \(U\) shape for durable product; only in the case of low quality, \(h\) shows an inverted U shape. The inverse U-curve relationship between \(ξ\) and profits is more significant for durable products than non-durable ones.
| Non-durable (low \(\tau\)) | Non-durable (high \(\tau\)) | Durable (low \(\tau\)) | Durable (high \(\tau\)) | |||||
| M1 | M2 | M3 | M4 | M5 | M6 | M7 | M8 | |
| T | -.8866*** | -2.7276*** | -.8468*** | -2.0237*** | -.8797*** | -.2233 | -.6893*** | .2882 |
| h | .1888*** | .6859*** | -.0377 | .0631 | .4384*** | 1.1675*** | .0087 | .1820 |
| ξ | .0057 | .1948* | .3332*** | .8773*** | .1112*** | .3453*** | .6001*** | 1.3040*** |
| T2 | 1.8738*** | 1.1940*** | -.6652*** | -.9976*** | ||||
| h2 | -.4644*** | -.0501 | -.7090*** | -.1257 | ||||
| ξ2 | -.1151 | -.5136* | -.1863*** | -.7061** | ||||
| R2 | 0.8205 | 0.9511 | 0.8207 | 0.8802 | 0.9248 | 0.9583 | 0.7997 | 0.8613 |
| F | 70.33*** | 168.15*** | 105.20*** | 75.39*** | 678.44*** | 218.99*** | 84.70*** | 46.33*** |
Discussion and Conclusions
Product diffusion and business strategy remain continuously and extensively explored topics. In this research, we combined the two issues using agent-based modelling. We defined four possible states for consumers and divide the population into four corresponding groups. We then introduced differential equations of SIRB model to describe changes in the proportion of these groups over time in the process of advance selling. A series of simulation experiments were conducted to determine if and when individuals decide to diffuse, adopt, and resist a product under various conditions. The results demonstrated that the effects of lead time, promotional effort, product quality, and cost reduction on a firm’s profits are complex.
Taking these research results into consideration, our findings can be summarized as follows. Firstly, non-durable products and durable products have similarities in diffusion effect. The same trend is that the firms’ profits increase with the growth of promotional effort or the reduction of cost and, the firms’ profits decrease with the increase of lead time. Secondly, lead time is important in advance selling strategy. When the lead time is short, increases in effort can enhance profits for non-durable and durable products. This effect is obvious for low-quality products. When lead time is very long, an increase in effort is not effective for profit enhancement. Finally, cost reduction is a key factor in firms’ decision making on whether to use advance selling strategy or not. A low cost reduction limits the effectiveness of advance selling strategy. When the level of cost reduction is high, regardless of product type, firms have an incentive to offer high-quality products. Conversely, when the level of cost reduction is low, firms would rather provide medium or low-quality products.
An important contribution of this study is that it provides a setting to examine product diffusion in an online social network with different product types. In addition, it verifies the importance of an advance selling strategy in product diffusion with focus on online social networks. We extended the susceptible-infected-removed (SIR) model by adding a buyer component (SIRB) to it and conducted an in-depth analysis of transmission probability and purchase probability when using an advance selling strategy. Finally, we show that ABMs provide extensive flexibility and power in exploring the problem of the product diffusion process in an online consumer social network and the mechanism of advance selling strategies.
The main implications of this article can be summarized as follows:
- The relative researches about product diffusion should include three aspects: information diffusion, product adoption and profit procurement. In the existing researches, such as BASS model and SIR model, there are is confusion between information diffusion and product adoption. However, the information dissemination scope does not represent the using amount of the product. Moreover, if the study did not consider specific business strategy, the diffusion research is also difficult to output products sales and profits.
- Expanding the existing models in particular situations can interpret research question more accurately. As many researches have expanded the SI or SIR model to variants, this paper construct the SIRB model to depict the process from information diffusion to product adoption. The transformation probability between four states, especially \(\beta\) and \(\lambda\), are needed to be set based on advance selling situation. If \(\lambda\)=0, SIRB model degrade to SIR model, the degradation model can only simulate the information diffusion.
- Advance selling strategy in this article is different with timing strategy (Lee et al. 2014), although these two strategies are both using the online social network and adjusting the product release time to maximize profits. In advance selling strategy, product is launched in the market before mass production. Lead time is an important factor in advance selling strategy, which not only affects the production cost, but also the consumer purchase decision-making. However, not all consumers are willing to pay for the product in advance. Therefore, the reference point needs to be considered in decision-making of product adoption.
This study has certain limitations. First, in our model, consumers’ expectations for product quality are assumed to be constant during the simulation and the gap between expectations and reality may affect consumer perception and evaluation. This limitation can be parsimonious when modelling product diffusion with negative evaluations. Second, this study focuses on the advance selling of products in markets without other competitive products. Future research should examining how these factors affect firms’ profits using advance selling strategy in a competitive market.
Acknowledgements
We thank the anonymous referees for valuable comments that helped to improve the paper. We would also like to thank Xiaohui Chen who assisted with the text editing.References
ABRANTES, J. L., Seabra, C., Lages, C. R., & Jayawardhena, C. (2013). Drivers of in-group and out-of-group electronic word-of-mouth. European Journal of Marketing, 47(7), 1067-1088. [doi:10.1108/03090561311324219]
AHRENS, J.,Coyle, J. R., & Strahilevitz, M. A. (2013). Electronic word of mouth: the effects of incentives on e-referrals by senders and receivers. European Journal of Marketing, 47(7), 1034-1051. [doi:10.1108/03090561311324192]
ALBERT, R., & Barabási, A. L. (2002). Statistical mechanics of complex networks. Reviews of Modern Physics, 74, 47-97. [doi:10.1103/RevModPhys.74.47]
ALBUQUERQUE, P., Pavlidis, P., Chatow, U., Chen, K., & Jamal Z. (2012).Evaluating promotional activities in an online two-sided market of user-generated content. Marketing Science, 31(3),406-432. [doi:10.1287/mksc.1110.0685]
AMARAL, L.A.N., & Uzzi, B. (2007). Complex system-A new paradigm for the integrative study of management, physical, and technological system. Management Science, 53(7), 1033-1035. [doi:10.1287/mnsc.1060.0696]
BEMMAOR, A.C., & Lee, J.(2002). The impact of heterogeneity and ill-conditioning on diffusion model parameter estimates. Marketing Science, 21(2), 209-220. [doi:10.1287/mksc.21.2.209.151]
CHOUDHARY, V. (2007). Comparison of software quality under perpetual licensing and software as a service.Journal of management information systems,24(2),141-165. [doi:10.2753/MIS0742-1222240206]
DELRE, S. A., Jager, W., Bijmolt, T. H. A., & Janssen, M. A. (2007). Targeting and timing promotional activities: An agent-based model for the takeoff of new products. Journal of Business Research, 60(8), 826-835. [doi:10.1016/j.jbusres.2007.02.002]
DUAN, W., Gu, B., & Whinston, A. B. (2008).Do online reviews matter? An empirical investigation of panel data. Decision Support Systems, 45(4), 1007-1016. [doi:10.1016/j.dss.2008.04.001]
FADER, P. S., & Winer, R. S. (2012). Introduction to the special issue on the emergence and impact of user-generated content. Marketing Science, 31(3), 369-371. [doi:10.1287/mksc.1120.0715]
FU, F., Liu, L., & Wang, L. (2008). Empirical analysis of online social networks in the age of web 2.0. Physica A: Statistical Mechanics and its Applications, 387(2), 675-684. [doi:10.1016/j.physa.2007.10.006]
GENTINA, E., & Bonsu, S. K. (2013). Peer network position and shopping behavior among adolescents. Journal of Retailing and Consumer Services, 20, 87-93. [doi:10.1016/j.jretconser.2012.10.009]
GRANOVETTER, M. (1978). Threshold models of collective behavior. American Journal of Sociology, 83(6), 1420-1443. [doi:10.1086/226707]
HUANG, G. (2015). Function optimization algorithm based on SIRQV epidemic dynamic model. Journal of Computational Science, 8, 62-92. [doi:10.1016/j.jocs.2015.02.009]
HUANG, J.H. & Chen, Y.F. (2006). Herding in online product choice. Psychology and Marketing, 23 (5), 413-428. [doi:10.1002/mar.20119]
HUANG. W., & Li, C.(2007). Epidemic spreading in scale-free networks with community structure.Journal of Statistical Mechanics:Theory and Experiment, 2007(01), P01014.
IYENGAR, R., Bulte, C. V., & Valente,T. W. (2011).Opinion leadership and social contagion in new product diffusion. Marketing Science, 30(2), 195-212. [doi:10.1287/mksc.1100.0566]
JANSSEN, M. A., & Jager, W. (2003). Simulating market dynamics: interactions between consumer psychology and social networks. Artificial Life, 9(4), 343-356. [doi:10.1162/106454603322694807]
KAHNEMAN, D., & Tversky, A. (1979). Prospect theory: An analysis of decisions under risk. Econometrica, 47(2), 263-292.
KAPLAN, A. M., & Haenlein, M. (2010).Users of the world, unite! The challenges and opportunities of social media. Business Horizons, 53(1), 59-68. [doi:10.1016/j.bushor.2009.09.003]
KERMACK, W.O., & Mckendrick, A. G. (1927). A contribution to the mathematical theory of epidemics. Proceedings of the Royal Society of London, 115(772), 700-721. [doi:10.1098/rspa.1927.0118]
KIVETZ, R., & Simonson, I. (2002). Earning the right to indulge: effort as a determinant of customer preferences toward frequency program rewards. Journal of Marketing Research, 39(2), 155-170. [doi:10.1509/jmkr.39.2.155.19084]
LEE, K., Kim, S., Kimand, C. O., & Park, T. (2013). An agent-based competitive product diffusion model for the estimation and sensitivity analysis of social network structure and purchase time distribution. Journal of Artificial Societies and Social Simulation, 16 (1) 3: https://www.jasss.org/16/1/3.html. [doi:10.18564/jasss.2080]
LEE, K., Lee, H., & Kim, C.O. (2014). Pricing and timing strategies for new product using agent-based simulation of behavioural consumers. Journal of Artificial Societies and Social Simulation, 17 (2) 1: https://www.jasss.org/17/2/1.html. [doi:10.18564/jasss.2326]
LEE. H. (2014). The role of consumers' network positions on information-seeking behavior of experts and novices. Journal of Business Research, 67, 2853-2859. [doi:10.1016/j.jbusres.2012.07.002]
Hua, L., & Wang, W.(2014). The impact of network structure on innovation efficiency: An agent-based study in the context of innovation networks. Complexity, 21(2), 111-122. [doi:10.1002/cplx.21583]
LI Y., Xu, L., & Li, D.(2013). Examining relationships between the return policy, product quality, and pricing strategy in online direct selling. International Journal of Production Economics, 144(2), 451–460. [doi:10.1016/j.ijpe.2013.03.013]
LOPEZ, M., & Sicilia, M. (2013). How WOM marketing contributes to new product adoption. European Journal of Marketing, 47(7), 1089-1114. [doi:10.1108/03090561311324228]
MOE, W.W, & Fader, S. (2002). Using advance purchase orders to forecast new product sales. Marketing Science, 21(3), 347-364. [doi:10.1287/mksc.21.3.347.138]
MOORE, G. E. (1965). Cramming more components onto integrated circuits. Electronics Magazine, 86(1): 82-85.
NYBLOM, J., Borgatti, S., Roslakka, J., & Salo, M. A. (2003). Statistical analysis of network data-an application to diffusion of innovation. Social Networks, 25(2), 175-195. [doi:10.1016/S0378-8733(02)00050-3]
PARK, D. H., & Kim, S.(2008). The effects of consumer knowledge on message processing of electronic word-of-mouth via online consumer reviews. Electronic Commerce Research and Applications, 7(4), 399-410. [doi:10.1016/j.elerap.2007.12.001]
PASTOR-SATORRAS, R., & Vespignani, A. (2001). Epidemic spreading in scale-free networks. Physical review letters , 86(14), 3200. [doi:10.1103/PhysRevLett.86.3200]
PASTOR-SATORRAS, R., & Vespignani, A. (2002). Epidemic dynamics in finite size scale-free network. Physical review E , 65(3), 035108. [doi:10.1103/PhysRevE.65.035108]
SMITH, A. N., Fischer, E., & Chen. Y. J. (2012). How does brand-related user-generated content differ across YouTube, Facebook, and Twitter?. Journal of Interactive Marketing, 26(2), 102-113. [doi:10.1016/j.intmar.2012.01.002]
WATTS, D. J., & Dodds, P. S. (2007). Influentials, networks, and public opinion formation. Journal of Consumer Research, 34(4), 441-458. [doi:10.1086/518527]
WENG, Z.K., & Parlar, M. (1999).Integrating early sales with production decisions: analysis and in sights. IIE Transactions, 31(11), 1051-1060. [doi:10.1080/07408179908969906]
XIE, J., & Shugan, S.M. (2001). Electronic tickets, smart cards, online prepayments: when and how to advance sell. Marketing Science,20(3), 219-243. [doi:10.1287/mksc.20.3.219.9765]
Yin-Zuo, Z., Zong-Hua, L., & Jie, Z. (2007). Periodic wave of epidemic spreading in community networks. Chinese Physics Letters, 24(2), 581. [doi:10.1088/0256-307X/24/2/078]
ZHANG, L., Ma, B., & Cartwright, D. K. (2013). The impact of online user reviews on cameras sales. European Journal of Marketing, 47(7), 1115-1128. [doi:10.1108/03090561311324237]
ZHAO, X., & Stecke, K.E. (2010). Pre-orders for new to-be-released products considering consumer loss aversion. Production and Operations Management, 19(2), 198–215. [doi:10.1111/j.1937-5956.2009.01092.x]