
Introduction
Consumer behavior is a very complex process and it is often not feasible to study it using conventional analytical or empirical approaches (Gilbert et al. 2007). In this situation, agent-based models (ABM), in particular cellular automata (CA), are extensively used in this field (Rand and Rust 2011; Squazzoni 2012; Bianchi and Squazzoni 2015). ABM provide a bridge between the micro and macro levels, and therefore are used to study the mechanisms of social behavior (Macy and Willer 2002; Squazzoni 2008). Moreover, the CA approach allows to test the paradigm of macro-collective behavior based on local relationships in a particularly straightforward way (Moldovan and Goldenberg 2004). There are many examples of applications of CA to study consumer behavior, e.g. investment behavior in the stock market (Wei et al. 2003), interactions between customers and suppliers of medical and cosmetic products (Zimbres and De Oliveira 2009), effects of network externalities on the growth rate of a new product (Goldenberg et al 2010), introduction of new products in the mobile and desktop phones market in China (Ma and Chao 2011) and innovation diffusion (Goldenberg and Efroni 2001; Goldenberg et al 2001a).
One of the most important factors influencing consumer behavior is interpersonal impact. An individual’s decision to purchase a certain product depends on the experience of other buyers (Teraji 2003). These are informal networks of contacts, which have long been seen as a key source of influence in social systems (Brass 1984). The basic mechanism of these informal contacts is word–of-mouth communication (w-o-m). As shown by (Goldenberg et al. 2001b) and (Peres et al. 2010), after an initial stage – when advertising can be more effective – w-o-m is the main propelling mechanism for launching a new product in the market. In addition, many studies show, that w-o-m has a significant impact on the demand curves for innovative products (Campbell 2013; Maciejowska et al. 2016) and the resulting consumer choices (Mahayan et al. 1984; Brown and Reingen 1987; Hennig-Thurau and Walsh 2004; Steffes and Burgee 2009). In certain circumstances, this type of communication is more effective than any other form of advertising (Goldsmith and Horowitz 2006). Furthermore, w-o-m marketing exerts a significant impact on sales. For example, w-o-m can increase the box office revenues of a movie (Liu 2006), increases beer (Clemons et al. 2006) and book sales (Chevalier and Mayzlin 2006). Therefore, in this paper we use a CA model to study the consumer decision-making process based solely on word-of-mouth communication.
We follow here ideas introduced in the famous Schelling model (Schelling 1971) and our previous paper (Kowalska-Styczeń and Sznajd-Weron 2012). In the Schelling model each agent belongs permanently to one of two types and moves to an empty place if he/she is in an unhappy situation, i.e. if the fraction of the neighboring agents of the same type is too low (below threshold T). Therefore in the Schelling model a movement can be interpreted as a search for happiness. In our model, agents are not permanently assigned to one of the types and can change their states due to w-o-m, because the agent type describes an individual’s decision, like in many other ABM models in marketing (Rand and Rust 2011). However, similarly as in the Schelling model, they can also move to an empty place and the movement is now interpreted as a search for information. In this paper we generalize the previously proposed model (Kowalska-Styczeń and Sznajd-Weron 2012) by introducing three different types of w-o-m: (1) based on the absolute majority, like in the previous paper, (2) based on the unanimous majority with the probability of social influence depending on the size of the group, as in Latane’s theory, and (3) based on the unanimous majority independently of the group size, like in Nyczka and Sznajd-Weron (2013).
Using majority and unanimity rules seems to be a reasonable choice because empirical studies show that people tend to group together, as seen in the stock market, online auctions (Teraji 2003) or during mass events (Becker 1991). The cues that elicit herd behavior and influence consumer choices have been also studied in (Huang and Chen 2006). Furthermore, consensus could influence interpersonal communication more than lack of consensus (Burnkrant and Cousineau 1975; Pincus and Waters 1977).
The aim of this paper is to answer the question if differences between these three w-o-m rules, introduced on the microscopic level, will manifest on the macroscopic level. The results of our simulations together with well-known social theories provide a basis for recommending rules, which are appropriate for modeling particular social phenomena.
The general model
In the previous paper (Kowalska-Styczeń and Sznajd-Weron 2012) we have introduced a simple CA model of consumer behavior in which decisions were made solely on the basis of person-to-person communication. Here we extend our previous study by testing different rules to model the word-of-mouth process. Nevertheless, still the only source of changes is w-o-m. Our assumption goes in line with the observation that in a variety of decision-making scenarios individuals may be influenced more by the exposure to each other than the external factors like mass media (Watts and Dodds 2007; Nolan et al. 2008). Moreover, limiting dynamical rules of the model to a single source (w-o-m), allows for an in-depth comparative analysis of the different versions of the model.
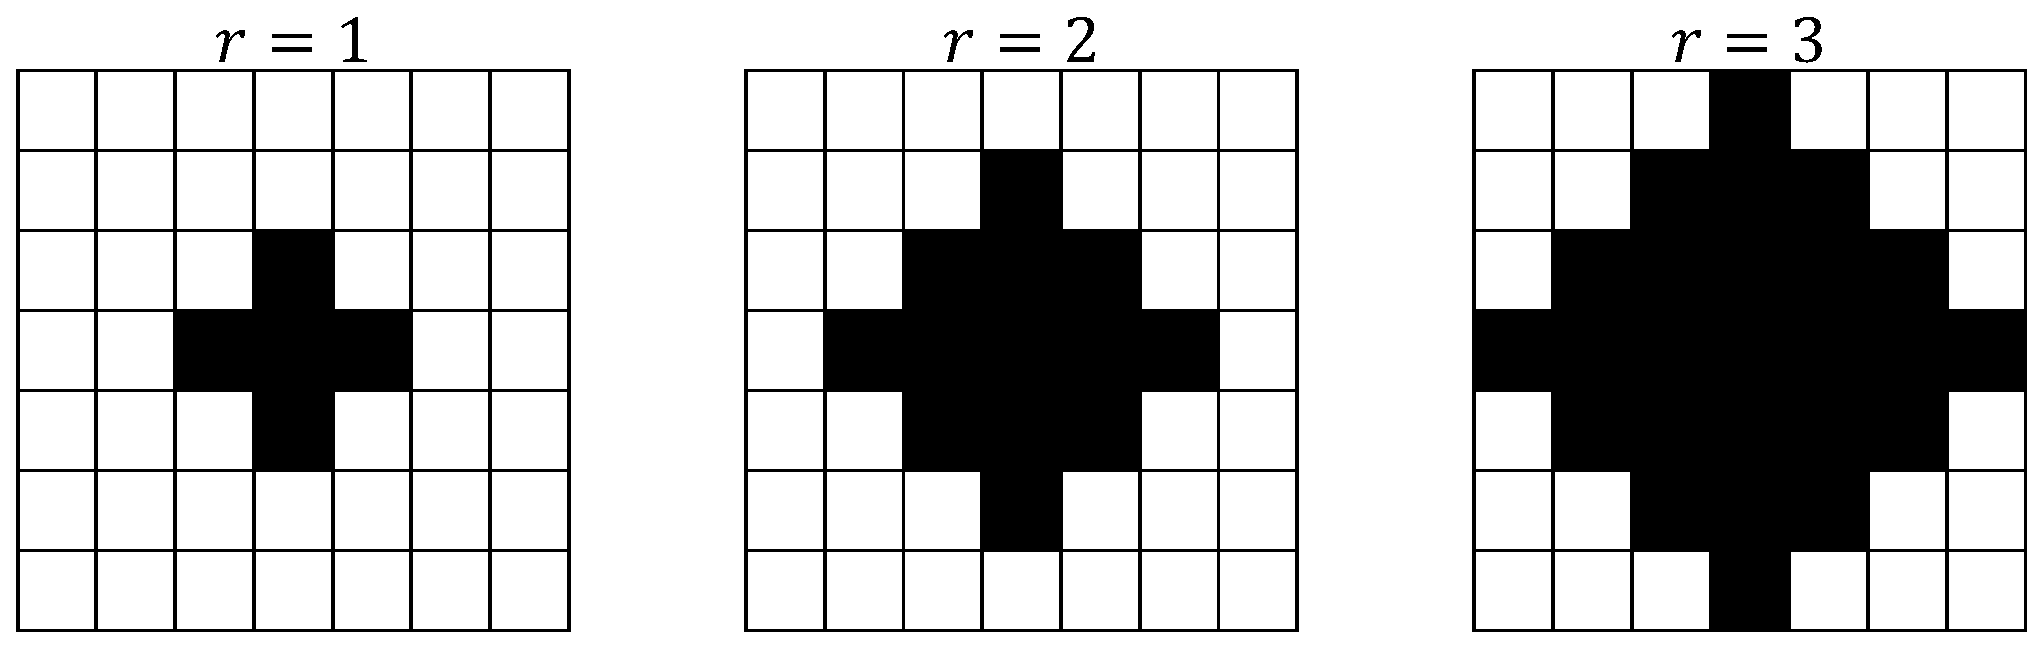
In our generalized model, as in Kowalska-Styczeń and Sznajd-Weron (2012), cells are arranged in a two dimensional square lattice L x L with periodic boundary conditions and a von Neumann neighborhood of range r = 1 or r = 2 (see Fig. 1). Each i-th cell (i = 1,..., L2) can be in one of three states: empty (Si = 0), occupied by an agent of type A (Si = 1) or occupied by an agent of type B (Si = -1). At each time step t the number of agents of type A, denoted by (NA(t), and the number of agents of type B, denoted by NB(t), can be changed according to the rules described below, but the total number of agents NA(t) + NB(t) = N ≤ L2 is preserved and thus an average concentration of occupied cells p = N/L2 ∈ [0, 1] is constant. Initially agents are distributed randomly on the lattice, i.e. with probability p a randomly chosen cell is occupied and with probability 1 - p it is empty. In Kowalska-Styczeń and Sznajd-Weron (2012) probability p, that a randomly chosen cell is occupied, was interpreted as access to information in word of mouth marketing and the agent type (A or B) as a consumer of one of two competing brands or products. Representing agents in the market by binary variables is not a new idea. For example, in (Bouzdine-Chameeva and Galam 2011) A and B were interpreted as two competing wine brands. In general, binary variables can represent a much wider set of concepts (Watts and Dodds 2007) and are often used as a more robust representation of polytomous-format data (Kaiser and Byrka 2015).
Like Kowalska-Styczeń and Sznajd-Weron (2012) we consider here random initial conditions, which means that initially the spatial distribution of agent types is homogeneous - each occupied cell is of type A with probability c0 ≡ c(0)=NA (0)/N and B with probability 1 - c0. At each time step t all cells i = 1,..., L2 are updated simultaneously according to the following general rules:
- An agent (i.e. an occupied cell, Si (t)=1 or Si (t)= -1) can change its state to the opposite one (Si (t+1)= - Si (t)) due to the social influence of its neighbors. In the original version of the model, a cell changed its state to the state represented by the majority of the neighborhood. In this paper we will introduce also other possibilities.
- If an agent cannot make a decision on the basis of the state of its neighborhood (for example, in the absence of a majority in the original version of the model) then with probability q he/she moves to the nearest empty cell in a randomly chosen direction (N, E, S or W).
We consider two extreme cases of the model, i.e. with movement (m) which corresponds to q = 1 and without movement (wm), i.e. for q = 0. It should be also stressed here that the second rule does not have to be interpreted as a physical movement but also as the act of seeking information from different sources, for instance, the Internet (Kowalska-Styczeń and Sznajd-Weron 2012).
Modifications of the model
In Kowalska-Styczeń and Sznajd-Weron (2012) we have assumed that the absolute majority is sufficient to change the state of an agent. However, in many real-world situations the absolute majority may not be sufficient. It has been observed in a number of experiments that a small unanimous group may be more efficient than a much larger group with a non-unanimous majority (Bond 2005). In a classical series of experiments on conformity, Solomon Asch found that the presence of a social supporter reduced conformity dramatically - participants of the experiment were far more independent when they were opposed by a seven person majority and had a partner sharing the same opinion than when they were opposed by a three-person majority and did not have a partner (Asch 1955). Influence of a consistent minority on the responses of a majority has been also reported by (Moscovici et al. 1969). Also recent neurological experiments suggest that unanimous opinions may be critical for normative influence (Campbell-Meiklejohn et al. 2010). Therefore one can imagine that the majority rule can be replaced by the unanimity rule as in the q-voter model (Nyczka and Sznajd-Weron 2013; Castellano et al. 2009). In fact both rules are just a special case of the famous threshold model (Granovetter 1978, Granovetter and Soong 1986; Watts and Dodds 2007). Within the general threshold rule individuals will switch from A to B only if at least a threshold fraction Ø of its neighboring nodes are in state B. Therefore the majority rule considered in Kowalska-Styczeń and Sznajd-Weron (2012) can be described by the threshold Ø = 0,5 and the unanimity rule by Ø = 1. As noticed in Singh et al. (2013) the threshold condition is more easily satisfied if the number of neighbors k is smaller. On the other hand, it is well known that the social influence increases with the size of the group (Asch 1955; Latane 1981; Bond 2005; Myers 2013). According to the famous theory of social influence by (Latane 1981) the impact increases with size k of the group as kα, with α = 2 for most reported experiments. Latane’s principle is not easy to be introduced for an arbitrary threshold, but it can be easily done for the unanimity rule (Ø = 1).
Summarizing, there are three interesting rules describing social influence (word-of-mouth) that are worth to be considered and compared:
- Majority rule (MR): An agent changes its type from A to B with probability 1 if the majority of occupied cells in his/her neighborhood are in state B and otherwise does not change. Analogously, an agent changes its type from B to A with probability 1 if the majority of occupied cells in his/her neighborhood are in state A. In the absence of majority, an agent moves with probability q to the nearest empty site in a randomly chosen direction. This rule has been used in Kowalska-Styczeń and Sznajd-Weron (2012).
- Unanimity rule (UR): An agent changes its type from A to B with probability 1 if all occupied cells in his/her neighborhood are in state B and otherwise does not change. Analogously, an agent changes its type from B to A with probability 1 if all occupied cells in his/her neighborhood are in state A. If not all occupied cells in the neighborhood are in the same state an agent moves with probability q to the nearest empty site in a randomly chosen direction. The unanimity rule is inspired by the Sznajd and q-voter models (Nyczka and Sznajd-Weron 2013; Castellano et al. 2009).
- Unanimity Latane rule ( ULR): An agent changes its type from A to B if all occupied cells in his/her neighborhood are in state B with probability f (k) which is, according to (Latane 1981), proportional to the square root of the number of occupied cells k. In order to ensure that f (k) ∈ [0, 1] we have to choose a rescaling constant and therefore for the von Neumann neighborhood of range r = 1 the probability of change equals \(f(k)=\sqrt{\frac{k}{2}}\), where \(k \in \{0,1,2,3,4\}\), whereas for r = 2 we have \(f(k)=\frac{\sqrt{k}}{\sqrt{12}}\), where \(k \in \{0,1,...,12\}\). If not all occupied cells in the neighborhood are in the same state an agent moves with probability q to the nearest empty site in a randomly chosen direction. An illustration of the Unanimity Latane rule (ULR) is presented in Fig. 2. To the best of our knowledge, such a rule has not been used before in ABM, in spite of the firm social basis.

The ULR rule is definitely more complicated than UR, yet it seems to be more realistic from the social point of view. The question that naturally arises is the following: Will differences between the MR, UR and ULR rules, which are details on the microscopic scale, manifest on the macroscopic level?
Implementations of the model
We have prepared two programs that allow to simulate all three variants of the model. The first one, implemented in Delphi, can be downloaded from IDEAS/RePEc: https://ideas.repec.org/c/wuu/hscode/zip16001.html. The second one, written in NetLogo, can be downloaded fromhttp://modelingcommons.org/browse/one_model/4597#model_tabs_browse_info. The Delphi implementation is faster, allows to simulate larger systems and generally is more suitable for scientific simulations. On the other hand, the NetLogo implementation is more user friendly and allows to visualize step by step the evolution of the system. Finally, as usually, NetLogo allows not only to read but also to modify the code.
Results
In Kowalska-Styczeń and Sznajd-Weron (2012) we have already investigated the model with the MR rule. Here, we focus on comparing this model with the two newly introduced, i.e. UR and ULR. We have conducted simulations for different lattice sizes, from L = 10 to L = 100 and averaged over M = 103 samples. Results nicely scale with the system size for all models, analogously as in MR ( Kowalska-Styczeń and Sznajd-Weron 2012). Therefore, we have decided to present all results on a 50 x 50 square lattice, which is large enough for statistical purposes but at the same time small enough to obtain results within a reasonable time.
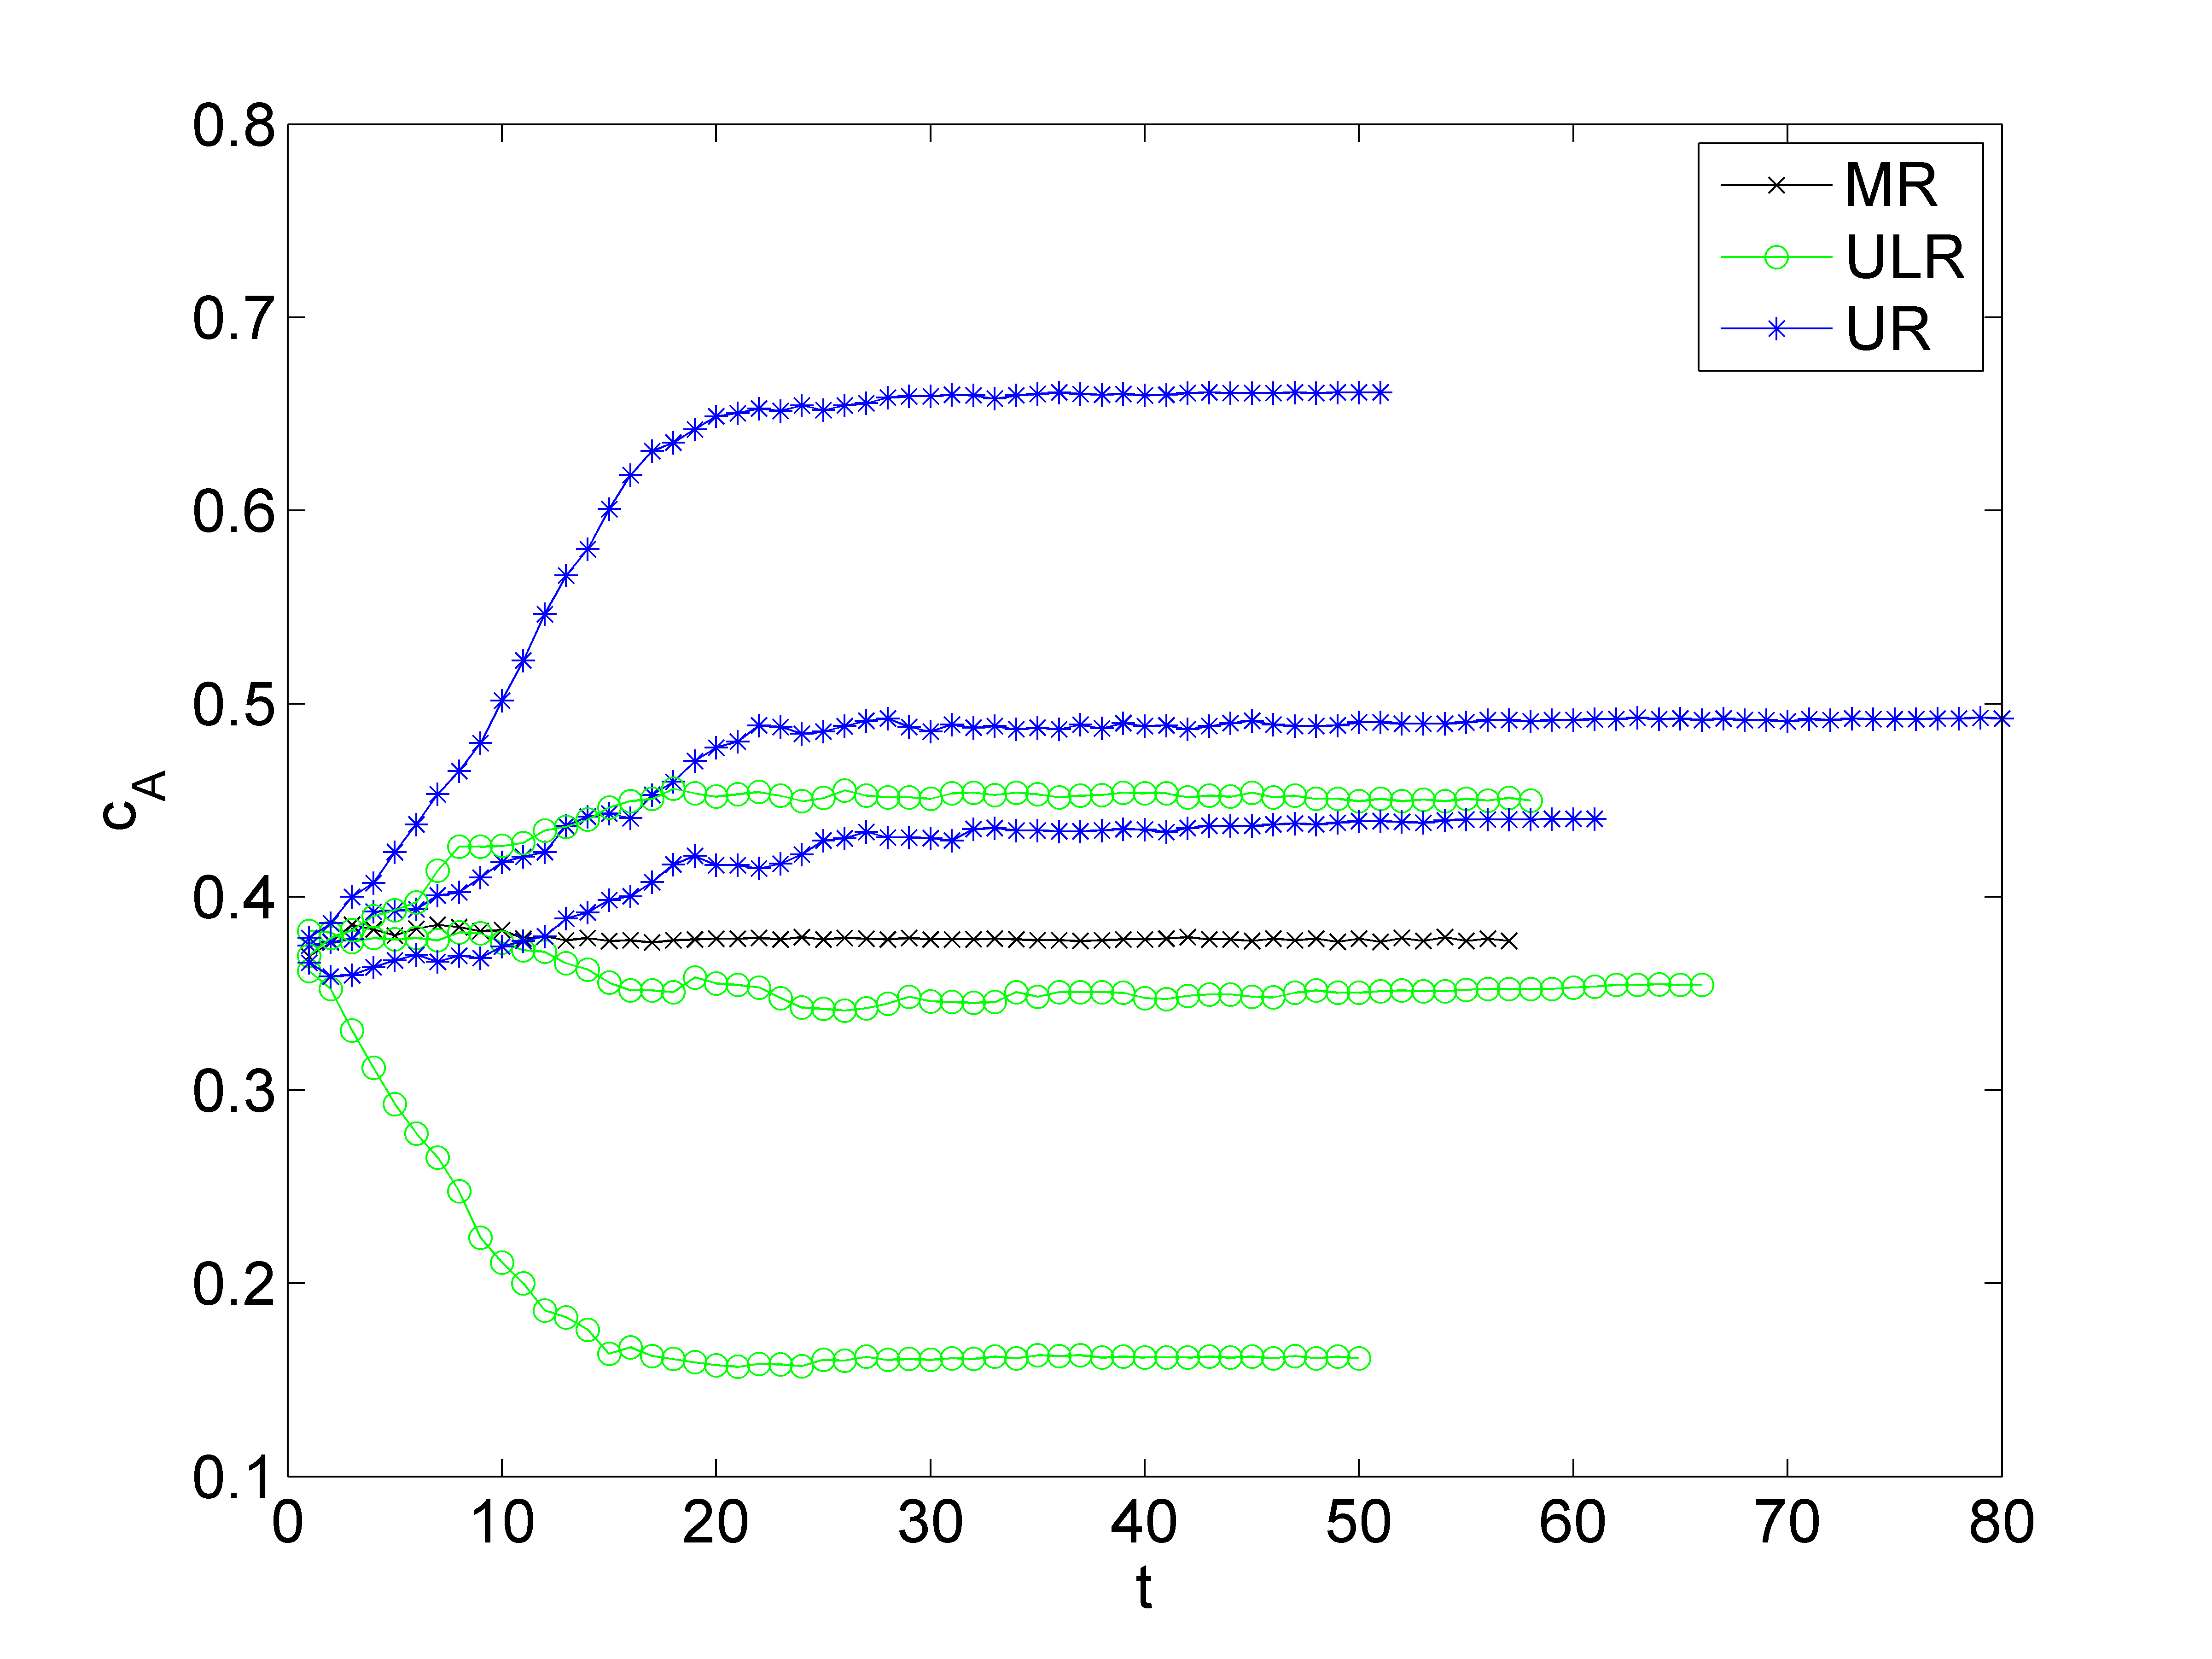
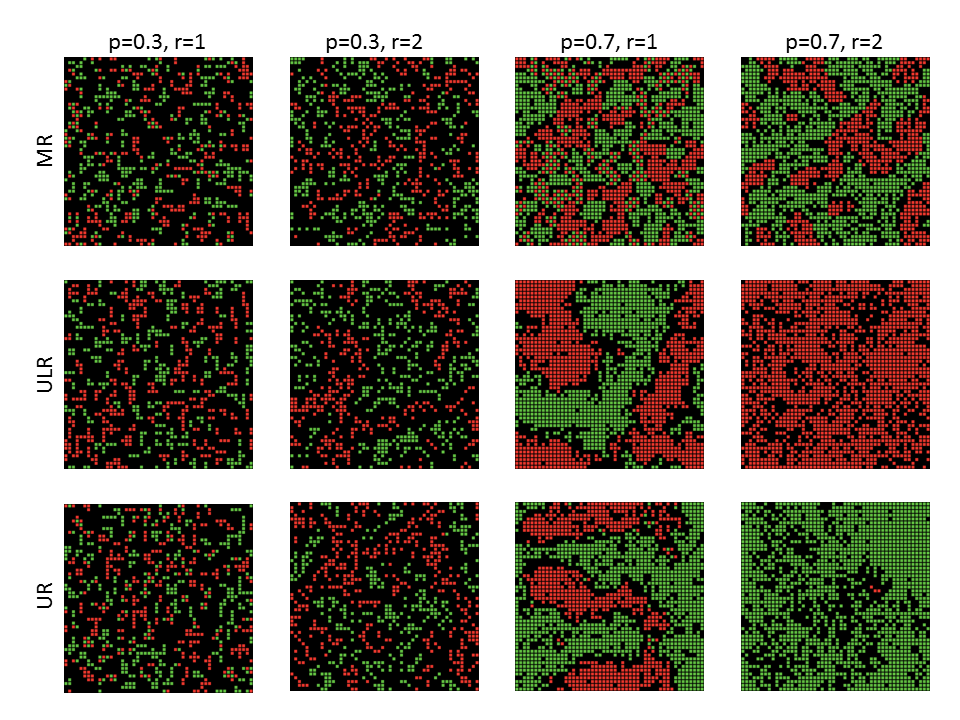
Initially the spatial distribution of agents is homogeneous, i.e. each occupied cell is in state A with probability cA(0) = c0 and in state B with probability cB = 1 - c0. Under each of the three rules (MR, UR or ULR) the system evolves towards the stationary state and reaches, after a certain relaxation time τ, the final concentration of A – cst. Let us start from the symmetric initial state for which the number of agents of type A is the same as the number of agents of type B, i.e. cO = 0.5. It is seen in Fig. 3 that in such a case there is almost no change in the concentration of A-agents for MR. Nevertheless, the system evolves and the final state is more ordered (segregated) than the initial one, which is visible in Fig. 4. However, changes in the system are much more visible if we consider UR or ULR. In both cases the concentration of A-agents, cA, changes in time (see Fig. 3) and segregation is much stronger (see Fig. 4). Interestingly, the stationary value of cA varies considerably for each trial – we show three different sample trajectories for both rules (UR and ULR) in Fig. 3. This phenomenon is also clearly seen in Fig. 5, where the standard deviation of the stationary concentration is shown.
One more difference between the MR and the other two rules can be seen in Fig. 4. In spite of a considerably lower level of segregation for the MR rule, we can also observe periodic structures. Such a periodic structure looks like a chessboard and changes periodically in time (A↔B), see the panel for p = 0.7 and r = 1 in the first row of Fig. 4. This means that for MR (and for UR in some cases, which will be seen later) the stationary state is one of two types:
- A fixed point (blocked configuration) in which no further change is possible. According to Wolfram (1984) this corresponds to the first universality class of CA.
- A periodic structure in which agents cannot move but some of them periodically change the state (chessboard structures). According to Wolfram (1984) this corresponds to the second universality class of CA.
Figs. 3 and 4 suggest that generally the UR and URL rules lead to a more homogenous state, much closer to the consensus than the MR rule. We can observe this phenomenon more qualitatively looking at the average value of the concentration in the final state:
| $$\langle c_{st} \rangle = \frac{1}{M} \sum_{j=1}^M c_{st}^j$$ | (1) |
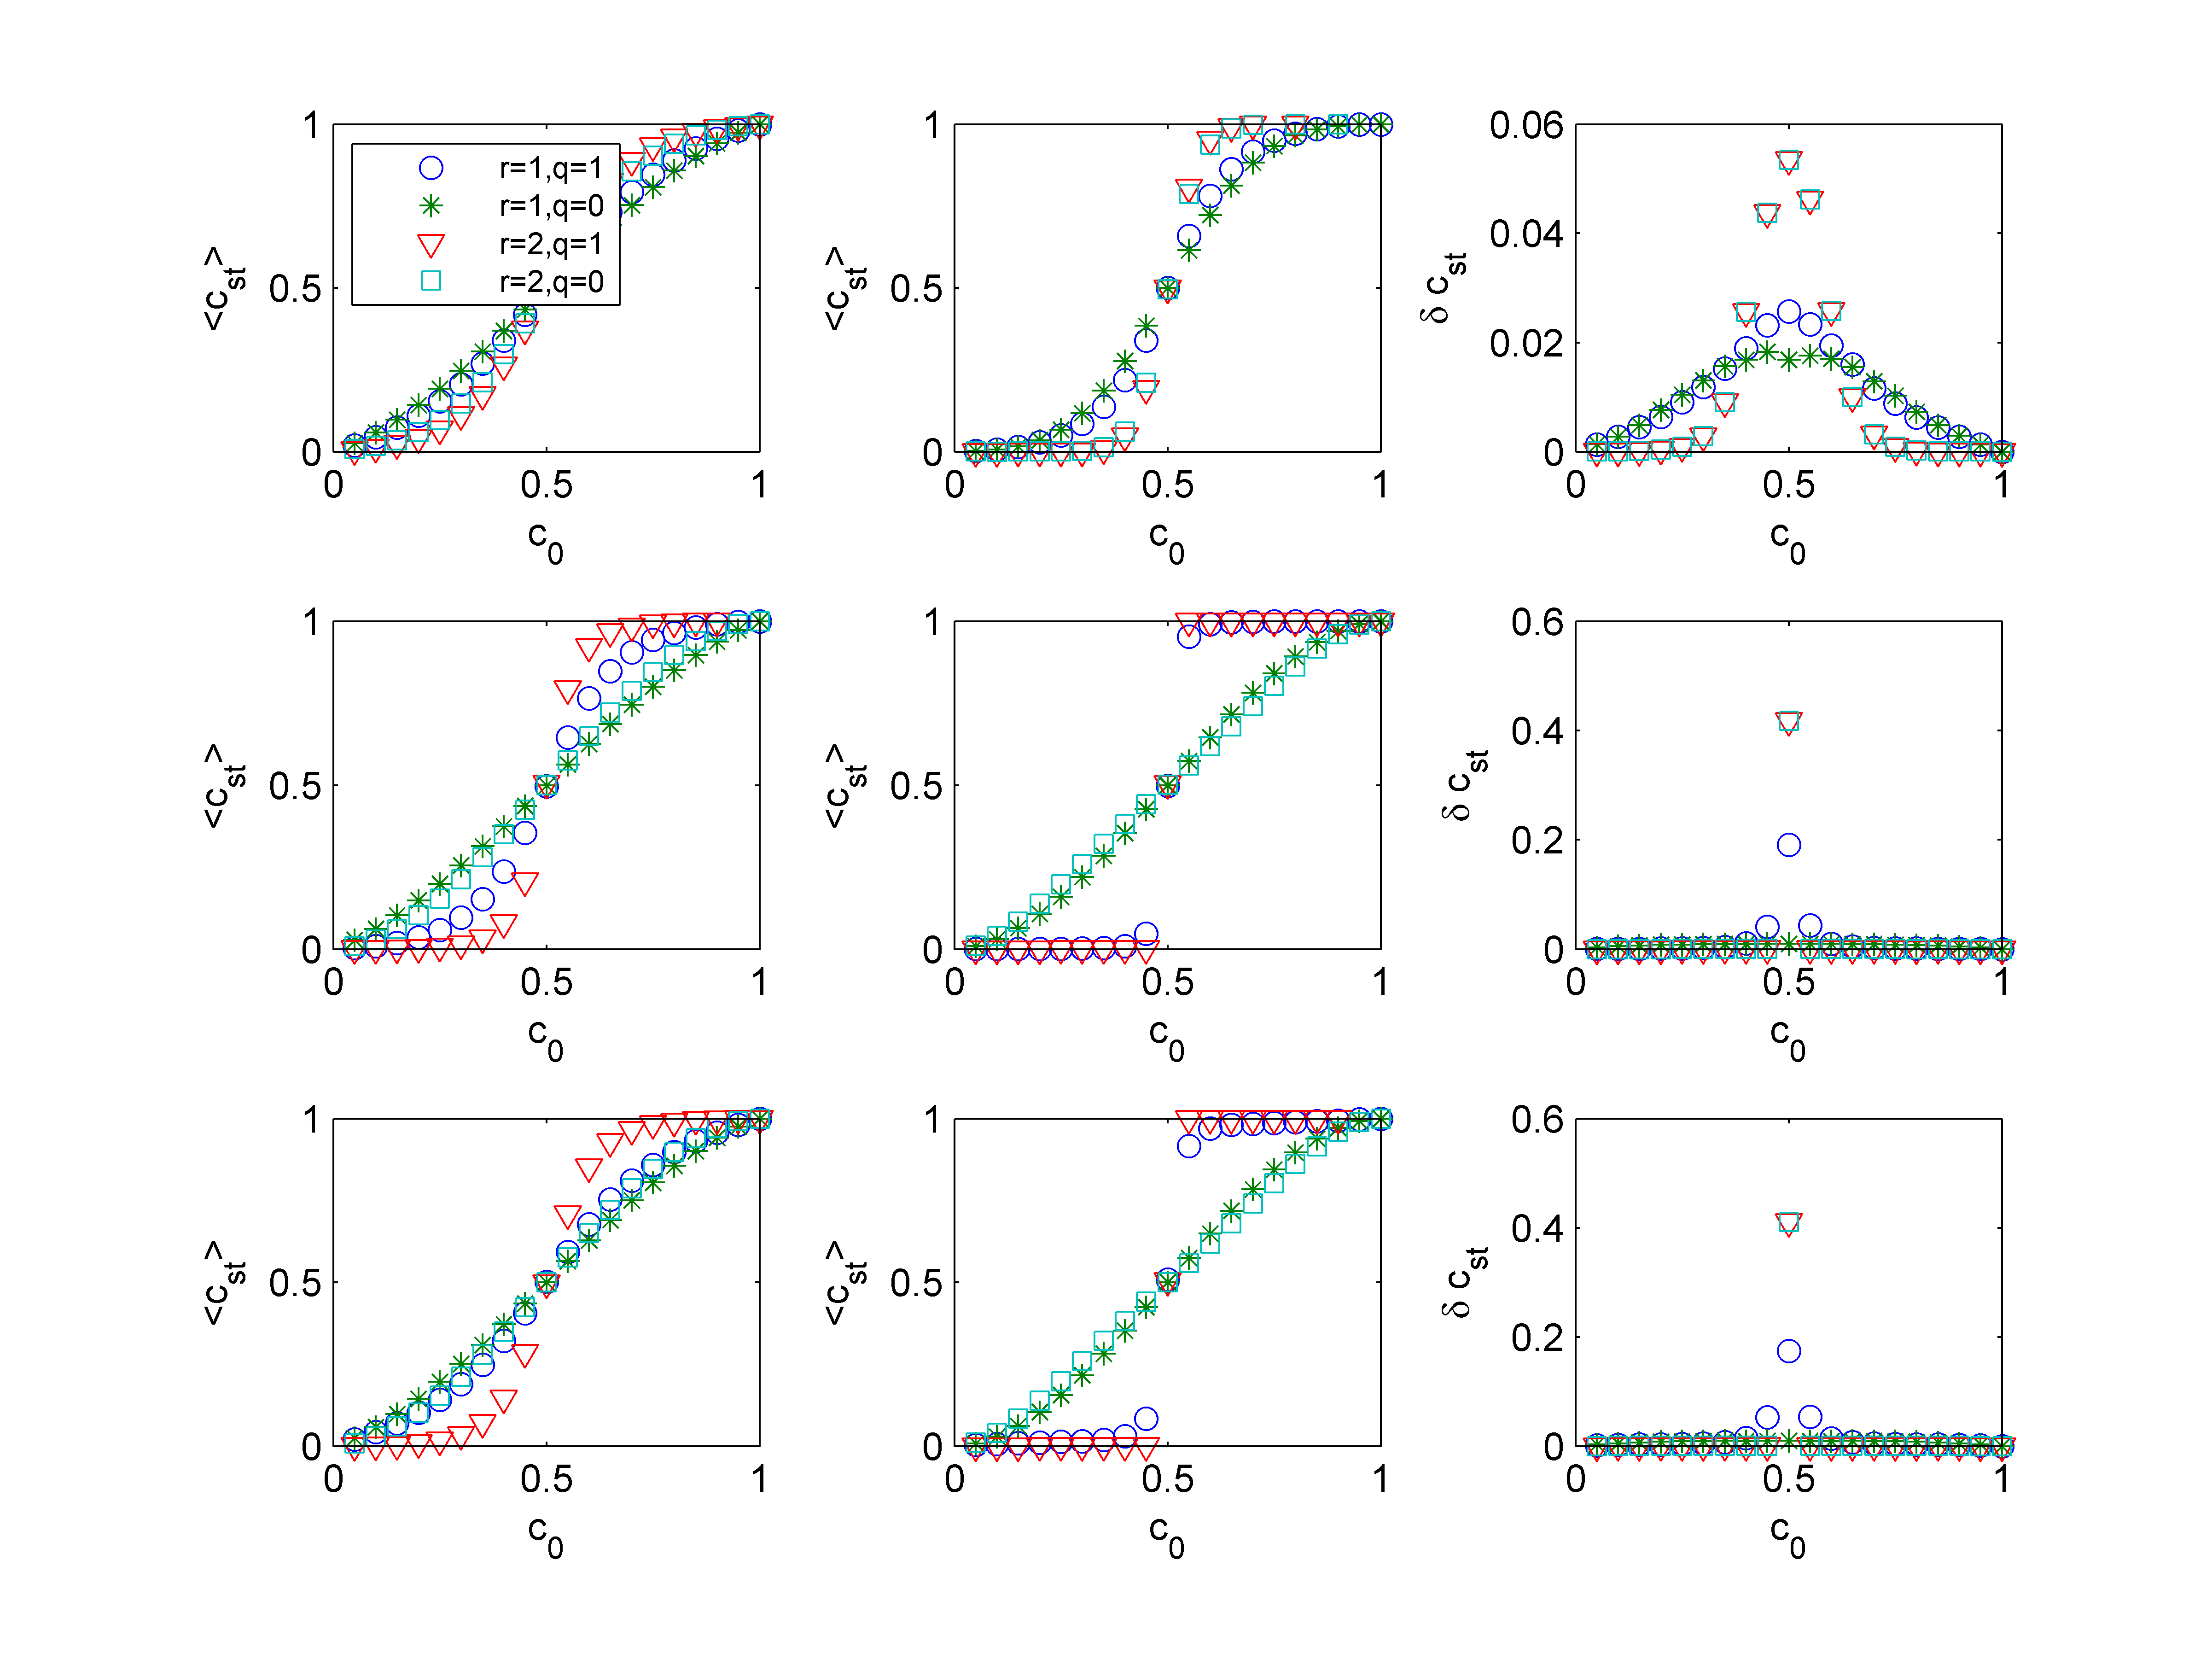
In Fig. 5 the average value of the stationary concentration, <cst>, as a function of the initial concentration, c0, is presented. First of all, it is seen that the MR rule gives significantly different results than the UR and ULR rules. On the other hand, the UR rule gives almost identical results as the MR variant. Fig. 5 shows that for the MR rule the range of the neighborhood, r, influences results more than the probability of movement, q, whereas for the ULR and UR rules the probability of movement changes results significantly. For the MR rule the results for r = 1 almost overlap regardless of q and the same is observed for larger values of r. On the other hand, for the ULR and UR rules the results depend much more on q – for density p= 0.7 (middle column in Fig. 5) the results for the same value of q overlap regardless of r. It is also seen that for p=0.7 and Cso ≠ 0.5 the system is almost fully ordered. Because cA can be interpreted as market share, the obtained results mean that even a small predominance of one company over another leads to the victory of the dominating company for the ULR and UR rules. For the MR rule the dependence between the final and the initial value of the market shares is much less steep. Summarizing, we see from Fig 5 that:
- For the MR rule the level of consensus increases with the size of the neighborhood, r, which results in a steeper dependence between <cst> and co for r= 2 than for r= 1. On the other hand, the probability of movement q influences results much weaker, at least if we only look at the average concentration of A-agents.
- The movement is much more significant for UR and ULR than for MR - the level of consensus increases with the probability of movement, q, which results in a significantly steeper dependence between <cst> and c0 for q=1 than for q = 0.
- The density, p, of occupied cells influences results much more for UR and ULR than for MR.
The above results can be understood heuristically. The unanimous majority is much less probable than the absolute majority and thus the uncertainty is much more probable for UR and ULR than for MR. This means that for the probability of movement q > 0 agents will often move and the system will evolve much longer until an ordered system will be reached. Until at least one A-agent will be a neighbor of a B-agent, the system will evolve and eventually a complete separation of A and B will be reached (see also Fig. 3). On the other hand, for q = 0, i.e. without movement, the system will be blocked almost immediately because it is almost impossible to find a unanimous majority for a random system (at early stages of evolution). These results remind of the famous (Schelling 1971) model of spatial segregation. However, the rules of our model are very different - in our case an agent is unhappy in case of uncertainty and it can adopt the state of the neighborhood in case of a certain opinion. Following the above reasoning we also expect that for the ULR and UR rules the relaxation time to the final fixed state will be much shorter for q = 0 than for q = 1. Moreover, for q = 1 the relaxation should be longer for ULR and UR than for MR.
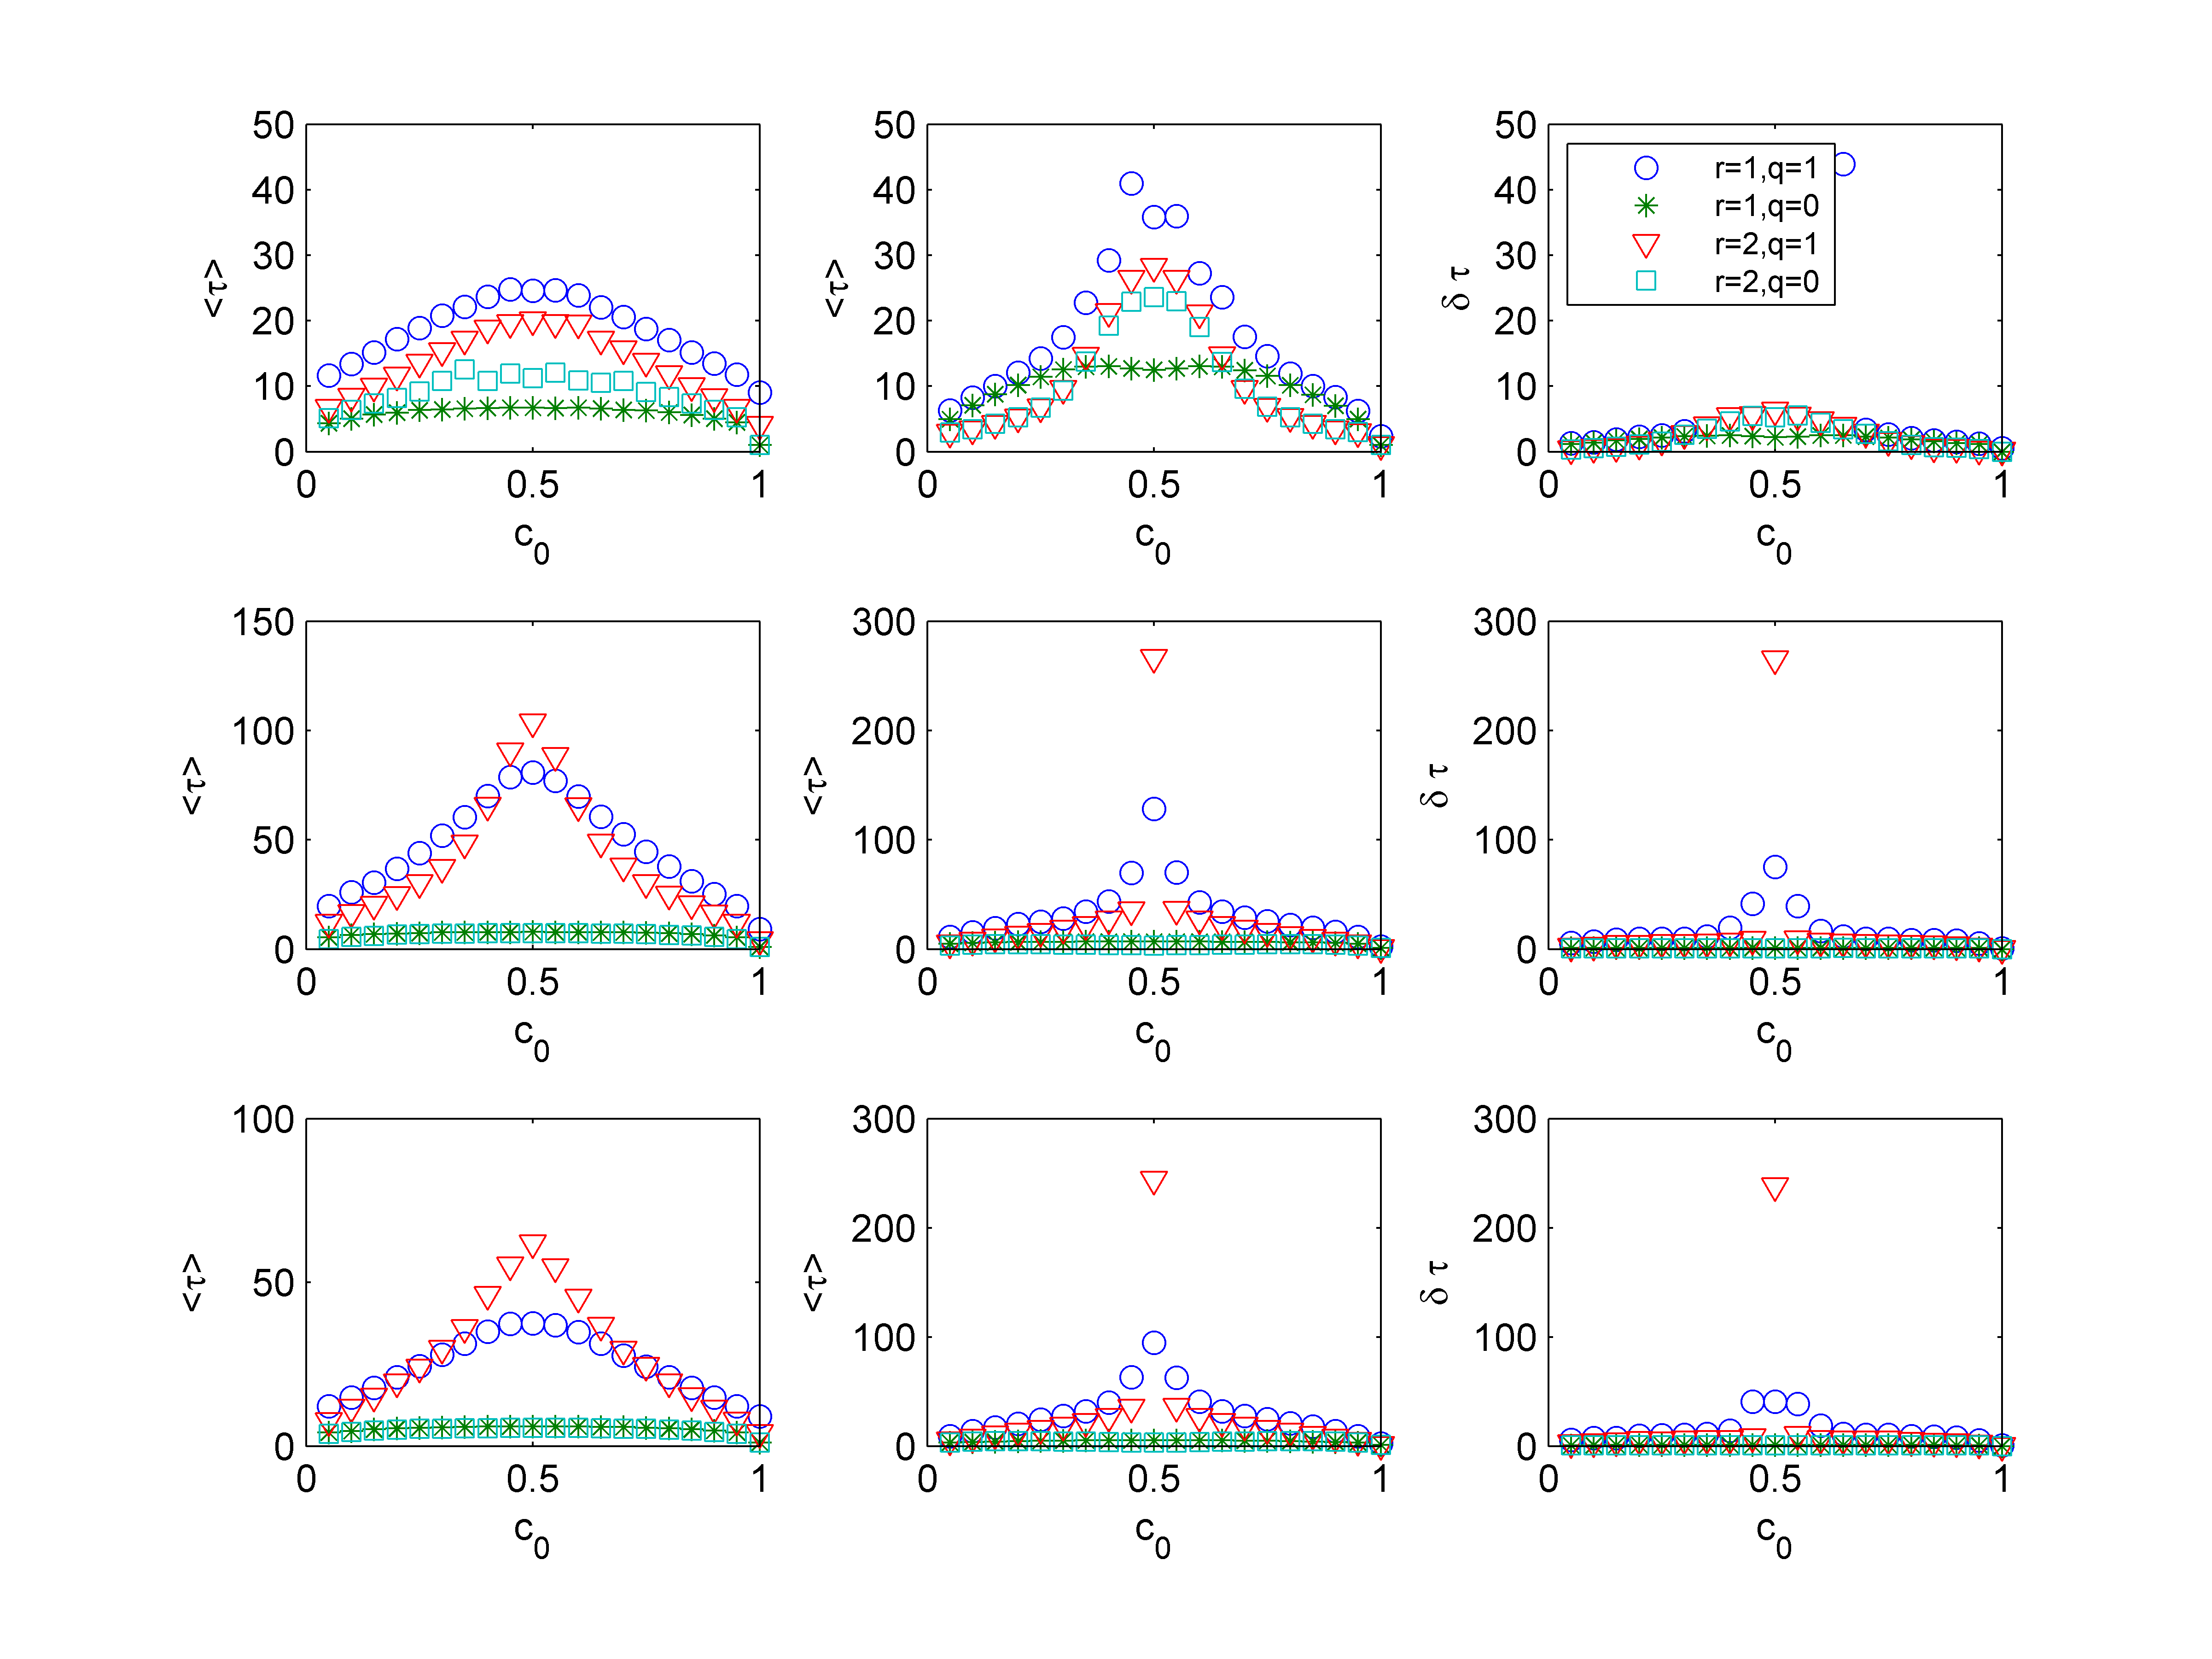
To check our predictions we measure the mean relaxation time defined as:
| $$\langle \tau \rangle = \frac{1}{M} \sum_{j=1}^M \tau^j$$ | (2) |
- The size of the neighborhood, r, plays a significant role for MR, but not for ULR and UR.
- The probability of movement, q, is much more important for ULR and UR than for MR.
- Results for ULR and UR are almost indistinguishable.
To complete our findings, we decided to measure the total number of homogenous (NAA + NBB) and heterogeneous (NAB + NBA) neighboring pairs (see Fig. 7). We see again, that the results for MR are significantly different than for ULR and UR. However, for the first time we also see some differences between the ULR and UR rules. For a low density of occupied cells p = 0.3 (left column) and r=1,q = 1 the results for ULR and UR are different – the segregation is stronger for ULR than for UR. Moreover, the dependence between the total number of homogenous (NAA + NBB) pairs and c0 is very different – it is concave for ULR (i.e. there is a maximum for c0 = 0.5) and convex for UR (i.e. there is a minimum for c0 = 0.5).
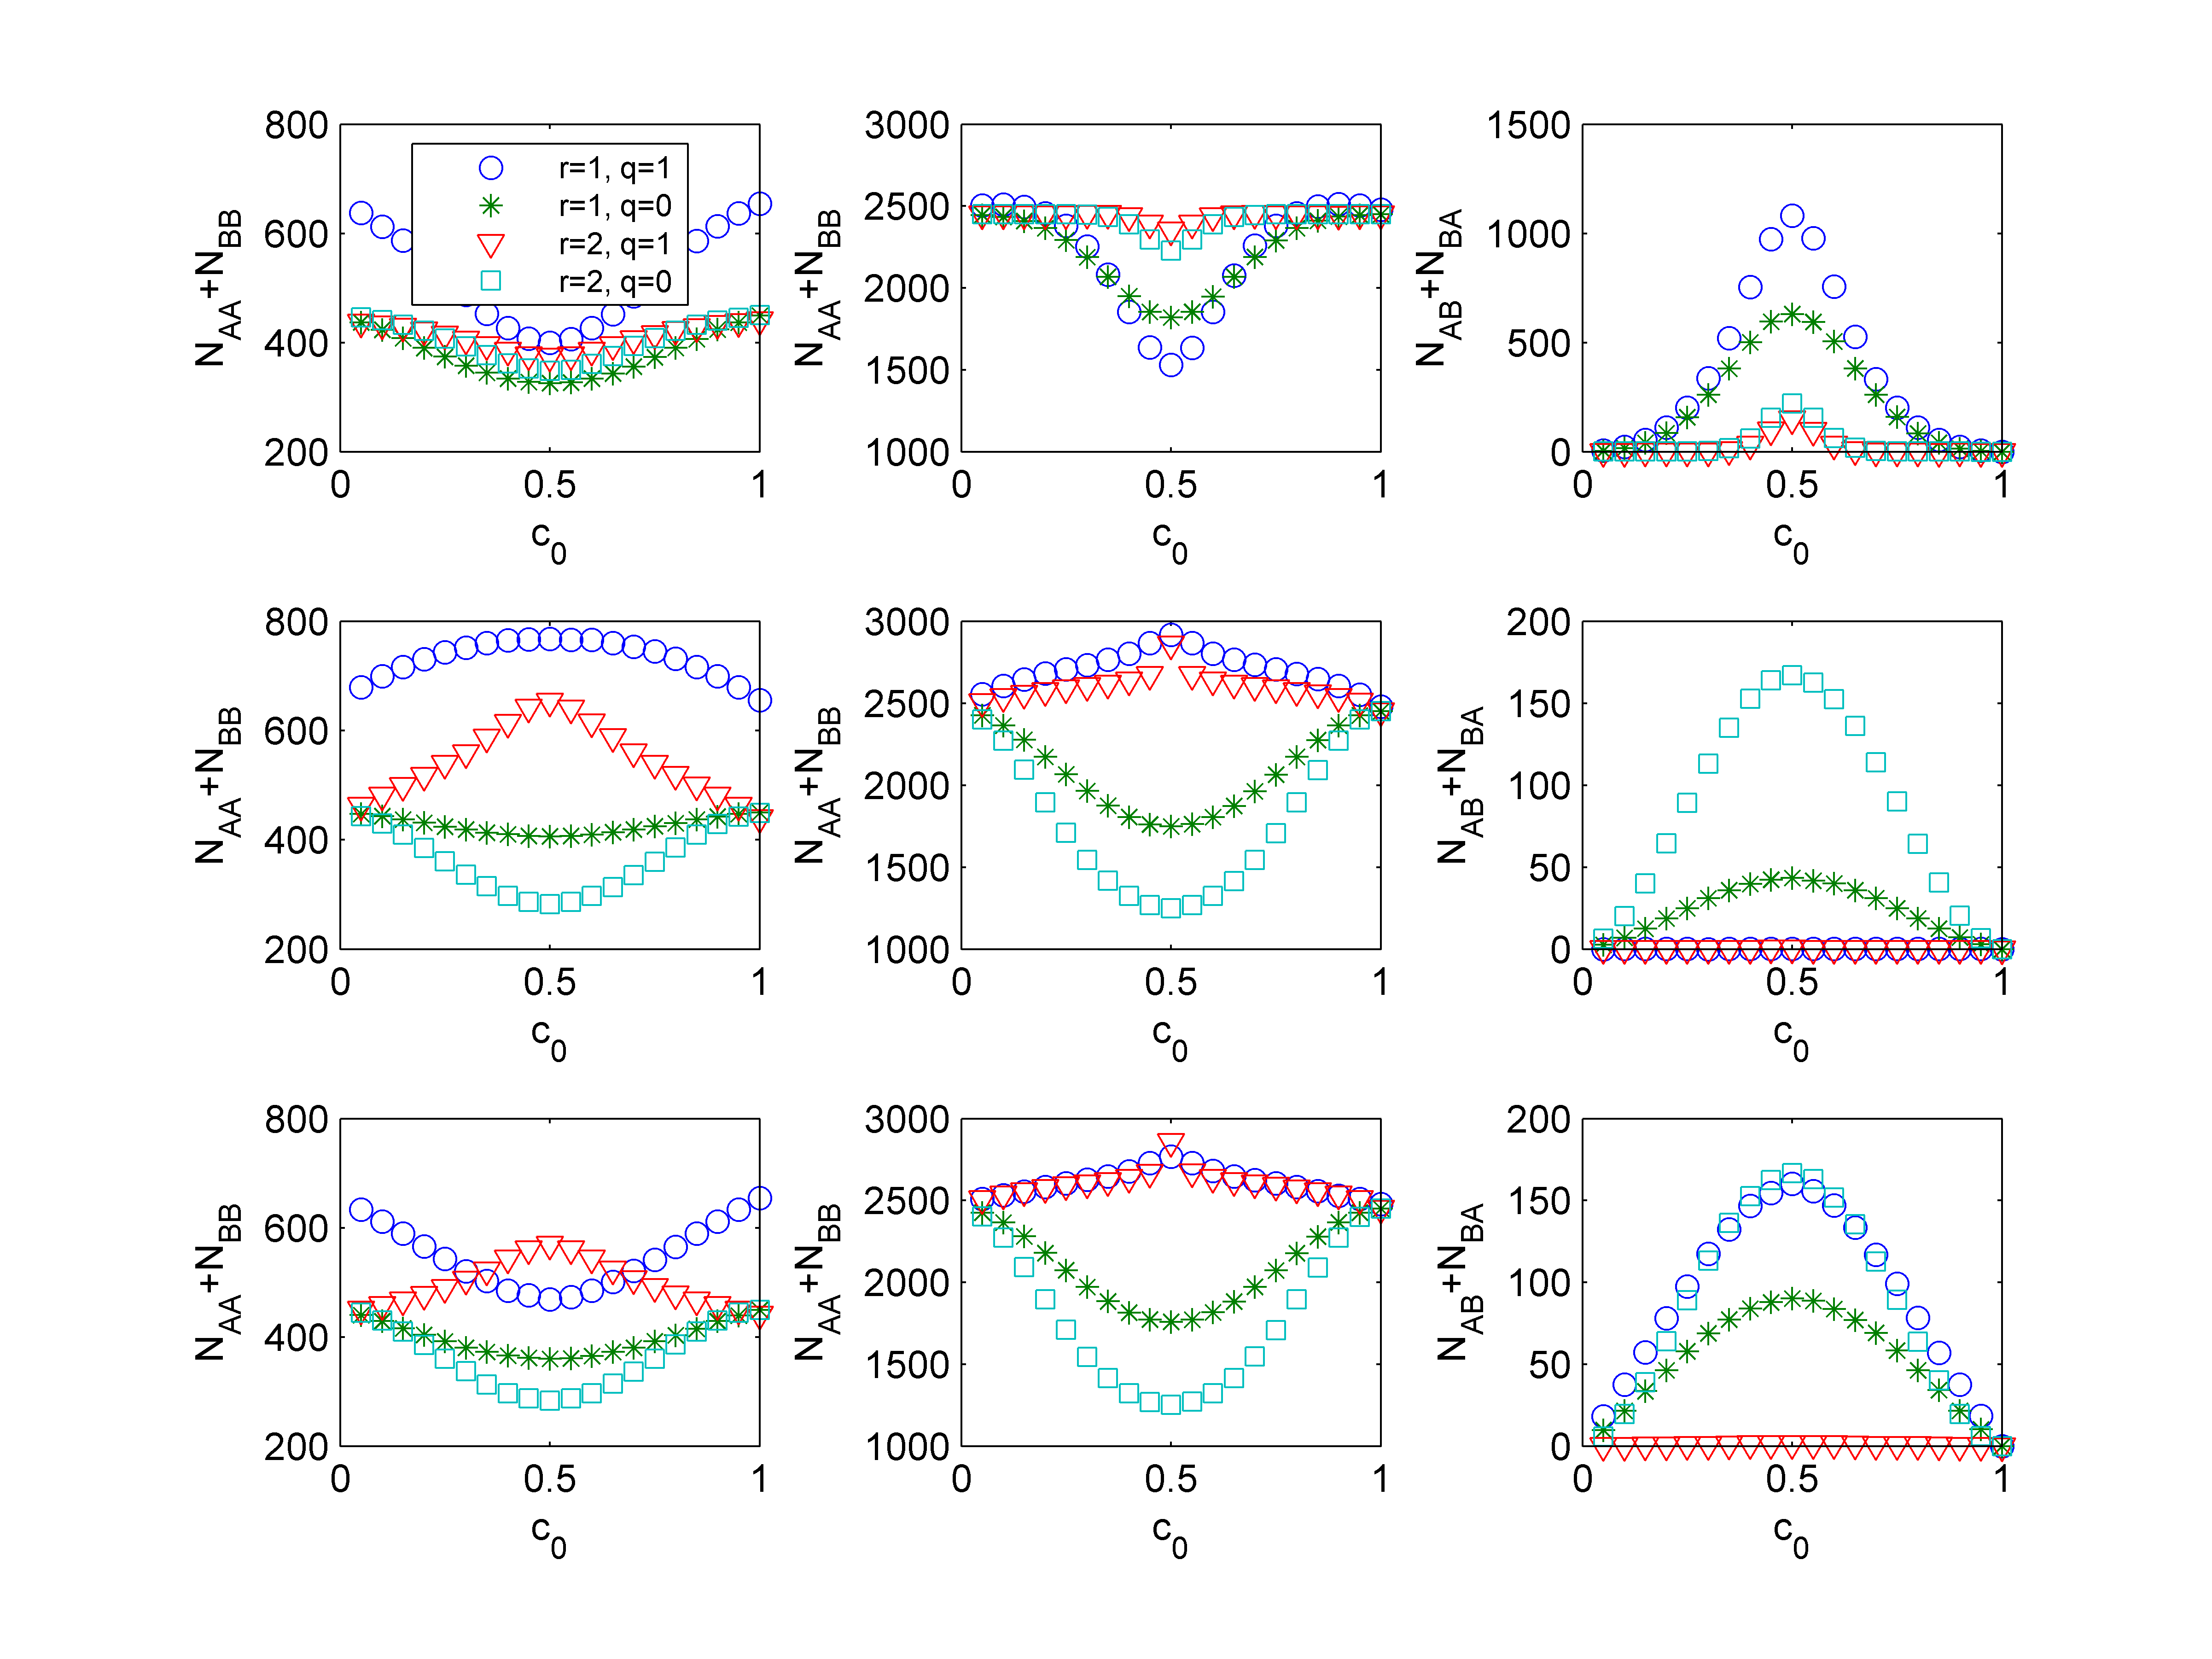
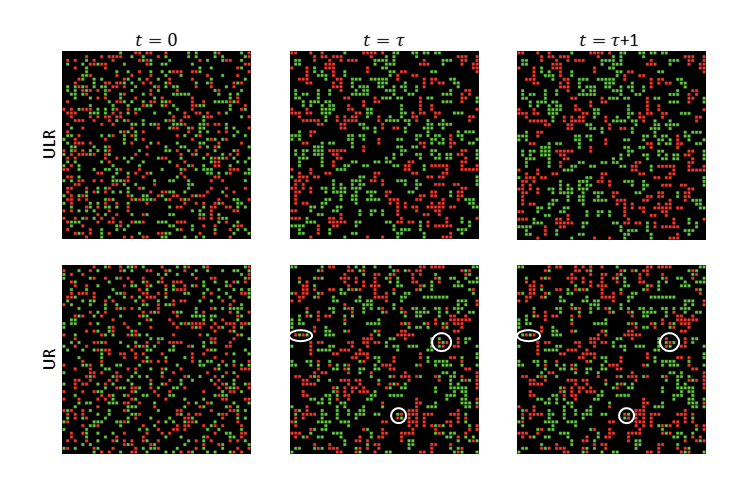
To understand this difference between the UR and ULR rules let us present again several screenshots for c0 = 0.5, r = 1, q = 1 and p = 0.3 (see Fig. 8). Under ULR the system reaches, after relaxation time t=τ, a fixed point and therefore the configuration at time t = τ is exactly the same as at time t = τ + 1. On the other hand, for UR the limit cycle is reached, which is visible if we focus on regions of the system in which red agents are neighbors of green agents – three samples are marked by white loops in Fig. 8. In such regions red agents change into green and vice-versa. Therefore the level of segregation for the UR rule is lower in this case. Such constantly changing agents could be interpreted as consumers without an opinion. Let us take as an example the legendary Cola Wars, i.e. the competition between Coca-Cola and Pepsi (Muniz and Hamer 2001), or the Apple vs. Samsung battle (Cusumano 2013). Those agents who are fixed in the stationary state are loyal customers of one of two brands. On the other hand, those who are changing constantly are disloyal, i.e. they do not prefer one company over another and buy a product that is available or cheaper. The number of disloyal customers is described by the number of heterogeneous pairs in the stationary state (see the right column in Fig. 7) and is the highest for MR, which can be also anticipated from Fig. 4.
Conclusions
We have investigated a general CA model to answer the question if differences on the microscopic scale between the Majority Rule (MR), the Unanimity Rule (UR) and the Unanimity Latane Rule (ULR) manifest on the macroscopic level. As we have shown, the differences between UR and ULR are almost negligible, when we look at the aggregate quantities such as market share CA or relaxation time τ. However, if we look at the market structure (microscopic configuration) we see that for the UR rule more scenarios are possible than for the ULR rule, which makes it more suitable for social applications. Overall, for UR and MR (but not for ULR) three types of stationary market structures are possible:
- All agents are consumers of a single brand that conquers the market. This corresponds to the monopolistic market structure (fixed state; all agents are red or green).
- There are consumers of both companies and they are all loyal (fixed state; there are clusters of red and green agents).
- There are loyal consumers of both brands and consumers which permanently change preferences (limit cycle; there are fixed clusters of red and green agents and chessboard-like structures, which change periodically).
The 3rd possibility is not only very interesting but also realistic. Even the legendary Apple customer loyalty is not 100%, though it actually is surprisingly high - over 90% (Pinson and Brosdahl 2014). In general, the customer loyalty is a complex construct and reasons for loyalty are highly not obvious (Jahanshahi et al. 2011). Moreover, explaining and modeling loyalty goes beyond the scope of this paper. However, one should be aware that loyalty to any brand in the duopoly market is never 100% and therefore models which allow to describe also non-loyal behavior are of particular interest. For this reason, the MR and UR rule are more suitable to model social systems than the ULR rule.
One could ask now which of remaining two rules - MR or UR - is more appropriate. The answer depends on the particular case that is studied because marketing research shows that many factors influence a consumer’s behavior (Kotler and Keller 2012). Let us first comment what comes out from our results. Within our approach, generally a higher level of segregation and simultaneously a lower number of disloyal customers is observed for the unanimity rule than for the majority rule. This could suggest that for products (or more generally - behaviors) in which stronger segregation and higher loyalty is observed, a unanimous majority is needed to change an individual’s state. Choosing one of the two rules (MR or UR) may also be based on the level of involvement. Some consumers may be able to make quick purchase decisions and other consumers may need to get information and be more involved in the decision process before making a purchase. The level of involvement in buying decisions may be considered a continuum from decisions that are fairly routine and simple to decisions that require a high level of involvement (Tanner and Raymond 2012). Consumers often engage in routine response behavior when they make low-involvement decisions, they make automatic purchase decisions based on limited information. However, low-involvement decisions are typical for products that are relatively inexpensive and pose a low risk to the buyer. By contrast, high-involvement decisions carry a higher risk to the buyer if he or she makes a mistake by purchasing them. They are complex and associated with high price tags, i.e. buying a car, a house, an insurance policy (Tanner and Raymond 2012). Moreover, when a consumer engages in an involving buying process, his or her behaviors are typically different than when they are in a less involving situation. Summarizing, it seems that the majority rule can be applied in simulations to study low-involvement buying decisions, i.e. when there is no emotional involvement (no loyalty) or the products are usually inexpensive and/or pose a low risk to the buyer. The unanimity rule should be used in case of high-involvement buying decisions.
Our findings are also interesting from a more general perspective, because when groups are faced with making a choice, unanimity and majority are two of the more popular decision rules (Marsden and Mathiyalakan 2003). Thompson and Raymond (1988) noted that the majority rule is less time consuming, is subject to less compromise and there is less decision commitment. Whereas the use of the unanimity rule results in greater commitment and satisfaction. Furthermore, the results in Marsden and Mathiyalakan (2003) show that the use of the majority and the unanimity rules give different outcomes. This agrees surprisingly well with our findings, if we reinterpret our model in a more general setting in which states A and B describe an opinion or a decision on a given subject.
Let us conclude this article by pointing out several interesting directions for the future research. In the study of word of mouth marketing, it seems interesting to test the impact of strong and weak ties on consumer behavior. Although strong ties are perceived as more influential in consumers' decisions, weak ties are more likely than strong ties to facilitate w-o-m communication (Duhan et al. 1997). Therefore, further work may be conducted with the introduction of social distance to the model as in (Fernández-Márquez and Vázquez 2014). An important area of future research is also to consider opinion leaders, because they strongly influence the consumer's buying decisions through a word-of-mouth communication, specifically in high involvement purchases (Sarathy and Patro 2013). Another interesting issue would be to include an external field (advertisement, mass media) and heterogeneity related to the consumer’s satisfaction. Because dissatisfied customers are more likely to consider and search for information on the products of competitors than satisfied ones, probability of movement q could be an individual trait describing an agent. An interesting question that appears here is if differences between MR and UR would be visible also in such an extended, more realistic model or if the differences would be hidden behind different types of heterogeneities. We leave these interesting questions for future research.
Acknowledgements
The work was supported by funds from the National Science Centre (NCN) through grants no. 2014/15/B/HS4/04433 (to AKS) and 2013/11/B/HS4/01061 (to KSW)References
ASCH, S. E. (1955) Opinions and social pressure. Scientific American, 193, 31-35. [doi:10.1038/scientificamerican1155-31]
BECKER, G. S. (1991). A note on restaurant pricing and other examples of social influences on price. Journal of Political Economy, 99, 1109–1116. [doi:10.1086/261791]
BIANCHI, F. and Squazzoni, F. (2015) Agent-based models in sociology. WIREs Computational Statistics, 7, 284–306. [doi:10.1002/wics.1356]
BOND, R. (2005) Group size and conformity. Group Processes & Intergroup Relations, 8, 331-354. [doi:10.1177/1368430205056464]
BOUZDINE-CHAMEEVA, T. and Galam, S. (2011) Word-of-mouth versus experts and reputation in the individual dynamics of wine purchasing. Advances in Complex Systems, 14, 871-885. [doi:10.1142/S0219525911003475]
BRASS, D. J. (1984) Being in the right place - A structural analysis of individual influence in an organization. Administrative Science Quarterly, 29, 518-539. [doi:10.2307/2392937]
BROWN,J. J. and Reingen, P. H. (1987) Social Ties and Word-of-Mouth Referral Behavior. Journal of Consumer Research, 14, 350-362. [doi:10.1086/209118]
BURNKRANT, R. E. and Cousineau, A. (1975) Informational and normative social influence in buyer behavior. Journal of Consumer Research, 2, 206–216. [doi:10.1086/208633]
CAMPBELL, A. (2013) Word of mouth and percolation in social networks. American Economic Review, 103, 2466–2498. [doi:10.1257/aer.103.6.2466]
CAMPBELL-MEIKLEJOHN, D. K., Bach, D. R., Roepstor, A., Dolan, R. J. and Frith, C. D. (2010) How the Opinion of Others Affects Our Valuation of Objects. Current Biology, 20, 1165-1170. [doi:10.1016/j.cub.2010.04.055]
CUSUMANO, M. A. (2013) The Apple-Samsung lawsuits. Communications of the ACM, 56 (1), 28-31. [doi:10.1145/2398356.2398366]
CASTELLANO, C., Munoz, M. A. and Pastor-Satorras, R. (2009) Nonlinear q-voter model. Physical Review E, 80, 041129. [doi:10.1103/PhysRevE.80.041129]
CHEVALIER, J. A. and Mayzlin, D. (2006) The Effect of Word of Mouth on Sales: Online Book Reviews. Journal of Marketing Research, XLIII (August), 345-354. [doi:10.1509/jmkr.43.3.345]
CLEMONS, E. K., Gao, G. and Hitt, L. M. (2006) When Online Reviews Meet Hyper differentiation: A Case Study of the Craft Beer Industry. Journal of Management Information Systems, 23(2), 149-171. [doi:10.2753/MIS0742-1222230207]
DUHAN, D. F., Johnson S. D., Wilcox J. B. and Harrel G. D. (1997) Influences on Consumer Use of Word-of-Mouth Recommendation Sources. Journal of the Academy of Marketing Science, 25(4), 283-295. [doi:10.1177/0092070397254001]
FERNÁNDEZ-MÁRQUEZ, C. M. and Vázquez, F. J. (2014) A Simple Emulation-Based Computational Model. Journal of Artificial Societies and Social Simulation, 17(2) 8: https://www.jasss.org/17/2/8.html. [doi:10.18564/jasss.2449]
GILBERT, N., Jager, W., Deffuant, G. and Adjali, I. (2007) Complexities in markets: Introduction to the special issue. Journal of Business Research, 60, 813-815. [doi:10.1016/j.jbusres.2007.01.016]
GOLDENBERG, J., Libai, B. and Muller, E. (2010) The chilling effects of network externalities. International Journal of Research in Marketing, 27, 415. [doi:10.1016/j.ijresmar.2009.06.006]
GOLDENBERG, J., Libai, B. and Muller, E. (2001a) Using Complex Systems Analysis to Advance Marketing Theory Development: Modeling Heterogeneity Effects on New Product Growth through Stochastic Cellular Automata. Academy of Marketing Science Review, 9.
GOLDENBERG, J., Libai, B. and Muller, E. (2001b) Talk of the Network: A Complex Systems Look at the Underlying Process of Word-of-Mouth. Marketing Letters, 12 (30), 211–223. [doi:10.1023/A:1011122126881]
GOLDENBERG, J. and Efroni, S. (2001) Using Cellular Automata Modeling of the Emergence of Innovation. Technological Forecasting and Social Change, 68(3), 293-308. [doi:10.1016/S0040-1625(00)00095-0]
GOLDSMITH, R. E. and Horowitz, D. (2006) Measuring motivations for online opinion seeking. Journal of Interactive Advertising, 6 (2), 1-16. [doi:10.1080/15252019.2006.10722114]
GRANOVETTER, M. S. (1978) Threshold Models of Collective Behavior. American Journal of Sociology, 83, 1420-1443. [doi:10.1086/226707]
GRANOVETTER, M. S. and Soong, R. (1986) Threshold Models Of Interpersonal Effects In Consumer Demand. Journal of Economic Behavior and Organization, 7, 83-99. [doi:10.1016/0167-2681(86)90023-5]
GRAY, L. (2003) A Mathematician Looks at Wolfram's New Kind of Science. Notices of the American Mathematical Society, 50, 200-211.
HENNIG-THURAU, T. and Walsh, G. (2004) Electronic word-of-mouth: motives for and consequences of reading consumer articulations on the Internet. International Journal of Electronic Commerce, 8 (2), 51-74.
HUANG, J. and Chen, Y. (2006). Herding in Online Product Choice. Psychology & Marketing, 23(5), 413–428. [doi:10.1002/mar.20119]
JAHANSHAHI, A. A., Gashti, M. A. H., Mirdamadi, S. A., Nawaser, K. and Khaksar S. M. S. (2011) Study the Effects of Customer Service and Product Quality on Customer Satisfaction and Loyalty. International Journal of Humanities and Social Science, 1, 253-260.
KAISER, F.G. and Byrka, K. (2015) The Campbell paradigm as a conceptual alternative to the expectation of hypocrisy in contemporary attitude research. The Journal of Social Psychology, 155, 12–29. [doi:10.1080/00224545.2014.959884]
KOTLER, P.T. and Keller, K.L. (2012) Marketing management, 14th edition. Prentice Hall, Upper Saddle River, NJ.
KOWALSKA-STYCZEŃ, A. and Sznajd-Weron, K. (2012) Access to information in word of mouth marketing within a cellular automata model. Advances in Complex Systems, 15, 1250080. [doi:10.1142/S0219525912500804]
LATANE, B. (1981) The psychology of social impact. American Psychologist, 36, 343-356. [doi:10.1037/0003-066X.36.4.343]
LIU, Y. (2006) Word-of-Mouth for Movies: Its Dynamics and Impact on Box Office Revenue. Journal of Marketing, 70 (3), 74-89. [doi:10.1509/jmkg.70.3.74]
MA, F. and Chao, G. (2011) Research on Communication Products Diffusion in China Using Cellular Automata. International Business Research, 4(2), 147-152. [doi:10.5539/ibr.v4n2p147]
MACIEJOWSKA, K., Jędrzejewski, A., Kowalska-Pyzalska, A. and Weron, R. (2016) Impact of social interactions on demand curves for innovative products. Acta Physica Polonica A, 129, 5, 1045-1049: http://przyrbwn.icm.edu.pl/APP/PDF/129/a129z5p27.pdf. [doi:10.12693/APhysPolA.129.1045]
MACY, M. W. and Willer, R. (2002) From Factors to Actors: Computational Sociology and Agent-Based Modeling. Annual Review of Sociology, 28, 143-166. [doi:10.1146/annurev.soc.28.110601.141117]
MAHAYAN, V., Muller, E. and Kerin, R. A. (1984) Introduction strategy for new products with positive and negative word-of mouth. Management Science, 30(12), 1389. [doi:10.1287/mnsc.30.12.1389]
MARSDEN, J.R. and Mathiyalakan, S. (2003) An investigation of changes in attitude over time of GDSS groups under unanimity and majority decision rules. European Journal of Operational Research, 145, 693–712. [doi:10.1016/S0377-2217(02)00224-2]
MOLDOVAN, S. and Goldenberg, J. (2004) Cellular automata modeling of resistance to innovations: Effects and solutions. Technological Forecasting and Social Change, 71, 425-442. [doi:10.1016/S0040-1625(03)00026-X]
MOSCOVICI, S., Lage, E. and Naffrechoux, M. (1969) Influence of a Consistent Minority on the Responses of a Majority in a Color Perception Task. Sociometry, 32(4), 365-380. [doi:10.2307/2786541]
MUNIZ, Jr. A. M. and Hamer L. O. (2001) Us Versus Them: Oppositional Brand Loyalty and the Cola Wars, in NA - Advances in Consumer Research Volume 28, eds. Mary C. Gilly and Joan Meyers-Levy, Valdosta, GA : Association for Consumer Research, Pages: 355-361.
MYERS, D. G. (2013) Social Psychology (11th Ed.). Free Press, New York.
NOLAN, J. M., Schult, P. W., Cialdini, R. B., Goldstein, N. J. and Griskevicius, V. (2008) Normative social influence is underdetected. Personality and Social Psychology Bulletin, 34, 913. [doi:10.1177/0146167208316691]
NYCZKA, P. and Sznajd-Weron, K. (2013) Anticonformity or Independence? Insights from Statistical Physics. Journal of Statistical Physics, 151, 174-202. [doi:10.1007/s10955-013-0701-4]
PERES, R., Mulle,r E. and Mahajan, V. (2010) Innovation diffusion and new product growth models: A critical review and research directions. International Journal of Research in Marketing, 27, 91–106. [doi:10.1016/j.ijresmar.2009.12.012]
PINCUS, S. and Waters, L.K. (1977) Information social influence and product quality judgments. Journal of Applied Psychology, 62, 615–619. [doi:10.1037/0021-9010.62.5.615]
PINSON, C. and Brosdahl, D. J. C. (2014) The Church of Mac: Exploratory examination on the loyalty of Apple customers. Journal of Management & Marketing Research, 14, 1-15.
RAND, W. and Rust, R. T. (2011) Agent-based modeling in marketing: Guidelines for rigor. International Journal of Research in Marketing , 28, 181–193. [doi:10.1016/j.ijresmar.2011.04.002]
SARATHY, P. S. and Patro, S. K. (2013) The role of opinion leaders in high-involvement purchases: an empirical investigation. South Asian Journal of Management, 20 (2), 127-145.
SCHELLING, T.C. (1971) Dynamic models of segregation. Journal of Mathematical Sociology, 1, 143–186. [doi:10.1080/0022250X.1971.9989794]
SINGH, P., Sreenivasan, S., Szymanski, B. K. and Korniss, G. (2013) Threshold-limited spreading in social networks with multiple initiators. Scientific Reports, 3, 23-30. [doi:10.1038/srep02330]
SQUAZZONI, F. (2008) The Micro-Macro Link in Social Simulation. Sociologica, 2(1), 1-27.
SQUAZZONI, F. (2010) The impact of agent-based models in the social sciences after 15 years of incursions. History of Economic Ideas, 18 (2), 197-240.
SQUAZZONI, F. (2012) Agent-Based Computational Sociology, Wiley & Sons, Hoboken. [doi:10.1002/9781119954200]
STEFFES, E. M. and Burgee, L. E. (2009) Social ties and online word of mouth. Internet Research, 19, 42-59. [doi:10.1108/10662240910927812]
TANNER, J. and Raymond, M. A. (2012) Marketing Principles: http://2012books.lardbucket.org/books/marketing-principles-v2.0/index.html.
TERAJI, S. (2003) Herd behavior and the quality of opinions. Journal of Socio-Economics, 32, 661–673. [doi:10.1016/j.socec.2003.10.004]
THOMPSON, L.L., Mannix, E.A. and Bazerman, M.H. (1988) Group negotiation: Effects of decision rule, agenda, and aspiration. Journal of Personality and Social Psychology, 54 (1), 86–95. [doi:10.1037/0022-3514.54.1.86]
WATTS, D. J. and Dodds, P. S. (2007) Influentials, Networks, and Public Opinion Formation. Journal of Consumer Research, 34, 441-458. [doi:10.1086/518527]
WEI, Y., Ying, S., Fan, Y. and Wang, B. (2003) The cellular automaton model of investment behavior in the stock market. Physica A, 325, 507-516. [doi:10.1016/S0378-4371(03)00144-4]
WOLFRAM, S. (1984) University and Complexity in Cellular Automata. Physica D, 10, 1-35. [doi:10.1016/0167-2789(84)90245-8]
ZIMBRES, R.A. and De Oliveira, P.B. (2009) Dynamics of Quality Perception in a Social Network: A Cellular Automaton Based Model in Aesthetics Services. Electronic Notes Theoretical Computer Science, 252, 157-180. [doi:10.1016/j.entcs.2009.09.020]