
| Errata: Equations 6, 8 and 11 of the html version of the article were reported incorrectly and have been re-edited from the original authors' submission. The academic affiliation of Peyman Shariatpanahi was reported incorrectly [Added by the editor on 4 November 2017]. |
| Errata: Equations 8c,d and 18 were reported incorrectly and have been re-edited from the original authors' submission (\(RT\) instead of \(RV\) in 8c,d and \(\frac{T_0}{2}\) instead of \(T_0\) in 18). An internal control proved that these imprecisions neither affected simulation results nor had substantive implications on arguments and findings [Added by the editor on 25 December 2017]. |
Introduction
Periodic health check-ups are critical in public health and provide an effective preventive measure that can mitigate chronic illnesses through early detection. With routine check-ups, early stages treatments can promote health and quality of life effectively; although, most people do not comply with such recommended check-ups. One obvious example is dental check-up.
Routine dental visits are critical for dental health promotion. Epidemiologic evidence shows that people who have regular dental visits have better oral health conditions than others (Catteau et al. 2012; Hawley et al. 1997; Montero et al. 2014; Sheiham et al. 1985). The effects of routine dental visit on reducing level of dental caries is well known (Vehkalahti et al. 1988). For example, a cohort study in New Zealand reported that people who do not maintain regular visits have three times higher levels of dental caries (Gilbert et al. 1997). It was demonstrated in a UK study that self-reported quality of life was considerably higher for people who regularly go for routine dental visits (Mc Grath et al. 2001). Positive effects of routine dental care have also been observed in health care behaviors such as tooth brushing (Casanova-Rosado et al. 2014) as well as in general health literacy (Wiener et al. 2014). Although proper frequency of routine dental visits can be different for different individuals and societies, on average, presumably six months period may be the optimal interval between two successive visits as advised by most dentists (Frame et al. 2000).
Since promoting routine dental visit is an important concern for health practitioners, understanding factors that promote such visits is crucial. Previous studies have shown that lack of compliance with routine dental visits may be rooted in economic reasons (Peltzer et al. 2014), stress and anxieties associated with visiting dentists (Sohn et al. 2005), oral health knowledge (Wiener et al. 2014) and perceived oral health status (Sohn et al. 2005). Although there is a rich literature investigating individual factors, no study has examined how these individual level factors can influence public behavior in aggregate.
Many examples exist on how individuals can influence each other’s health seeking behavior. Family members can have an impact. If parents start teaching their toddlers to brush their teeth in early ages, their other health-related preventative activities can influence their children’s long term healthy behavior and improve their routine habits. Similarly, friends and colleagues can influence healthy behaviors. Such social influences in aggregate can lead to counter-intuitive emerging behaviors, i.e., a characteristic of complex social systems.
A series of recent studies by Metcalf and colleagues showed that dental visits, in aggregate, can follow wild oscillatory patterns. Specifically, they showed that dental visit promotion programs in New York (the ElderSmile program) have been going through cyclic patterns of demand. They argued that the oscillatory high level aggregate patterns were complex behaviors and thus difficult to explain with linear regression models (Marshall et al. 2009; Metcalf et al. 2013). Figure 1 shows the observations from the ElderSmile preventive screening program in New York City by the Columbia University College of Dental Medicine during July-2006 to November-2008 (Metcalf et al. 2013). This program operated in North Manhattan (in which the elderly population have many friendship connections with their neighbors) and the trend of the participating population showed an oscillatory behavior with an average period of about 8 months. It should be noted that the pattern is not seasonal. Therefore, it was suggested that the pattern should be described by modeling the interactions among elders through their friendship network. This interaction somehow synchronizes the friends’ decision to go for the visit (Metcalf et al. 2013). It should also be mentioned that this oscillatory pattern potentially might have serious implications on resources for the screening program as well as other similar programs.

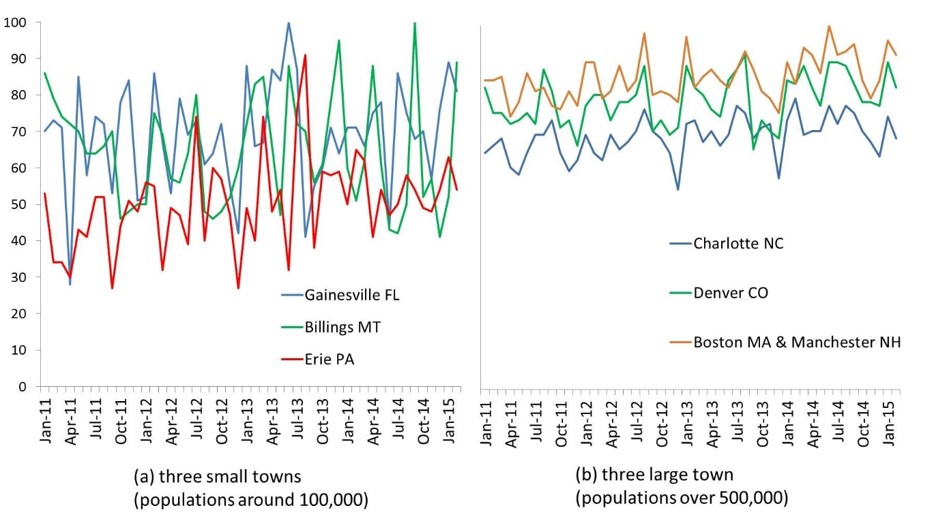
By analyzing the big data provided by Google Trends service, we find another evidence of potential complex and cyclic patterns in people’s attention to dental health. Google query trends for the word “dentist” in different US towns (Figure 2) show that public attention, especially in smaller towns, has been following oscillatory patterns. As Figure 2 demonstrates, in a sample of three small and three large US towns, public attention to dental care represented by their online behavior, follows a cyclic patterns. The highest attention (search) points for different towns happen in various months, showing the patterns are not limited to seasonal changes. The time period of these patterns are different between 4-7 months. In addition, the difference between oscillation amplitudes in small and large cities suggests that these patterns can be originated from a “Word Of Mouth” process in which people attract each other’s attention to oral health. The different patterns in the small and large cities can be regarded to the different social network properties. In small towns, the distance between people in the social network is smaller than those in large cities which helps a faster “Word Of Mouth” process in the society. Regarding the search for the “dentist” as a sign of public attention to dental visits, it also suggests that these oscillations may have the same source as the cyclic behaviors in the number of dental visits (like Figure 1).
Considering the importance of understanding collective dental care behaviors as a social phenomenon, we raise a question: can simple decision making rules at individual level result in oscillatory demand for routine visits? In order to answer this question, from a methodological perspective, by taking a dynamic modeling approach, we develop an agent-based model that aims to model individuals’ routine dental check-ups behavior. Our approach offers another example of how dynamic modeling can be used to study complex patterns especially in public health arena (Auchincloss et al. 2008; Brookmeyer et al. 2014; Day et al. 2013; Gorman et al. 2006; Laskowski et al. 2011; Leischow et al. 2006). The model proposes a “Word Of Mouth” process in which people promote each other to go for dental visit through social networks.
Based on a simulation model, this paper postulates that: 1) given simple rules about how individuals (agents) go to dentists and also interact through social networks, it is likely to observe oscillatory patterns in the societal level. 2) Such a cyclic pattern is a function of social network characteristics that connects patients to each other. Our theory does not aim at explaining all reasons for routine dental visits (or any other routine medical visits), and does not aim at rejecting any previously stated reason for how individuals seek healthcare. However, it provides a novel “endogenous” theory of demand for routine dental visits, a theory that focuses on social dynamics of a preventive healthy behavior. 3) Finally, focusing on the fraction of people involved in web based activities, we compare the model results to an empirical data from Google Trends. This comparison demonstrates the oscillatory pattern of public attentions to oral and dental health issues, as well as the importance of routine visits that, can be predicted by the proposed model. In addition it indicates that the model is able to successfully explain the population dependency of these patterns for different US towns (Figure 2).
Modeling
In order to reproduce the observed oscillatory pattern of dental visit demand, here an agent-based model is proposed. As previously mentioned in the introduction section, the cyclic pattern has specific properties: it is population dependent (Figure 2) and the period of the oscillations is about a few months. To reproduce these properties, the model is built based on a “Word Of Mouth” process, where agents interact through specific social networks. In addition, to simulate the cyclic behavior with a period of few months, we should also consider a delay of almost the same time period in which the simulation almost returns to its initial condition. Fortunately, there is a definite dental clinical delay for this time period which is related to necessary time intervals between routine dental visits advised by dentists. The visiting interval of about six months is assumed to be the effective interval for which the dental health status might become at risk (Frame et al. 2000).
The basic structure of the proposed model is as follows: In each time period, some people (agents) go to dentist. The decision to visit a dentist is influenced by individuals’ state of attention to dental health (being careless or careful about their dental health), and whether or not they have recently (within the last six months) visited a dentist. When someone visits a dentist in order to do a check-up, it is possible that, he/she goes under treatment. It is assumed that people who have recently been under treatment encourage others to visit a dentist.
We run the model for different population sizes, network structures, and contact ratios as described in the model parameters section.
For coding and simulation purposes, AnyLogic software is used. In the following, we describe detailed formulation and coding of decision rules and network structures of the model. The model code can be found at: https://www.openabm.org/model/4927/version/1/view.
Decision rules
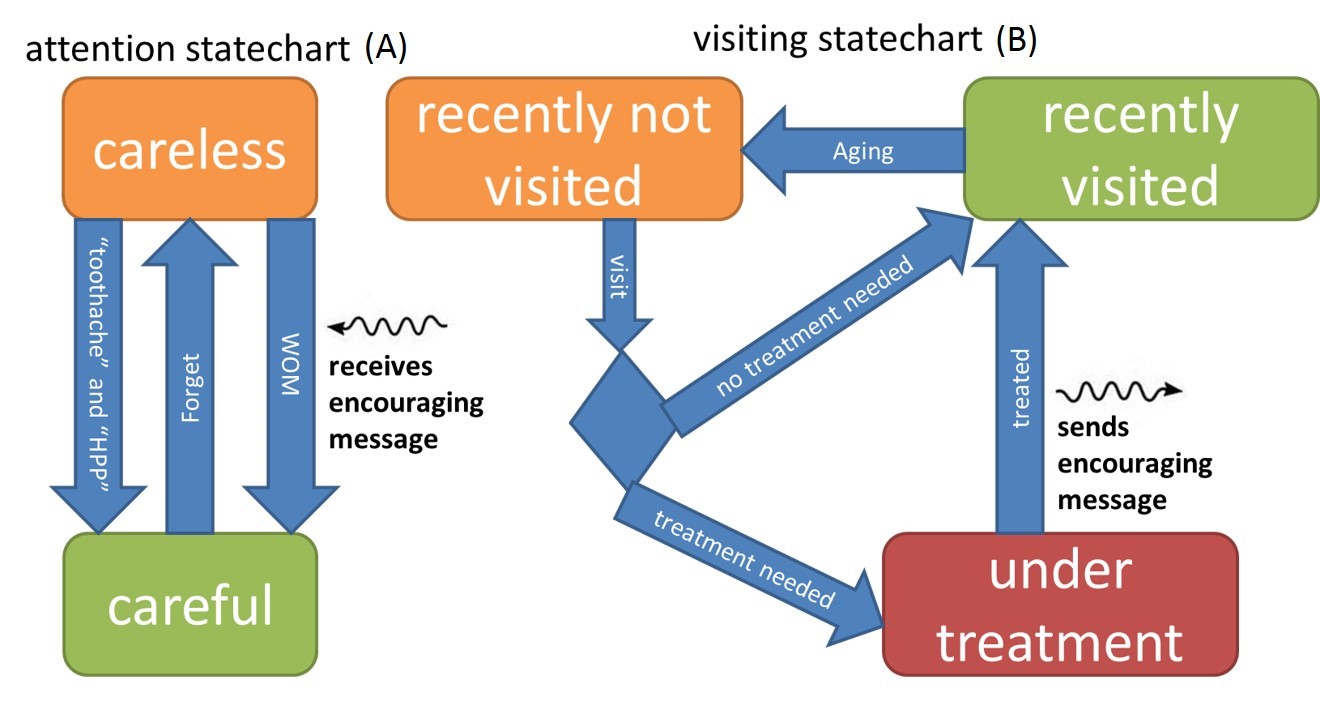
Figure 3 depicts a flowchart (statechart) of an agent’s decision making model. In each time period, two statecharts will indicate each agent’s status. First is the state of attention about dental care (statechart A) which includes two conditions: careful (CF) and careless (CL). Second statechart indicates the agents visiting state (statechart B) where in each time period, each patient is in one of the states of recently visited (RV), recently not visited (RNV) and under treatment (UT). Thus for any agent i and time t we have:
| $$A_{i,t} \in \{CF,CL\}$$ | (1) |
| $$B_{i,t} \in \{RV,RNV,UT\}$$ | (2) |
Transitions within attention states (statechart A)
People’s attention to dental care (statechart A) can change between CL and CF. In our model, state of attention can increase (change from CL to CF) through toothache, public Health Promotion Programs (HPP), and word of mouth (WOM). The probability of transition due to toothache or HPP is represented by β. The WOM transition happens whenever the agent receives an encouraging message from her friend. Therefore, we can write:
| $$P(A_{i,t} = CF | A_{i,t - 1} = CL) = \max (WOM_{i,t},\beta)$$ | (3) |
| $$WOM_{i,t} = \begin{cases} 1, & if \quad \exists j | S_{ji,t - 1} = 1 \\ 0, & Otherwise \end{cases}$$ | (4) |
The level of attention deteriorates (changes from CF to CL) with a delay of time to forget, Τ, formulated as following:
| $$\tau = M \tau_{N}$$ | (5) |
| $$P(A_{i,t} = CL | A_{i,t - 1} = CF) = \begin{cases} 1, & if \quad T_{CF} \geq \tau \\ 0, & if \quad T_{CF} < \tau \end{cases}$$ | (6) |
Transitions within visit states (statechart B)
As mentioned before, agents are categorized into three groups: recently not visited (RNV), recently visited (RV), and currently under treatment (UT). Agents in RNV state are the ones who have not visited dentist in the past six months. Agents in the RV state visited dentist at least once in the past six months. Agents in the UT stage are currently under treatment.
In the model agents’ decision to visit a dentist (Vi,t = 1) follows a simple rule: An agent visits a dentist if her attention and visiting states are respectively careful (Ai,t-1 = CF) and recently not visited dentist (B i,t-1 = RNV). Mathematically:
| $$V_{i,t} = \begin{cases} 1, & A_{i,t - 1} = CF \quad and \quad B_{i,t - 1} = RNV \\ 0, & otherwise \end{cases}$$ | (7) |
The transition probabilities can be written as:
| $$P(B_{i,t} = RNV | B_{i,t - 1} = RV) = \begin{cases} 1, & if \quad T_{RV} \geq 6 \quad months \\ 0, & otherwise \end{cases}$$ | (8a) |
| $$P(B_{i,t} =UT | B_{i,t - 1} = RNV) = \begin{cases} RT, & if \quad V_{i,t} = 1 \\ 0, & otherwise \end{cases}$$ | (8b) |
| $$P(B_{i,t} = RV | B_{i,t - 1} = RNV) = \begin{cases} 1, & if \quad V_{i,t} = 1 \quad and \quad B_{i,t} \neq UT \\ 0, & otherwise \end{cases}$$ | (8c) |
| $$P(B_{i,t} = RV | B_{i,t - 1} = UT) = \begin{cases} 1, & if \quad T_{UT} \geq T_t \\ 0, & otherwise \end{cases}$$ | (8d) |
| $$S_{ji,t} = \begin{cases} 1, & if \quad i \in RC_{m,j,t} \quad and \quad B_{i,t} = RV \quad and \quad B_{i,t - 1} = UT \\ 0, & otherwise \end{cases}$$ | (9) |
We should emphasize that, focusing on the demand side, we have ignored the supply restrictions in our model. It should be mentioned that considering the limited supply side would probably smoothen the oscillations.
Social network structures
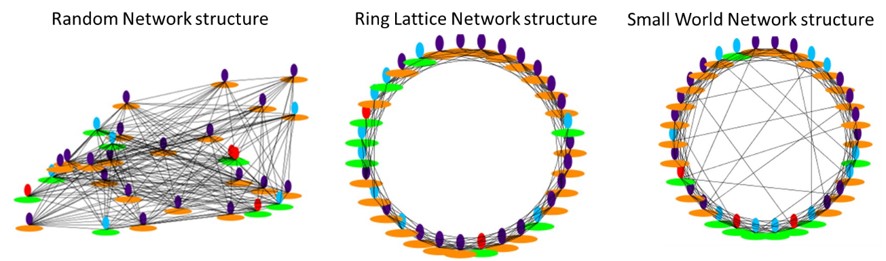
We used three major social network structures of Random, Ring Lattice, and Small World in our simulations, as described in the following.
Random network
In this structure each node (agent) is assumed to be randomly connected to a certain number of other nodes. Nodes are connected to any other one with the same probability (Figure 4). In our simulations all nodes are assumed to be randomly connected to L =10 other nodes on average. This means that any agent is connected to 10 other agents as friends (on average) and encourages m number of them (m ≤ 10) to visit a dentist. We used AnyLogic pre-defined Random network standard structure to create this network. AnyLogic uses Erdős and Rényi (ER) random graph model to create the Random structure. In this model, distribution of each node’s degree is binomial. In our case, since we have large number of nodes and also the mean degree of these nodes was constant, one can show the binomial distribution to be approximately equivalent to Poison distribution (Newman 2010). In addition, in order to analyze the sensitivity of the model to the homogeneity of networks, we added (or subtracted) each node’s degree by a normal variable with an average equals to 0 and variance equals to 5. This addition (or subtraction) was performed by adding (or removing) a link between the node and another random node.
Ring Lattice network
In this structure, nodes are placed on a ring and each node is connected to a definite number of its neighbors. Connections in this type of network are local and there is no long range connection within the network structure (Figure 4). In these simulations, all nodes are assumed to be connected to 10 neighbors and they send encouraging messages to m neighbors. We used AnyLogic pre-defined Ring Lattice network standard structure to create the network. The algorithm for creating a Ring Lattice network with nodes degree equal to 10 is as follows: first, a ring layout of agents is built, then we start from the first agent on the ring and connect it to its next 5 neighbors (clockwise). Repeating the process for all agents, each one will be finally connected to 10 adjacent agents, equally divided on its both sides on the ring. In order to analyze the sensitivity of the model to the homogeneity of the network structure, we then modify the network by adding (or removing) normal random number, with average 0 and variance 5, of edges to (or from) each node. In order to maintain the general structure of Ring Lattice network, when a link is removed, we choose the last connection in clockwise direction of that particular agent and when adding a link, we connect that agent to its last clockwise not connected neighbor.
Small World network
In this structure, connections are mostly local while it permits a certain fraction of connections to be long ranged. To be more specific, this network is based upon Ring Lattice network where each node is connected to a certain number of its neighbors. Then a given percent of local connections are replaced by connections between randomly chosen nodes with no limitation on their distance. Therefore, a Small World network structure can be considered as a combination of Ring Lattice and Random network (Figure 4). We used the pre-defined Small World network in AnyLogic assuming 10 connections for each agent and 5 percent of the connections to be random (κ = 0.05). For creating this structure, AnyLogic follows Watts–Strogatz mechanism (Watts et al. 1998). According to this mechanism, first Ring Lattice network should be created with a constant degree of each node as described before. Then for each nodei an edge (ni, nj) (i<j) is selected with probability κ and it is rewired with (ni, nk) where k is chosen uniformly at random. In order to analyze the sensitivity of the model to the homogeneity of the network structure, we then added (or removed) a normal random number, with an average of 0 and a variance of 5, of edges to (or from) each node.
Model parameters
In total, we have simulated 115,000 experiments which comprise 3 network structures, 11 different values of contacts after treatment (0-10), 7 different populations (100, 200, 500, 1000, 2000, 5000 and 20000), and 500 different random seeds. All models were simulated for the time period of 500 months and simulation time step is one-tenth of a month (0.1 month). All other parameters and their values are presented in (Table 1).
| Parameter | Description | Value |
| Visit Time (T0) | Proper period between successive routine visits. | 6 months |
| Toothache & HPP Rate (β) | Probability of a careless person become careful by toothache or public advertisement. | 0.025 |
| Contacts After Treatment (m) | Number of people who are encouraged to visit a dentist by a person who has recently been treated. | Varied between 0 to 10 |
| Forget Time (τN) | Normal time for a careful person to forget and become careless. | Normal random variable with average of 1 month and variance of 0.5 month |
| Treatment Forget Multiplier (M;) | Forget Time is multiplied by this value when the person has been recently treated. | 3 |
| Treatment Requirement Probability (RT) | The probability of requiring a treatment during a visit. | 0.5 |
| Treatment Time (Tt) | Duration of treatment. | Normal random variable with average of 0.5 month and variance of 0.25 month |
| Total Population (N) | Total population | Varied 100 - 20000 |
| Connection Number (L) | Average number of connections of each individual | 10 people |
| Small World Network Parameter (κ) | Fraction of non-local connections in the Small World network. | 0.05 |
Oscillation measure
In order to assess the intensity of oscillations in the simulations, we focus on the number of careful people. This variable has a continuous behavior over time and other variables like the number of visits over time almost follow the same pattern. In addition, as we will see in the following sections, this variable is used to fit the empirical data.
The spectral density P of the trends can be used as a measure to examine how much the patterns of the results are oscillatory (Bloomfield 2004), as in the following:
| $$P(f) = |FT {x(t)}|^2$$ | (10) |
In order to have a better measure for the magnitude of oscillations, in a specific frequency interval, we use the normalized spectral density integral (NI) defined as follows:
| $$\begin{align}I &= \int_{f_1}^{f_2} \! (P(f) - P_0(f)) \, \mathrm{d}f\end{align}$$ | (11a) |
| $$\begin{align}I_0 &= \int_0^{f_{max}} \! P(f) \, \mathrm{d}f\end{align}$$ | (11b) |
| $$\begin{align}NI &= \frac{I}{I_0}\end{align}$$ | (11c) |
Considering the lower and upper bound for the frequency interval of interest to be f1= 0.1 (1/Month) and f2 = 0.2 (1/Month) we can calculate NI. This frequency range is relevant to oscillations period times from 5 to 10 months which contains the 6 months regular dental visiting intervals.
Results
Random Network
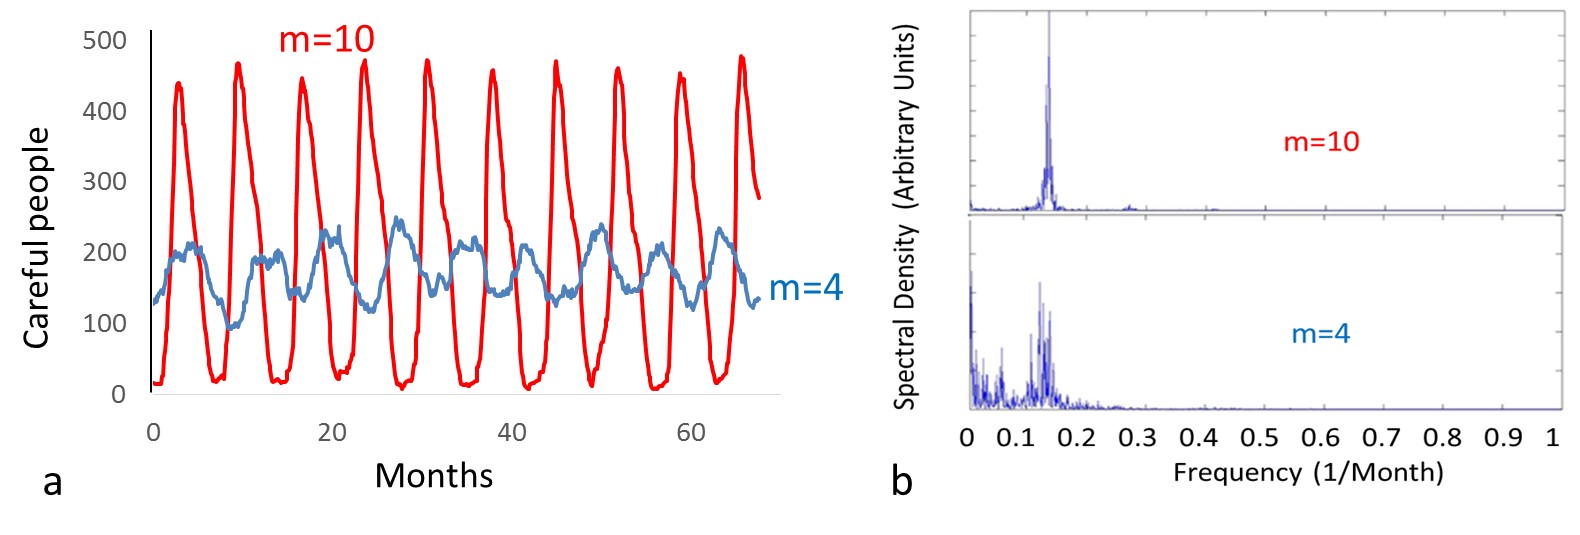
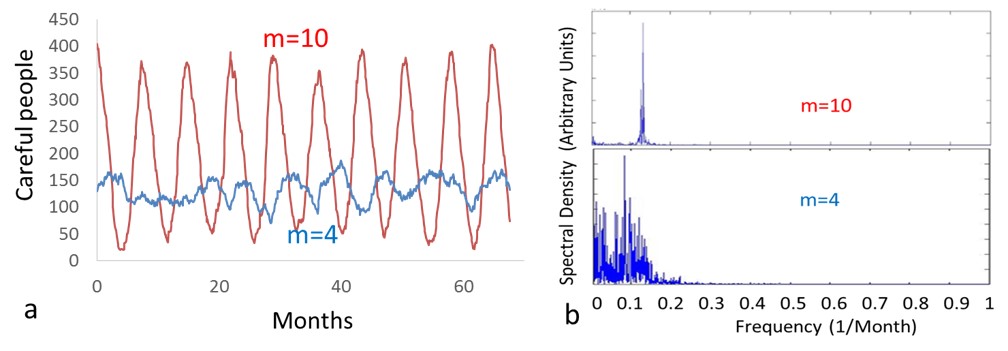
The simulation results for population 500 and m equals to 4 and 10 for Random structure are shown in Figure 5. This figure clearly shows an oscillatory pattern and the oscillation intensity grows as the number of contacts after treatment increases. The period of the oscillations is almost 7-8 months.
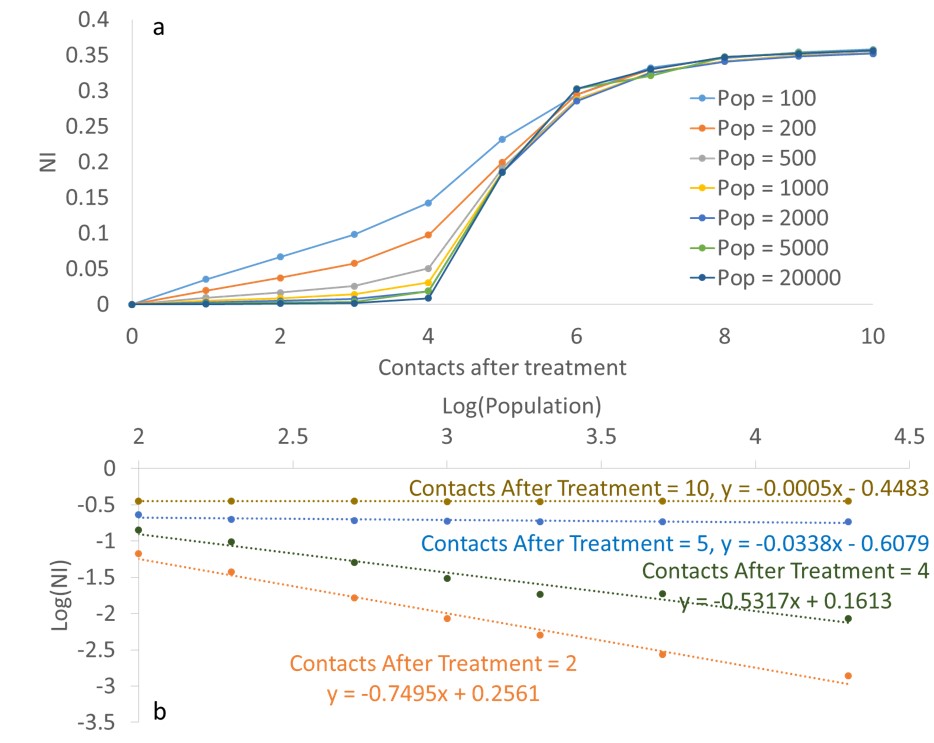
The simulation results for the value of NI in the Random network for different populations are shown in Figure 6a. For m = 0, there is no collective oscillation and by increasing m, oscillations gradually appear especially for small populations. For different populations all graphs asymptotically tend to 0.4. We will show in the next section that this is almost the maximum value of the normalized spectral density integral \((NI_{max} ~ 0.4)\).
Furthermore, the dependency of the oscillation intensity on the population is also illustrated in Figure 6b. This figure indicates that the simulation results are almost linear in a log-log diagram. We have also fitted the results for different values of “Contacts After Treatment” to a linear relation. These relations will be used in the following sections to compare the simulation results to empirical data. Interestingly, this figure illustrates that the results are independent of population size for larger values of m.
Ring Lattice Network
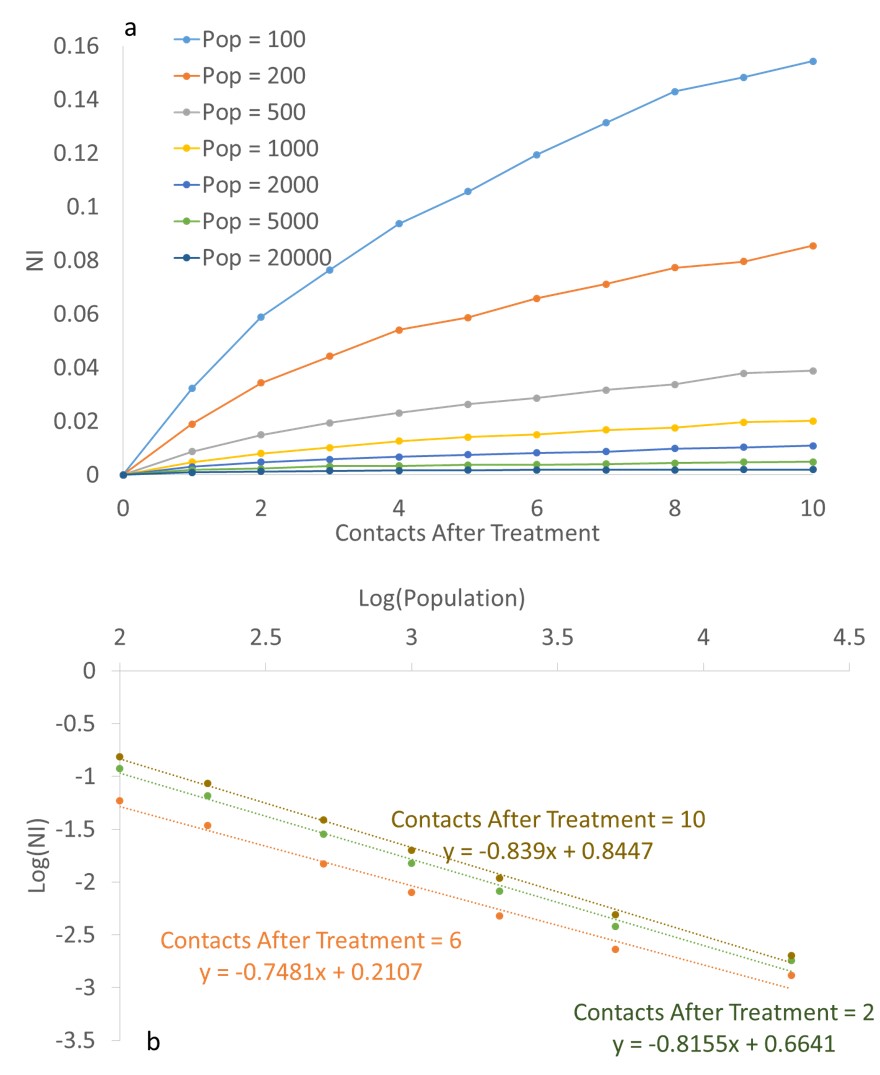
Figure 7 shows the simulation results for the population 500 and m = 4 and 10 for Ring Lattice structure. As this figure illustrates, oscillations have much smaller amplitudes compared to Random structure. In addition, it can be observed that increasing m results in incrementing the average number of careful people.

The simulation results for NI in Ring Lattice network is illustrated in Figure 8a. According to this figure and by comparing it with Figure 6a, it can be seen that NI values are much smaller than those for Random network. In addition, in contrast to Random network, the dependency of the oscillatory pattern on population, for larger values of m, is clearly observable (Fig. 8b).
Small World Network
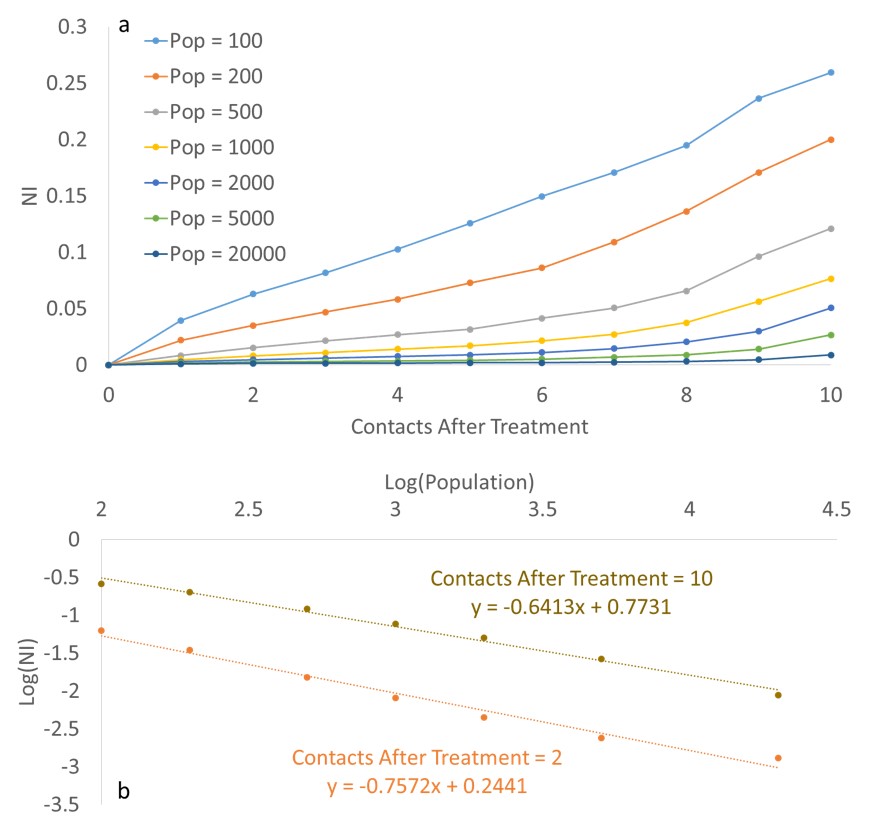
The simulation results for population 500 and m equals to 4 and 10 for Small World structure are shown in Figure 9. In terms of pattern of connections, the Small World network is structurally between Random and Ring Lattice network structures. Therefore, it is expected that the speed of sending encouraging messages is in between those two extremes. This can be observed in the time series illustrated in Figure 9 when compared with two previous structures.
Simulation results for the Small World network (Figure 10a) show that for population values of few hundreds and for large values of m, NI is large; while it has still a considerable difference to the maximum value 0.4 (as calculated in the next section). Moreover, Figure 10b indicates that for small values of m, NI strongly depends on population and this dependency gradually decreases as m increases.
Sensitivity to the network homogeneity
In order to analyze the sensitivity of the results to the homogeneity of the nodes’ degree, we assume each node’s degree to be a normal variable with average 10 and variance 5. Figure 11 illustrates the comparison with the results of the homogenous model for different network structures.
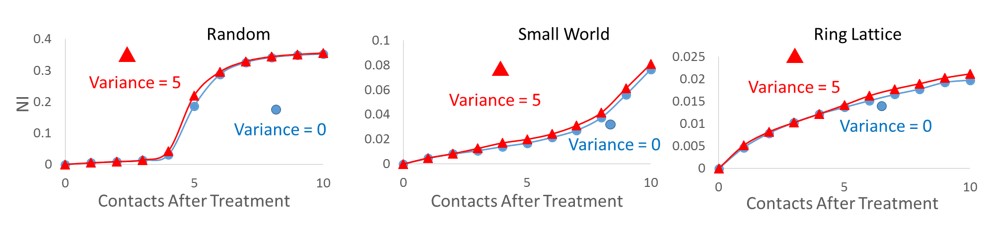
As illustrated in Figure 11, the variation from the homogenous network is not significant, however this variation is relatively larger for the Ring Lattice network. The oscillations are a bit larger for the Ring Lattice network which can be due to the fact that the random distribution adds some longer links to the network.
Summary Results
The above mentioned results are summarized in Table 2. This table presents qualitative results on collective behavior for different values of population and “Contacts After Treatment” (m).
| Low m | High m | |
| Low Population | Oscillation is observed in all network structures. The magnitude depends on population. | Oscillation depends on the network structure. Random network: maximum oscillation Ring Lattice: small oscillation Small World: large oscillation |
| High Population | Oscillation depends on the network structure. Random network: small oscillation Ring Lattice: no oscillation Small World: no oscillation | Oscillation depends on the network structure. Random network: maximum oscillation Ring Lattice: no oscillation Small World: large oscillation |
Theory and Discussion
Oscillation origin
The origin of the observed simulated oscillations can be explained as follows. When there are many careful people, some of them randomly have a visit due to toothache or public HPP. If they need and receive treatment, they will talk about their experience with some friends and therefore more people will have visit afterwards. On the other hand, since agents usually become careless after a while (forget), the same iteration will happen again.
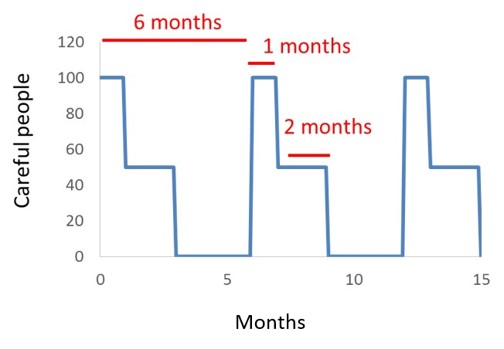
In extreme cases in which all people contribute in the collective behavior and become aware immediately all together, time series profile for careful people would be as illustrated in Fig. 12. In this case, all people in the population are promoted, for visiting, together and go for check-ups. After one month in average, half of them who were not under treatment become careless, while the other half become careless after three months. NImax for this extreme case is then found as follows:
| $$NI_{max} \sim 0.4$$ | (12) |
Oscillation condition
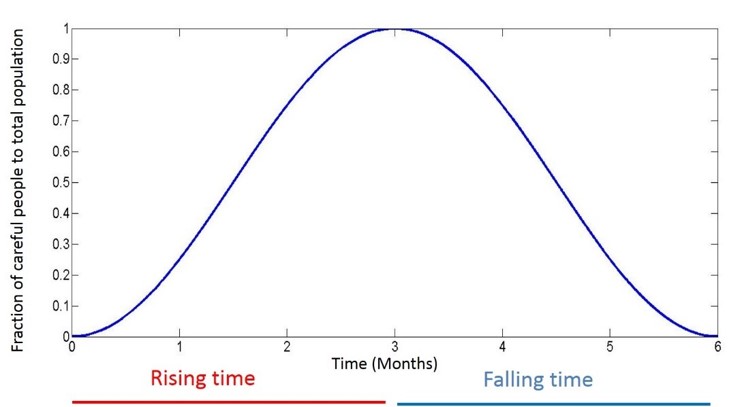
In order to find a rough approximation for the condition in which oscillation is observable, we consider the following scenario. Consider at time = 0 all agents are careless and recently not visited a dentist. Then, randomly one of them becomes careful and excited enough to encourage friends (after treatment) and successively, in chain reaction process of sending encouraging messages, a considerable amount of people become careful and go for check-ups. In order to observe the collective oscillatory pattern, with the T0= 6 months period, the chain reaction process speed must be large enough that in T0/2 = 3 (the first half of the total T0 = 6 months period) most of the population become careful. This is the time when the number of careful people is expected to rise in oscillatory pattern (Fig. 13). Otherwise, if a considerable amount of people remain careless after the initial three months, then the rising in number of careful people will continue in the second half of T0, at the time when the collective oscillation is expected to fall; the oscillatory pattern is destroyed.
Random Network
To formulate the oscillation condition for Random network, we consider a stepwise process where each time step has a length of Tt = “Treatment Time” assuming that at time T = 0 all people were careless and recently not visited dentist. At that time, one randomly chosen person becomes careful, pays a visit to a dentist, and then goes under treatment. After time step Tt, this patient encourages her friends to go for visit and the same process, as the last step, starts with larger number of patients. Consider we have nk people who have already become careful and gone for visit until step k. From this population, nk – nk-1 individuals became careful in the step k and half of them (who need treatment) will encourage their friends in step ¬k +1. Therefore, nk+1 can be calculated as follows:
| $$n_{k+1}=n_k + \frac{C}{2}(n_k-n_{k-1})(1- \frac{n_k}{N})+r(N-n_k)T_t$$ | (13) |
The second term on the right hand side of the equation, which indicates the new careful agents due to WOM, counts the number of encouraging messages, \(\frac{C(n_k) - n_{k-1}}{2}\), multiplied by the probability that the message receiving agent has not received any message in the previous steps \((\frac{1-n_k}{N})\). The factor \(\frac{1}{2}\) in the above relation arises since we have assumed that half of the agents (Required Treatment probability, RT = 0.5) need treatment, and so will send encouraging messages. In addition, if there are m “Contacts After Treatment” and L network connections per agent (in our simulations L = 10), the agent will send a message back to the person who has just recently encouraged her with probability \(\frac{m}{L}\). So C should be considered as \(C = m - \frac{m}{L}\). The third term, in the above relation, counts the number of new careful agents due to random “Toothache & HPP” transition during one step. In our simulations, the rate of “Toothache & HPP” transition, r, was considered to be 0.025.
To find a simple, at the same time rough, approximation one can assume the early fast growing stages of the chain reaction process, \(\frac{n_k}{N} << 1\) and also assume \(C > 1\) that means an agent sends encouraging messages to most friends. In this situation with \( n_k >> n_{k-1}\) the discrete relation can be written as follow:
| $$n_{k+1} - n_k = \frac{C}{2}n_k + rNT_t$$ | (14) |
Given that the total time for growing the number of careful people is about three months, this is much larger than the time length of each step (Tt = 0,5 month). Therefore, we can rewrite the above discrete relation in a continuous form as follows:
| $$\frac{dn}{dt} = \frac{C}{2T_t}n + rN$$ | (15) |
By solving this differential equation, we easily find the condition in which most of the population is covered (become careful) in the first half of the total T0 = 6 months of the oscillation period.
| $$\ln \frac{C}{2T_t r} \leq \frac{CT_0}{4T_t}$$ | (16) |
Interestingly this condition is independent of N. In other words, in Random networks the oscillatory collective behavior will occur in the society if the above non-equality is satisfied no matter how large the population is. The above inequality is satisfied for a critical C value of Cmin = 1.33 which almost corresponds to a critical m value of \(m_{min} \sim 1.5\). It means that if each agent encourages at least 1.5 friends the collective oscillation is observable. These theoretical results can be compared with simulation results presented in Fig. 6. This figure shows that for larger values of “Contacts After Treatment” (m) oscillation intensity is independent of population which is in complete agreement with the theory. It also shows that for these large values of m, the value of NI almost reaches its maximum value, NImax = 0.4. The similarity between the oscillation’s peaks shapes of Fig. 5b (for m = 10) and Fig. 12 is observable.
Also it can be seen that the oscillation intensity becomes considerable for values of m greater than 3. This shows that the theory underestimates the critical mmin value for the oscillation condition. This deviation can be due to the fact that in the approximations we have assumed that C >> 1.
Ring Lattice network
For Ring Lattice network, agents are placed on a ring and individuals become careful due to WOM locally. In this structure, there are some careful regions on the ring that grow by their two end sides. Assuming that half of the individuals who receive the encouraging message will need treatment and send the subsequent messages, we simply assume that a local careful region grows with \(\frac{C}{2}\) agents at each step. It should be noted that this assumption is just a rough approximation for which we have avoided sophisticated calculations. The differential equation for n follows as:
| $$\begin{align}\frac{dn}{dt} &=\frac{C}{2T_t}D\end{align}$$ | (17a) |
| $$\begin{align}\frac{dD}{dt} &=\frac{rN}{2}\end{align}$$ | (17b) |
Where D is the number of careful regions. The first equation calculates the growth of D careful regions and the second equation is the rate in D increment due to the random “toothache and HPP” transition. The 1/2 factor in the second equation comes from the fact that half of the randomly becoming careful individuals do not need treatment and so will not create an active careful region. It should be stated that as C is assumed to be large, and if the first randomly created active point of the arc is active, then the arc will remain active. It is also assumed that n << N. For the condition in which most of the agents become careful in first T0/2 we find:
| $$N \leq \frac{C}{4T_t}(\frac{T_0}{2}) + \frac{NCr}{8T_t}(\frac{T_0}{2})^2$$ | (18) |
The first term on the right hand side is relevant to the first careful region that is assumed to exist at t =0. The second term appears due to the consequent careful regions forming randomly due to toothache and HPP. In contrast to Random network, this inequality strongly depends on population. For the maximum value of C = 9 we find a condition of N < 30 satisfies the oscillation condition. These results are in consistent with simulation results (Fig. 8) where the oscillation intensities are much smaller than Random network and strongly depends on population. The simulation results show that for N = 100 we still have considerable oscillations. This deviation from theory can be due to the fact that the careful regions actually grow faster than the simple approximation rate C/2. It should also be noticed that for Small World network, as expected, Fig. 10 shows that for small values of C the oscillation intensity is population dependent while this dependency gradually reduces as C increases. This result clearly reflects on the nature of the Small World network as a case between two extreme cases of Random and Ring Lattice networks. .
Comparison with empirical data
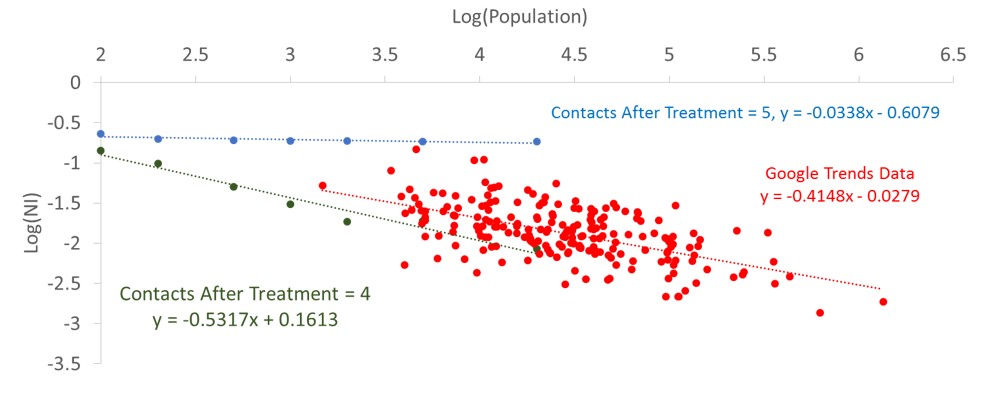
To validate the model, the results are compared with an empirical data gathered from Google Trends service which reports the relative number of queries to search specific words by certain user defined time periods and locations. This service can be used to report the relative number of queries related to a specific category. In order to find a proper measure for the people’s attention to oral health issues, choosing US society as a developed country with high level of access to Internet, we gathered the reports of the relative number of searches in the “Oral & Dental Care” category for 208 cities in US since early 2004. The names of cities in addition to their population can be found in Appendix . For each city, the report consisted of a time series showing the relative number of queries over time. The data indicates that oscillatory behavior and oscillations’ intensity is population dependent. The relative reported numbers, showing the amount of searchers’ attention to dental and oral health care issues, somehow reflect a measure of carefulness among the society. We assume that the relative amount of search queries is proportional to the number of careful people in our model. Calculating the power spectrum of the time series, we found the NI values for each city and by knowing its population size we could compare the data to the model results. In order to find a relation between NI and the population of the city, we found that the data best fits a linear relation in a log-log diagram. Figure 14 shows the fitted data and the linear regression statistical analysis results are illustrated in Table 3. The slope of the linear equation is -0.41±0.08. Comparing the linear equations of the relevant model graphs (Fig. 6b, Fig. 8b, Fig. 10b), it turns out that the simulation results for Ring Lattice and Small World network decrease much faster, as the population increases, compared with Google Trends data. The slope of the linear equation for Ring Lattice network is almost -0.8 for all of the values of “Contacts After Treatment” while for Small World the slope is at most -0.64, relevant to 10 contacts after treatment.
In the case of Random network, the simulations graphs cover a wide range of slope values from -0.8 to 0. The slope = -0.41, relevant to the Google data, occurs for a value between 4 and 5 number of contacts after treatment. It shows that the Google Trends data can fit the Random network model for “Contacts After Treatment” of about 4-5. The Google Trends data is compared to the Random model in Fig. 15. It should be mentioned that, in order to fit better to the data, we have shifted the empirical point for about 0.7 to the left on the log(population) axis. This means that the model well explains the data if we assume that 20% of the population actually involve in the network. This fraction value can be regarded as an estimation for the fraction of the society engaged in the Internet based activities; they are deeply influenced by Internet social networks and use Internet as a significant source of information.

| Coefficients | Standard Error | t Stat | P-value | Lower 95% | Upper 95% | Lower 95.0% | Upper 95.0% | |
| Intercept | 0.303961 | 0.20830 | 1.4592 | 0.14603 | -0.10673 | 0.71464 | -0.10673 | 0.71464 |
| X Variable | -0.4148 | 0.03950 | -10.5009 | 6.2E-21 | -0.49268 | -0.33692 | -0.49268 | -0.33692 |
Conclusion
There are some empirical facts that show the effect of peer connections on individuals’ health behaviors. In some cases, these individuals’ behavior changes produce interesting collective behaviors, as emergent properties of the system, in the society level. One of these social emergences can be observed in the oscillatory pattern of the amount of demand for dental visiting in social networks. In the current work, an agent-based model is introduced to investigate this collective behavior. The model illustrates that this oscillatory pattern is strongly dependent upon the network structure and the number of effective connections. In Random networks, the oscillations appear as the number of effective contacts among agents exceeds a critical value of about 3, and interestingly for larger values of effective contacts the oscillation intensity reaches its maximum no matter how large the population is. In Ring Lattice networks, where we have local connections, the oscillation intensity is much smaller than Random network. In addition, in contrast to Random network the oscillatory pattern is strongly dependent on population in the Ring Lattice network. For Small World network, the results are somehow a combination of the Random and Ring Lattice networks. Comparing the model results to empirical data from Google Trends, it turns out that the results best fit Random network model while we assume that 20% of people are involved in the network in each US city. This suggests that the model can be used focusing on the fraction of people involved in Internet social networks and activities. As an insight, the model predicts that the dental health service demand oscillations may grow as people are more influenced by Internet social networks, which may lead to resource management problems. Of course it should be noted that the model results are based on restricted assumptions; the model has ignored many other participants like suppliers and also demands from other parts of the society whom not using Internet which may become significant in specific situations.
Acknowledgements
This research was supported by Research Institute of Dental Sciences, Shahid Beheshti University of Medical Sciences. We must also thank Professor Navid Ghaffarzadegan from Virginia Tech University for his precious helps and advices during the research.Appendix
| City | Population |
| New York NY | 8491079 |
| Los Angeles CA | 3928864 |
| Chicago IL | 2722389 |
| San Francisco, Oakland, San Jose CA | 2282029 |
| Houston TX | 2239558 |
| Dallas, Ft. Worth TX | 2093285 |
| Philadelphia PA | 1560297 |
| Phoenix AZ | 1537058 |
| San Antonio TX | 1436697 |
| San Diego CA | 1381069 |
| Sacramento, Stockton, Modesto CA | 996874 |
| Austin TX | 912791 |
| Raleigh, Durham (Fayetteville) NC | 895737 |
| Seattle, Tacoma WA | 873501 |
| Jacksonville FL | 853382 |
| Indianapolis IN | 848788 |
| Columbus OH | 835957 |
| Charlotte NC | 809958 |
| Boston MA, Manchester NH | 766332 |
| Minneapolis St. Paul MN | 704847 |
| Washington DC (Hagerstown MD) | 699257 |
| Detroit MI | 680250 |
| El Paso TX | 679036 |
| Tampa, St. Petersburg (Sarasota) FL | 666606 |
| Denver CO | 663862 |
| Cleveland, Akron (Canton) OH | 659677 |
| Memphis TN | 656861 |
| Fresno, Visalia CA | 645267 |
| Nashville TN | 644014 |
| Greensboro, High Point, Winston Salem NC | 630484 |
| Albuquerque, Santa Fe NM | 627466 |
| Baltimore MD | 622793 |
| Oklahoma City OK | 620602 |
| Portland OR | 619360 |
| Las Vegas NV | 613599 |
| Louisville KY | 612780 |
| Miami Ft. Lauderdale FL | 606345 |
| Milwaukee WI | 599462 |
| Tucson (Sierra Vista) AZ | 571778 |
| Colorado Springs, Pueblo CO | 554253 |
| Norfolk, Portsmouth, Newport News VA | 524394 |
| Kansas City MO | 470800 |
| Atlanta GA | 456002 |
| Omaha NE | 446599 |
| Wichita, Hutchinson KS | 430055 |
| Ft. Smith, Fayetteville, Springdale, Rogers AR | 429328 |
| Harlingen, Weslaco, Brownsville, McAllen TX | 425157 |
| Orlando, Daytona Beach, Melbourne FL | 403873 |
| Tulsa OK | 399682 |
| New Orleans LA | 384320 |
| Bakersfield CA | 368759 |
| Honolulu HI | 350399 |
| Lincoln & Hastings, Kearney NE | 330380 |
| Cedar Rapids, Waterloo Iowa City & Dubuque IA | 329410 |
| Flint, Saginaw, Bay City MI | 328163 |
| Grand Rapids, Kalamazoo, Battle Creek MI | 321547 |
| Corpus Christi TX | 320434 |
| St. Louis MO | 317419 |
| Lexington KY | 310797 |
| Pittsburgh PA | 305412 |
| Anchorage AK | 301010 |
| Cincinnati OH | 298165 |
| Yakima, Pasco, Richland, Kennewick WA | 292445 |
| Huntsville, Decatur (Florence) AL | 283882 |
| Waco, Temple, Bryan TX | 281872 |
| Toledo OH | 281031 |
| Providence RI, New Bedford MA | 273999 |
| Des Moines, Ames IA | 272486 |
| Mobile AL, Pensacola (Ft. Walton Beach) FL | 269301 |
| Buffalo NY | 258703 |
| Ft. Wayne IN | 258522 |
| Hartford & New Haven CT | 254987 |
| Laredo TX | 252309 |
| Champaign & Springfield, Decatur IL | 252086 |
| Tyler, Longview(Lufkin & Nacogdoches) TX | 250899 |
| Richmond, Petersburg VA | 250554 |
| Madison WI | 245691 |
| Lubbock TX | 243839 |
| Little Rock. Pine Bluff AR | 243038 |
| Odessa. Midland TX | 242634 |
| Santa Barbara, Santa Maria, San Luis Obispo CA | 241336 |
| Reno NV | 236995 |
| Baton Rouge LA | 228895 |
| Montgomery (Selma) AL | 220295 |
| Boise ID | 216282 |
| Greenville, Spartanburg SC, Asheville NC, Anderson SC | 214840 |
| Albany, Schenectady, Troy NY | 214412 |
| Birmingham AL | 212247 |
| Spokane WA | 212052 |
| Rochester NY | 209983 |
| Tallahassee FL, Thomasville GA | 206807 |
| Wichita Falls TX & Lawton OK | 202131 |
| Columbus GA | 200887 |
| Shreveport LA | 198242 |
| Amarillo TX | 197254 |
| Augusta GA | 196741 |
| Peoria, Bloomington IL | 194558 |
| Springfield, Holyoke MA | 194115 |
| Salt Lake City UT | 190884 |
| Monterey, Salinas CA | 184953 |
| Knoxville TN | 184281 |
| Sioux Falls(Mitchell) SD | 184279 |
| Chico, Redding CA | 180773 |
| Roanoke, Lynchburg VA | 178475 |
| Harrisburg, Lancaster, Lebanon, York PA | 177822 |
| Chattanooga TN | 173778 |
| Beaumont, Port Arthur TX | 172133 |
| Jackson MS | 171155 |
| Springfield MO | 165378 |
| Minot, Bismarck, Dickinson(Williston) ND | 163777 |
| Eugene OR | 160561 |
| Columbia, Jefferson City MO | 160038 |
| Macon GA | 153691 |
| South Bend, Elkhart IN | 152611 |
| Alexandria LA | 150575 |
| Rockford IL | 149123 |
| West Palm Beach Ft. Pierce FL | 147632 |
| Savannah GA | 144352 |
| Syracuse NY | 144263 |
| Abilene, Sweetwater TX | 141709 |
| Dayton OH | 141003 |
| Davenport IA, Rock Island, Moline IL | 139483 |
| Yuma AZ, El Centro CA | 137163 |
| Tri, Cities | 134352 |
| Columbia SC | 132067 |
| Charleston SC | 130113 |
| Greenville, New Bern, Washington NC | 129932 |
| Gainesville FL | 128460 |
| Topeka KS | 127215 |
| Lafayette LA | 126066 |
| Fargo, Valley City ND | 122539 |
| Evansville IN | 120346 |
| La Crosse, Eau Claire WI | 118122 |
| Biloxi, Gulfport MS | 116734 |
| Green Bay, Appleton WI | 116147 |
| Wilkes Barre, Scranton PA | 116095 |
| Lansing MI | 114620 |
| Wilmington NC | 113657 |
| Idaho Falls, Pocatello ID | 112983 |
| Duluth MN, Superior WI | 112943 |
| Billings MT | 108869 |
| Medford, Klamath Falls OR | 99676 |
| Erie PA | 99452 |
| Charleston, Huntington WV | 99211 |
| San Angelo TX | 98975 |
| Ft. Myers, Naples FL | 91886 |
| Portland, Auburn ME | 89578 |
| Bend OR | 84080 |
| Sioux City IA | 82511 |
| Grand Junction, Montrose CO | 79255 |
| Cheyenne WY, Scottsbluff NE | 77720 |
| Paducah KY, Cape Girardeau MO, Harrisburg, Mount Vernon IL | 77615 |
| St. Joseph MO | 76967 |
| Butte, Bozeman MT | 76340 |
| Albany GA | 75769 |
| Lake Charles LA | 74889 |
| Rapid City SD | 72638 |
| Jonesboro AR | 72210 |
| Burlington VT, Plattsburgh NY | 71552 |
| Casper, Riverton WY | 71039 |
| Columbus, Tupelo, West Point MS | 70029 |
| Missoula MT | 69821 |
| Quincy IL, Hannibal MO, Keokuk IA | 69390 |
| Monroe LA, El Dorado AR | 67953 |
| Florence, Myrtle Beach SC | 67953 |
| Jackson TN | 67319 |
| Dothan AL | 67180 |
| Victoria TX | 66094 |
| Johnstown, Altoona PA | 65742 |
| Youngstown OH | 65062 |
| Joplin MO, Pittsburg KS | 64698 |
| Rochester MN, Mason City IA, Austin MN | 63576 |
| Bowling Green KY | 62479 |
| Utica NY | 61332 |
| Terre Haute IN | 60956 |
| Hattiesburg, Laurel MS | 60688 |
| Great Falls MT | 59152 |
| Sherman TX, Ada OK | 57073 |
| Harrisonburg VA | 52478 |
| Greenwood, Greenville MS | 48434 |
| Palm Springs CA | 46854 |
| Wausau, Rhinelander WI | 46799 |
| Twin Falls ID | 46528 |
| Binghamton NY | 46299 |
| Wheeling WV, Steubenville OH | 45822 |
| Charlottesville VA | 45593 |
| Ottumwa IA, Kirksville MO | 42315 |
| Mankato MN | 40411 |
| Meridian MS | 40196 |
| Lima OH | 38265 |
| Panama City FL | 37681 |
| Bluefield, Beckley, Oak Hill WV | 35861 |
| Bangor ME | 32568 |
| Salisbury MD | 32563 |
| Fairbanks AK | 32469 |
| Juneau AK | 32406 |
| Clarksburg, Weston WV | 31230 |
| Parkersburg WV | 30981 |
| Helena MT | 29943 |
| Alpena MI | 28988 |
| Elmira NY | 28647 |
| Watertown NY | 27590 |
| Eureka CA | 26925 |
| Zanesville OH | 25372 |
| Traverse City, Cadillac MI | 25187 |
| North Platte NE | 24327 |
| Marquette MI | 21441 |
| Presque Isle ME | 9317 |
References
AUCHINCLOSS, A. H., & Roux, A. V. D. (2008). A new tool for epidemiology: the usefulness of dynamic-agent models in understanding place effects on health. American Journal of Epidemiology, 168(1), 1-8. [doi:10.1093/aje/kwn118]
BLOOMFIELD, P. (2004). Fourier analysis of time series: An introduction. John Wiley & Sons.
BROOKMEYER, R., Boren, D., Baral, S. D., Bekker, L.-G., Phaswana-Mafuya, N., Beyrer, C., & Sullivan, P. S. (2014). Combination HIV prevention among MSM in South Africa: results from agent-based modeling. PLoS ONE, 9(11), e112668. [doi:10.1371/journal.pone.0112668]
CASANOVA-ROSADO, A. J., Medina-Solís, C. E., Casanova-Rosado, J. F., Vallejos-Sánchez, A. A., Minaya-Sánchez, M., Mendoza-Rodríguez, M., Márquez-Rodriguez, S. & Maupomé, G. (2014). Tooth brushing frequency in Mexican schoolchildren and associated socio-demographic, socioeconomic, and dental variables. Medical Science Monitor: International Medical Journal of Experimental and Clinical Research, 20, 938.
CATTEAU, C., Blaizot, A., Duhamel, A., Delzenne, A., Devillers, A., & Frimat, P. (2012). Dental status and related factors in an occupational health service in Northern France. Sante publique (Vandoeuvre-les-Nancy, France), 25(6), 747-755.
DAY, T. E., Ravi, N., Xian, H., & Brugh, A. (2013). An agent-based modeling template for a cohort of veterans with diabetic retinopathy. PLoS ONE, 8(6), e66812.
FRAME, P. S., Sawai, R., Bowen, W. H., & Meyerowitz, C. (2000). Preventive dentistry: practitioners’ recommendations for low-risk patients compared with scientific evidence and practice guidelines. American Journal of Preventive Medicine, 18(2), 159-162. [doi:10.1016/S0749-3797(99)00138-5]
GILBERT, G. H., Duncan, R. P., & Kulley, A. M. (1997). Validity of Self‐reported Tooth Counts During a Telephone Screening Interview. Journal of Public Health Dentistry, 57(3), 176-180.
GORMAN, D. M., Mezic, J., Mezic, I., & Gruenewald, P. J. (2006). Agent-based modeling of drinking behavior: a preliminary model and potential applications to theory and practice. American Journal of Public Health, 96(11), 2055-2060. [doi:10.2105/AJPH.2005.063289]
HAWLEY, G., Holloway, P., & Davies, R. (1997). Dental health status associated with documented dental attendance patterns in adolescents. Community Dental Health, 14(1), 22-24.
LASKOWSKI, M., Demianyk, B. C., Witt, J., Mukhi, S. N., Friesen, M. R., & McLeod, R. D. (2011). Agent-based modeling of the spread of influenza-like illness in an emergency department: A simulation study. Information Technology in Biomedicine, IEEE Transactions on, 15(6), 877-889. [doi:10.1109/TITB.2011.2163414]
LEISCHOW, S. J., & Milstein, B. (2006). Systems thinking and modeling for public health practice. American Journal of Public Health, 96(3), 403-405.
MARSHALL, S., Northridge, M. E., De La Cruz, L. D., Vaughan, R. D., O'Neil-Dunne, J., & Lamster, I. B. (2009). ElderSmile: a comprehensive approach to improving oral health for seniors. American Journal of Public Health, 99(4), 595-599. [doi:10.2105/AJPH.2008.149211]
MCGRATH, C., & Bedi, R. (2001). Public dental health: Can dental attendance improve quality of life? British Dental Journal, 190(5), 262-265.
METCALF, S. S., Northridge, M. E., Widener, M. J., Chakraborty, B., Marshall, S. E., & Lamster, I. B. (2013). Modeling social dimensions of oral health among older adults in urban environments. Health Education & Behavior, 40(1 suppl), 63S-73S. [doi:10.1177/1090198113493781]
MONTERO, J., Albaladejo, A., & Zalba, J. I. (2014). Influence of the usual motivation for dental attendance on dental status and oral health-related quality of life. Medicina Oral, Patologia Oral y Cirugia Bucal, 19(3), e225.
NEWMAN, M. (2010). Networks: An introduction. OUP Oxford. [doi:10.1093/acprof:oso/9780199206650.001.0001]
PELTZER, K., & Pengpid, S. (2014). Oral health behaviour and social and health factors in university students from 26 low, middle and high income countries. International Journal of Environmental Research and Public Health, 11(12), 12247-12260.
SHEIHAM, A., Maizels, J., Cushing, A., & Holmes, J. (1985). Dental attendance and dental status. Community Dentistry and Oral Epidemiology, 13(6), 304-309. [doi:10.1111/j.1600-0528.1985.tb00461.x]
SOHN, W., & Ismail, A. I. (2005). Regular dental visits and dental anxiety in an adult dentate population. The Journal of the American Dental Association, 136(1), 58-66.
VEHKALAHTI, M., & Paunio, I. (1988). Occurrence of root caries in relation to dental health behavior. Journal of Dental Research, 67(6), 911-914. [doi:10.1177/00220345880670060401]
WATTS, D. J., & Strogatz, S. H. (1998). Collective dynamics of ‘small-world’ networks. Nature, 393(6684), 440-442.
WIENER, R. C., & Shockey, A. T. (2014). Oral Health Knowledge and Dental Visits in Community Living Older Adults in Rural Appalachia-West Virginia: A Cross-Sectional Analysis. Journal of Studies in Social Sciences, 8(1), 1.