
Introduction
Food-and-mouth disease (FMD) is a highly contagious viral disease in cattle and is known to cause problems such as decreased livestock productivity and decreased access to lucrative international markets for animals and animal products (Knight-Jones and Rushton 2013). The FMD virus is transmitted by close contact with infected animals, as well as through contaminated environments and people, and possibly through air over long distances (Alexandersen et al. 2003). Recent studies have found an endemic environment of FMD in Cameroon where pastoralists make seasonal transhumance movements with herds of cattle (Wint and Robinson 2007; Bronsvoort et al. 2004; Ludi et al. 2014; Pomeroy et al. 2015). Researchers have pointed out that the movement of infected animals in non-endemic settings of Europe has played a significant role in the dynamics of FMD transmission in general (Fèvre et al. 2006) and in endemic settings in sub-Saharan Africa in particular (Vosloo et al. 2002; Bronsvoort et al. 2003; Rweyemamu et al. 2008). The movements of transhumant pastoralists create a highly heterogeneous contact network in space and time between FMD hosts. While population-based evidence suggests that transhumance increases FMD risk (Bronsvoort et al. 2004), the hypothesis that mobile herds maintain endemic diseases such as FMD has not been evaluated directly for the individual case.
In this paper, we investigate the dynamics of FMD transmission between mobile herds in the Far North Region of Cameroon using a combination of field data and an agent-based model. We hypothesize that diseases without significant environmental persistence or long-term asymptomatic carriers cannot be maintained in mobile herds alone without the possibility of re-infection from other sources such as sedentary herds. With an ultimate goal of modeling FMD dynamics for the entire region, we start by focusing on mobile herds in isolation to determine whether mobile herds can sustain FMD transmission. Answers to this question will advance our understanding of disease dynamics in mobile pastoral systems.
Spatial and temporal heterogeneity in host density plays an important role in disease transmission and it is therefore critical to capture the dynamics of contact patterns in the region before we can effectively model the transmission of the disease. While different approaches have been developed in the literature to incorporate heterogeneity into epidemiological models for infectious diseases (Kao 2003; Doran and Shawn 2005; LeMenach, et al. 2005; Riley 2007; Tildesley et al. 2008), few have incorporated dynamic contact networks such as transhumance of mobile pastoralists. Because individuals have different contacts at any given time and the contacts change consecutively for the entire network depending on the individuals’ movements, prior population-based models do not take into account this level of individual heterogeneity in contacts over time.
The network-based methods, address the heterogeneity of contacts among individuals by describing the contact structure as a network formed by nodes, representing hosts, and edges representing the contacts, or better, the distance between hosts (see also Christley et al. 2005; Kiss et al. 2006; Keeling et al. 2010; Bian and Liebner 2007; Bian 2004). In our case, the contact network constantly changes because the herds continuously move. For this reason, we develop an agent-based model to help capture the dynamic contacts between individual mobile herds over time. Agent-based models (ABMs) have been used in many epidemiological studies (Eubank et al. 2004; Barrett et al. 2008).
Previous published models have incorporated heterogeneity in a variety of ways to examine spatiotemporal dimensions of FMD transmission. Dion et al. (2011) developed an object-based model, named EPIFMD (EPIdemiology of FMD) to explore how landscape heterogeneities (i.e., wildlife and livestock) influence the epidemiology of FMD in southern Africa. Bates et al. (2003) introduced a spatial stochastic epidemic simulation model using Monte-Carlo simulation to evaluate eradication strategies of FMD in California. Using UK 2001 FMD epidemic data, Ferguson et al. (2001) demonstrated movement restrictions would be effective to control the outbreak. Keeling et al. (2001) introduced an individual farm-based stochastic model and showed that the spatial distribution of farms as well as size and species compositions of farms have an effect on outbreak patterns in space and time when the farms remain in constant locations. While Ferguson et al. (2001) looked generally at changes to contact structure or transmissibility of FMD over time and the others added aspects of random stochasticity to contacts, but none treated the contact network as fully dynamic based on known patterns.
In our model, a camp with multiple pastoral households and herds is represented as one agent that has its own movement rules and we derive these rules from our transhumance survey data (Moritz et al. 2010; Moritz et al. 2013; Xiao et al. 2015). In the model, we identify the mobile pastoralists that have contact with each other during transhumance and use an epidemiological model to simulate disease transmission within and between herds. The model allows us to answer the question whether an FMD endemic can be sustained in mobile pastoralists’ herds in the region without having interaction with other infection sources.
In the remainder of this paper, we discuss the study area and the collection of movement data from the pastoralist population in Section 2. The details of the agent-based model and the epidemiological model are discussed in Section 3 and in the Appendix. Computational experiments and comparison of the model to data are presented in Section 3. We conclude the paper with a discussion of our finding that mobility plays a critical role in disease transmission and an evaluation of our modeling approach.
Data and methods
A critical step in developing the agent-based model (ABM) is the understanding of how the agents move in our study area. In this section, we first describe the data and analysis and then we discuss the ABM for FMD transmission in the herds using a susceptible-infected-recovered (SIR) model where the contacts between individual herds are dynamically computed through the simulation.
Spatial and temporal movements of pastoralists
The Far North Region of Cameroon has a semi-arid climate which has four seasons: rainy, cold dry, hot dry and transition season (Moritz et al. 2013). Seasonal changes allow long-range movements of pastoralists between ecological zones where pastoralists move about 100-250 km. Transhumance allows pastoralists to take advantage of the changes in the spatiotemporal distributions of forage and water and maximize grazing for their livestock during the dry season. This is usually referred to as transhumance (Stenning 1957). Mobile pastoralists in the Far North Region move with their livestock between rainy season and dry season pastures. During the rainy season (June to September), pastoralists are in the south of the region. At the end of the rainy season, they move along transhumance routes to the Logone floodplain which has abundant grass during the cold dry (October to January) and hot dry seasons (February through May) (Moritz et al. 2010).
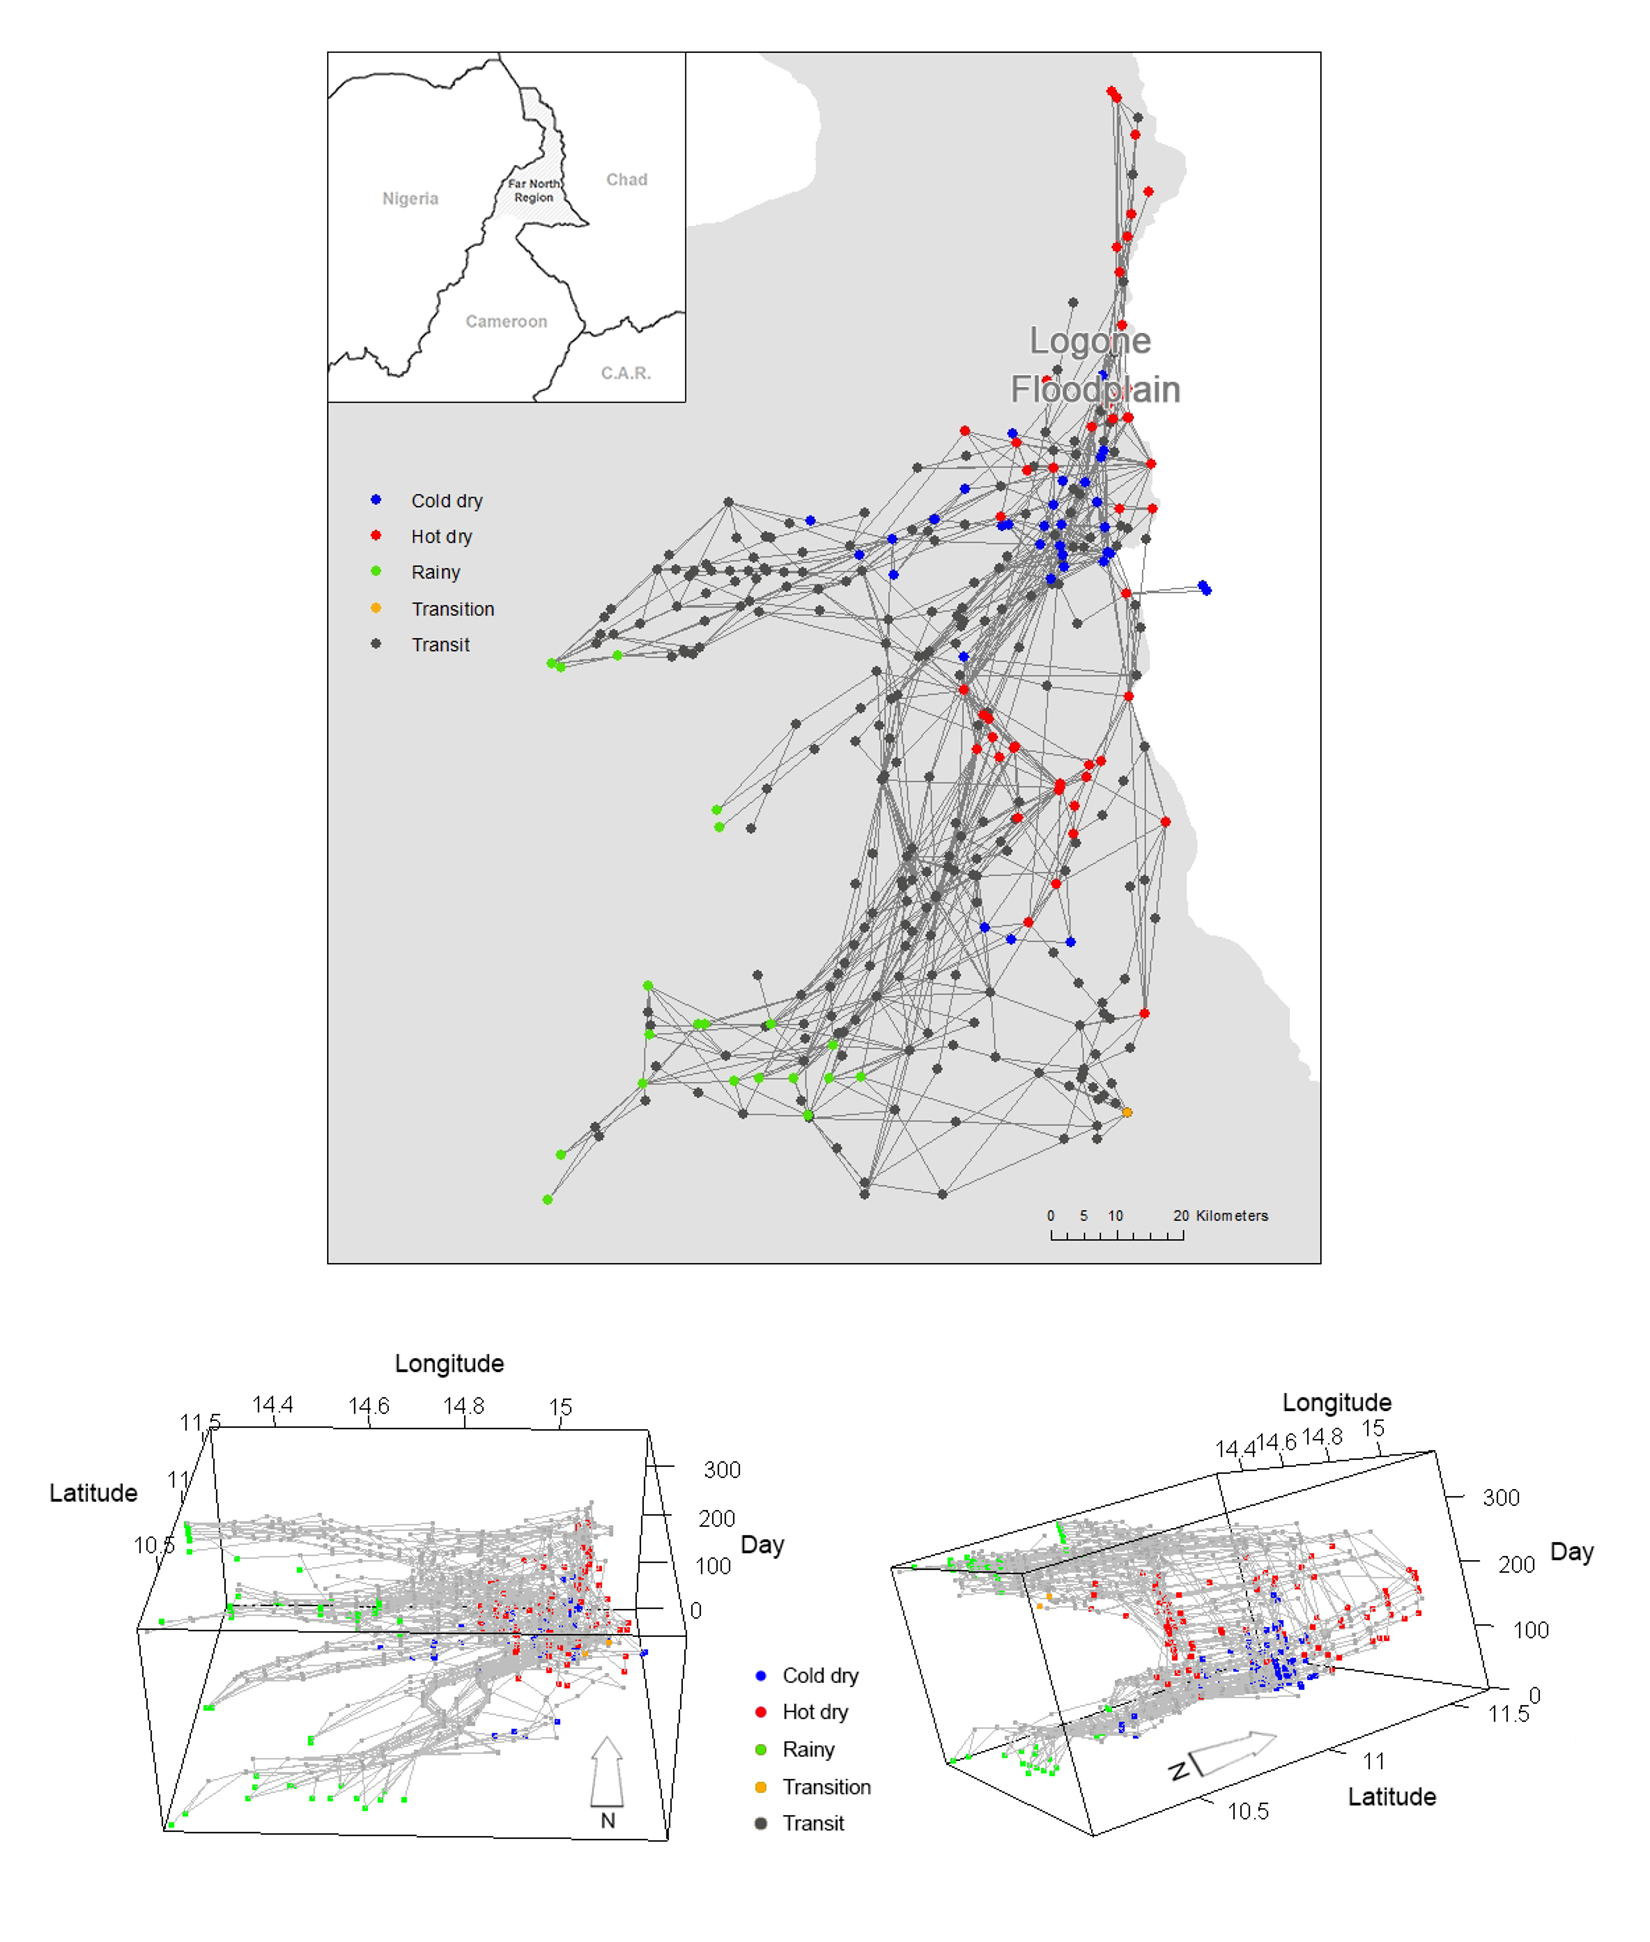
We have conducted transhumance surveys to document how pastoralists move in the region. In this survey, pastoralists were asked to recall their daily locations of the previous year and how long they stayed in each location (Moritz et al. 2013; Xiao et al. 2015). The data set allows us to reconstruct the spatial and temporal trajectories of the pastoralists. In general, there are several groups of pastoralists who follow similar transhumance routes according to the location of their campsites and timing (i.e., where the groups are at a point of time and how long they stay at the point). Each of these groups is called a camp and 67 camps were surveyed in the data in the year 2007-2008 (Figure 1). Based on the survey data we identified whether pastoralists’ movements occur during a particular season or whether pastoralists are in transit between seasonal grazing areas. The pastoralists have their seasonal grazing areas where they tend to stay at sojourn campsites for longer periods (typically >20 days) before they move to another location. When pastoralists move between these zones, they typically stay only for a few days in transit campsites along the transhumance corridors.
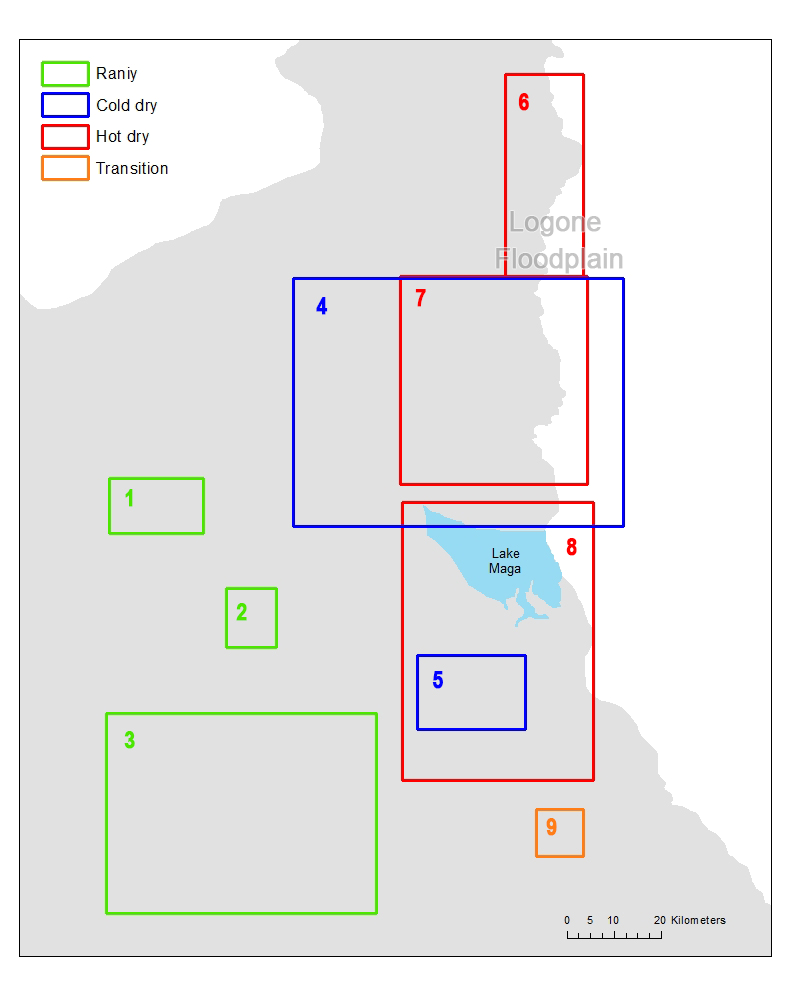
In order to understand the movement patterns of the pastoralists, we first identified the grazing zones and then detected the sequence of the zones that each pastoralist follows in each year. According to the location of the campsites and the time each campsite is used by the camps, we assigned each campsites to one of the four seasons, rainy, cold dry, hot dry and transition, respectively. We plotted all campsites by season on a map (Figure 1) and after inspecting the map visually (i.e., if campsites in a same season are adjacent to one another, we considered that they are in a same zone), we found multiple campsite clusters for each season (three for rainy season, two for cold dry season, three for hot dry season, and one transition). We then drew a 5-km buffer for each campsite to depict the potential daily grazing area. The decision to use a 5-km buffer was based on the fact that it is a good approximation to the average daily herding radius of 4.5 km obtained from the GPS tracking data (Moritz et al. 2010). Finally, we drew minimum bounding rectangles that envelop all campsites and their buffers by each cluster for each season to represent all seasonal zones. Using this procedure we detected 9 seasonal zones in which pastoralists stay during each season (Figure 2).
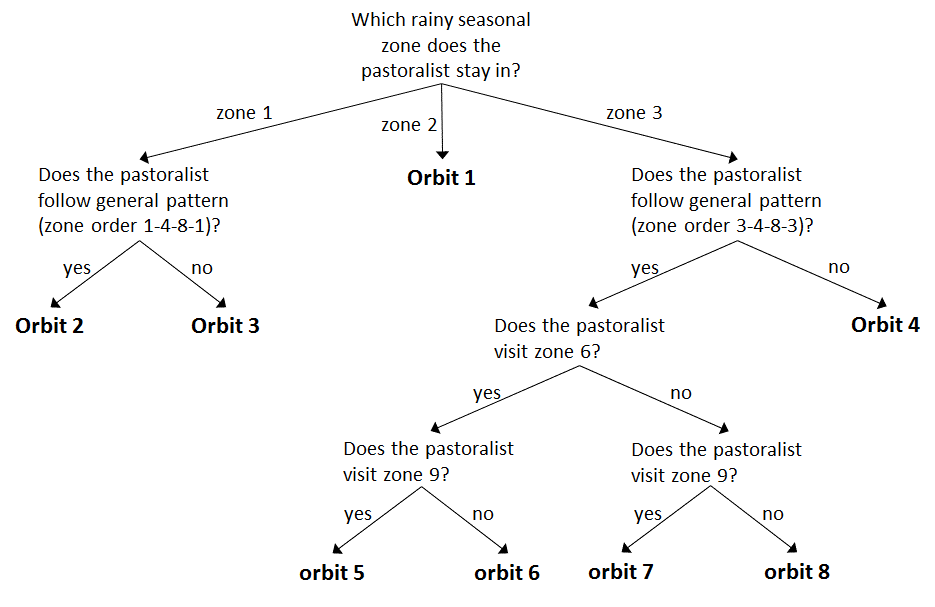
In order to detect whether there were patterns in the seasonal transhumance movements or that all seasonal rounds were unique, we compared them to examine which seasonal rounds were similar and overlap in space and time. Analysis on the transhumance data has indicated that groups of pastoralists tend to share the same set of sequence of zones. We further identified these sequences and called each of them an orbit. To detect such orbits, we drew the movement path of each camp by sequentially connecting lines between campsites that are visited by the camp. This results in a flowchart (Figure 3) and we used it to identify the orbits using three criteria: (i) whether pastoralists start with other pastoralists that leave from the same rainy seasonal zone, (ii) whether pastoralists visit extreme far north areas (zone 6), and (iii) whether pastoralists visit transition area (zone 9) at the end of a dry season. Because all pastoralists stay in one of the three rainy seasonal zones and move at the end of rainy season, we started the identification of the orbits by examining the rainy seasonal zone where the pastoralists stay. If there is a unique sequential zone movement, then the movement becomes an orbit. In our data, movements starting from zone 2 stand alone as a unique sequential zone movement, and we classified them as orbit 1. General movement pattern showed that most pastoralists move toward cold dry seasonal zone 4 at the end of rainy season, move toward hot dry seasonal zone 8 followed by cold dry season, and come back to their rainy seasonal zone. If some of the pastoralists move toward different cold or hot dry seasonal zone, we assigned them to different orbits. During hot dry season, some pastoralists, especially young herders, move further into northern area (zone 6) with strongest animals. These pastoralists were also assigned to different orbits. At the beginning of the rainy season, all pastoralists come back to their rainy seasonal zone and some of them visit transition area (zone 9) on their way back. (Figure 4) shows the 8 orbits.
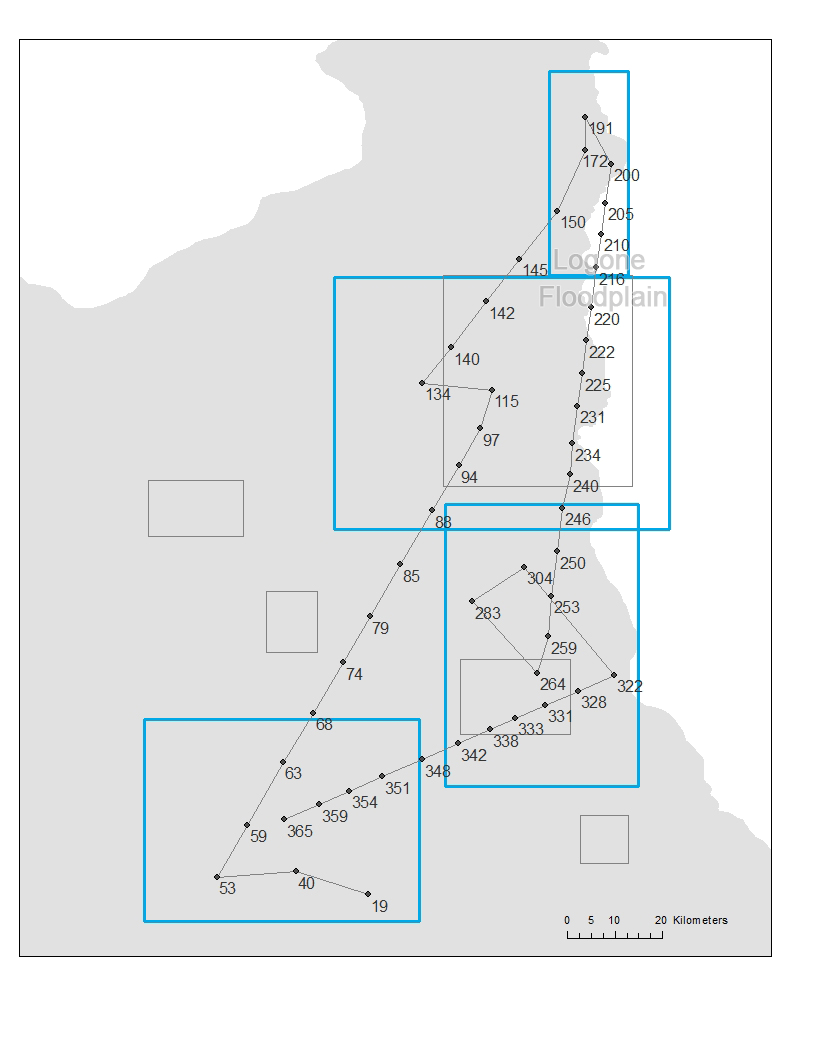
Once the orbits and zones were identified, we calculated the average time for the pastoralists to arrive and leave each zone for each orbit. These times provide a movement schedule that mimics the timing of the seasonal movements. For example, a pastoralist in orbit 6 will have arrival and leaving dates at days 365 and 53 (rainy season) for zone 3, days 97 and 134 (cold dry season) for zone 4, days 150 and 200 (hot dry season) for zone 6, and days 264 and 322 (hot dry season) for zone 8, where all the times are calculated using the mean arrival and leaving times of the pastoralists in this orbit. (We note that day 1 refers to August 16, the starting date of our data analysis, which makes the leaving date for zone 3 smaller than the arrival date.) Each camp is represented as an agent in the model and we speculate that an agent will start to leave a zone at the specified leaving date. By leaving a zone, the agent will start to use a transhumance mode so that it stays at a location for a short amount of time (around 4 days). Between the arrival and leaving dates, the agent randomly finds a location within the corresponding zone (this random location can have any x and y coordinates within the zone) and stay there for a number of days that follows a uniform distribution between 18 and 22 days. This range is used because (1) 20 days of stay was used to identify the zones and (2) it gives certain randomness in the stays for each agent. Before the leaving date is reached, the agent continues to choose a random location and duration of stay in the zone. At the leaving date, the agent starts a directional movement toward the next zone in the orbit. The direction of the movement is determined by the angle between the current location of the agent and the center point of the next zone. A linear movement is used to guide the agent move toward the next zone. The agent stays at each location on the line for 2 to 6 days (randomly chosen using a uniform distribution). The distance of each move on the line between two stops is randomly decided following a uniform distribution between 9 to 11 km (the average moving distance in the data is 10 km with a standard deviation of 0.7 km). Once the arrival date of the next zone is reached, the agent resumes the mode of moving randomly in the zone and staying in each location between 18 and 22 days. Using the movement described above, we can simulate the trajectory of pastoralists in each orbit (Figure 5).

Agent-Based Disease Model
The main purpose of the agent-based model is to help us understand the impact of the seasonal movements and daily grazing activities of the mobile pastoralists on foot-and-mouth disease (FMD) transmission in the Far North Region of Cameroon. We simulate the transmission of FMD among animals using an SIR model that analyzes the change of three population portions representing three critical stages of FMD: susceptible (S), infectious (I), and recovered (R). SIR models are commonly used in modeling disease transmission and there are two approaches to deriving the parameters, density-dependent and frequency-dependent (Keeling and Rohani 2008). FMD virus transmission is usually modeled with a density-dependent approach because this approach assumes an intuitive linear relationship between the host density and the contact rate ( Smith et al. 2009; Kao and Kiss 2010). Our model only concerns contacts between herds, we choose to use the frequency-dependent transmission approach to avoid scaling of contacts with population. To isolate the effect of herd movements on disease transmission, the disease transmission rate does not depend on herd size.
In our SIR model, we assume that the recovered individuals are immune for the whole year (Pomeroy et al. 2015). We also do not consider births and deaths in a year, because it is a relatively short epidemic time scale and thus we ignore the demographic effects on the population. As a result, the frequency-dependent SIR model calculates transitions of individuals among compartments using the following equations:
| $$ \begin{split} \frac{dS}{dt} & = -\beta \frac{SI}{N} \\ \frac{dI}{dt} & = \beta \frac{SI}{N}-\gamma I \\ \frac{dR}{dt} & = \gamma I \end{split}$$ | (1) |
The dynamics of disease transmission depend on the basic reproduction ratio, R0, which can be described as follows:
| $$ R_0 = \frac{\beta}{\gamma}$$ | (2) |
The ratio is derived as the number of secondary cases transmitted from a single infected individual onto individuals in the susceptible population. Hence, when R0>1, an epidemic in the susceptible population will occur and the number of cases will increase.
The traditional way of simulating disease transmission using SIR models as described above may not work in a highly heterogeneous environment caused by constant movements of the population in the region. In our case, it is the seasonal movements of the pastoralists that lead to the heterogeneity. To address this issue, we first need to determine the mechanism of contact between FMD hosts. We assume that the main interaction of herds comes from sharing a common grazing area and we represent the potential grazing area of each pastoralist using a circle with a fixed radius around the its campsite. The same radius is used as a constant for the entire year. Though we have found that a 5 km grazing distance is common in area in the dry season (Moritz et al 2010), we will also test other radius values in our experiments.
To simulate FMD transmission in our agent based model, each agent has an associated number of animals in the S, I, and R stages as an attribute. Agents move based on their orbit. Within a season, agents stay at a location for around 20 ± 2 days. After 20 ± 2 days, they move to a random location within the seasonal zone. At the end of the season, agents move toward the next seasonal zone. While in transit, they stay at one location for 2~6 days.
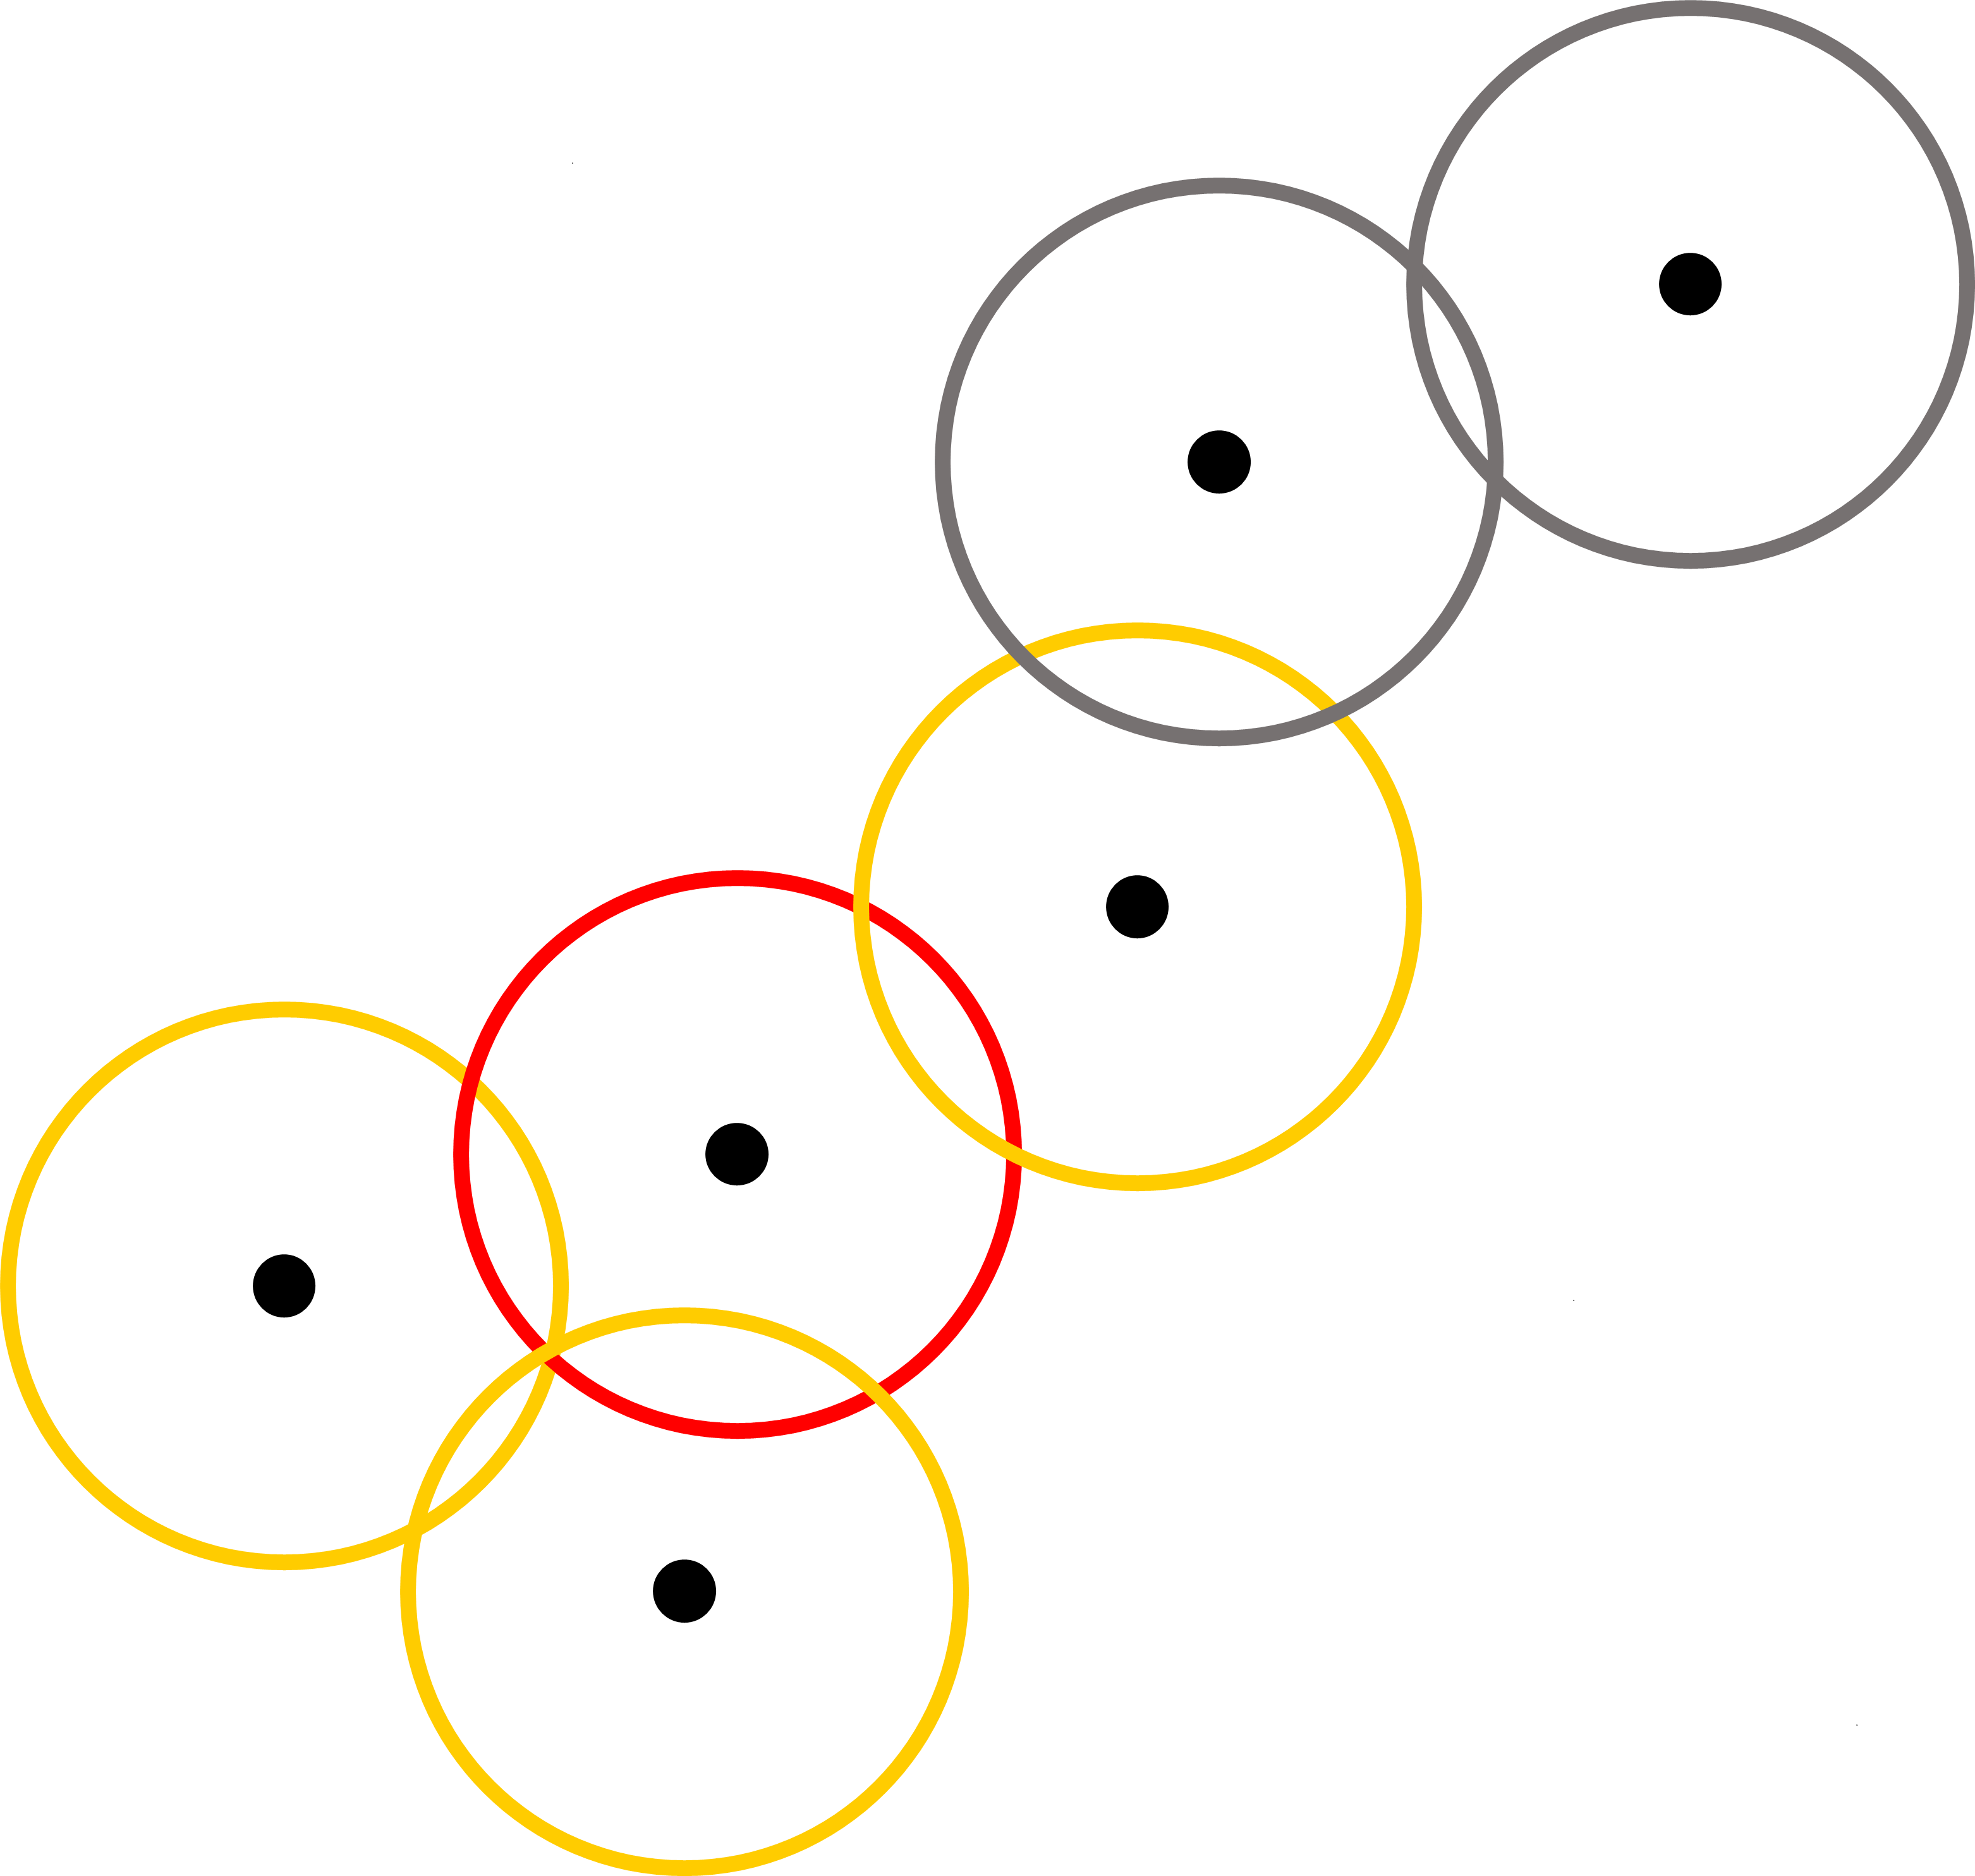
If an agent has at least one infected animal, which is referred as an infected agent, the infected animal can transmit the FMD virus to the susceptible animals in the same agent as well as to other agents that have contact with this agent. In our model, contact between agents are established using grazing area that each agent can possibly reach for daily grazing (pastures in our study region are in relatively flat savannah landscapes, and therefore terrain differences should not change the radius of grazing area to any large extent). For an agent that has at least one infected animal, the model searches for a cluster of agents whose grazing area overlap with the grazing area of the infected agent (see the red and yellow circles in Figure 6). Animals in these agents are then considered together as a fully mixed population that is then used in the SIR model.
The model proceeds in daily time steps, for 365 days. Within each time step, agents decide whether they stay at the current location or move toward the next location. If they decide to move, then they determine the next place according to their orbits. The next step is to examine the spread of FMD virus. The model treats all infected agents and the agents that share the grazing area with infected agents as a population in the SIR model. After the completion of the SIR model, the updated values of S, I, and R for the animals are redistributed back to each agent. This process continues until the end of the simulation.
After each time step (1 day), we recalculate the S, I, and R values for each agent using the proportion of the previous values for each agent. Specifically, we have
| $$ \begin{split} dS_i(t) & = \frac{S_i}{S}dS(t) \\ dI_i(t) & = \frac{I_i}{I}dI(t) \\ dR_i(t) & = \frac{R_i}{R}dR(t) \\ \end{split}$$ | (3) |
Experiments
The models were used in a series of in silico experiments to demonstrate the ability of the model to capture the dynamics of FMD transmission in a setting with seasonal transhumance movements and to assess the sensitivity of the model to changes in different parameters. For these experiments, all agents are initially in the susceptible category. Though this is an endemic population, the assumption is reasonable because we have demonstrated that new FMD strains do pass through the population (Ludi et al. 2014) and that immunity does wane over time for most FMD serotypes (Pomeroy et al. 2015). In our model, we use agents to represent camps consisting of multiple households and herds and each agent has 200 animals and the reason is that each camp, represented by an agent in the model, consists of 50 to 1,000 animals with an average of about 200 animals. Because our model aims to examine seasonal and daily movements of herds and their impacts on FMD transmission, we attempt to isolate the effect of the herd size without the added stochasticity of herd size heterogeneity. By defining disease as having at least one infected animal at a given time and place, we partially control the influence of fixing herd size on our overall conclusions. Considering a different number of animals per agent should, however, not affect the epidemic pattern generated by our model. The major role that the number of animals per agent plays is that it just proportionally scales the size of infected animals per unit of time. Therefore, we suppose that including more animals per agent in our model would generate very similar dynamic epidemic pattern documented in our paper.
Each year the survey data starts on August 16, a day in the rainy season before the herders start their transhumance toward the dry season zones. We use the same date to start of simulation for the sake of consistency. The model has 67 agents and each of them represents a camp of mobile pastoralists with 200 animals. These agents are placed in the three rainy season zones: 14 in the zone 1, 4 in the zone 2, and 49 in the zone 3 (see Figure 2). We initiate an FMD infection in a randomly selected animal at a random location. Because we are interested in whether the time of infection start significantly impacts FMD transmission, we designed three experiment scenarios: FMD starts on day 1 and day 31 when pastoralists are still in their rainy season zones and on day 61 when they migrate to cold dry season zones along transhumance routes where they are spatially close. Because most pastoralists stay in the Logone floodplain in the dry season and they are close enough to form a fully mixing population, we exclude the uninteresting scenario that FMD starts during the dry season.
Table 1 summarizes the parameters used in this paper. The recovery rate (γ) varies from two to three weeks (Doel 2005; Sanson 1994). We use a fixed value of 0.0588 to specify a 17-day recovery process, which seems to be the average recovery value observed in the literature. We run the model with a buffer size of 1, 3, 5, and 100 km. Our choice is guided by the fact that during each day, pastoralists move their animals to nearby areas for grazing. The actual size and shape of these areas vary, but data from previous research indicates that the average daily herding radius during dry season is 4.5 km (Moritz et al. 2010). Daily herding radius is likely smaller during the rainy season than in the dry season. In the rainy season, forage available spaces are widespread and thus it is easy to obtain access to higher quality forage and water resources, whereas forage available spaces and watering points are limited in the dry season (Butt 2010; Turner et al. 2014). The largest buffer (100 km) represents a fully mixing population that ensures all herds are in a single SIR population throughout the entire simulation, meaning all animals in the whole Far North Region have the same contact rate with each other. This would be reasonable if one considers unrecorded movements of animals between herds and markets, movement of humans by foot and vehicles as fomites, and other potential mechanisms of environmental transmission (Mahy 2005).
The reproduction ratio, R0, also varies from 2.52 to infinity in the non-vaccinated cattle group (Orsel et al. 2005; Orsel et al. 2007; Ster et al. 2012). To investigate wide range of contagious pattern, we assume that R0 takes values 2-12. Then based on equation 2, we obtain the transmission rate range of 0.1176-0.7056. So, for our simulation we pick the following values: 0.1, 0.3, 0.5, and 0.7.
| Parameter | Value |
|---|---|
| First day FMD introduced | 1, 31 and 61 |
| Number of agents (herds) | 67 |
| Number of animals per herd | 200 |
| Buffer size (km) | 1, 3, 5, 10 and 100 |
| Transmission rate | 0.1, 0.3, 0.5 and 0.7 |
| Recovery rate (γ) | 0.0588 |
We built the agent-based model using a Java-based agent-simulation toolkit called MASON (Luke et al. 2004). We used a circle to represent the potential area and a fixed radius for the buffers for all agents for the entire year. We changed the buffer size to explore the impact of grazing behaviors. The simulation length is one year to match the time it takes pastoralists to come back to the starting point of their orbits. For each combination of the parameters in Table 1, we run the model 300 times to obtain an overall distribution of infected individuals.
Results
Sensitivity to parameters
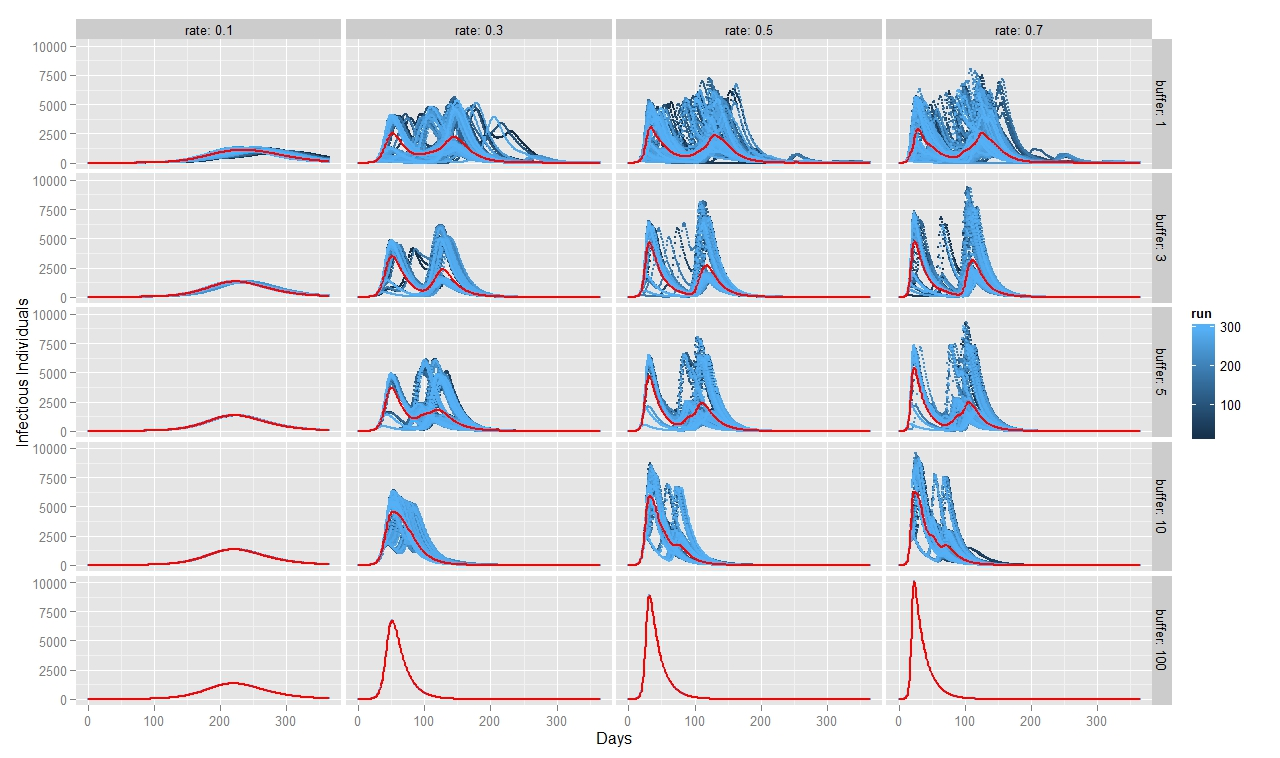
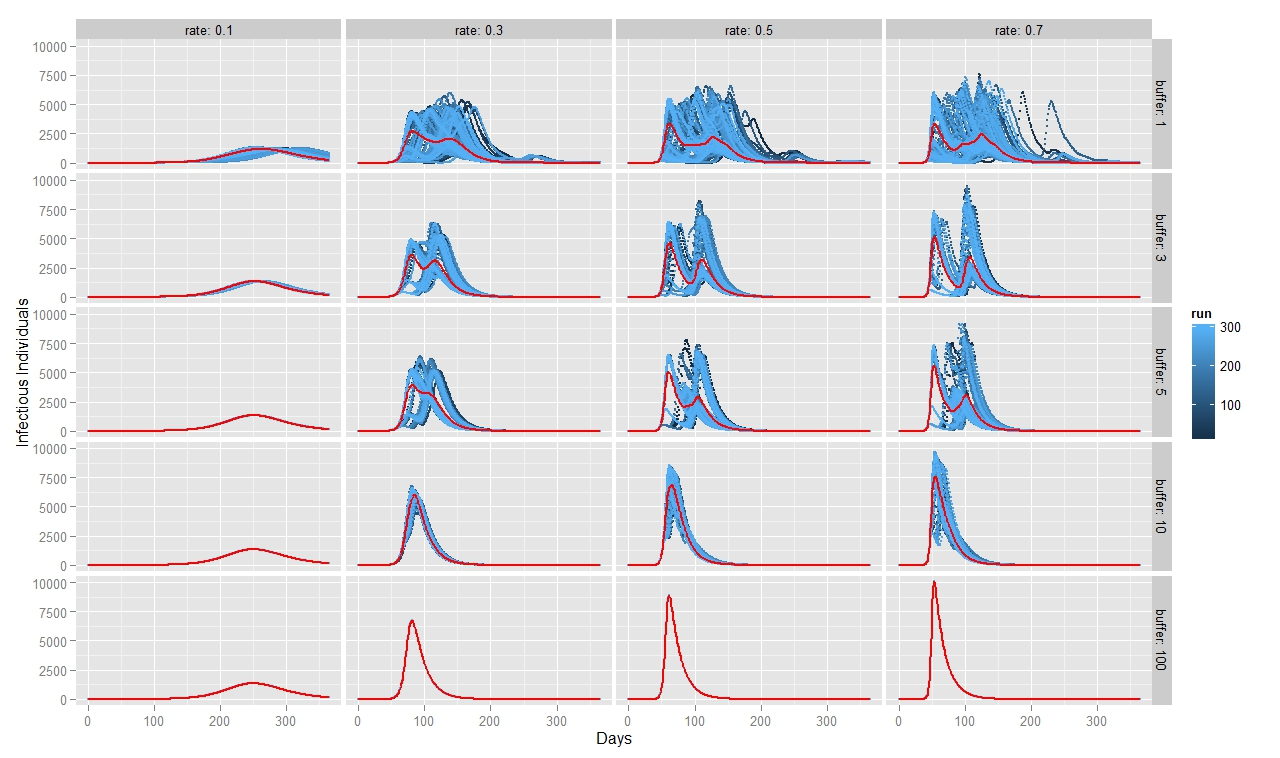
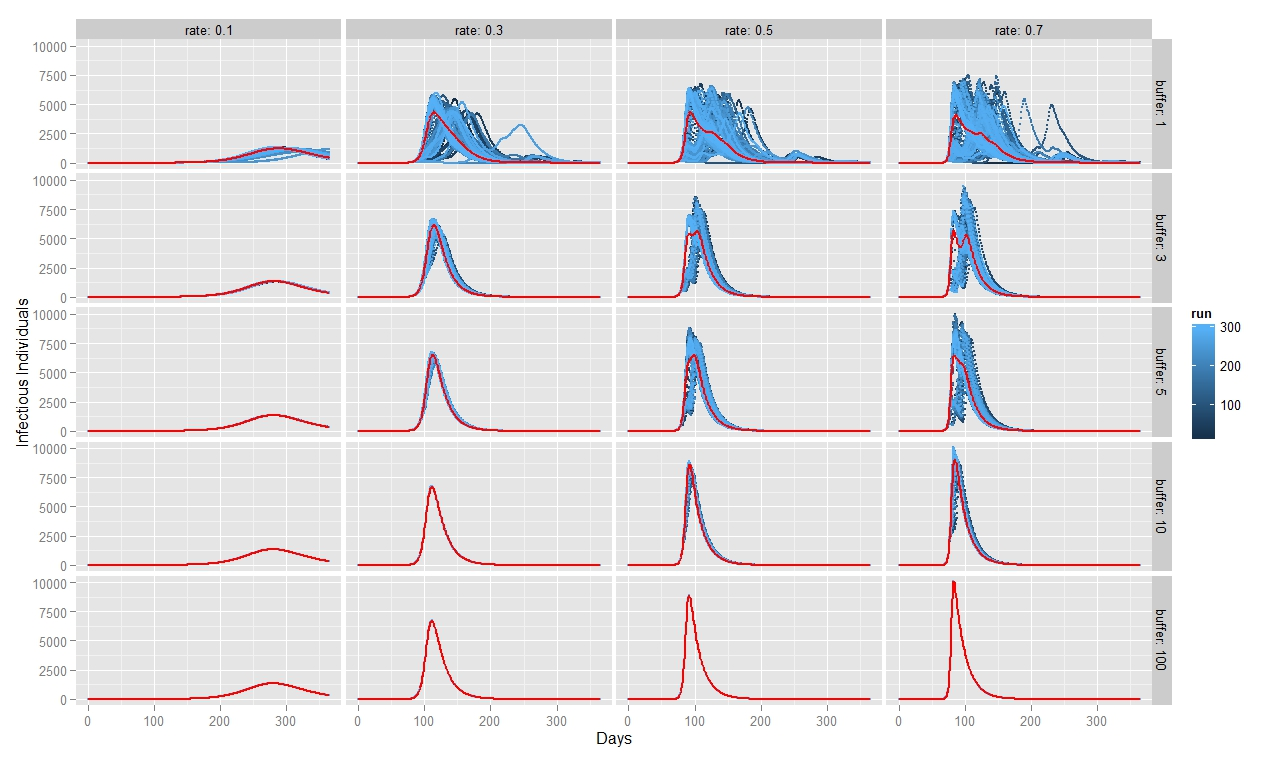
To quantify FMD dynamics when the outbreak was initiated at the beginning of a rainy season, we simulated our model under seasonally appropriate transhumance conditions, which means that the agents have a relatively big grazing area, so they graze farther apart from each other. Coupled with the fact that the outbreak begins at the beginning of the rainy season, the initial number of infectious animals is relatively small and reoccurs after some time when the animals reach a new small grazing area during a dry season (Figure 7). This causes the double peak in the distribution of infectious animals. When FMD starts in the middle of the rainy season (Figure 8) or during the herd transition between rainy and dry seasons (Figure 9), animals move to a small grazing area sooner because of a coming dry season. Consequently, the double peak in Figure 7 and Figure 8 is less pronounced (Table 2). Figure 8 depicts that many more animals get infected because they move more closely together. Thus, the single peak distribution of the infected animals is observed.
| Transmission rate | |||||
|---|---|---|---|---|---|
| Scenario | Buffer | 0.1 | 0.3 | 0.5 | 0.7 |
| 1 | 1 | 0.0 | 100.0 | 99.7 | 99.7 |
| 3 | 0.0 | 100.0 | 100.0 | 100.0 | |
| 5 | 0.0 | 100.0 | 100.0 | 100.0 | |
| 10 | 0.0 | 36.3 | 65.7 | 74.7 | |
| 100 | 0.0 | 0.0 | 0.0 | 0.0 | |
| 2 | 1 | 0.0 | 90.3 | 100.0 | 100.0 |
| 3 | 0.0 | 60.0 | 100.0 | 100.0 | |
| 5 | 0.0 | 49.7 | 100.0 | 100.0 | |
| 10 | 0.0 | 2.3 | 27.0 | 40.7 | |
| 100 | 0.0 | 0.0 | 0.0 | 0.0 | |
| 3 | 1 | 0.3 | 19.7 | 77.7 | 98.3 |
| 3 | 0.0 | 0.3 | 36.7 | 98.0 | |
| 5 | 0.0 | 0.0 | 40.0 | 74.3 | |
| 100 | 0.0 | 0.0 | 0.0 | 0.0 | |
To quantify FMD dynamics based on grazing behavior, we simulated our model under grazing area sizes with a 1, 3, 5, 10 and 100 km radius. Figure 7 illustrates that when the grazing area is small (row 1), herds are more isolated which inhibits the disease contagion. This results in a lower epidemic peak than with bigger buffer sizes (rows 2, 3 and 4). When herds graze on a bigger area, they contact more frequently with each other and spread the FMD virus faster. This leads to a more pronounced first peak of the disease transmission (rows 2, 3 and 4 in Figure 8). The dynamic pattern differs much more across simulations for grazing area with radius of 1km, because the FMD outbreak location matters more when agents are isolated. The bigger the grazing area, the more likely are agents to contact with each other in short period of time. As a result a higher number of animals gets infected during the first days since the FMD outbreak. Rows 2, 3 and 4 in Figure 7 depict this as a higher first peak of the FMD outbreak. Compared with Figure 7, 8 and 9 exhibit a diminished dynamic pattern due to the fact that agents are already close to each other at the onset of FMD outbreak.
The last row in Figure 7, 8, and 9 shows that a buffer of 100 km is sufficient to contain all heads in one population (e.g., fully mixing population). It represents the case of population based epidemic model. Moreover, it emphasizes that the location of the FMD outbreak plays no role in this kind of model because all herds are connected throughout the entire simulation path. Therefore, all 300 runs of simulations are identical. Figures also show that for a buffer size of 10 km, 300 runs of the model for each parameter combination yield almost identical curves as for a fully mixing population under each transmission rate. The buffer size of 10 km is sufficient to allow animals enough space so that they act as if they were in one population.
For all three scenarios, the transmission rate of 0.1 appears to be too low for buffer size to play a significant role. However, for a given buffer the simulation results are very similar across transmission rates of 0.3, 0.5, and 0.7 for each considered case. The only difference seems to be the epidemic size. We therefore note that, under our modeling setting, transmission rate does not appear to significantly change the overall FMD dynamics, especially when the rates are greater than 0.3.
Model compared to survey data
Disease incidence data were obtained by interviewing 15 mobile pastoralist herders at least twice a year (once during the rainy season and once during the dry season). The herders were asked the following question about all animals in five cattle families in their herds: “When did this animal last have FMD?” The herder reports were found to be a reliable source of information about the FMD occurrence for each animal. Maasai who are pastoralists in Kenya and Tanzania documented that the accuracy of herder diagnosis of FMD was about 73% at herd level when compared with the laboratory diagnosis (Catley et al. 2004). We use the obtained incidence data as a point of comparison for our simulation results and to validate our model.
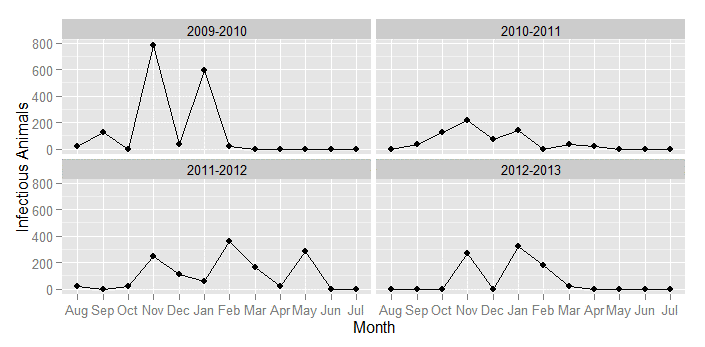
The simulation results show that grazing behavior represented by the radius significantly affects the dynamics of FMD. When the grazing area is 100 km, the 300 runs of the model for each parameter combination yield almost the same curves as the results using a fully mixing population under each transmission rate. Small grazing area (≤5 km radius), on the other hand, yields different results depending on where the first FMD infection occurs. Because of heterogeneity in agents’ mobility, our simulation results produce, on average, multiple epidemic peaks a year. Even though this contrasts the standard SIR model, which produces only one peak, our results are in line with appropriately scaled empirical evidence that we obtain from herder reports of clinical sign of disease over the last four years (Figure 10).
We show the percentage of simulations in which each run has more than one peak in Table 2. Results in this table confirm the observations from the previous figures that two peaks occur in vast majority (in more than 90% runs) of simulations under scenarios 1 and 2. However, when the disease is initiated during the animal transition path, the models generates almost no double peaks unless the transmission rate is increased to 0.5.

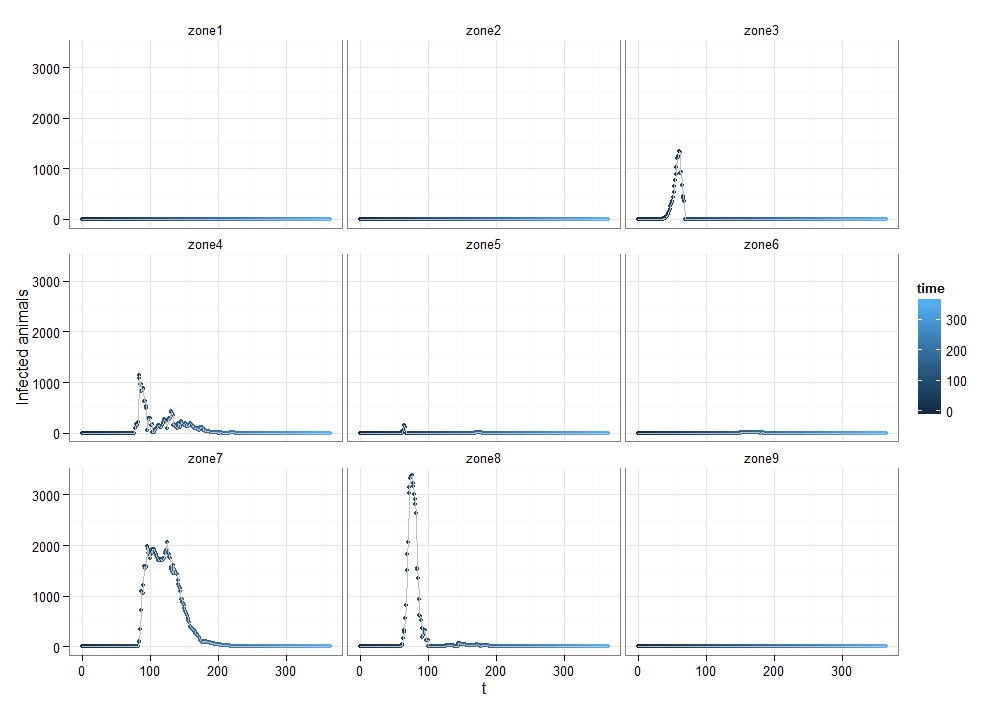
Figure 11 illustrates the spatial pattern of the FMD transmission among agents (the simulation is conducted under scenario 2, with a 0.5 transmission rate and a 1km buffer size). Most agents get infected in the cold and hot dry seasonal zones. This pattern can be explained by pastoralists’ seasonal movements. Because the Logone floodplain is located in dry seasonal zones and has abundant grass during these seasons (Moritz et al. 2010), most pastoralists move toward the Logone floodplain. We believe that they contact with other pastoralists in the meantime and have a higher chance of getting infected. This situation is likely to increase the chances of transmitting the FMD virus. For this reason, a large number of animals get infected in the cold and hot dry seasonal zones, especially, in zones 4, 7, and 8 (Figure 12).
Discussion and conclusions
An important finding of this paper is that the simulation results in this paper demonstrate that after a year the FMD outbreak ceases implying that mobile herds only cannot produce a completely endemic situation. Using an agent-based model to capture the movements of mobile herds whose mobility rules are derived from a transhumance survey data, we demonstrate that a smaller grazing area allows FMD to transmit in small clusters of herds which defers the spread of the disease to other herds resulting in two epidemic peaks. This is in line with our empirical evidence that we find in herder reports. It is clear that a sound explanation of the endemic in the Far North Region must include other factors such as the roles of sedentary and international trans boundary herds and possible FMD carriers. We believe a more comprehensive investigation is needed, which will require a broader data collection process to allow more factors to be considered.
Our model provides an effective methodological framework to represent daily and annual movement of herds and to explore their impact on FMD transmission. By employing an ABM model, we successfully incorporate individual herd movements in the simulations and bring the model closer to the data. Starting FMD at different time points shows different dynamic patterns of FMD outbreak. The timing matters, because pastoralist seasonal movement affects the proximity of animals with respect to each other. If the FMD outbreak starts relatively early, then there are usually two peaks of the FMD outbreak because herds are more scattered and contact with other herds is minimal. The second peak of FMD outbreak usually diminishes when the FMD starts relatively late in the simulation because herds are close to each other as they move towards dry seasonal zones.
One of the limitations of our model is that we consider only mobile herds. We aim to relax the assumption of modeling only mobile herds in our future research and allow for sedentary herds as well. This way we think we will be able to capture the disease transmission more realistically relative to the endemic situation in Cameroon. Moreover, we plan on modeling births, deaths, and waning immunity to capture more aspects of the reality. Lastly, we assume in our model that the disease transmission rate does not depend on the herd size. However, it could be the case that the transmission rate may increase with the size of each herd. We leave this extension for future research.
Acknowledgements
This work was supported by grants from the National Science Foundation (DEB-1015908, BCS-0748594). We are also grateful to collaborators in Cameroon, including the Center for the Support of Research and Pastoralism (CARPA), the University of Ngaoundére, the University of Maroua, the National Veterinary Laboratory (LANAVET), the Ministry of Agriculture, Fisheries, and Animal Industries (MINEPIA), and the Ministry of Scientific Research and Innovation (MINRESI). Finally, we thank the Global Foot-and-mouth disease Research Alliance (GFRA).Appendix
References
Alexandersen, S., Zhang, Z., Donaldson, a. I., & Garland, a. J. M. (2003). The pathogenesis and diagnosis of foot-and-mouth disease. Journal of Comparative Pathology, 129(1), pp. 1–36. [doi:10.1016/S0021-9975(03)00041-0]
Barrett C, Bisset K, Eubank SG, Feng X, & Marathe, M. (2008). EpiSimdemics: An efficient and scalable framework for simulating the spread of infectious disease on large social networks. International Conference for High Performance Computing, Networking, Storage and Analysis (SC08), (November).
Bates, T. W., Thurmond, M. C., & Carpenter, T. E. (2003). Description of an epidemic simulation model for use in evaluating strategies to control an outbreak of foot-and-mouth disease. American journal of veterinary research, 64(2), pp. 195-204. [doi:10.2460/ajvr.2003.64.195]
Bian, L. (2004). A conceptual framework for an individual-based spatially explicit epidemiological model. Environment and Planning B: Planning and Design, 31(3), pp. 381–395.
Bian, L., & Liebner, D. (2007). A Network Model for Dispersion of Communicable Diseases. Transactions in GIS, 11, pp. 155– 173. [doi:10.1111/j.1467-9671.2007.01039.x]
Bronsvoort, B. D. C., Nfon, C., Hamman, S. M., Tanya, V. N., Kitching, R. P., & Morgan, K. L. (2004). Risk factors for herdsman-reported foot-and-mouth disease in the Adamawa Province of Cameroon. Preventive Veterinary Medicine, 66(1), pp. 127-139.
Bronsvoort, B. M. D. C., Tanya, V. N., Kitching, R. P., Nfon, C., Hamman, S. M., & Morgan, K. L. (2003). Foot and Mouth Disease and Livestock Husbandry Practices in the Adamawa Province of Cameroon. Tropical Animal Health and Production, 35(6), pp. 491–507. [doi:10.1023/A:1027302525301]
Butt, B. (2010). Seasonal space-time dynamics of cattle behavior and mobility among Maasai pastoralists in semi-arid Kenya. Journal of Arid Environments, 74(3), pp. 403–413.
Catley, A., Chibunda, R. T., Ranga, E., Makungu, S., Magayane, F. T., Magoma, G., Madeged, M.J. & Vosloo, W. (2004). Participatory diagnosis of a heat-intolerance syndrome in cattle in Tanzania and association with foot-and-mouth disease. Preventive veterinary medicine, 65(1), pp. 17-30. [doi:10.1016/j.prevetmed.2004.06.007]
Christley, R. M., Pinchbeck, G. L., Bowers, R. G., Clancy, D., French, N. P., Bennett, R., & Turner, J. (2005). Infection in social networks: Using network analysis to identify high-risk individuals. American Journal of Epidemiology, 162(10), pp. 1024–1031.
Dion, E., VanSchalkwyk, L., & Lambin, E. F. (2011). The landscape epidemiology of foot-and-mouth disease in South Africa: A spatially explicit multi-agent simulation. Ecological Modelling, 222(13), pp. 2059–2072. [doi:10.1016/j.ecolmodel.2011.03.026]
Doel, T. R. (2005). Natural and vaccine induced immunity to FMD. In Foot-and-mouth disease virus. Springer Berlin Heidelberg, pp. 103-131.
Doran, R. J., & Laffan, S. W. (2005). Simulating the spatial dynamics of foot and mouth disease outbreaks in feral pigs and livestock in Queensland, Australia, using a susceptible-infected-recovered cellular automata model. Preventive Veterinary Medicine, 70(1-2), pp. 133–152. [doi:10.1016/j.prevetmed.2005.03.002]
Eubank, S., Guclu, H., Kumar, V. S. A., Marathe, M. V, Srinivasan, A., Toroczkai, Z., & Wang, N. (2004). Modelling disease outbreaks in realistic urban social networks. Nature, 429(6988), pp. 180–184.
Ferguson, N. M., Donnelly, C. A., & Anderson, R. M. (2001). The foot-and-mouth epidemic in Great Britain: pattern of spread and impact of interventions. Science, 292(5519), pp. 1155-1160. [doi:10.1126/science.1061020]
Fèvre, E. M., Bronsvoort, B. M. D. C., Hamilton, K. a., & Cleaveland, S. (2006). Animal movements and the spread of infectious diseases. Trends in Microbiology, 14(3), pp. 125–131.
Kao, R. R., & Kiss, I. Z. (2010). Network Concepts and Epidemiological Models. Statistical and Evolutionary Analysis of Biological Networks, 85.
Kao, R. R. (2003). The impact of local heterogeneity on alternative control strategies for foot-and-mouth disease. Proceedings. Biological Sciences / The Royal Society, 270(1533), pp. 2557–2564.
Keeling, M. J., & Rohani, P. (2008). Modeling infectious diseases in humans and animals. Princeton University Press.
Keeling, M. J., Danon, L., Vernon, M. C., & House, T. A. (2010). Individual identity and movement networks for disease metapopulations. Proceedings of the National Academy of Sciences of the United States of America, 107(19), pp. 8866–8870.
Keeling, M. J., Woolhouse, M. E., Shaw, D. J., Matthews, L., Chase-Topping, M., Haydon, D. T., Cornell, S. J., Kappey, J., Wilesmith, J., & Grenfell, B. T. (2001). Dynamics of the 2001 UK foot and mouth epidemic: stochastic dispersal in a heterogeneous landscape. Science, 294(5543), pp. 813-817. [doi:10.1126/science.1065973]
Kiss, I. Z., Green, D. M., & Kao, R. R. (2006). Infectious disease control using contact tracing in random and scale-free networks. Journal of the Royal Society, Interface / the Royal Society, 3(6), pp. 55–62.
Knight-Jones, T. J. D., & Rushton, J. (2013). The economic impacts of foot and mouth disease–What are they, how big are they and where do they occur?. Preventive veterinary medicine, 112(3), pp. 161-173. [doi:10.1016/j.prevetmed.2013.07.013]
LeMenach, A., Legrand, J., Grais, R. F., Viboud, C., Valleron, A. J., & Flahault, A. (2005). Modeling spatial and temporal transmission of foot-and-mouth disease in France: identification of high-risk areas. Veterinary Research, 36(5-6), pp. 699-712.
Ludi, a., Ahmed, Z., Pomeroy, L. W., Pauszek, S. J., Smoliga, G. R., Moritz, M., Dickmu, S., Abdoulkadiri, S., Arzt, J., Garabed, R., & Rodriguez, L. L. (2014). Serotype diversity of foot-and-mouth-disease virus in livestock without history of vaccination in the far north region of cameroon. Transboundary and Emerging Diseases, pp. 1–12.
Luke, S., Cioffi-Revilla, C., Panait, L., & Sullivan, K. (2004). Mason: A new multi-agent simulation toolkit. Proceedings of the 2004 SwarmFest Workshop, 8(2), pp. 316–327.
Mahy, B. W. (2005). Introduction and history of foot-and-mouth disease virus. In Foot-and-Mouth Disease Virus. Springer Berlin Heidelberg, pp. 1-8. [doi:10.1007/3-540-27109-0_1]
Moritz, M., Scholte, P., Hamilton, I. M., & Kari, S. (2013). Open Access, Open Systems: Pastoral Management of Common-Pool Resources in the Chad Basin. Human Ecology, 2013(February).
Moritz, M., Soma, E., Scholte, P., Xiao, N., Taylor, L., Juran, T., & Kari, S. (2010). An Integrated Approach to Modeling Grazing Pressure in Pastoral Systems: The Case of the Logone Floodplain (Cameroon). Human Ecology, 38(6), pp. 775–789. [doi:10.1007/s10745-010-9361-z]
Orsel, K., Dekker, A., Bouma, A., Stegeman, J. A., & De Jong, M. C. M. (2005). Vaccination against foot and mouth disease reduces virus transmission in groups of calves. Vaccine, 23(41), pp. 4887-4894.
Orsel, K., De Jong, M. C. M., Bouma, A., Stegeman, J. A., & Dekker, A. (2007). The effect of vaccination on foot and mouth disease virus transmission among dairy cows. Vaccine, 25(2), 327-335. [doi:10.1016/j.vaccine.2006.07.030]
Pomeroy, L. W., Bjørnstad, O. N., Kim, H., Jumbo, S. D., Abdoulkadiri, S., & Garabed, R. (2015). Serotype-Specific Transmission and Waning Immunity of Endemic Foot-and-Mouth Disease Virus in Cameroon. PLoS ONE, 10(9), e0136642.
Riley, S. (2007). Large-scale spatial-transmission models of infectious disease. Science, 316(5829), pp. 1298–1301. [doi:10.1126/science.1134695]
Rweyemamu, M., Roeder, P., MacKay, D., Sumption, K., Brownlie, J., Leforban, Y.,Valarcher, J. F., Knowles, N. J., & Saraiva, V. (2008). Epidemiological patterns of foot-and-mouth disease worldwide. Transboundary and Emerging Diseases, 55(1), pp. 57–72.
Sanson, R. L. (1994). The epidemiology of foot-and-mouth disease: implications for New Zealand. New Zealand Veterinary Journal, 42(2), pp. 41–53. [doi:10.1080/00480169.1994.35785]
Smith, M. J., Telfer, S., Kallio, E. R., Burthe, S., Cook, A. R., Lambin, X., & Begon, M. (2009). Host-pathogen time series data in wildlife support a transmission function between density and frequency dependence. Proceedings of the National Academy of Sciences of the United States of America, 106(19), pp. 7905–7909.
Stenning, D. J. (1957). Transhumance, migratory drift, migration; patterns of pastoral Fulani nomadism. The Journal of the Royal Anthropological Institute of Great Britain and Ireland, 87(1), pp. 57-73. [doi:10.2307/2843971]
Ster, I. C., Dodd, P. J., & Ferguson, N. M. (2012). Within-farm transmission dynamics of foot and mouth disease as revealed by the 2001 epidemic in Great Britain. Epidemics, 4(3), pp. 158-169.
Tildesley, M. J., Deardon, R., Savill, N. J., Bessell, P. R., Brooks, S. P., Woolhouse, M. E. J., Grenfell, B. T., & Keeling, M. J. (2008). Accuracy of models for the 2001 foot-and-mouth epidemic. Proceedings. Biological Sciences / The Royal Society, 275(1641), pp. 1459–1468. [doi:10.1098/rspb.2008.0006]
Turner, M. D., McPeak, J. G., & Ayantunde, A. (2014). The Role of Livestock Mobility in the Livelihood Strategies of Rural Peoples in Semi-Arid West Africa. Human Ecology, 42(2), pp. 231–247.
Vosloo, W., Bastos, a D. S., Sangare, O., Hargreaves, S. K., & Thomson, G. R. (2002). Review of the status and control of foot and mouth disease in sub-Saharan Africa. Revue Scientifique et Technique (International Office of Epizootics), 21(3), pp. 437–449.
Wint, W., & Robinson, R. (2007). Gridded Livestock of the World. Food and Agriculture Organisation of the United Nations, Animal Production and Health Division, Rome.
Xiao, N., Cai, S., Moritz, M., Garabed, R., & Pomeroy, L. W. (2015). Spatial and Temporal Characteristics of Pastoral Mobility in the Far North Region, Cameroon: Data Analysis and Modeling. PLoS ONE, 10(7), e0131697. [doi:10.1371/journal.pone.0131697]